Competitive Relationship between Flood Control and Power Generation with Flood Season Division: A Case Study in Downstream Jinsha River Cascade Reservoirs

 ,
,
Abstract
:1. Introduction
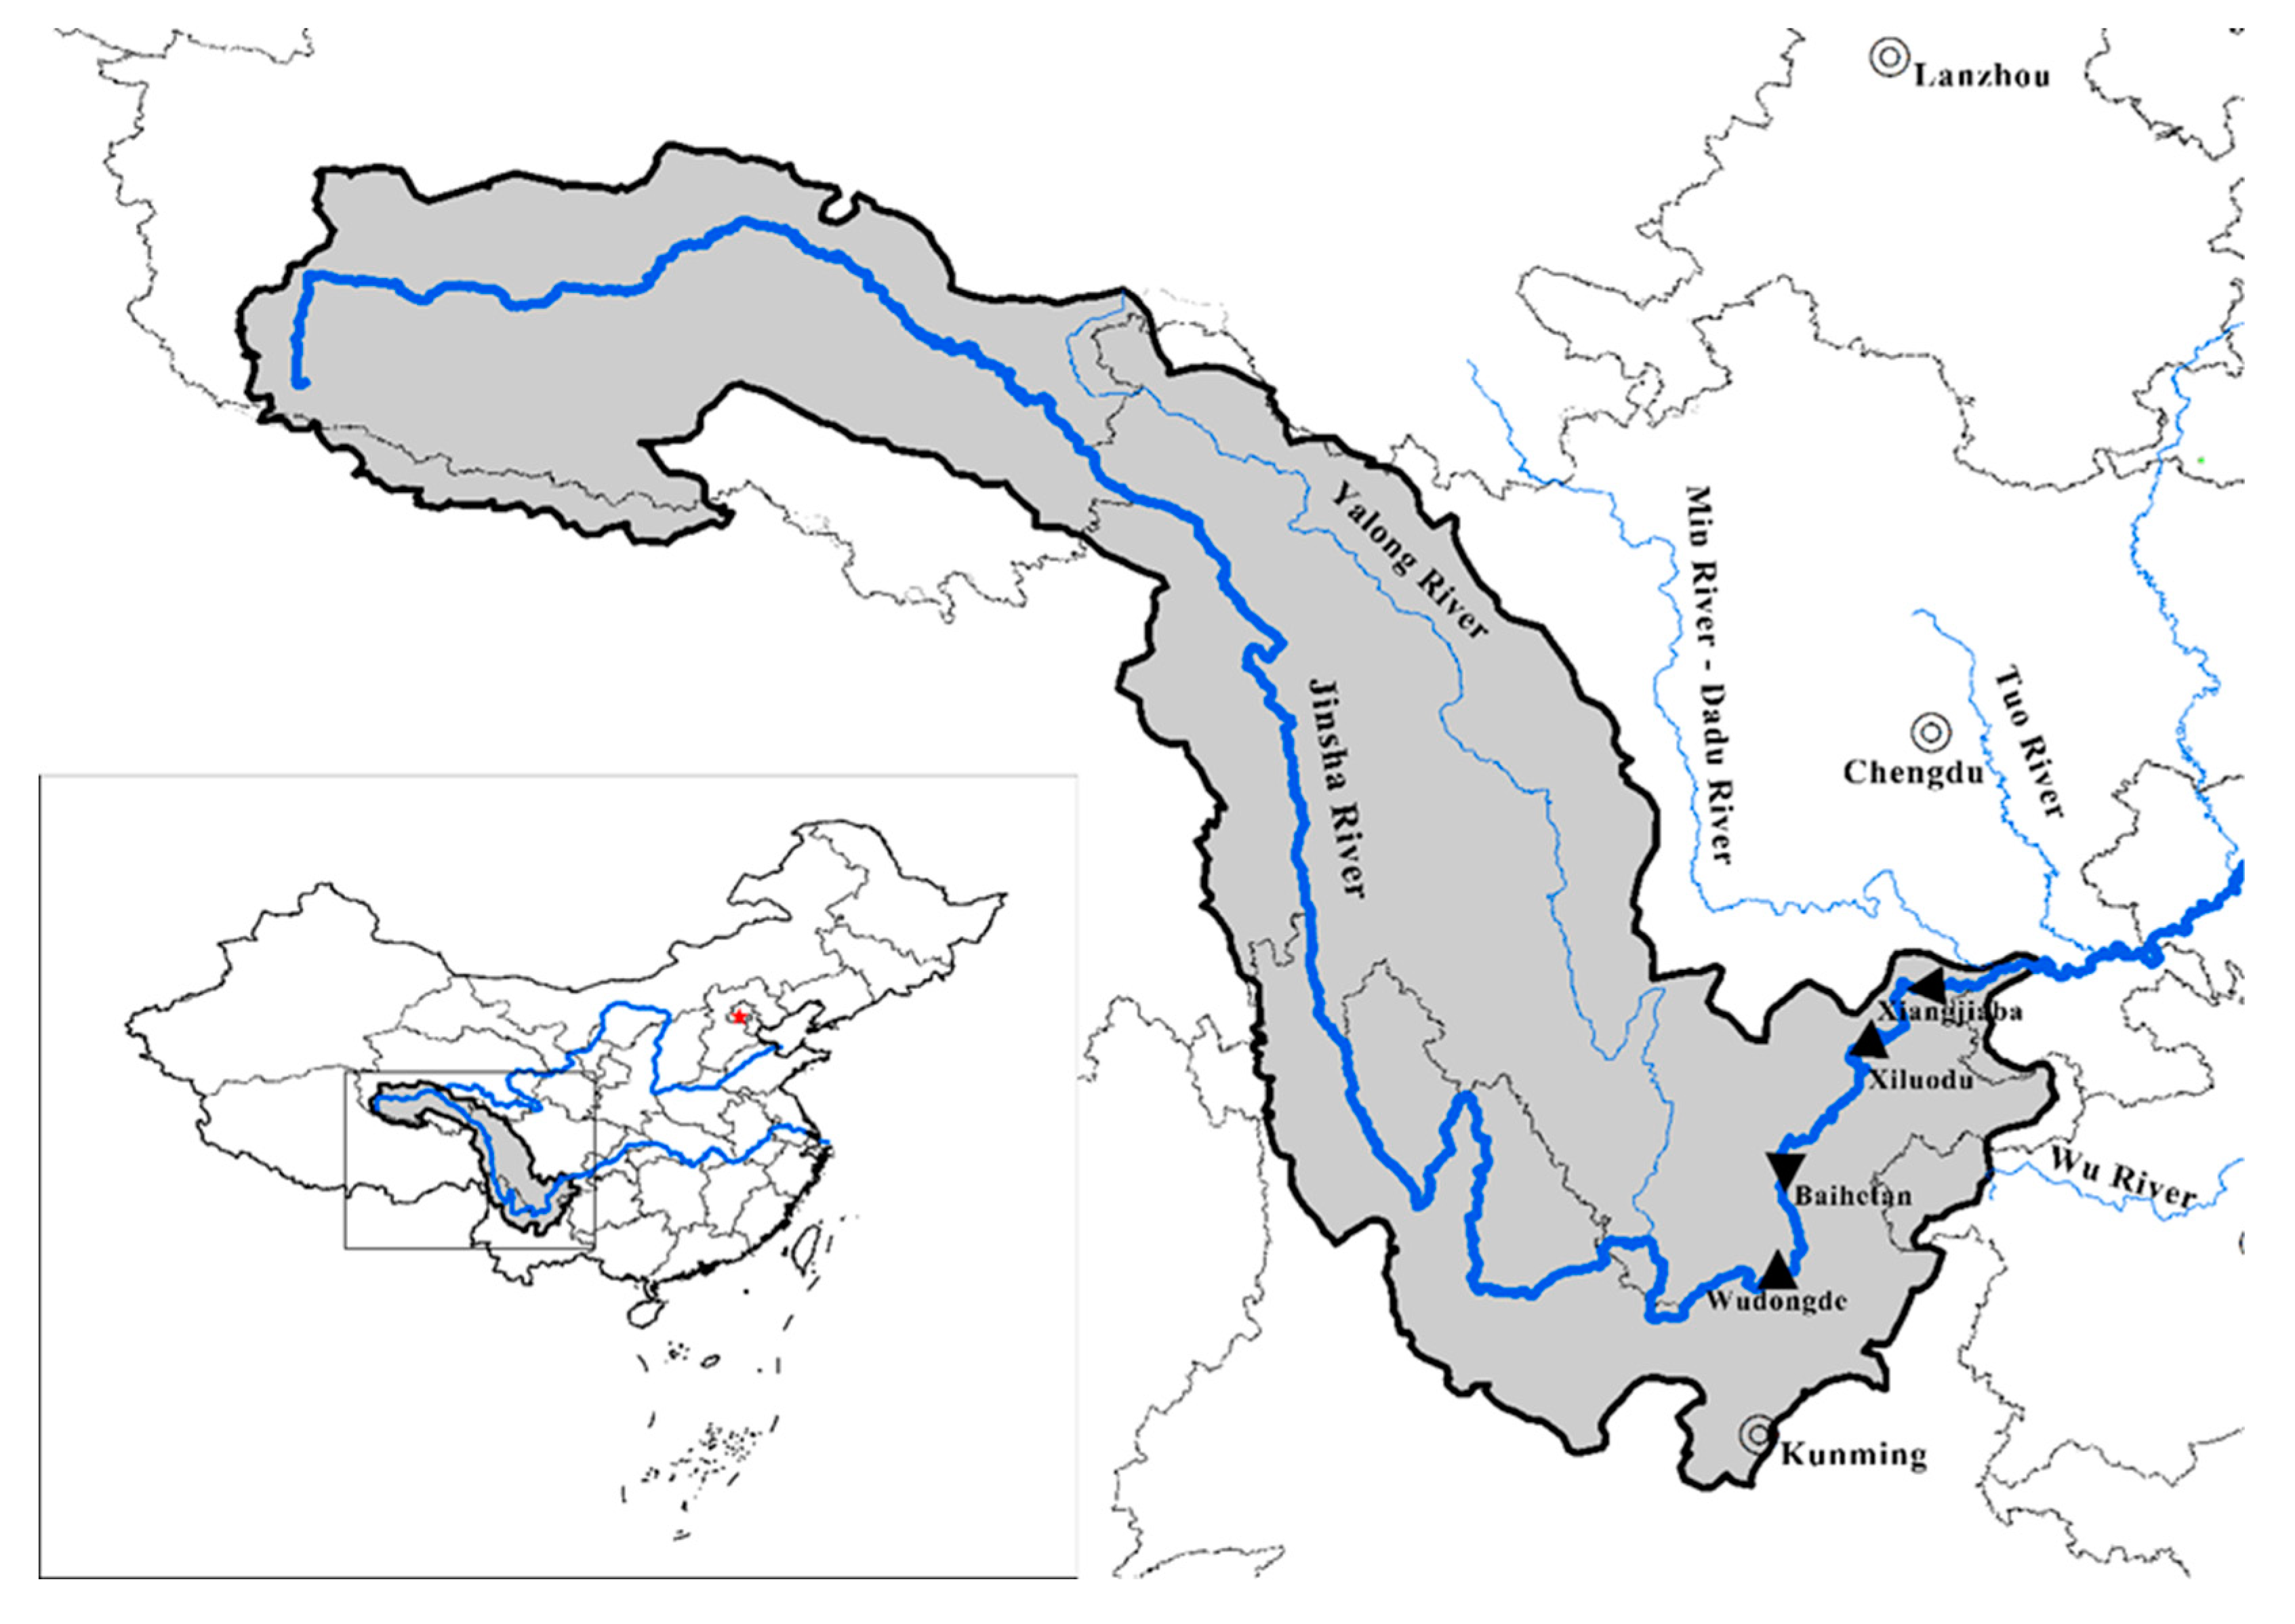
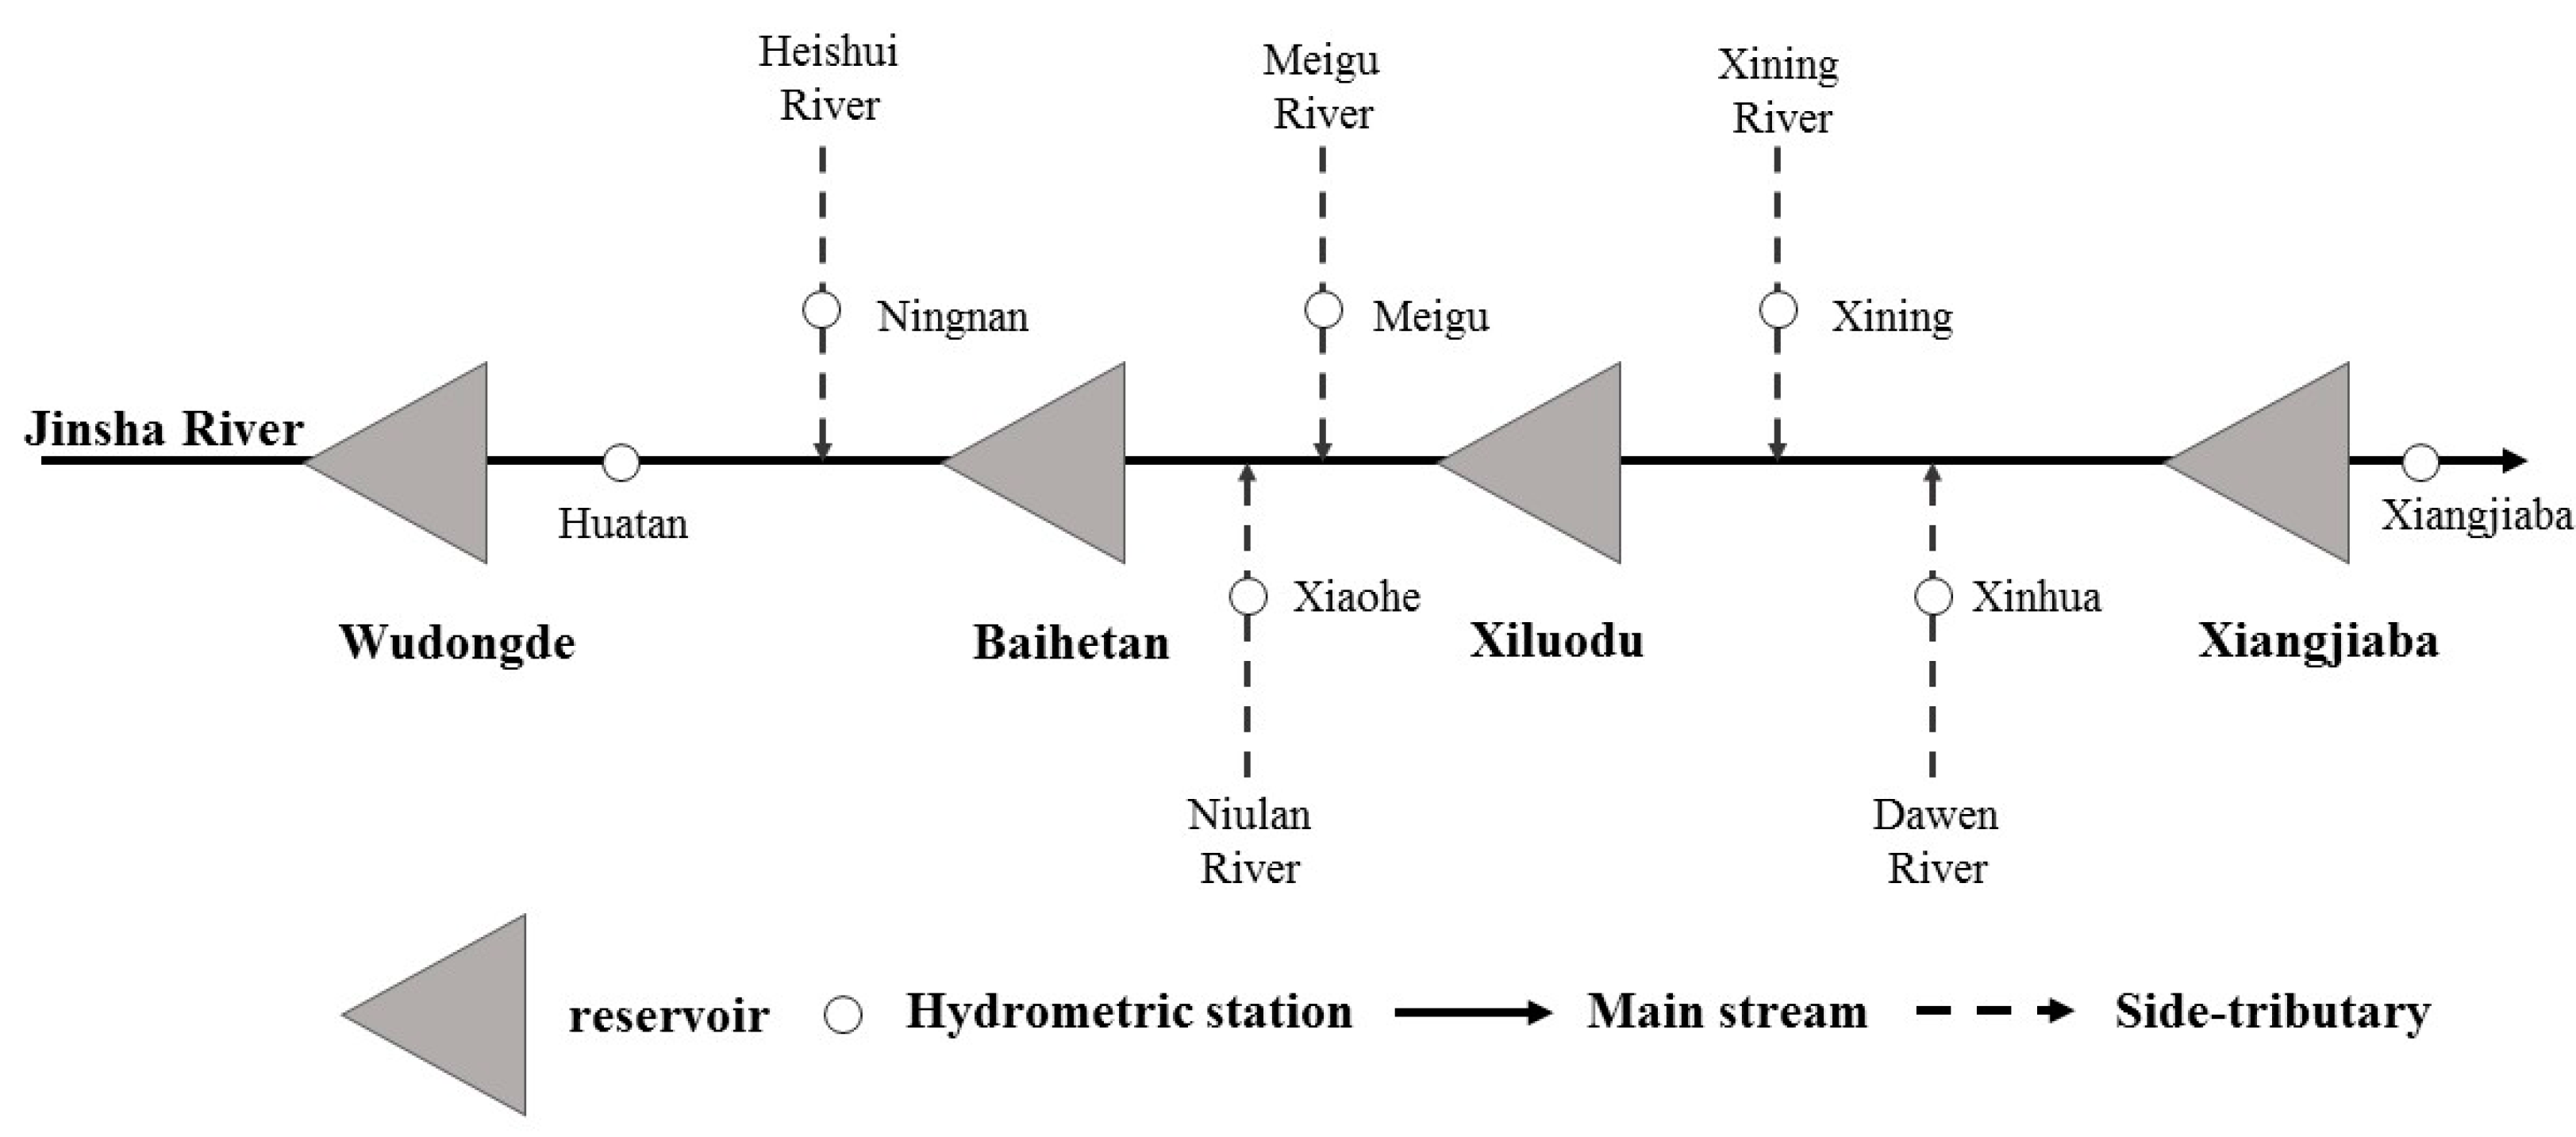
2. Study Area
3. The Joint Optimal Operation Model of Reservoir Model
3.1. Model Construction
3.1.1. Objective Function
3.1.2. Constraints
3.2. Input
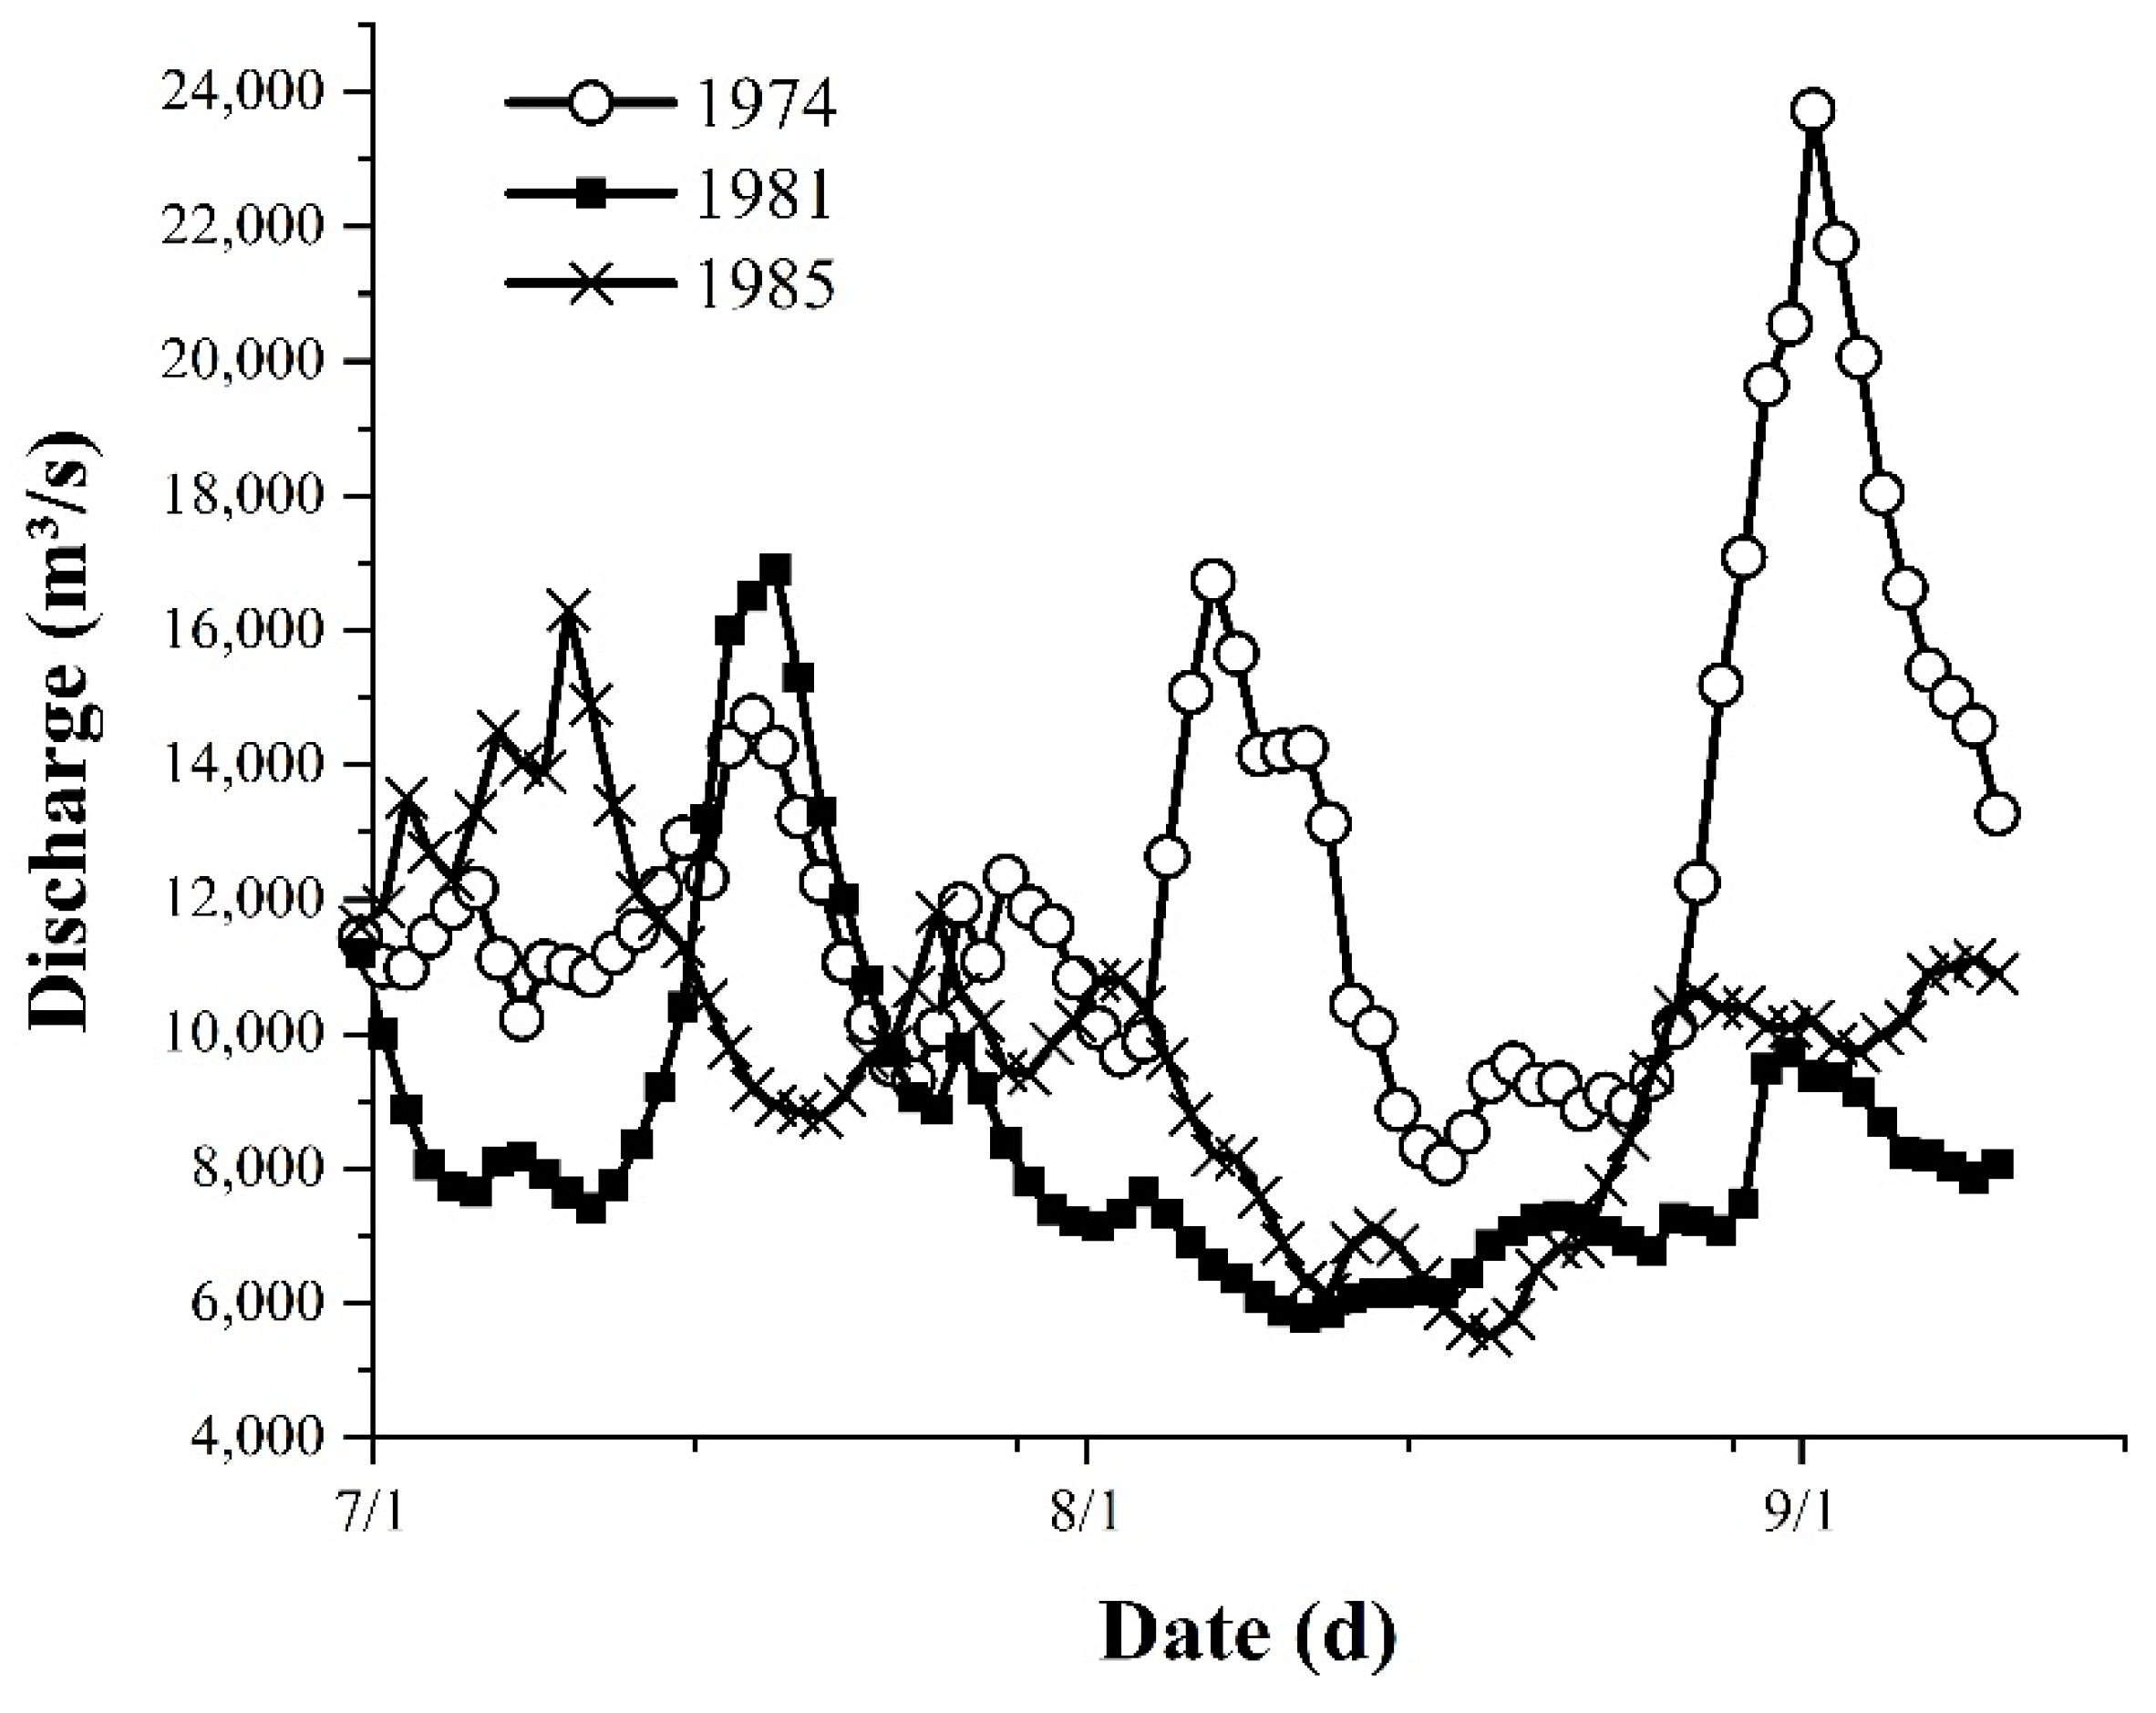
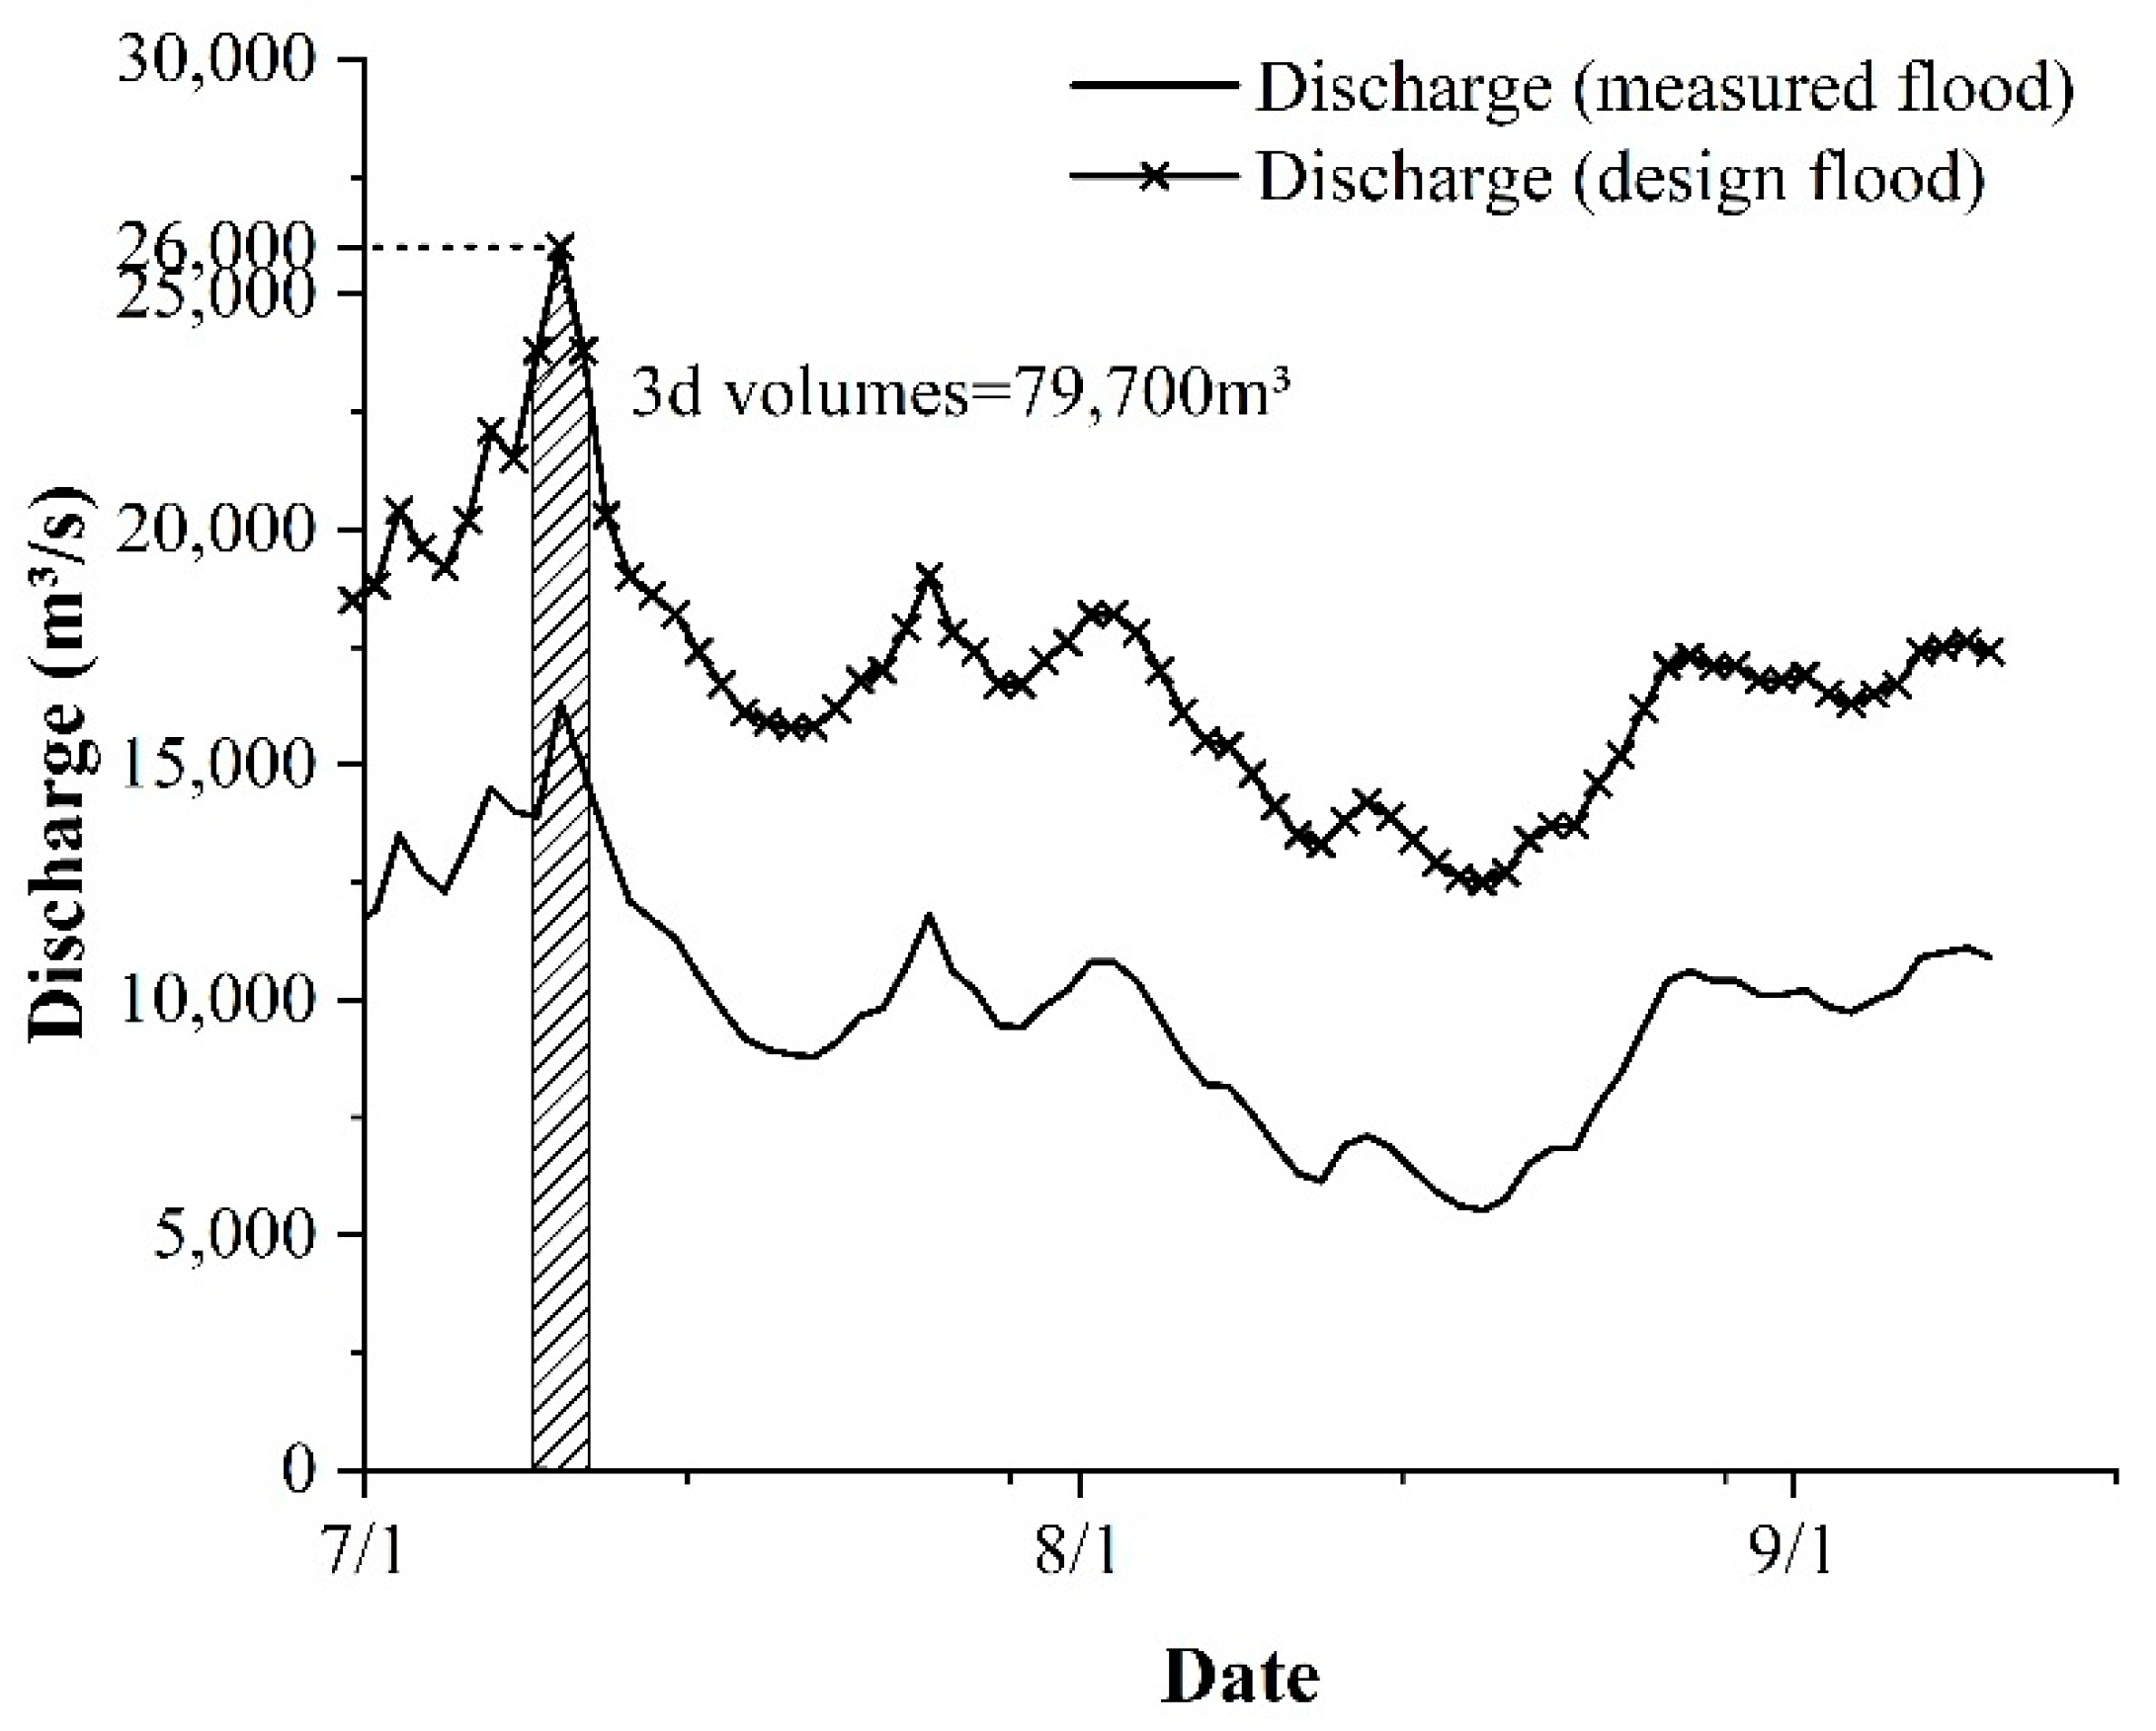
3.2.1. Measured Flood
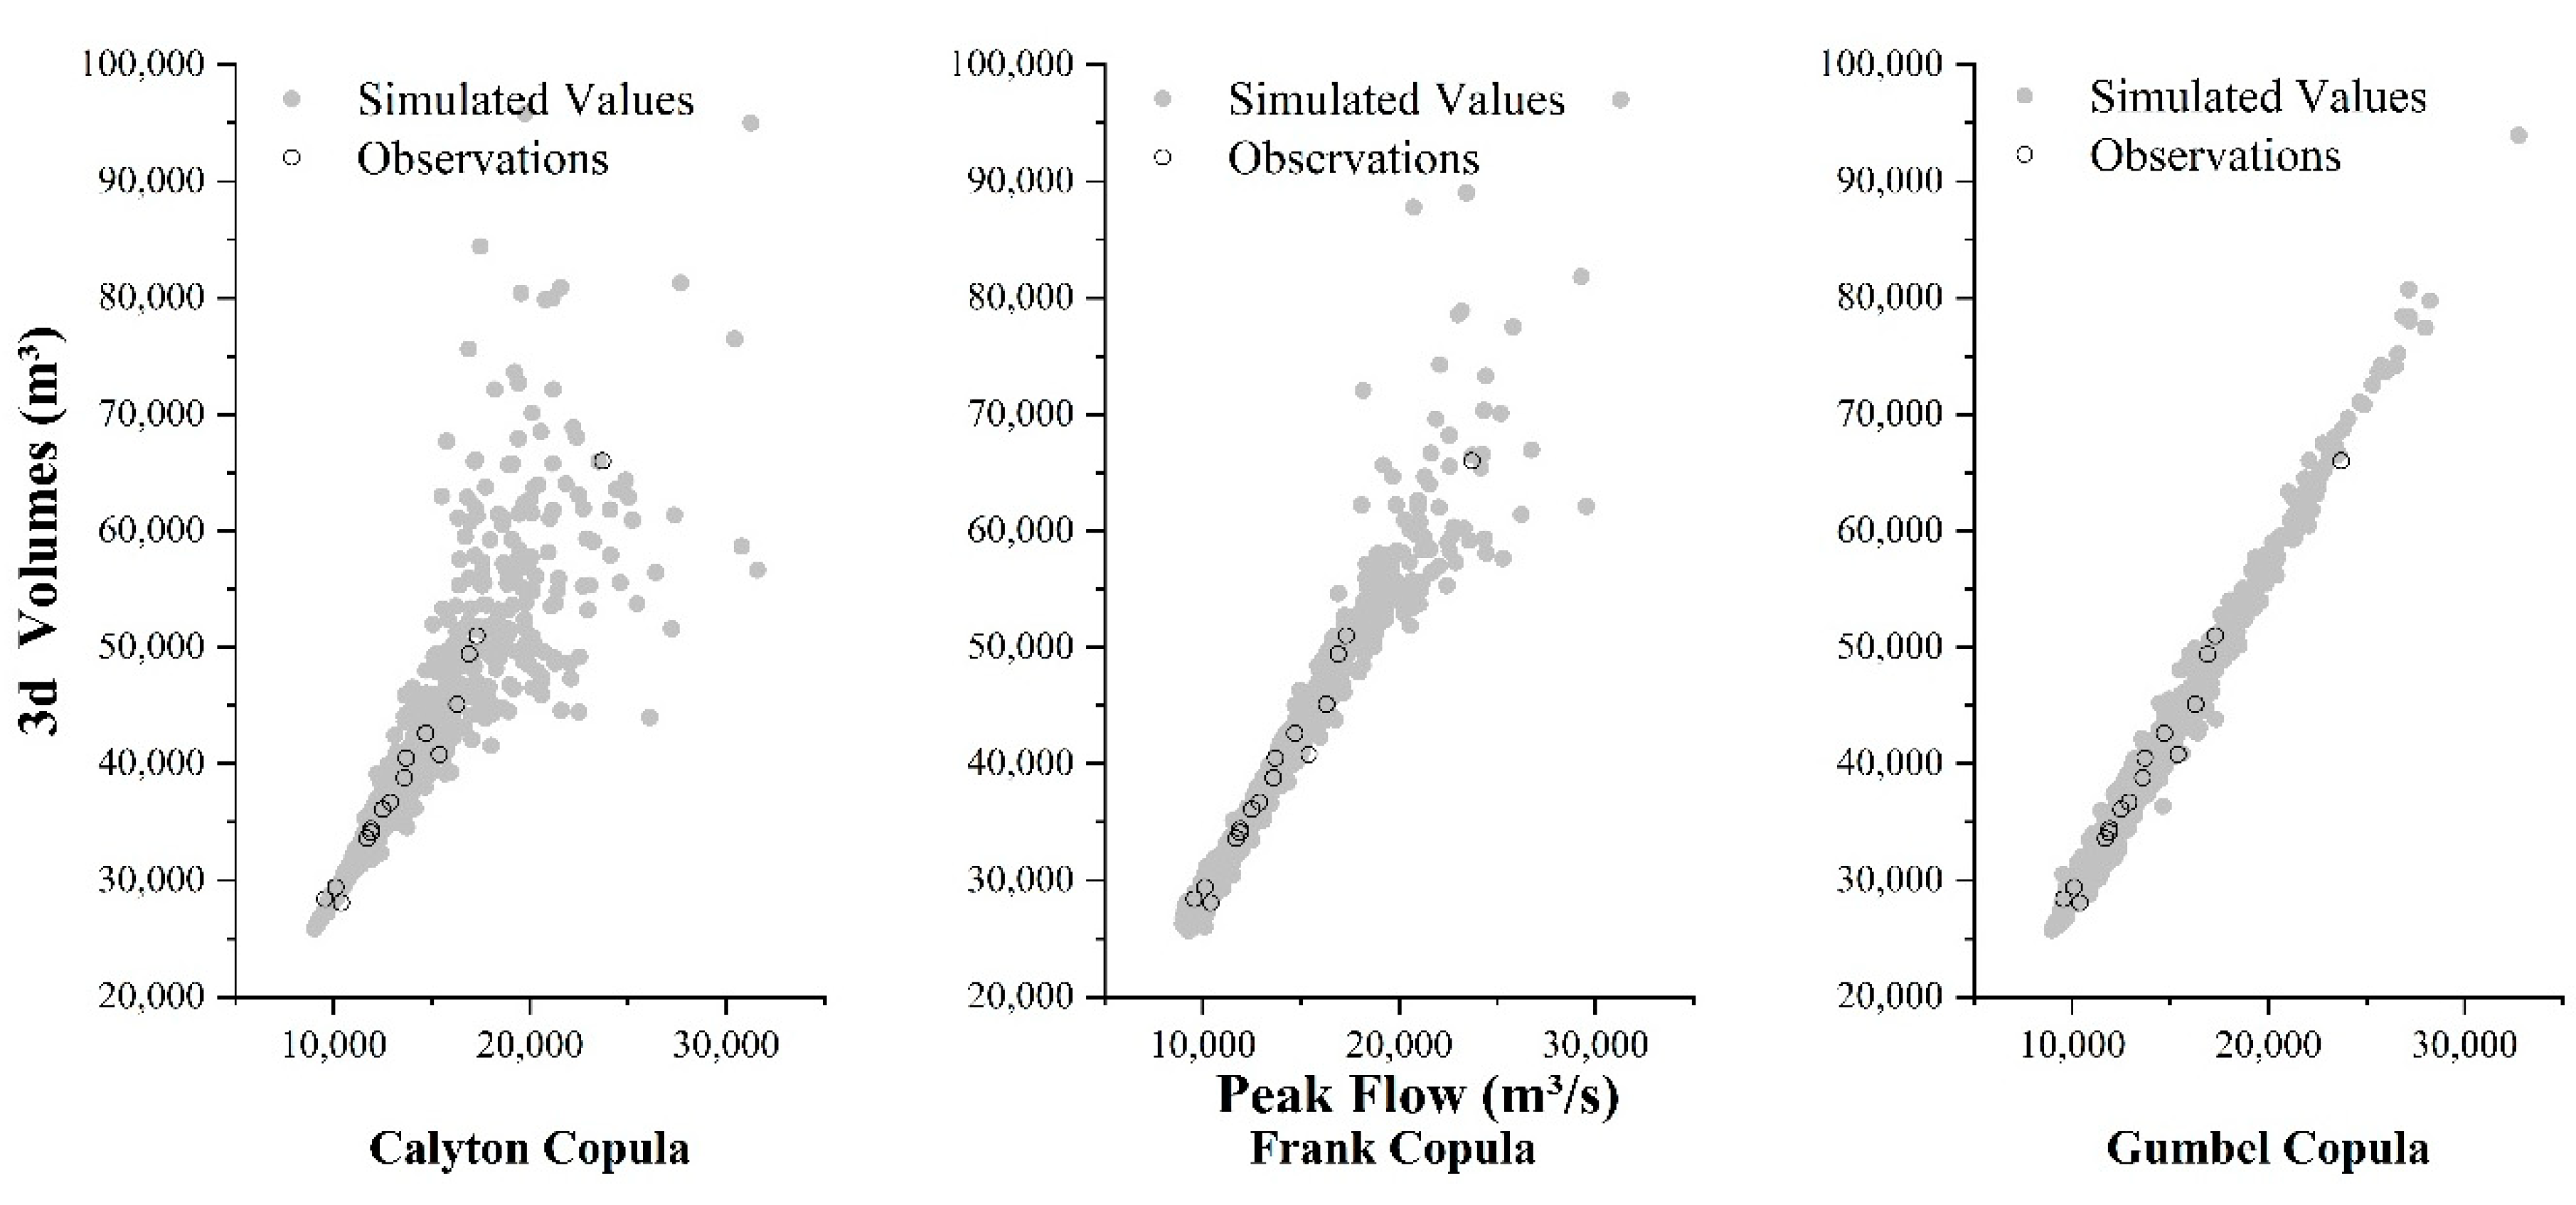
3.2.2. Design Flood
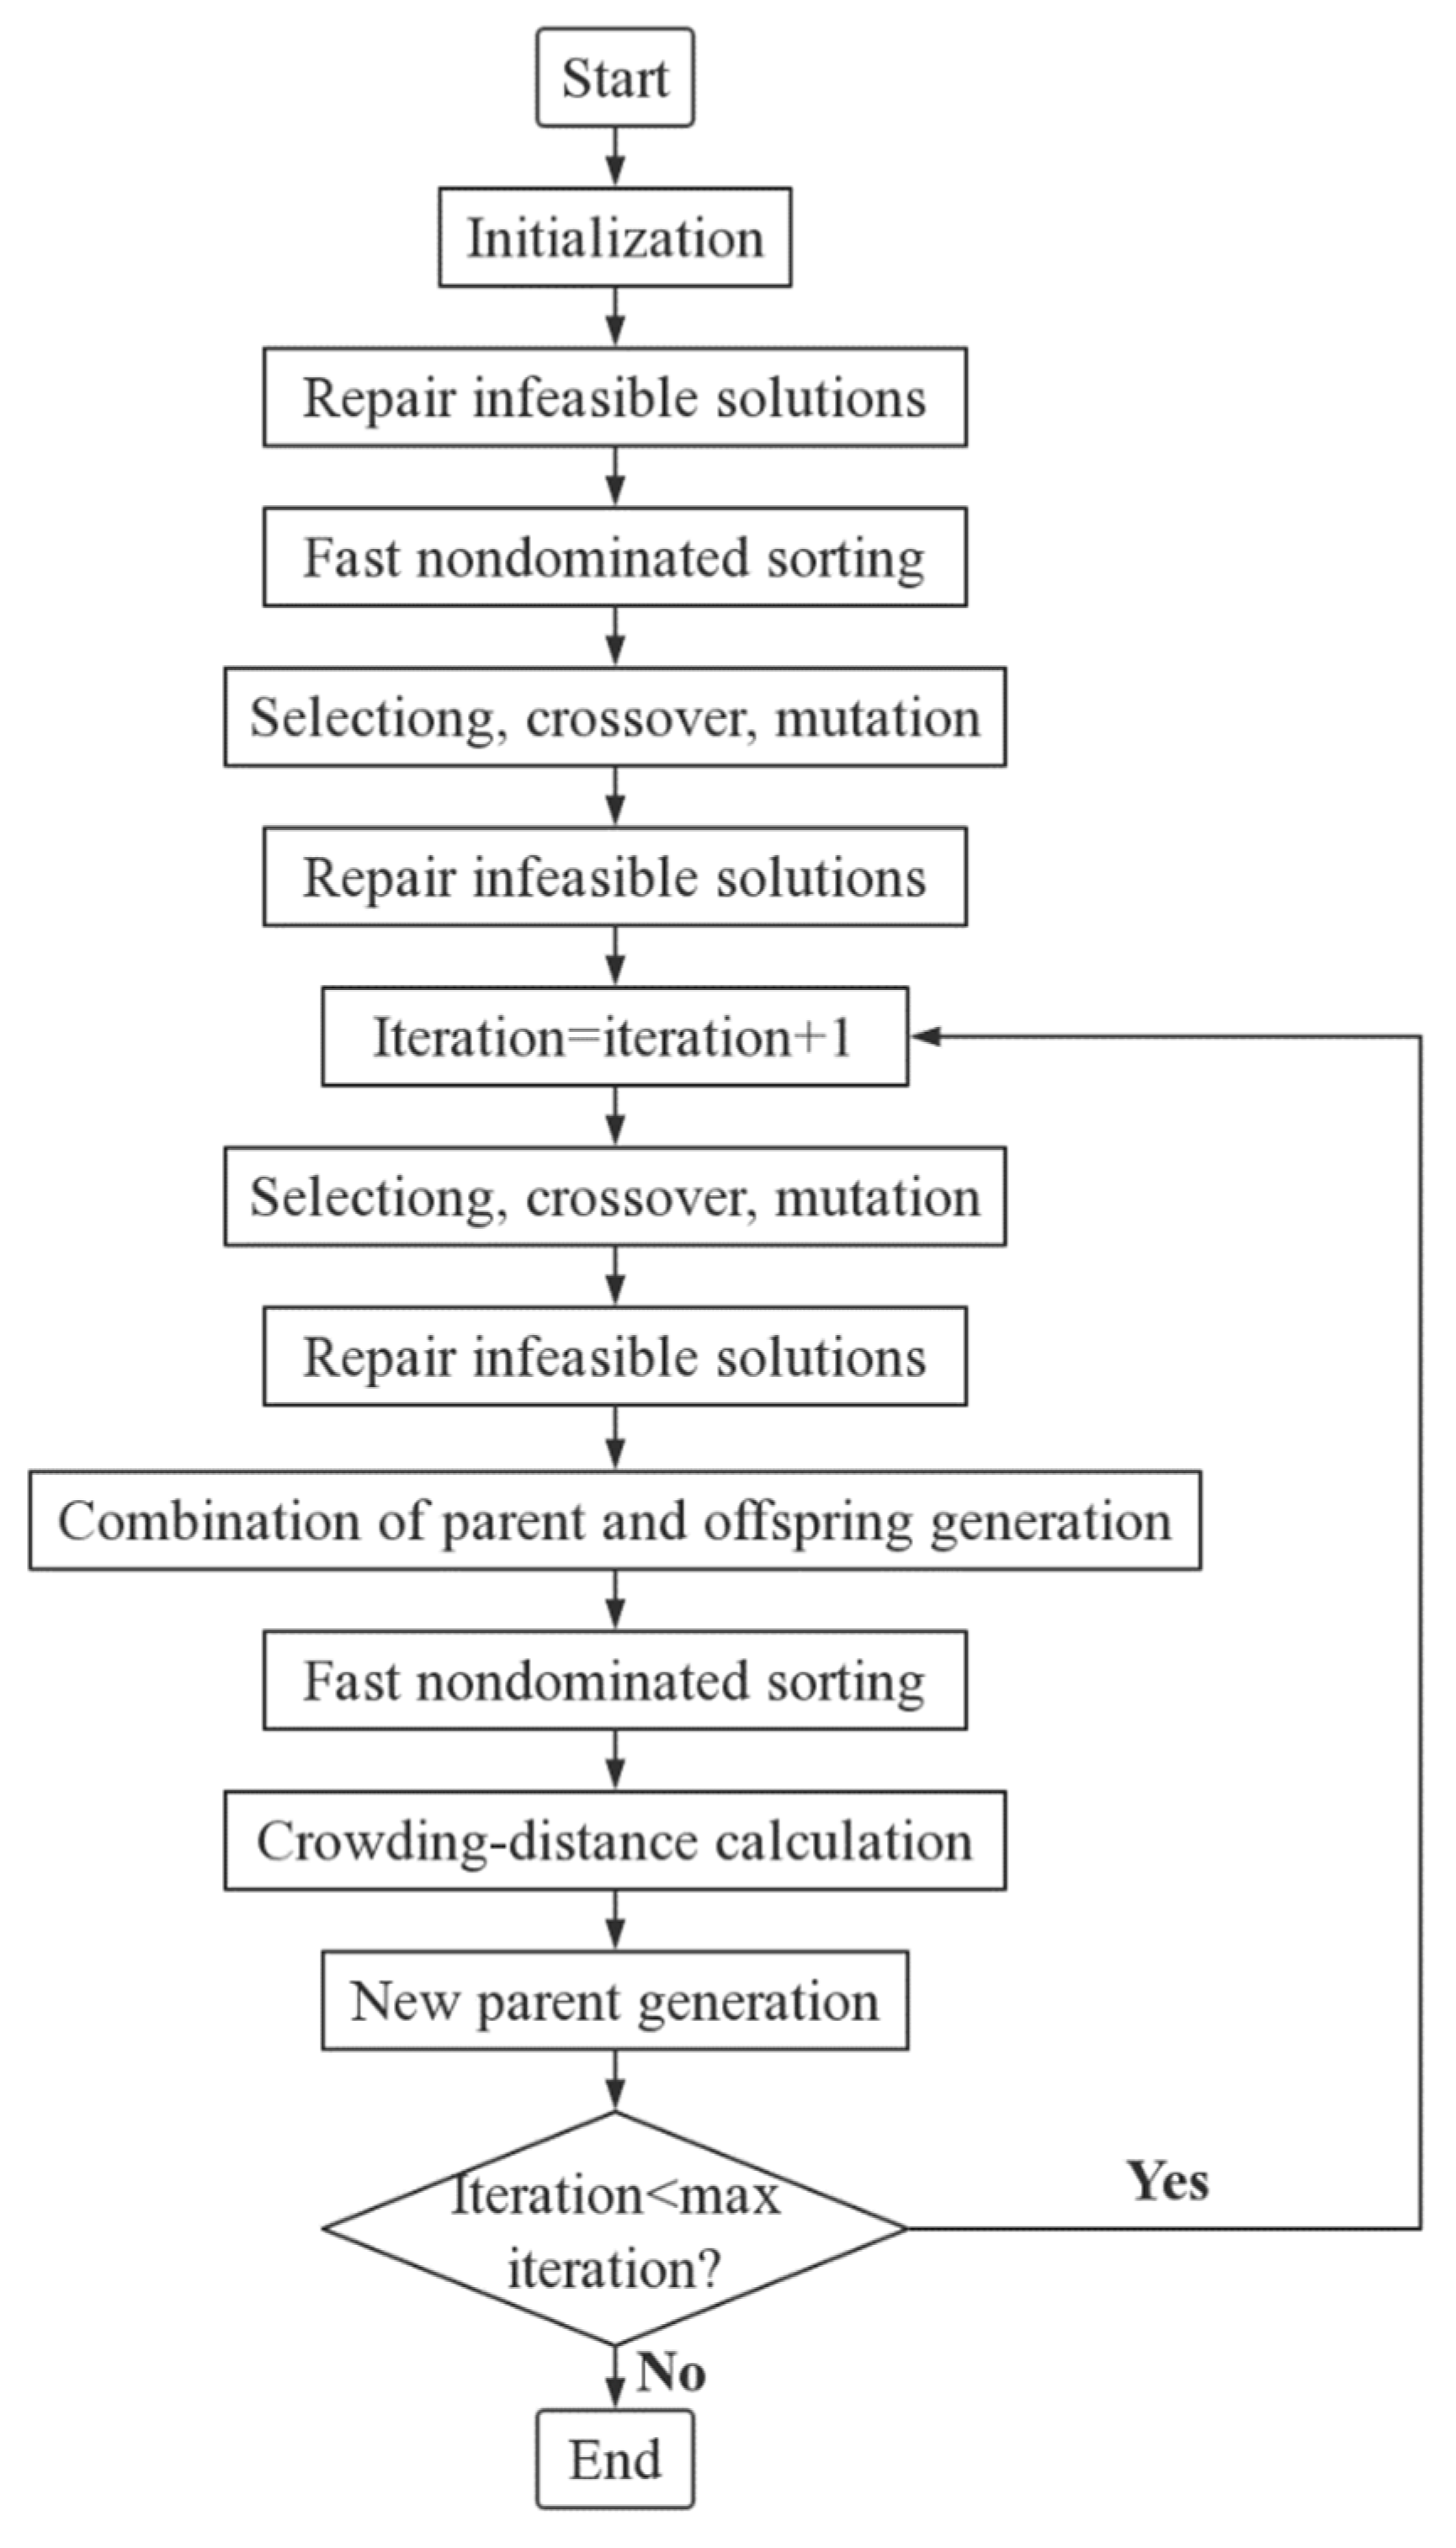
3.3. Model Solution
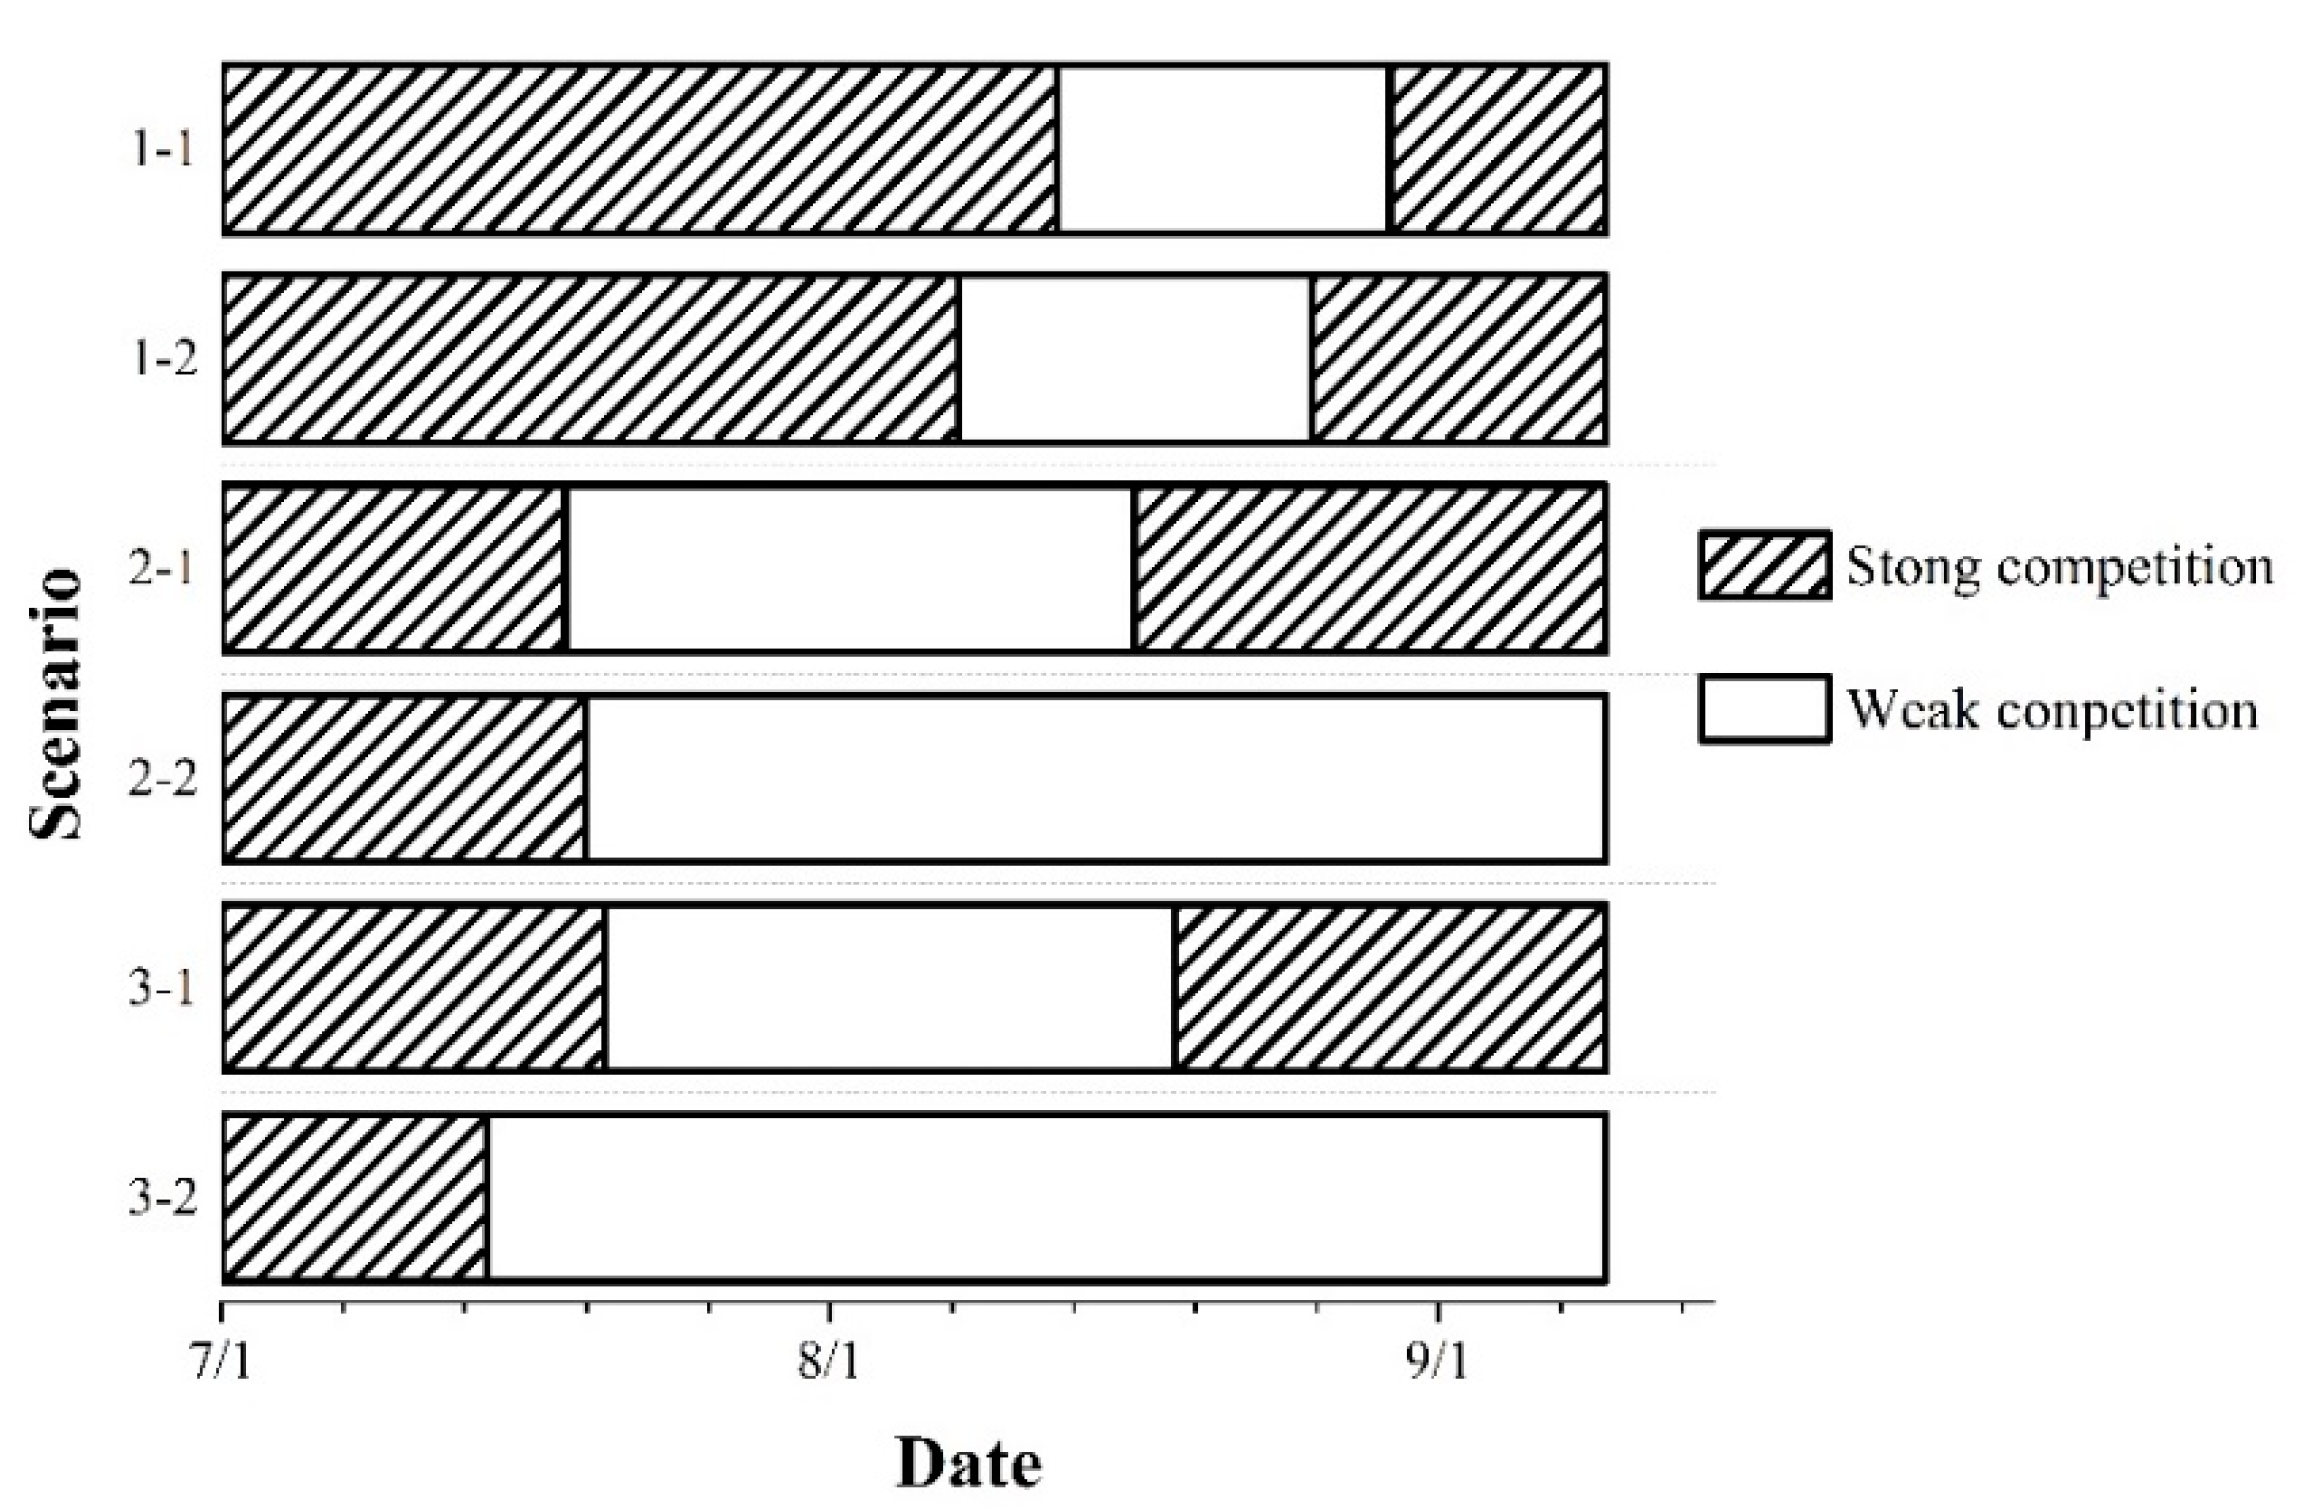
3.4. Discrimination of Competitive Relations
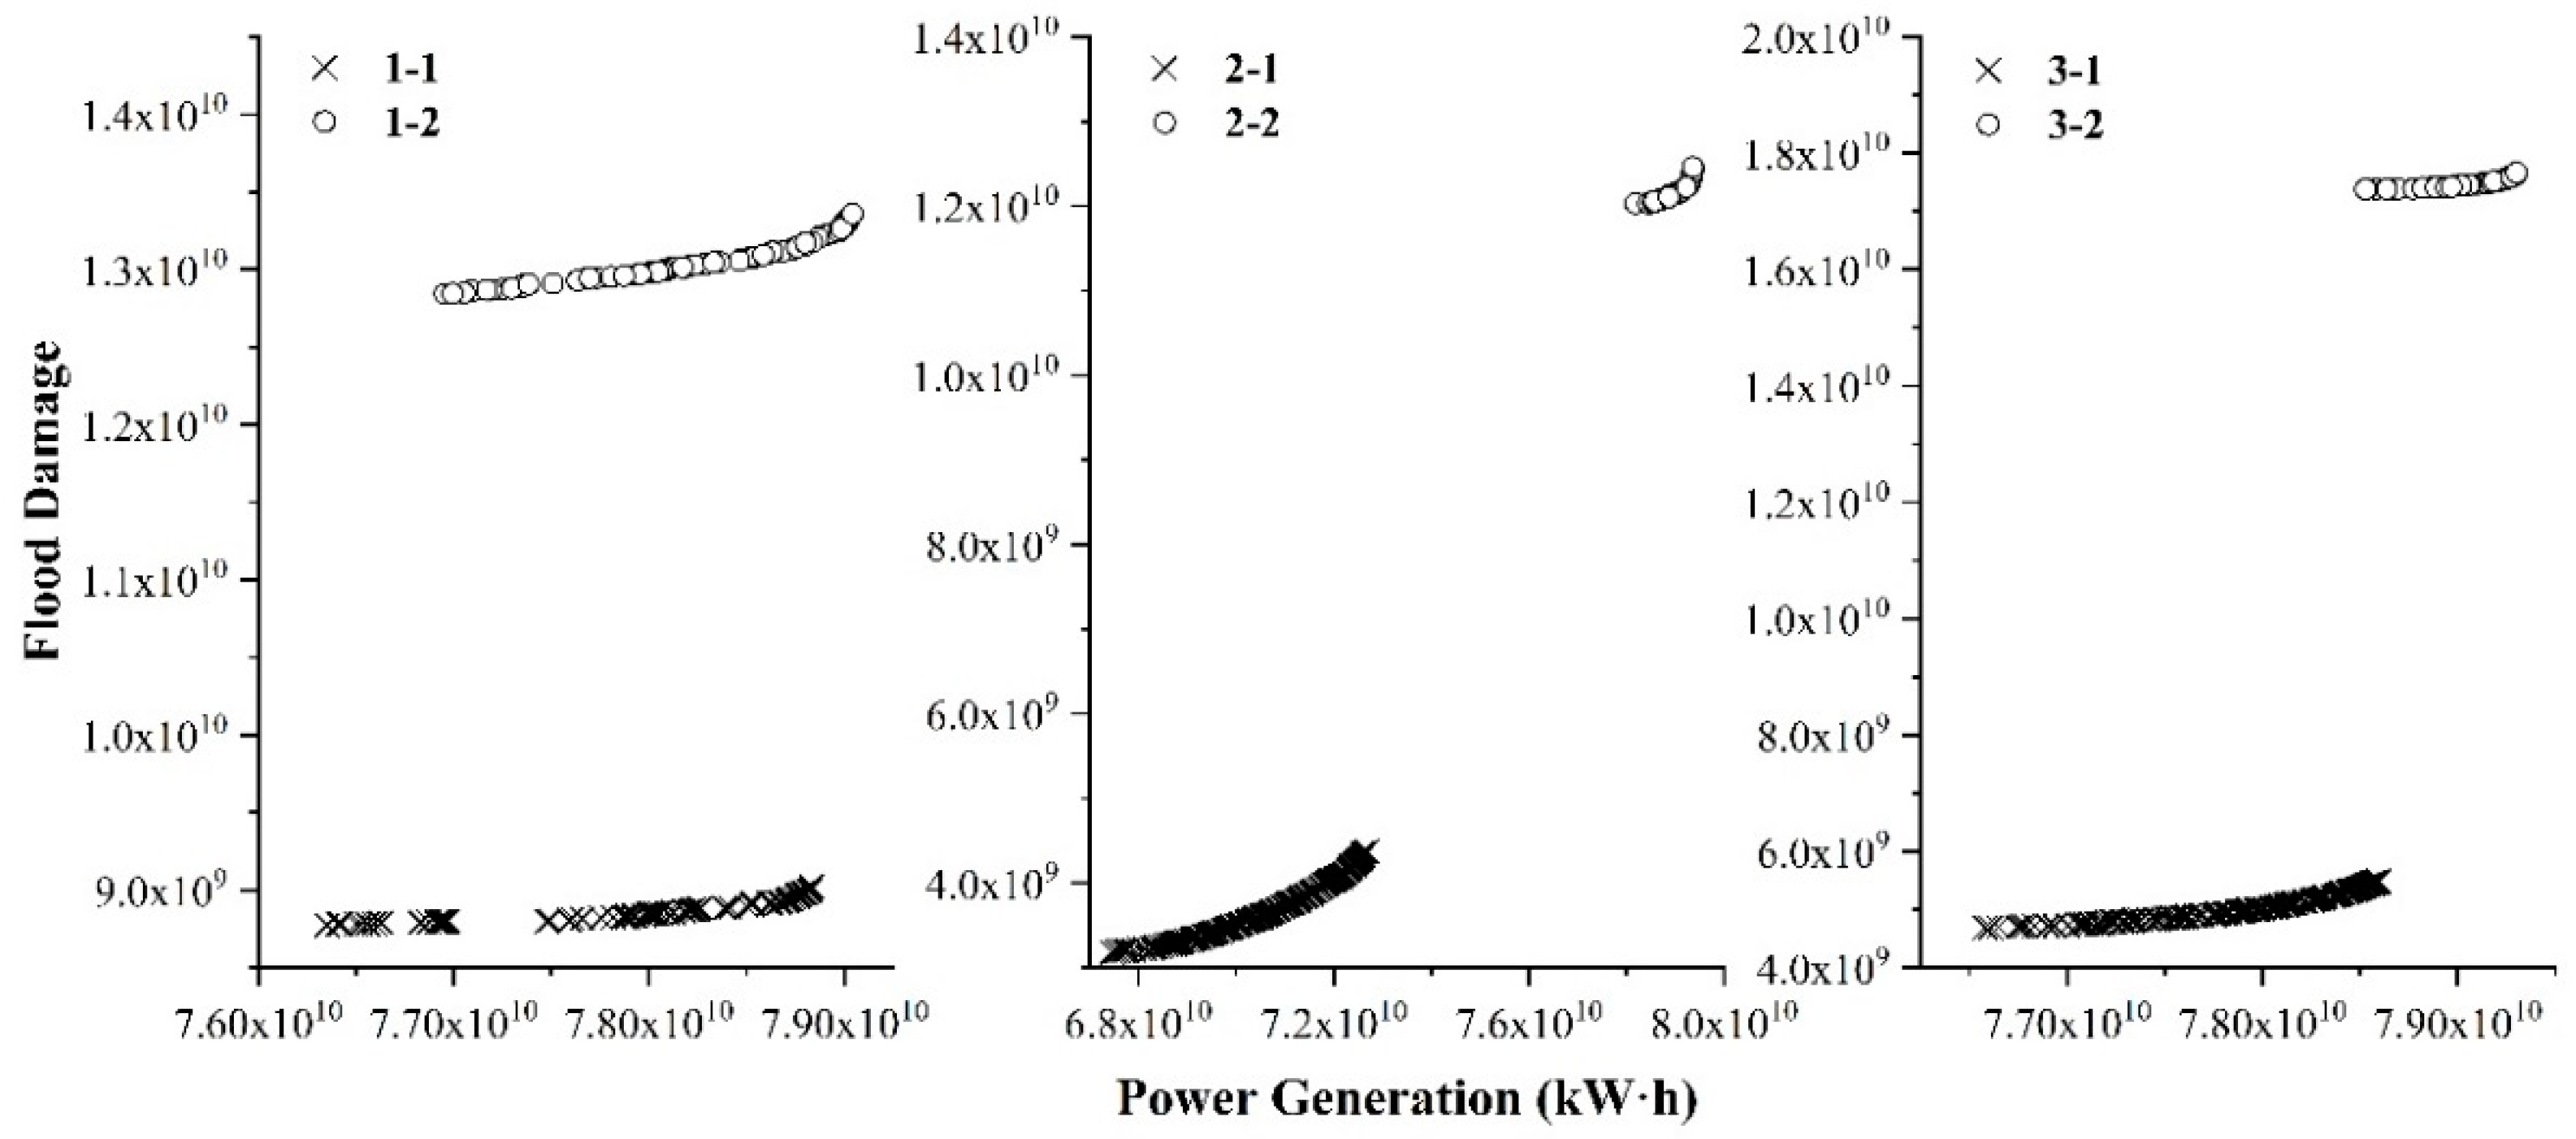
4. Results
5. Discussion
6. Conclusions
Author Contributions
Funding
Conflicts of Interest
References
- Cutter, S.L.; Ismail-Zadeh, A.; Alcántara-Ayala, I.; Altan, O.; Baker, D.N.; Briceño, S.; Gupta, H.; Holloway, O.; Johnston, D.; McBean, G.A.; et al. Global risks: Pool knowledge to stem losses from disasters. Nature 2015, 522, 277–279. [Google Scholar] [CrossRef] [PubMed]
- Kumar, D.N.; Baliarsingh, F.; Raju, K.S. Optimal Reservoir Operation for Flood Control Using Folded Dynamic Programming. Water Resour. Manag. 2010, 24, 1045–1064. [Google Scholar] [CrossRef]
- Needham, J.T.; Watkins, D.W.; Lund, J.R.; Nanda, S.K. Linear Programming for Flood Control on the Iowa and Des Moines Rivers. J. Water Resour. Plan. Manag. 2000, 126, 118–127. [Google Scholar] [CrossRef]
- Xiang, L.; Guo, S.L.; Liu, P.; Chen, G.Y. Dynamic control of flood limited water level for reservoir operation by considering inflow uncertainty. J. Hydrol. 2010, 391, 124–132. [Google Scholar] [CrossRef]
- Hossain, M.S.; EI-shafile, A. Intelligent Systems in Optimizing Reservoir Operation Policy: A Review. Water Resour. Manag. 2013, 27, 3387–3407. [Google Scholar] [CrossRef]
- Huang, L.; Li, X.; Fang, H.W.; Yin, D.Q.; Si, Y.; Wei, J.H.; Liu, J.H.; Hu, X.Y.; Zhang, L. Balancing social, economic and ecological benefits of reservoir operation during the flood season: A case study of the Three Gorges Project, China. J. Hydrol. 2019, 572, 422–434. [Google Scholar] [CrossRef]
- Braga, B.; Barbosa, P.S.F. Multiobjective real-time reservoir operation with a network flow algorithm. Jawra J. Am. Water Resour. Assoc. 2001, 37, 837–852. [Google Scholar] [CrossRef]
- Hojjati, A.; Monadi, M.; Faridhosseini, A.; Mohammadi, M. Application and comparison of NSGA-II and MOPSO in multi-objective optimization of water resources systems. J. Hydrol. Hydromech. 2018, 66, 323–329. [Google Scholar] [CrossRef]
- Ngo, L.L.; Madsen, H.; Rosbjerg, D. Simulation and optimisation modelling approach for operation of the Hoa Binh reservoir, Vietnam. J. Hydrol. 2007, 336, 269–281. [Google Scholar] [CrossRef]
- Liu, Y.Q.; Qin, H.; Mo, L.; Wang, Y.Q.; Chen, D.; Pang, S.S.; Yin, X.L. Hierarchical Flood Operation Rules Optimization Using Multi-Objective Cultured Evolutionary Algorithm Based on Decomposition. Water Resour. Manag. 2019, 33, 337–354. [Google Scholar] [CrossRef]
- Zhou, J.Z.; Li, C.L.; Chen, F.; Zhang, Y.Z. Integrated utilization of the Three Gorges Cascade for navigation and power generation in flood season. J. Hydraul. Eng. 2017, 48, 31–40. (In Chinese) [Google Scholar]
- Xu, B.; Zhong, P.A.; Chen, Y.T.; Zhao, Y.F. The multi-objective and joint operation of Xiluodu cascade and Three Gorges cascade reservoirs system. Sci. Sin. 2017, 47, 823–831. (In Chinese) [Google Scholar]
- Sun, X.M.; Luo, J.G.; Xie, J.C. Multi-Objective Optimization for Reservoir Operation Considering Water Diversion and Power Generation Objectives. Water 2018, 10, 1540. [Google Scholar] [CrossRef]
- Zhou, Y.L.; Guo, S.L.; Chang, F.J.; Liu, P.; Chen, A.B. Methodology that improves water utilization and hydropower generation without increasing flood risk in mega cascade reservoirs. Energy 2018, 143, 785–796. [Google Scholar] [CrossRef]
- Raupp, I.; Costa, F.; Damázio, J. Minimization of the conflict between electric power generation and flood control of the Brazilian reservoirs operation planning. River Basin Manag. 2009, 124, 149–160. [Google Scholar] [CrossRef]
- Chang, L.C. Guiding rational reservoir flood operation using penalty-type genetic algorithm. J. Hydrol. 2008, 354, 65–74. [Google Scholar] [CrossRef]
- Meng, X.J.; Chang, J.X.; Wang, X.B.; Wang, Y.M. Multi-objective hydropower station operation using an improved cuckoo search algorithm. Energy 2019, 168, 425–439. [Google Scholar] [CrossRef]
- Huang, C.; Wang, Z.J.; Li, S.L.; Chen, S.L. A multi-reservoir operation optimization model and application in the upper Yangtze River Basin, I. Principle and solution of the model. J. Hydraul. Eng. 2012, 9, 1009–1018. (In Chinese) [Google Scholar]
- Liu, X.Y.; Guo, S.L.; Liu, P.; Chen, L.; Li, X. Deriving Optimal Refill Rules for Multi-Purpose Reservoir Operation. Water Resour. Manag. 2011, 25, 431–448. [Google Scholar] [CrossRef]
- Jiang, H.; Wang, Z.Z.; Ye, A.; Liu, K.L.; Wang, X.H.; Wang, L.H. Hydrological characteristics-based methodology for dividing flood seasons: An empirical analysis from China. Environ. Earth Sci. 2019, 78, 399–408. [Google Scholar] [CrossRef]
- Xu, B.; Yao, H.Y.; Zhong, P.A.; Chen, J.; Fu, J.S.; Guo, L.; Deng, X.L. Exploration and attribution of synergistic gains from joint optimal operation of downstream Jinsha River cascade and Three Gorges cascade reservoirs for hydropower generation. J. Hydroinformatics 2018, 116, 1042–1056. [Google Scholar] [CrossRef]
- Chang, X.L.; Liu, X.H.; Zhou, W. Hydropower in China at present and its further development. Energy 2010, 35, 4400–4406. [Google Scholar] [CrossRef]
- Zhou, C.; Sun, N.; Chen, L.; Ding, Y.; Zhou, J.Z.; Zha, G.; Luo, G.L.; Dai, L.; Yang, X. Optimal Operation of Cascade Reservoirs for Flood Control of Multiple Areas Downstream: A Case Study in the Upper Yangtze River Basin. Water 2018, 10, 1250. [Google Scholar] [CrossRef]
- Zou, Q.; Wang, X.M.; Li, A.Q.; He, X.C.; Luo, B. Optimal operation of flood control for cascade reservoirs based on Parallel Chaotic Quantum Particle Swarm Optimization. J. Hydraul. Eng. 2016, 47, 967–976. [Google Scholar] [CrossRef]
- Favre, A.C.; Adlouni, S.E.; Perreault, P. Multivariate hydrological frequency using copulas. Water Resour. Res. 2004, 40, 290–294. [Google Scholar] [CrossRef]
- Karmakar, S.; Simonovic, S.P. Bivariate flood frequency analysis. Part 2: A copula-based approach with mixed marginal distributions. J. Flood Risk Manag. 2010, 2, 32–44. [Google Scholar] [CrossRef]
- Amirataee, B.; Monstaseri, M.; Rezaie, H. Regional analysis and derivation of copula-based drought Severity-Area-Frequency curve in Lake Urmia basin, Iran. J. Environ. Manag. 2018, 206, 134–144. [Google Scholar] [CrossRef]
- Xi, Q.Y.; Xie, X.P.; Huang, Q.; Wang, Y.M.; Liu, H. Study on flood zoom model based on genetic algorithm and parallel recombination simulated annealing algorithm. J. Hydroelectr. Eng. 2006, 25, 108–113. (In Chinese) [Google Scholar]
- Deb, K.; Pratap, A.; Agarwal, S.; Meyarivan, T.A. Fast and Elitist Multiobjective Genetic Algorithm: NSGA-II. IEEE Trans. Evol. Comput. 2002, 2, 182–197. [Google Scholar] [CrossRef]
- Tabari, M.M.R.; Soltani, J. Multi-Objective Optimal Model for Conjunctive Use Management Using SGAs and NSGA-II Models. Water Resour. Manag. 2013, 27, 37–53. [Google Scholar] [CrossRef]
- Tian, Y.; Cheng, R.; Zhang, X.Y.; Jin, Y.C. PlatEMO: A MATLAB Platform for Evolutionary Multi-Objective Optimization. IEEE Comput. Intell. Mag. 2017, 12, 73–87. [Google Scholar] [CrossRef]
- Chen, T. Analysis on Decision Making; Science Press: Beijing, China, 1987. (In Chinese) [Google Scholar]
- Mann, H.B. Nonparametric Tests Against Trend. Econometrica 1945, 13, 245–259. [Google Scholar] [CrossRef]
- Kendall, M.G. Rank Correlation Methods; Oxford University Press: Oxford, UK, 1990. [Google Scholar]


| Reservoir | Lower Bound of Water Level (m) | Upper Bound of Water Level (m) | Lower Bound of Discharge (m3/s) | Upper Bound of Discharge (m3/s) | Installed Capacity (MW) | Maximum Allowable Water Discharge Variation Rate (m3/(s·d)) |
|---|---|---|---|---|---|---|
| Wudongde | 952 | 972 | 883 | 30,000 | 10,200 | 2000 |
| Baihetan | 785 | 825 | 700 | 30,000 | 16,000 | 2000 |
| Xiluodu | 560 | 600 | 1060 | 30,000 | 13,860 | 2000 |
| Xiangjiaba | 370 | 380 | 830 | 30,000 | 6000 | 2000 |
| Name | Clayton Copula | Frank Copula | Gumbel Copula |
|---|---|---|---|
| Inflow of Wudongde | 0.0620 | 0.0589 | 0.0579 |
| Interval inflow of Baihetan | 0.0825 | 0.0759 | 0.0753 |
| Interval inflow of Xiluodu | 0.0735 | 0.0678 | 0.0676 |
| Interval inflow of Xiangjiaba | 0.0848 | 0.0686 | 0.0723 |
| Name | Co-occurrence and Return Period = 100 y | |
|---|---|---|
| Peak Flow (m3/s) | 3D volumes (m3/s·d) | |
| Inflow of Wudongde | 26,000 | 73,700 |
| Interval inflow of Baihetan | 763 | 1530 |
| Interval inflow of Xiluodu | 1540 | 4550 |
| Interval inflow of Xiangjiaba | 797 | 1030 |
| Obj1 | Upward Trend | No Apparent Trend | Downward Trend | ||
|---|---|---|---|---|---|
| Competitive Relationship | |||||
| Obj2 | |||||
| Upward trend | strong | weak | no | ||
| No apparent trend | weak | weak | weak | ||
| Downward trend | no | weak | strong | ||
| Scenario | ||
|---|---|---|
| 1-1 | ||
| 1-2 | ||
| 2-1 | ||
| 2-2 | ||
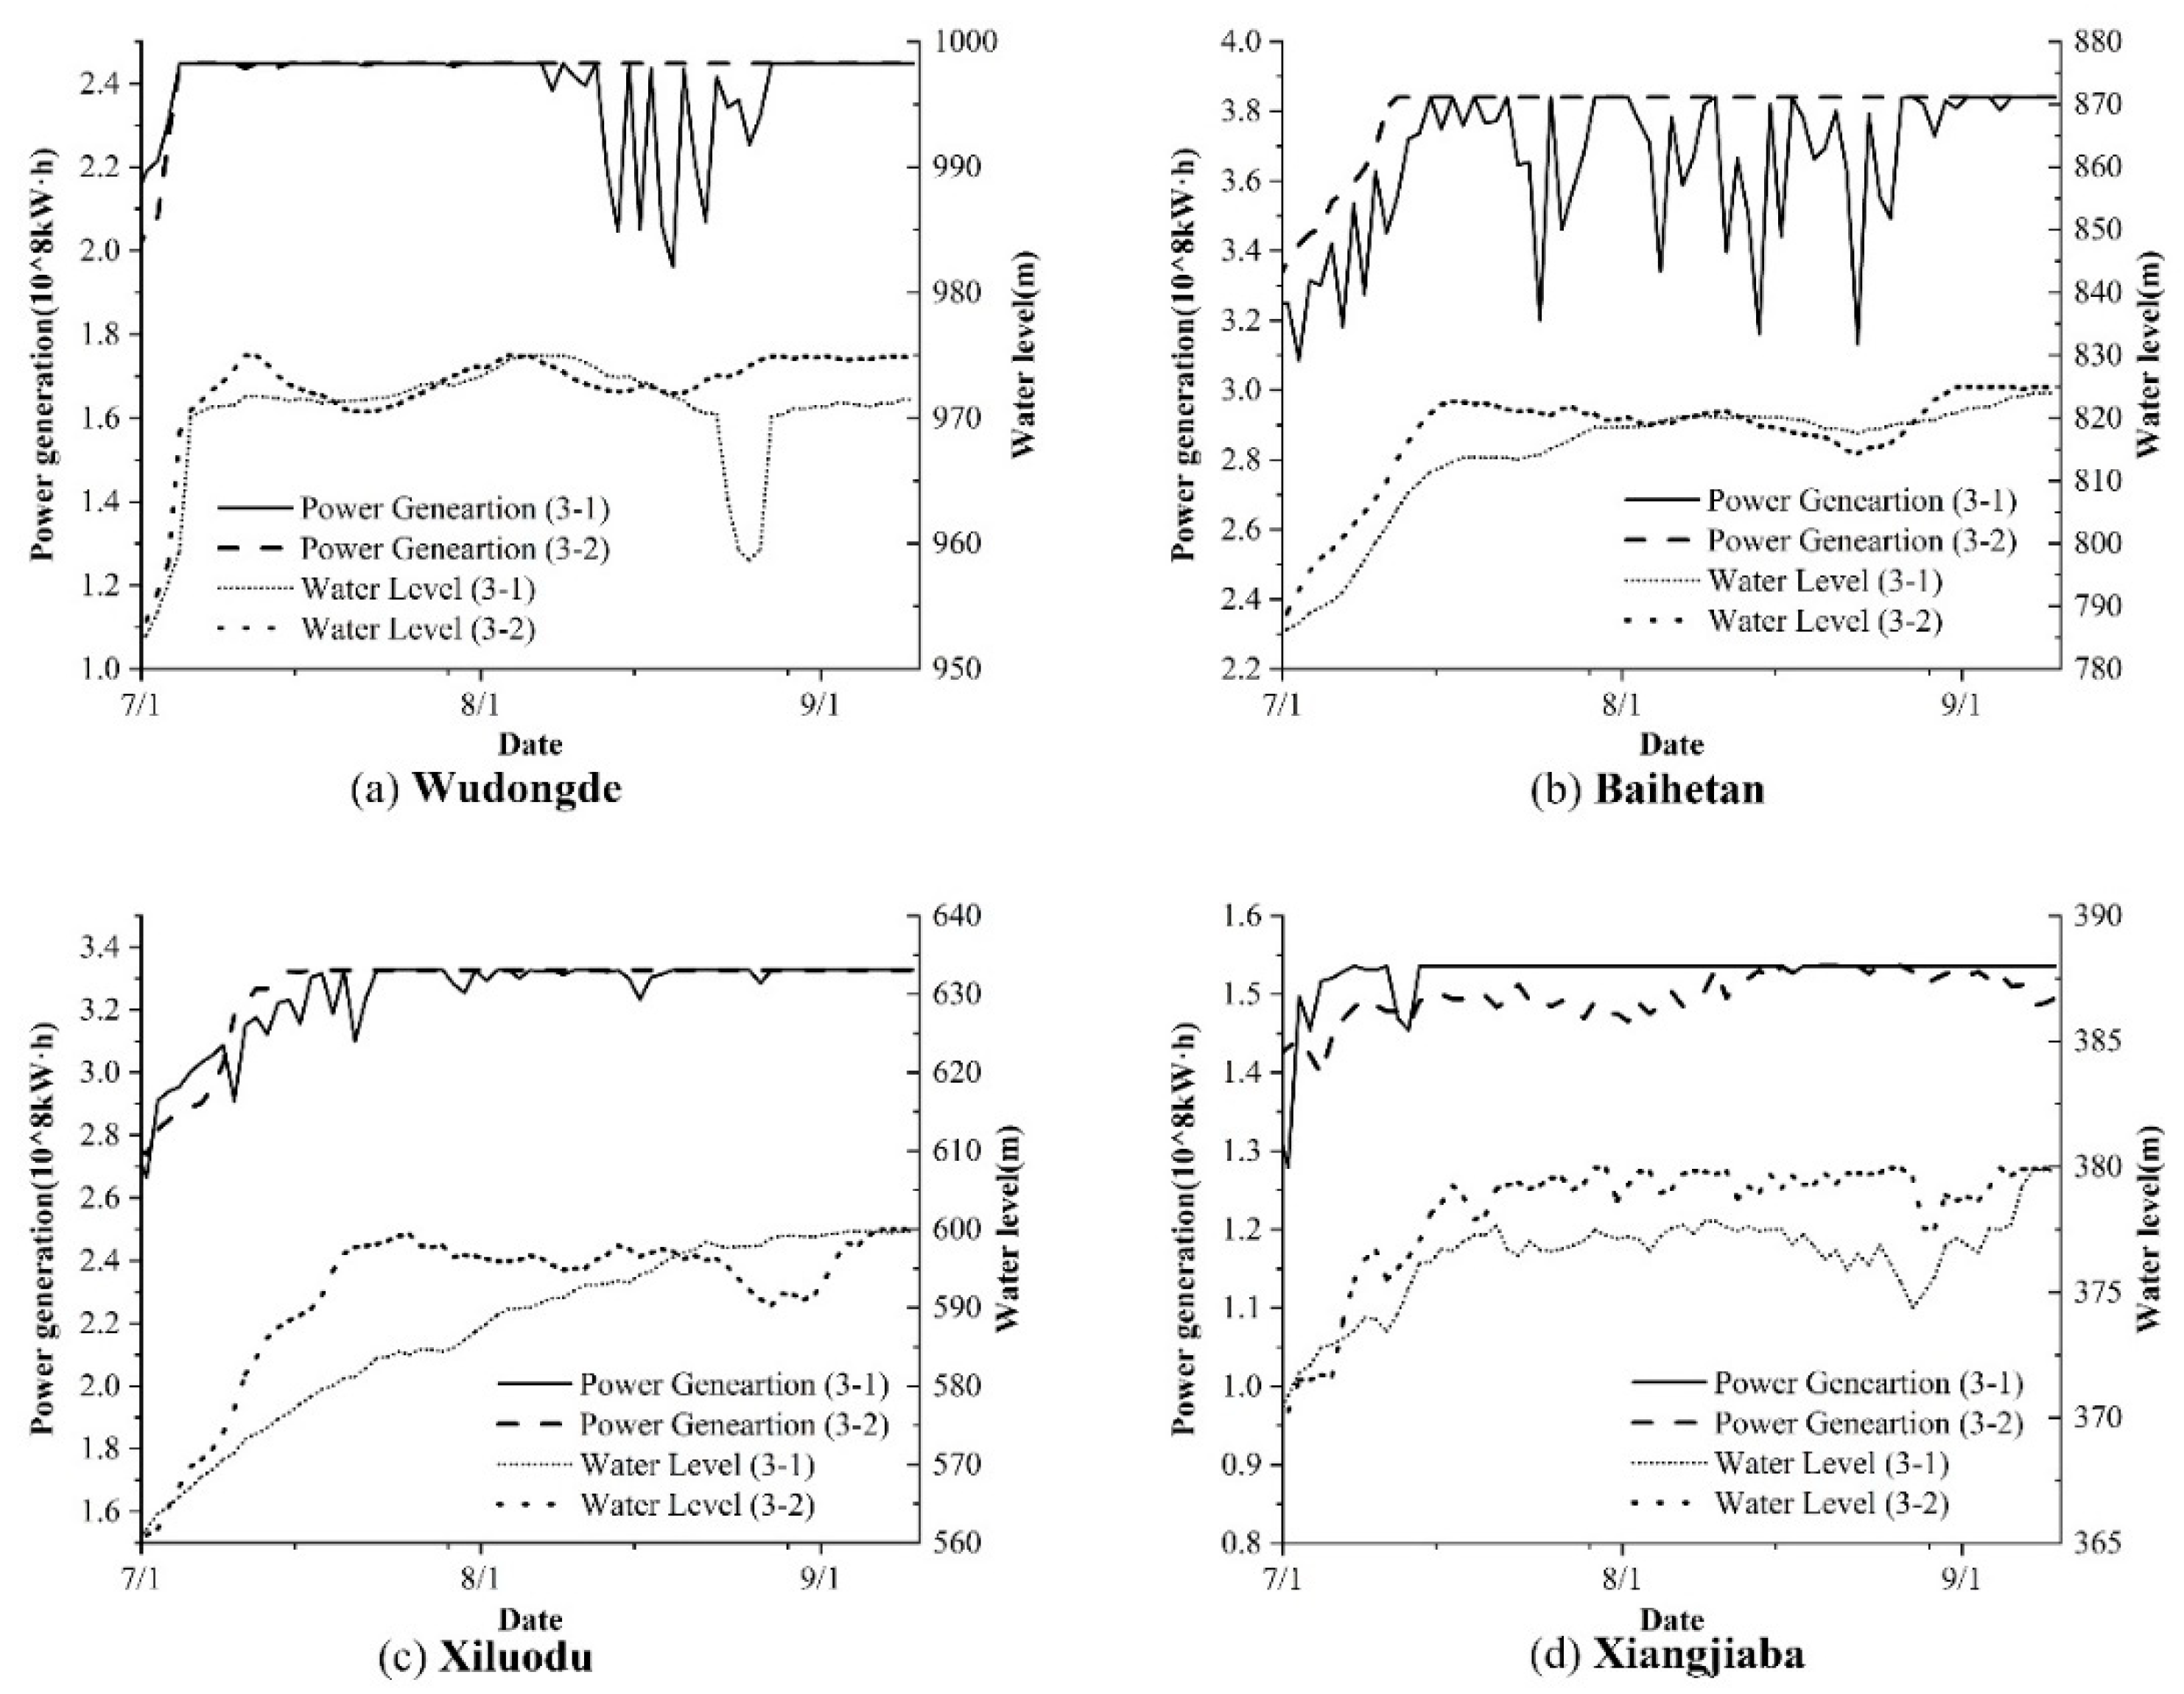
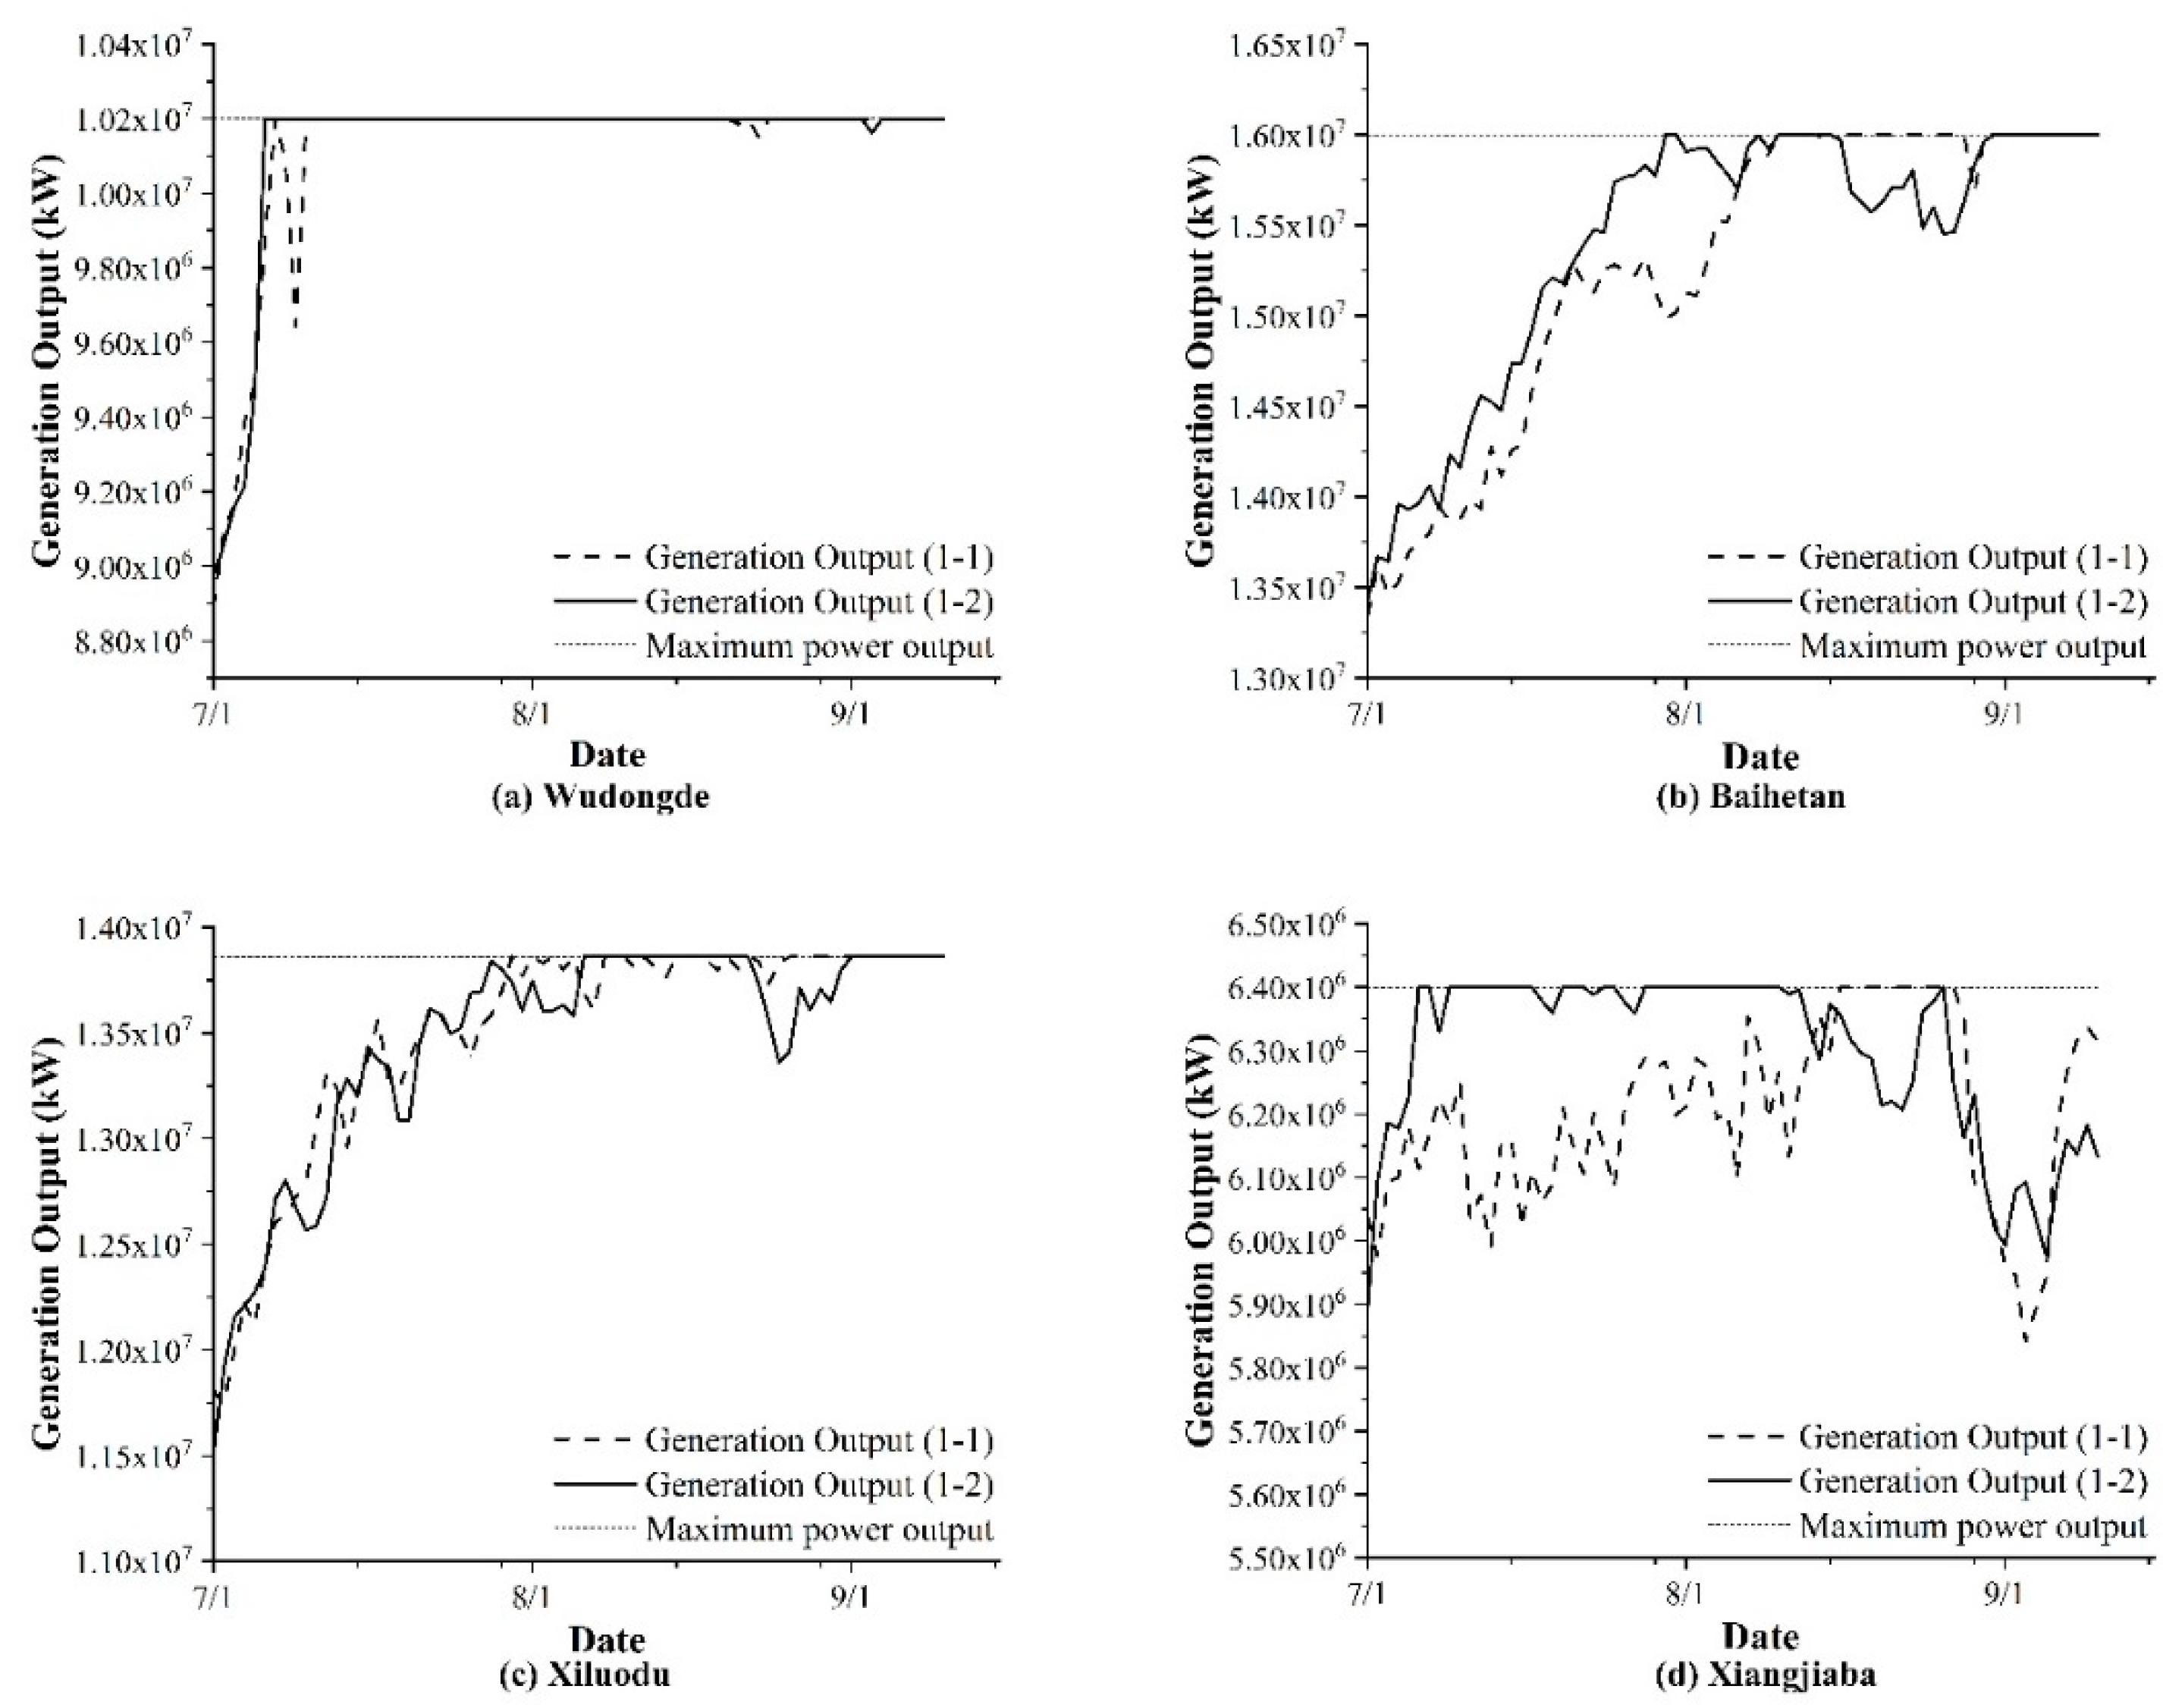
| 3-1 | ||
| 3-2 |
© 2019 by the authors. Licensee MDPI, Basel, Switzerland. This article is an open access article distributed under the terms and conditions of the Creative Commons Attribution (CC BY) license (http://creativecommons.org/licenses/by/4.0/).
Share and Cite
Yao, H.; Dong, Z.; Jia, W.; Ni, X.; Chen, M.; Zhu, C.; Li, D. Competitive Relationship between Flood Control and Power Generation with Flood Season Division: A Case Study in Downstream Jinsha River Cascade Reservoirs. Water 2019, 11, 2401. https://doi.org/10.3390/w11112401
Yao H, Dong Z, Jia W, Ni X, Chen M, Zhu C, Li D. Competitive Relationship between Flood Control and Power Generation with Flood Season Division: A Case Study in Downstream Jinsha River Cascade Reservoirs. Water. 2019; 11(11):2401. https://doi.org/10.3390/w11112401
Chicago/Turabian StyleYao, Hongyi, Zengchuan Dong, Wenhao Jia, Xiaokuan Ni, Mufeng Chen, Cailin Zhu, and Dayong Li. 2019. "Competitive Relationship between Flood Control and Power Generation with Flood Season Division: A Case Study in Downstream Jinsha River Cascade Reservoirs" Water 11, no. 11: 2401. https://doi.org/10.3390/w11112401