Numerical Simulations of Hydraulic Characteristics of A Flow Discharge Measurement Process with A Plate Flowmeter in A U-Channel

College of Water Resource Science and Engineering, Taiyuan University of Technology, Taiyuan 030024, China
*
Author to whom correspondence should be addressed.
Water 2019, 11(11), 2382; https://doi.org/10.3390/w11112382
Submission received: 7 October 2019
/
Revised: 3 November 2019
/
Accepted: 11 November 2019
/
Published: 14 November 2019
(This article belongs to the Special Issue Hydraulic Dynamic Calculation and Simulation)
Abstract
:The use of a flow discharge measuring device in irrigated areas is the key to utilizing water in a planned and scientific manner and to developing water-saving irrigation techniques. In this study, a new type of flow discharge measuring device for a U-channel—a plate flowmeter—was designed, and then the hydraulic characteristics of the flow discharge measurement process using the plate flowmeter were simulated and experimentally verified by adopting an RNG (Renormalization Group) k-ε turbulence model based on Flow-3D software. The results showed that in the process of measuring flow discharge with the plate flowmeter, the transverse flow velocity, the vertical flow velocity, and the relationship between the measured flow discharge and the deflection angle of the angle-measuring plate were basically consistent with the experimental results. The maximum relative errors were 5.3%, 6.2%, and 6.8% respectively, proving that it was feasible to use Flow-3D software to simulate the hydraulic characteristics of the flow discharge measurement process using the plate flowmeter. The vertical flow velocities at the center of the upstream section of the channel increased gradually from the bottom of the channel to the free water surface. The vertical flow velocities at the center of the downstream section of the channel first increased and then decreased from the bottom of the channel to the free water surface, and the maximum vertical flow velocity was located at a position below the free water surface. The maximum range of influence of the plate flowmeter on the flow disturbance in the channel was from 0.75 m upstream to 1.24 m downstream of the plate flowmeter. These results can provide a theoretical basis for optimizing the structural parameters of a plate flowmeter.
1. Introduction
With rapid socioeconomic development, the contrast between available water supply and demand has become larger. This increasing contrast has become one of the main bottlenecks restricting large-scale development. As a major water user, agriculture requires advances in water-saving irrigation technology to save water resources [1,2]. The implementation of precise irrigation methods to improve irrigation efficiency is a popular strategy for increasing sustainable agricultural development. However, the primary basis for implementing precise irrigation is to measure water use more accurately in irrigated areas. The use of flow discharge measuring technology for measuring irrigation is a key technical strategy in better utilizing water in a more planned and scientific manner, and it is also key to better managing irrigated areas and improving water diversion, water transfer, and water allocation [3]. In order to promote agricultural water conservation and improve the sustainable development of water resources, it is imperative to strengthen flow discharge measurement strategies in irrigated areas. There are many irrigation districts in China. As large- and medium-sized irrigation districts continue to promote water-saving reforms, flow discharge measurements in irrigation districts have greatly improved, providing measurements in main and branch canals in major irrigation districts [4]. However, for lateral and sublateral channels, due to differences in channel types, management levels, and economic conditions, the requirements for flow discharge measurement equipment vary greatly, and there is a gap between existing equipment and the actual demand from irrigation districts. This gap mainly manifests in the low precision of flow discharge measurements, the large water head loss of flow discharge measurement facilities, and unsophisticated means of data storage and record transmission. At the same time, in order to improve the channel efficiency of lateral and sublateral channels and to facilitate industrialization and standardization, standardized U-channels have been adopted in water-saving renovations [5].
With the wide application of U-channels, there have been many achievements in research and technology related to flow discharge measurement devices, such as Parshall flumes [6,7], long-throated flumes [8,9], wing-shaped measuring flumes [10,11], cutthroat flumes [12,13], metrical flumes with straight walls [14], and parabolic throat flumes [15]. Their flow discharge measuring principle is to build special flow discharge measurement equipment in the channel, and the critical flow is generated at a specific position, so that the relationship between flow discharge and water level is not affected by downstream flow conditions, and the upstream water level can be measured to achieve flow discharge. Liu Yilin et al. [16] analyzed the flow measurement principle and the formula of a triangular raft and compared the measurement accuracy of the sputum measurement method and the volumetric method: they obtained results indicating that the measurement accuracy of the sputum measurement method was higher. Ma Xiaoyi et al. [17] analyzed the flow discharge measurement principle and flow discharge measuring performance of a parabolic flume with a U-channel and optimized the structure of the flume through numerical simulation. Liu Ying et al. [18] used Flow-3D software to simulate and analyze the influence of different flow discharges, different slopes, an upstream Froude number, an upstream water level, and the critical submergence of the hydraulic characteristics of the round-head water column in a U-channel. Mariusz Sojka et al. [19] analyzed the effects of control drainage on the groundwater table and subsurface outflow and put forward the concept of sustainable development and the rational use of drainage infrastructure to realize effective management of water resources. Mou Xianyou et al. [20] carried out three-dimensional simulations with standard k-ε and VOF (Volume of Fluid) models, studied the flow characteristics of a U-channel with a metrical flume with a straight wall, and predicted the overcurrent hydraulic characteristics of a metrical flume with a straight wall without a slope condition. Zhong Xinming et al. [21,22] simulated the water level–flow discharge relationship and internal flow field characteristics of a U-channel with a cutthroat flume by using an RNG (Renormalization Group) k-ε model and a PISO (Pressure Implicit with Splitting of Operators) algorithm. Sun Bin [23,24] and Dinh Thi Huong et al. [25] used the turbulence model of VOF (Volume of Fluid) combined with Favor technology to simulate the hydraulic jump problem of a wing-shaped measuring flume; analyzed the conjugate water depth, velocity distribution, and time-average flow field of the hydraulic jump; and obtained the approximate calculation formula of the conjugate water depth. In summary, these flow discharge measuring devices have largely solved the problem of flow discharge measuring in U-shaped channels. However, there are some deficiencies in their application, such as the complex structure of the different measuring facilities, inconvenient construction, the lack of mobility, and complex formulas [26,27]. To address these deficiencies, it was particularly necessary to develop a portable flow discharge measuring device—a plate flowmeter—that is low cost and has a simple application, accurate measurements, and convenient portability in accordance with the characteristics of a U-channel. When water flows through the vertical angle-measuring plate, it impinges on it, causing the angle-measuring plate to deflect. The deflection angle has a fixed relationship with the flow discharge in the channel. The flow discharge was achieved by measuring the deflection angle of the angle-measuring plate. In this study, the hydraulic characteristics of the flow discharge measurement process using the plate flowmeter were investigated in order to optimize the structural parameters of the plate flowmeter, improve the accuracy of water measurement in U-channels, and promote efficient water usage in irrigated areas.
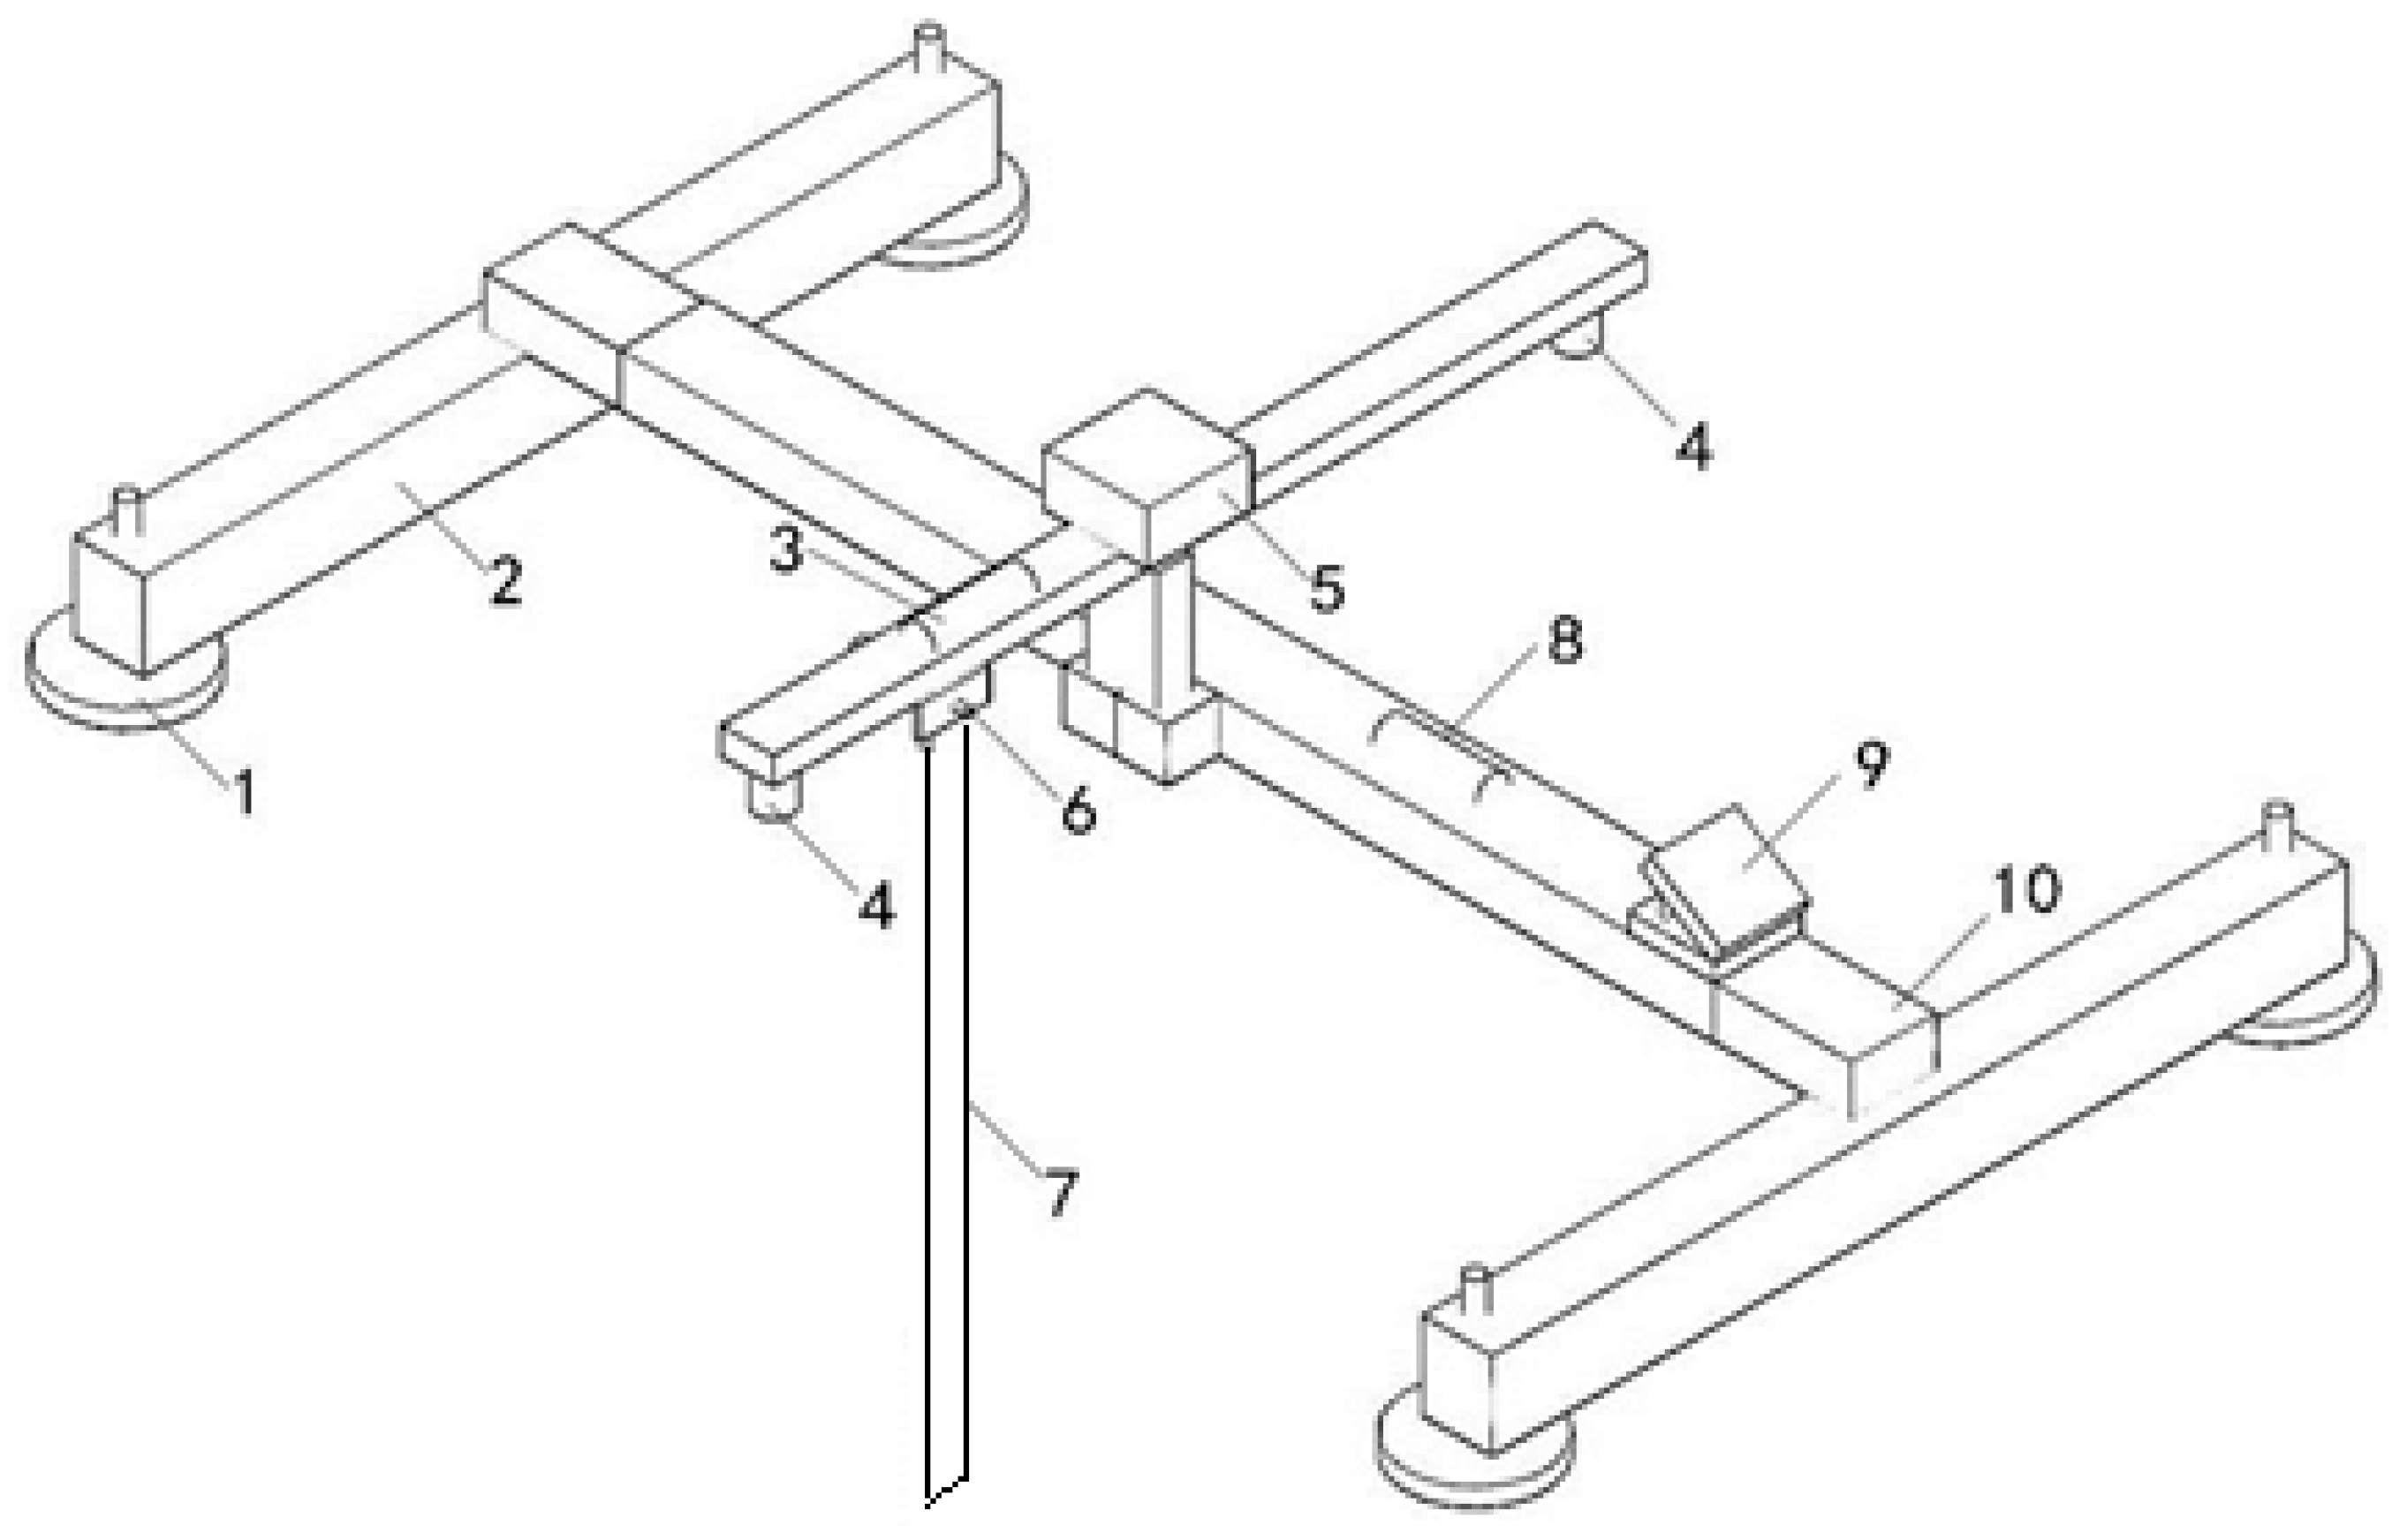
The structure of the plate flowmeter is composed of leveling knobs, a level, an ultrasonic probe, a power and signal processing module, an angle sensor, a capacitive touch screen, a scalable steel frame, and an angle-measuring plate. The leveling knobs were used to adjust the device so that it was placed horizontally on both sides of the channel. The level was used to assist leveling by observing the position of bubbles. The ultrasonic probes were used to detect the upstream and downstream water level of the channel, and the channel bottom slope was obtained through calculations. The power and signal processing module supplied power to the whole device and converted, processed, and output the collected signals to the display device. The angle sensor was used to measure the angle between the angle-measuring plate and the vertical direction when swinging in the water. The capacitive touch screen was used to input the parameters of the angle-measuring plate and output the current swing angle of the angle-measuring plate and the flow discharge in the channel. The scalable steel frame was used to adjust the flow-measuring device across the center of the channel. The angle-measuring plate was a smooth rectangular stainless steel sheet (the stiffness met the test requirements) that was located at the center of the channel cross-section. When the water flowed through, the angle between the angle-measuring plate and the cross-section was formed and recorded by the angle sensor. The schematic diagram of the plate flowmeter is shown in Figure 1.
2. Methods
2.1. Mathematical Model Setup
2.1.1. Fluid Domain Governing Equations
For the plate flowmeter, the flow in the U-channel is incompressible in the flow discharge measurement process. In this paper, Flow-3D software and the RNG k-ε model were used to calculate the hydraulic characteristics of the water flow in the U-channel during flow discharge measurement with the plate flowmeter. In the rectangular coordinate system, the governing equations and the turbulence models are as follows.
The continuity equation is
The momentum equation is
The turbulent kinetic energy equation (k-equation) is
The turbulent dissipation rate equation (ε-equation) is
where is the density of the fluid; t is time; p is the pressure of the fluid; is the hydrodynamic viscosity coefficient; , , and are generalized source terms in the momentum conservation equation; and are the fluid velocity components; Gk represents the turbulent kinetic energy generation term, which is caused by the average velocity gradient; ε represents the fluid turbulence dissipation rate; and C1ε and C2ε are the turbulence model coefficients (C1ε = 1.44, C2ε = 1.92).
2.1.2. Solid Domain Governing Equations
In this paper, the structural dynamics equation in the GMO (General Moving Objects) model was used to solve the motion form of the plate flowmeter. The GMO model allowed the solid domain to be coupled to the fluid domain or to move in a specified manner. The plate flowmeter studied in this paper is a rigid structure. Therefore, when the angle-measuring plate was subjected to the flow in the channel during the flow discharge measurement with the plate flowmeter, its shape and size and the relative position of the internal points did not change. The structural coupling characteristics of the plate flowmeter were mainly reflected in the instantaneous displacement and instantaneous velocity of the angle-measuring plate, which produced a rotary motion under the action of the flow. Rigid motion equations can solve for the rotational velocity and displacement of the angle-measuring plate during flow discharge measurements with a plate flowmeter. The rigid motion equation [28] can be expressed as
where me is the quality of the angle-measuring plate (kg); Fe is the resultant force on the angle-measuring plate (N); Ve is the instantaneous velocity of the angle-measuring plate (m·s−1); Me is the instantaneous moment of the angle-measuring plate (N·m); [J] is the matrix of the instantaneous rotational inertia of the angle-measuring plate; and ωe is the instantaneous angular velocity of the angle-measuring plate (rad·s−1). The rotational inertia matrix can be expressed as
where Jxx, Jyy, and Jzz are the rotational inertia of the angle-measuring plate against the x, y, and z axes, respectively (kg·m²); Jxy and Jyx are the products of inertia of the angle-measuring plate against the x and y axes, respectively (kg·m²); Jxz and Jzx are the products of inertia of the angle-measuring plate against the x and z axes, respectively (kg·m²); and Jyz and Jzy are the product of inertia of the angle-measuring plate against the y and z axes, respectively (kg·m²).
In Equation (6), the relevant parameters can be expressed as
where
Newmark’s predictor–corrector implicit time integration algorithm was used to solve the rigid motion equation [29]. In the coupling interface between the fluid and solid domains of the angle-measuring plate in the channel, the coupling variables between the instantaneous displacement and the instantaneous stress of the fluid domain and the solid domain should be equal or conserved. The governing equation for the coupling variables can be expressed as
where τ and r are the instantaneous stress and instantaneous displacement at the coupling interface, respectively; ns is the normal vector; f is the fluid domain; and b is the solid domain.
2.1.3. Model Establishment
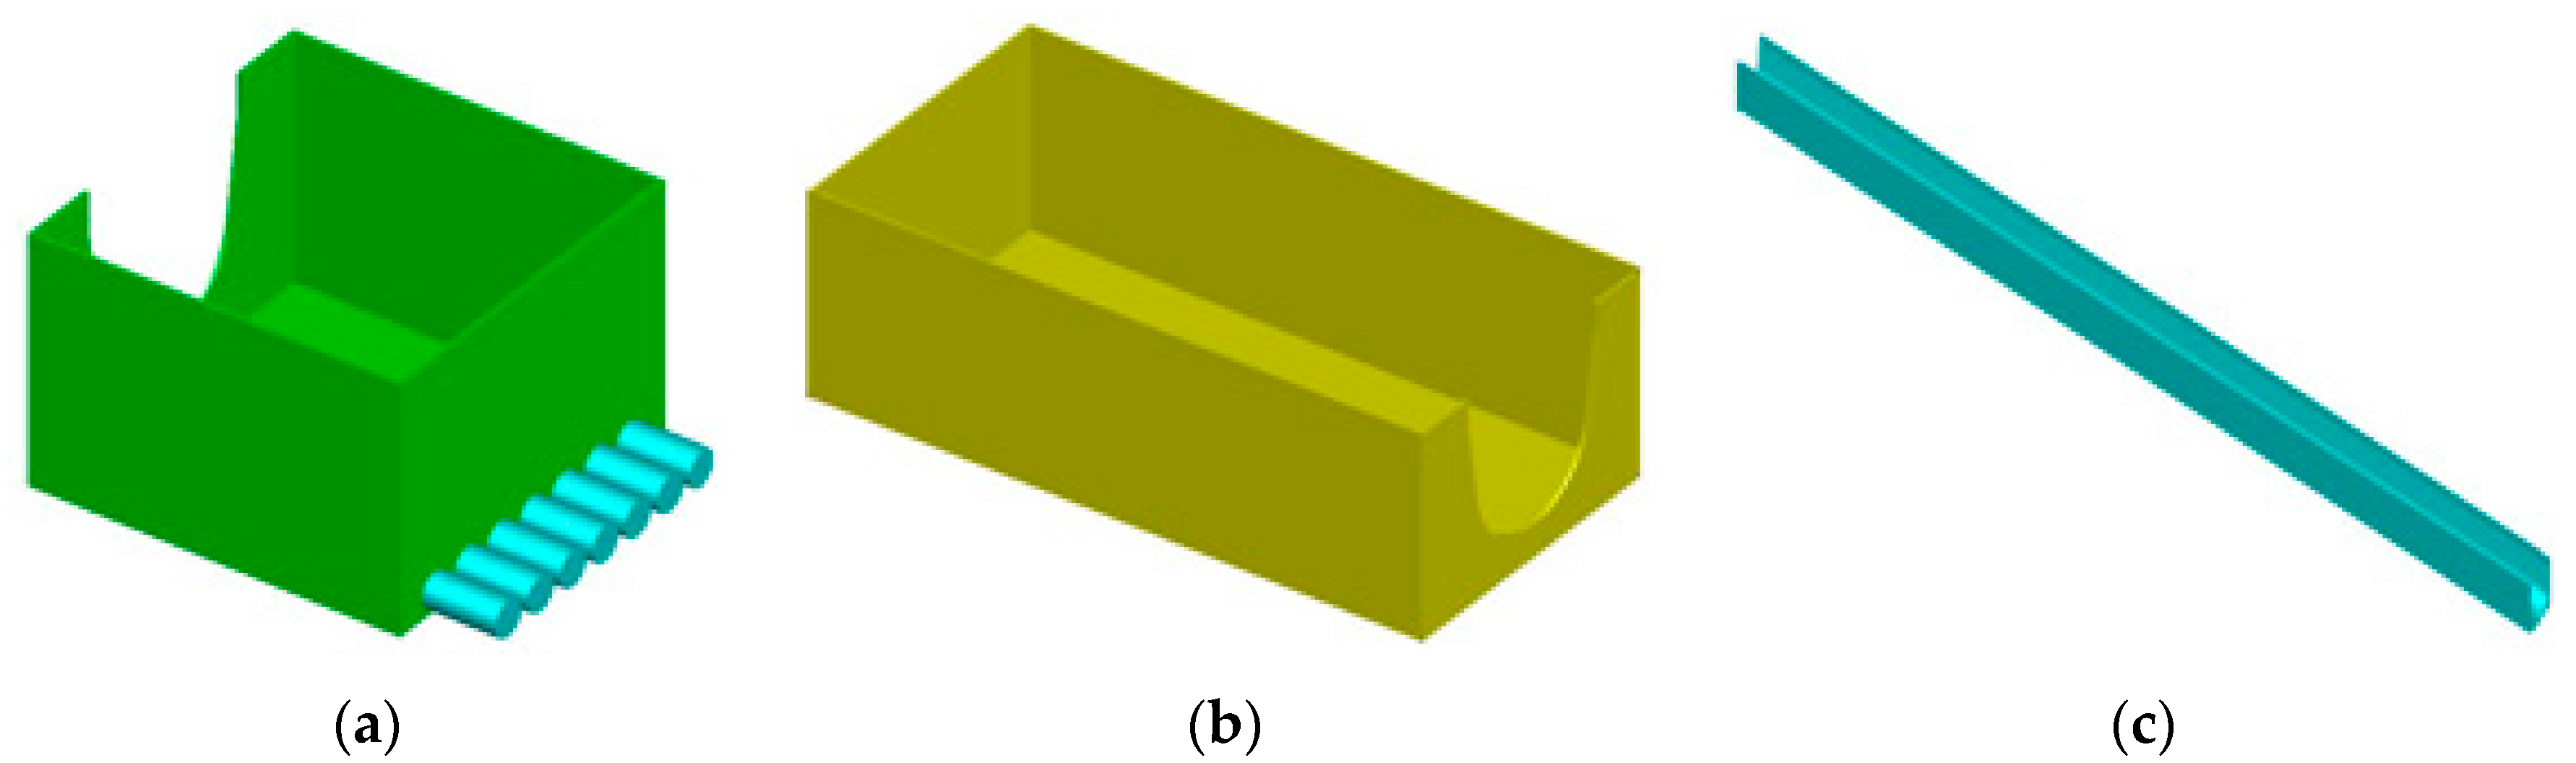
The modeling system in this paper consisted of four parts: an inlet flow stabilizing device, a channel testing device, a tail-water outflow device, and a plate flowmeter.
The Inlet Flow Stabilizing Device
The main function of the inlet flow stabilizing device was to stabilize the flow pattern of water in the U-channel. In this study, the length, height, and width of the inlet flow stabilizing device were designed to be 1.0 m, 0.98 m, and 0.7 m, respectively. Seven pipes of the same diameter, with an inner diameter of 10 cm, were arranged upstream but close to the device to supply water to the U-channel. A schematic diagram of the inlet flow stabilizing device is shown in Figure 2a.
Tail-Water Outflow Device
The purpose of the tail-water outflow device was to provide an outlet for the flow. In this study, the length, width, and height of the tail-water outflow device were designed to be 2.0 m, 0.98 m, and 0.7 m, respectively. A schematic diagram of the tail-water outflow device is shown in Figure 2b.
Channel Testing Device
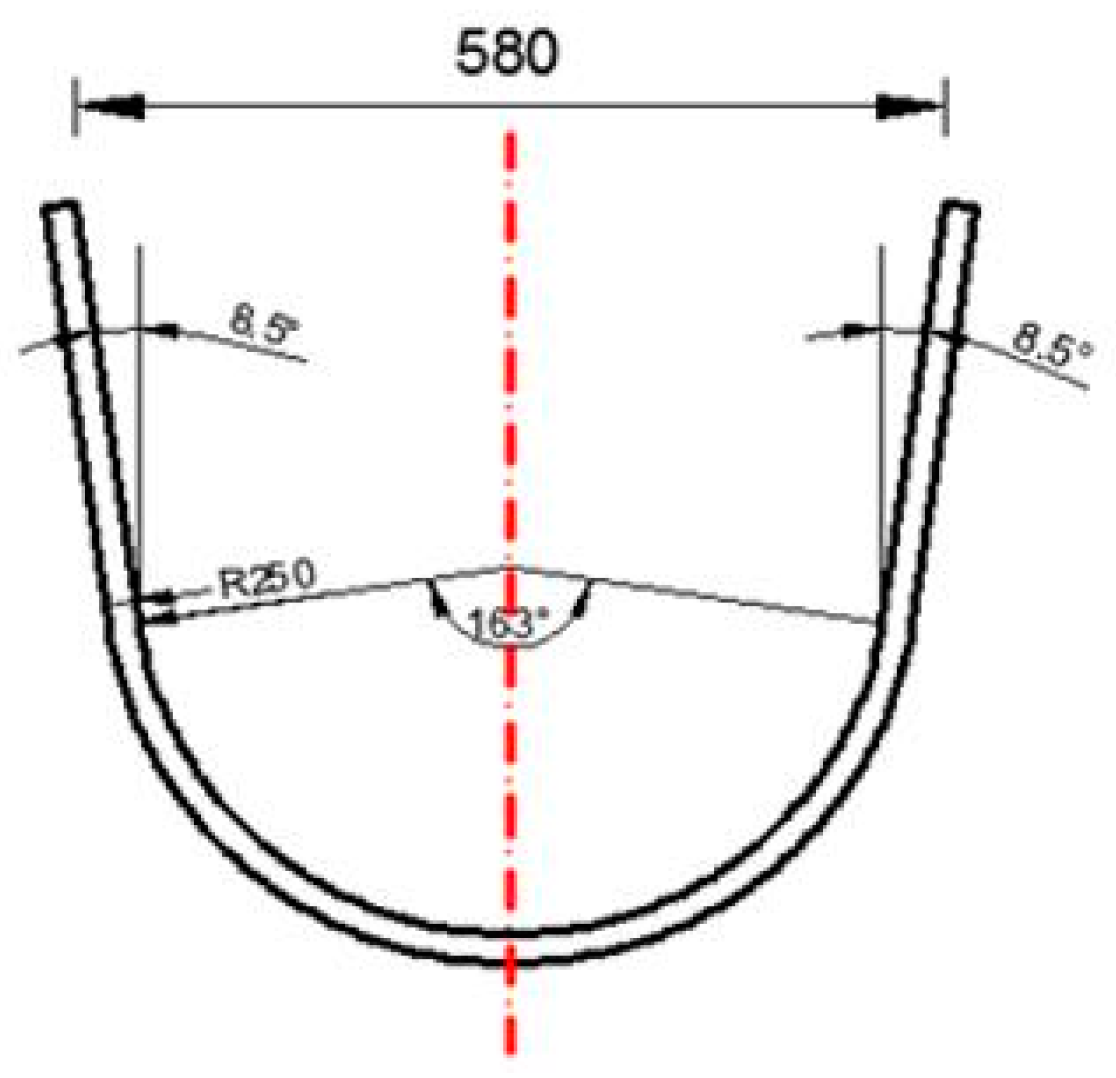
The channel selected in this study was a D50 U-channel with a depth of 0.5 m, a bottom arc radius of 0.25 mm, a central angle of the bottom arc of 163°, an inclination angle of 8.5°, a top width of 0.58 m, and a length of 13 m. The channel section was composed of two parts: an arc shape at the bottom and an isosceles trapezoid at the top. A schematic diagram of the channel testing device is shown in Figure 2c.
Plate Flowmeter
A schematic diagram of the plate flowmeter is shown in Figure 1.
2.1.4. Mesh Generation
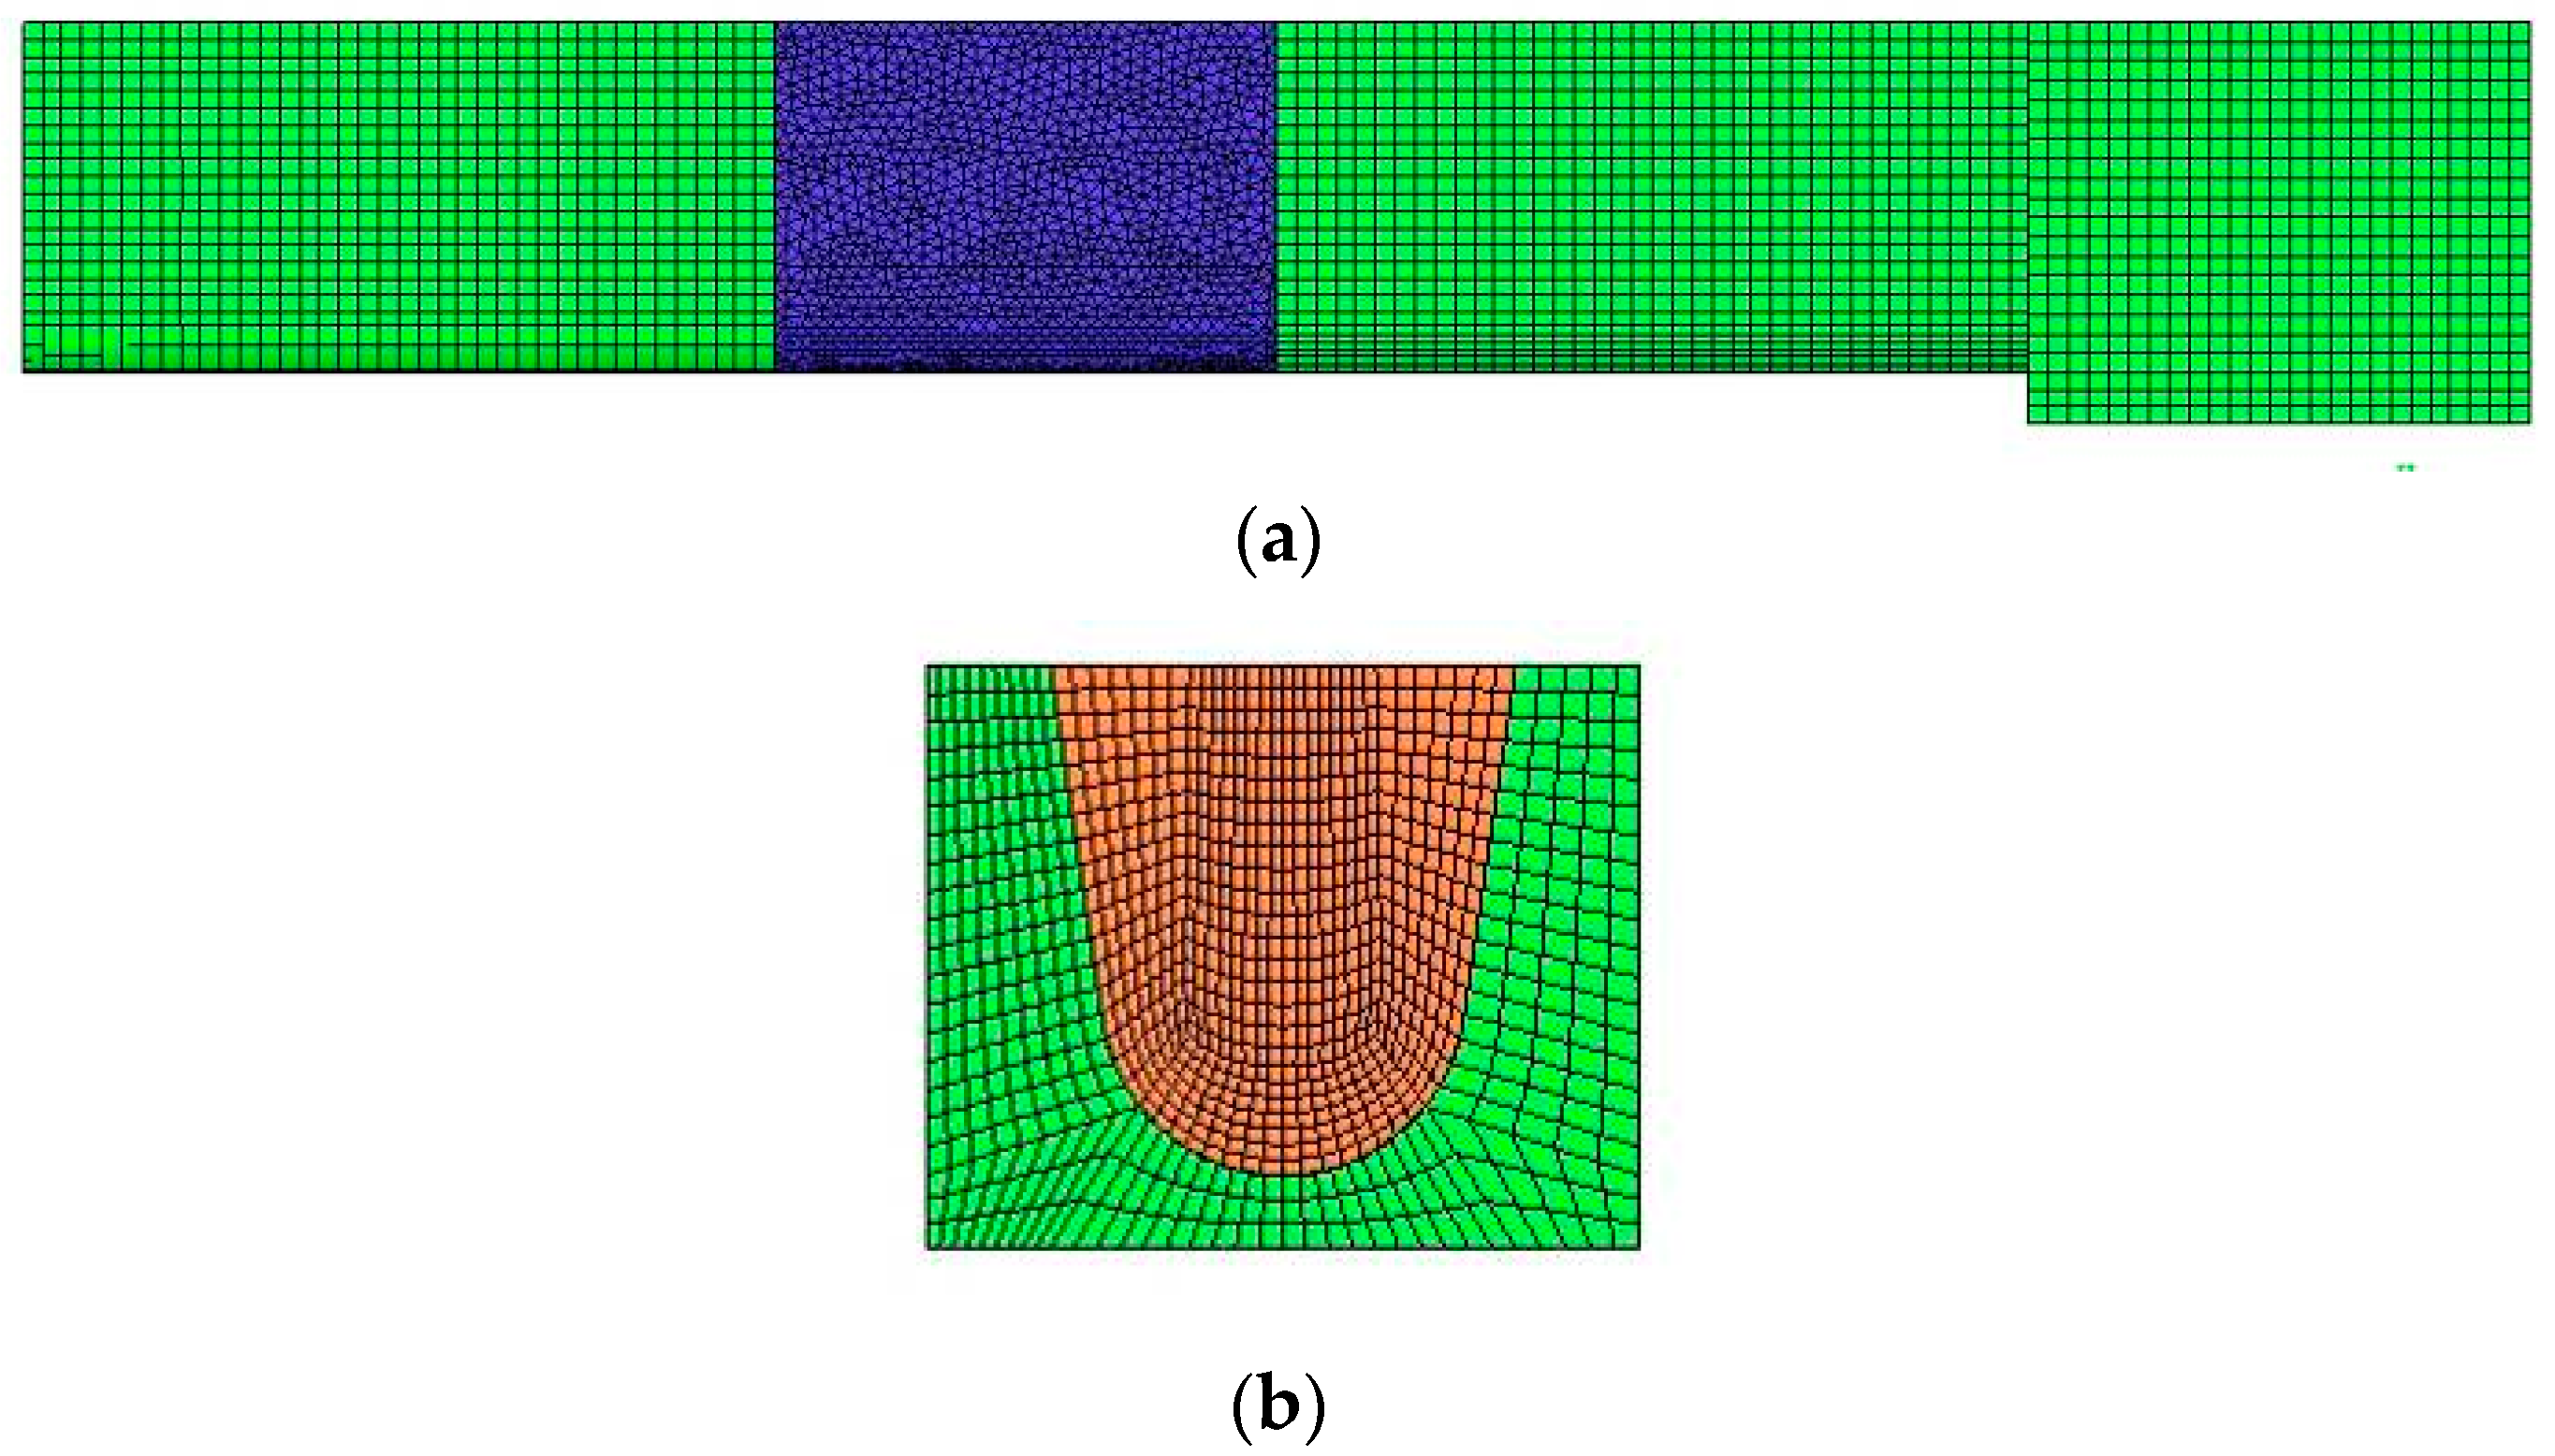
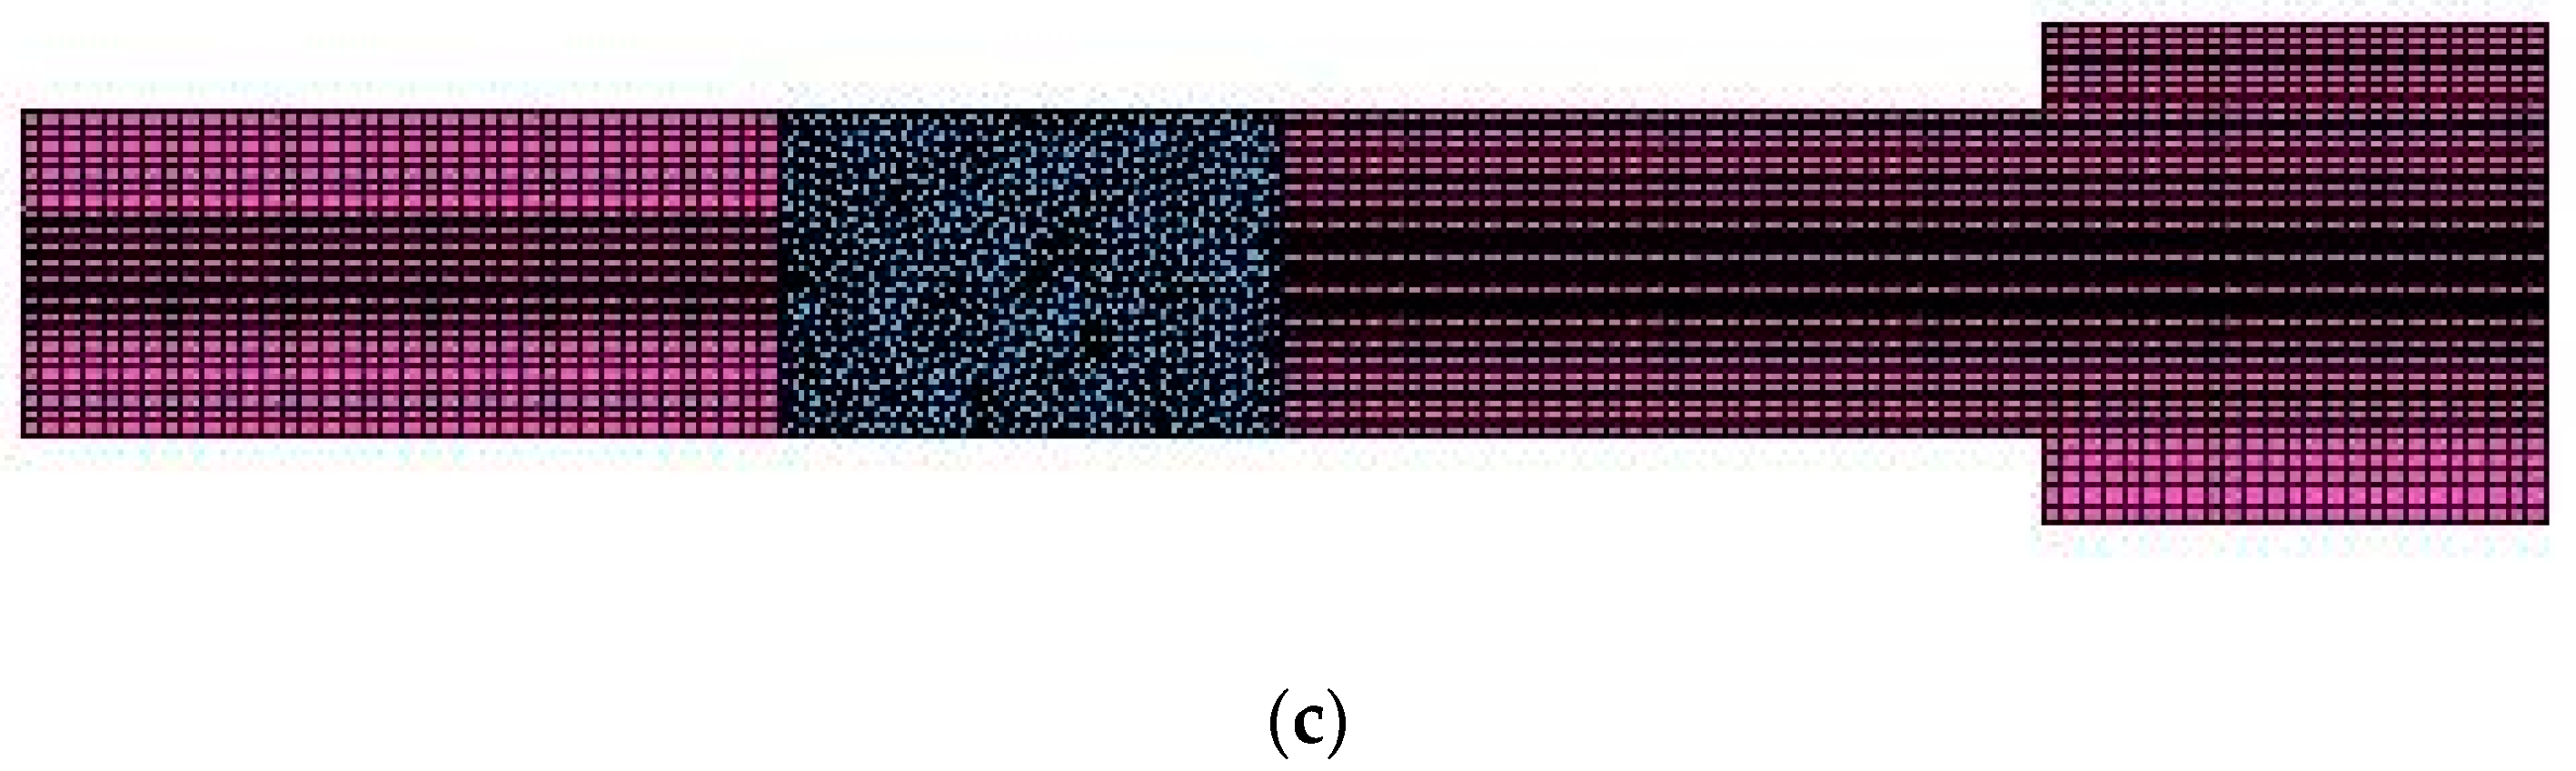
Considering the complexity of the structure of the model, a combined structured and unstructured grid generation method was adopted in this paper. For grid division, an unstructured grid was used for the area around the plate flowmeter, and a structured grid was used for the area outside the plate flowmeter. The maximum grid size of the structured grid was 4 mm, and that of the unstructured grid was 1 mm. A schematic diagram of mesh generation is shown in Figure 3.
2.1.5. Definite Conditions
Boundary Conditions: Inlet and Outlet Boundaries
In this study, the flow was set as the inlet boundary and the free flow boundary as the exit boundary.
Initial Conditions
The initial time was t = 0, at which point there was no fluid in the U-channel, and the channel was at atmospheric pressure. The angle-measuring plate was perpendicular to the water cross-section of the U-channel, and the angular velocity (ω) of the angle-measuring plate was zero.
2.1.6. Fluid–Solid Coupling Algorithm
Using the initial state of the plate flowmeter as the initial boundary condition of the fluid domain, the Reynolds time-averaged momentum equation and the turbulence model were used to solve for the hydrodynamic load in the fluid domain, and the fluid domain load was loaded into the solid domain through the coupling interface. The structural dynamic equation in the GMO model was used to solve for the structural response of the plate flowmeter, and its rotational angular velocity and deflection angle were calculated. The rotational angular velocity and the deflection angle of the angle-measuring plate were transmitted back to the boundary of the plate flowmeter in the flow field through the coupling interface. The changed boundary of the plate flowmeter was used as the boundary condition to solve for the next time in the fluid domain, and the hydrodynamic load was recalculated. A coupling iteration was completed through the process described above. The solution process described above was repeated until the maximum value of the deflection angle of the angle-measuring plate was reached.
2.2. Experimental System Setup
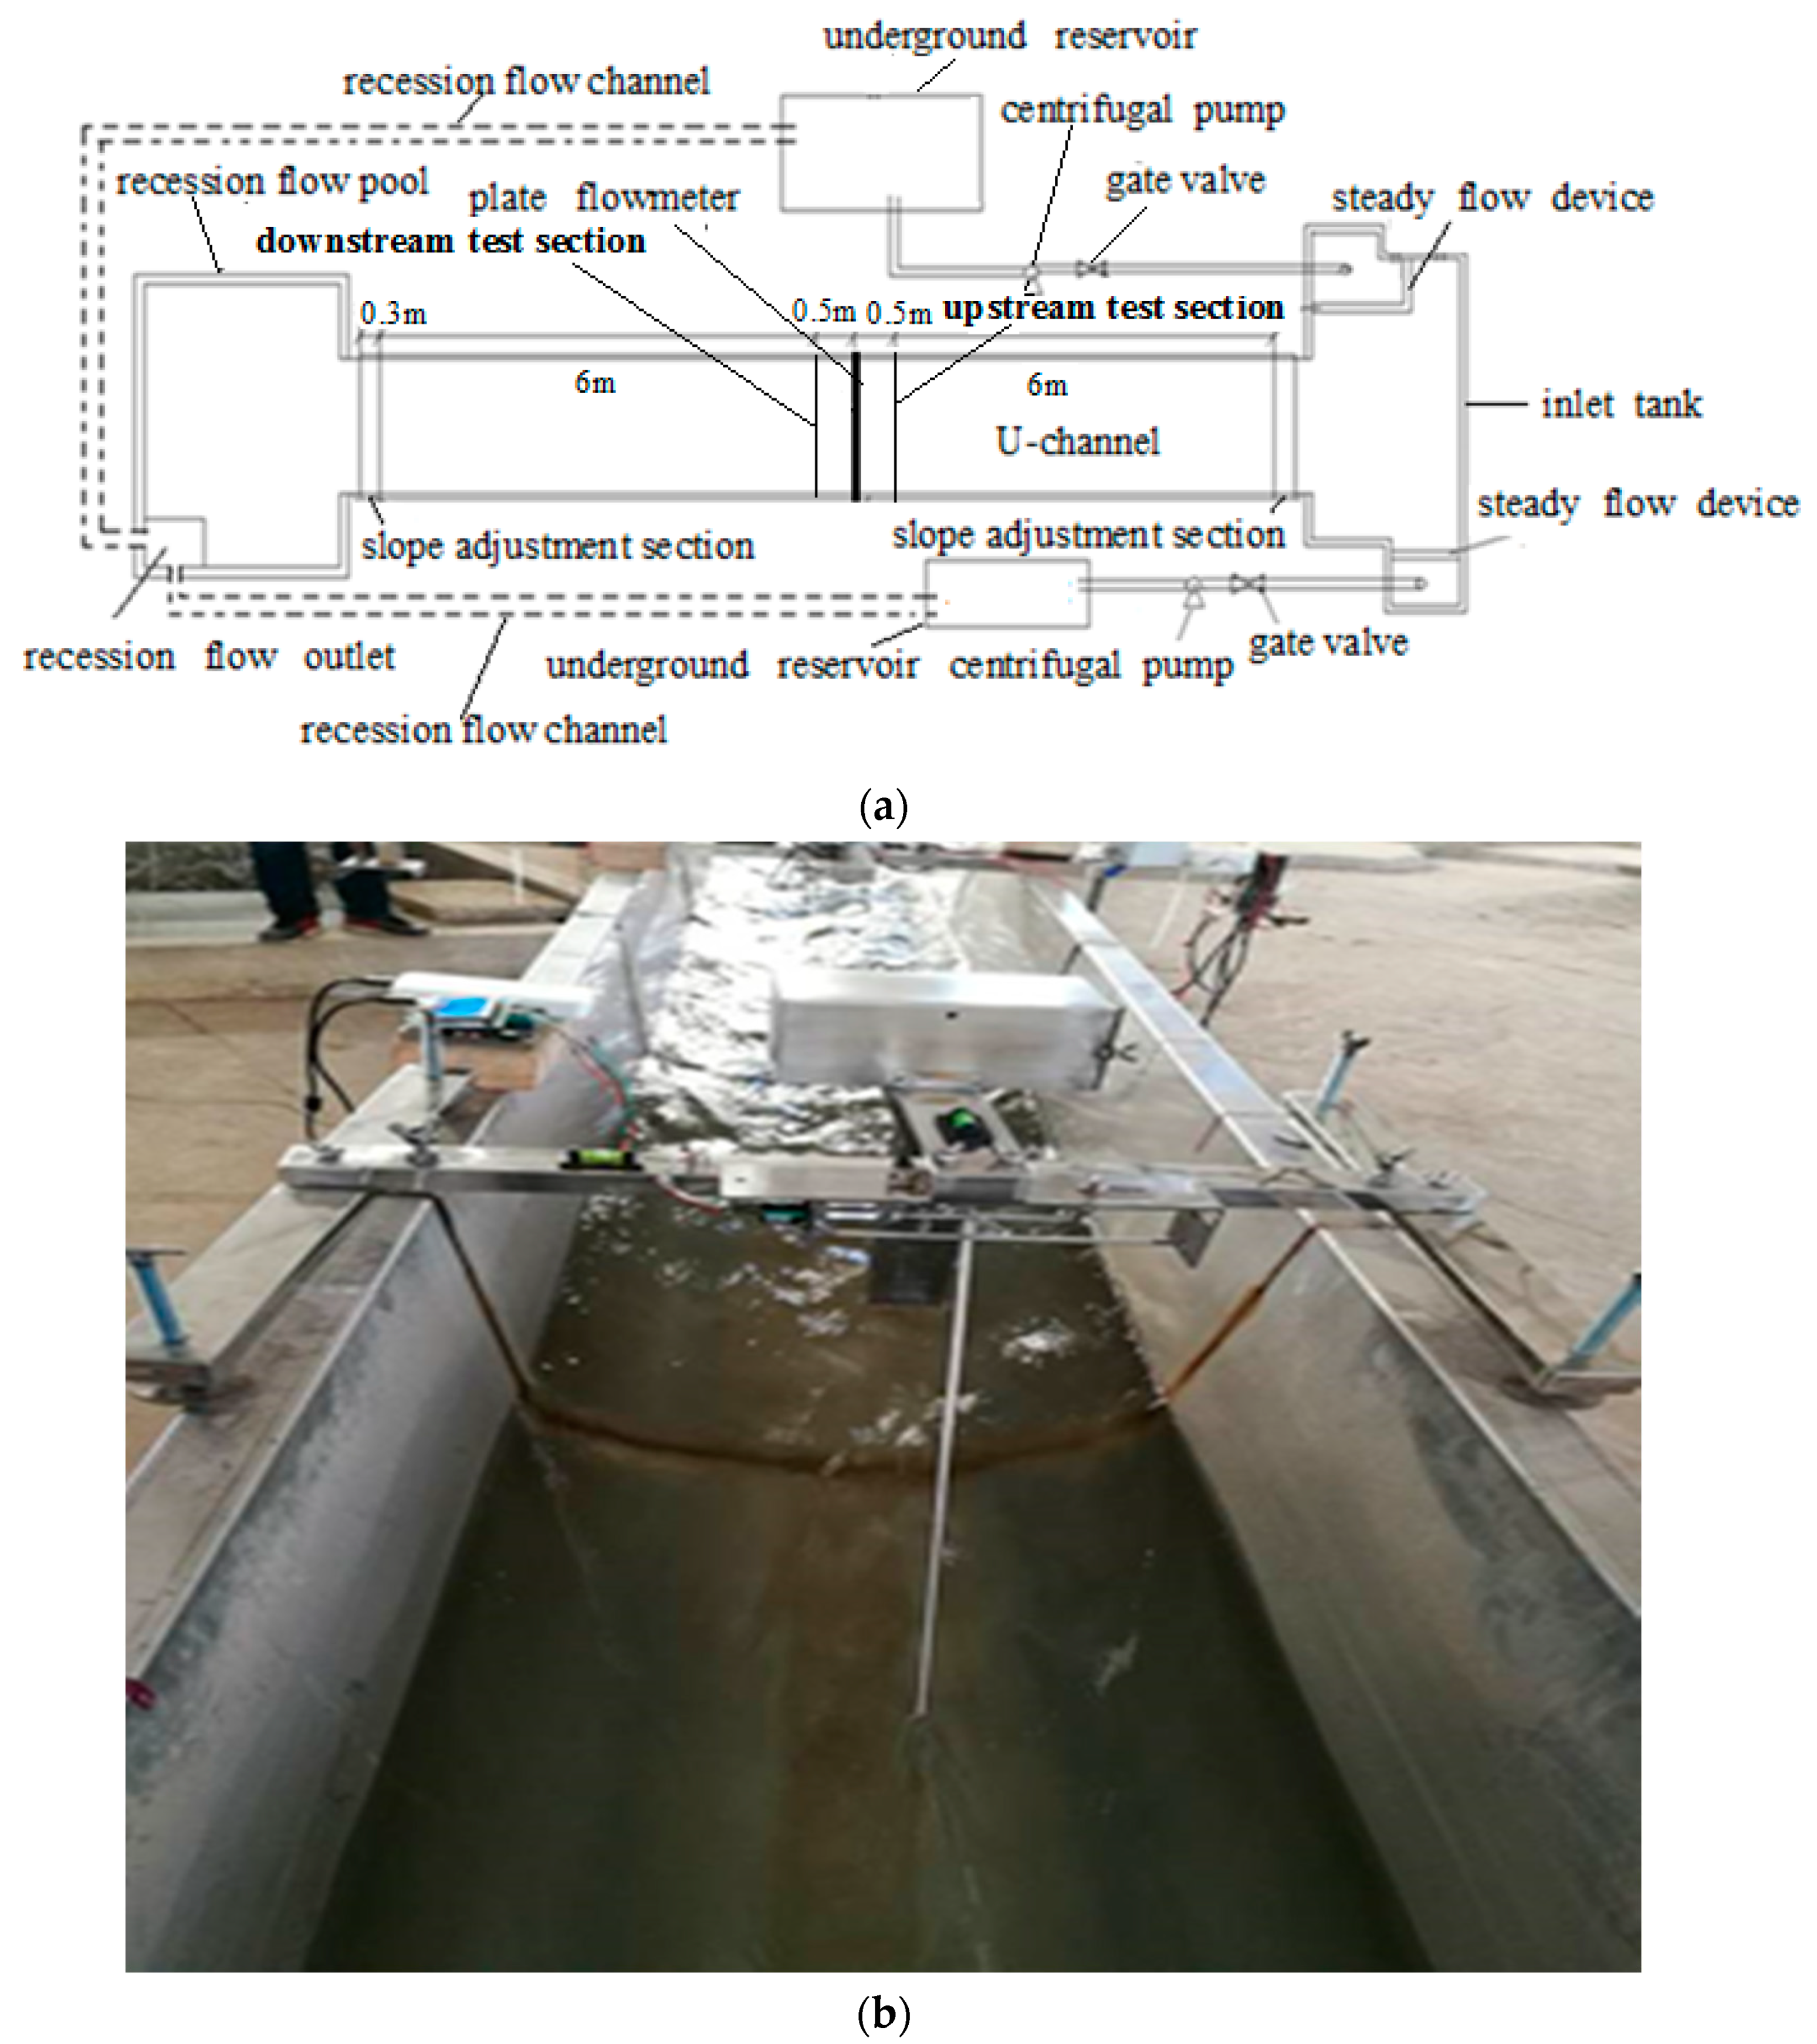
In order to verify the reliability of the Flow-3D numerical simulation results, an experimental study was conducted of the hydraulic characteristics during measurement with the plate flowmeter in the U-channel. This test system was mainly composed of four parts: a water supply device, flow discharge control device, conveyance channel, and recession flow device [30,31,32]. The water supply device included both a centrifugal pump and an inlet tank. The inlet tank was connected to the U-channel. In order to ensure steady flow into the U-channel, the steady flow device was installed at the outlet of the inlet tank. The flow discharge control device was composed of a regulating valve and an electromagnetic flowmeter. The accuracy of the electromagnetic flow meter was 0.2%. The conveyance channel was the D50 U-channel with a slope of 1/2000 and a total length of 13 m. The plate flowmeter was installed about 6.5 m away from the channel inlet. The length, width, and thickness of the angle-measuring plate were 50 cm, 5 cm, and 1 mm respectively, and it was joined at the top with the connecting shaft. The schematic diagram of the D50 U-channel section is shown in Figure 4. The recession flow device was composed of a recession flow pool and a channel. The end of the U-channel was connected to the recession flow channel. The water flowed into the recession flow pool through the recession flow channel and into the underground reservoir through the recession flow outlet, forming a circulation system. During the test, the flow velocity was measured with a propeller type velocimeter. The experimental system is shown in Figure 5.
3. Model Validation and Results Analysis
3.1. Flow Velocity Characteristics in the Channel during Flow Discharge Measurements with the Plate Flowmeter
Sections for measurement were selected 0.5 m away from the plate flowmeter both upstream and downstream in the channel. When the flow discharge (Q) in the U-channel was 250 m3/h, the flow velocity characteristics were studied during flow measurement with the plate flowmeter.
3.1.1. Transverse Flow Velocity Distribution of the Free Water Surface in the U-Channel
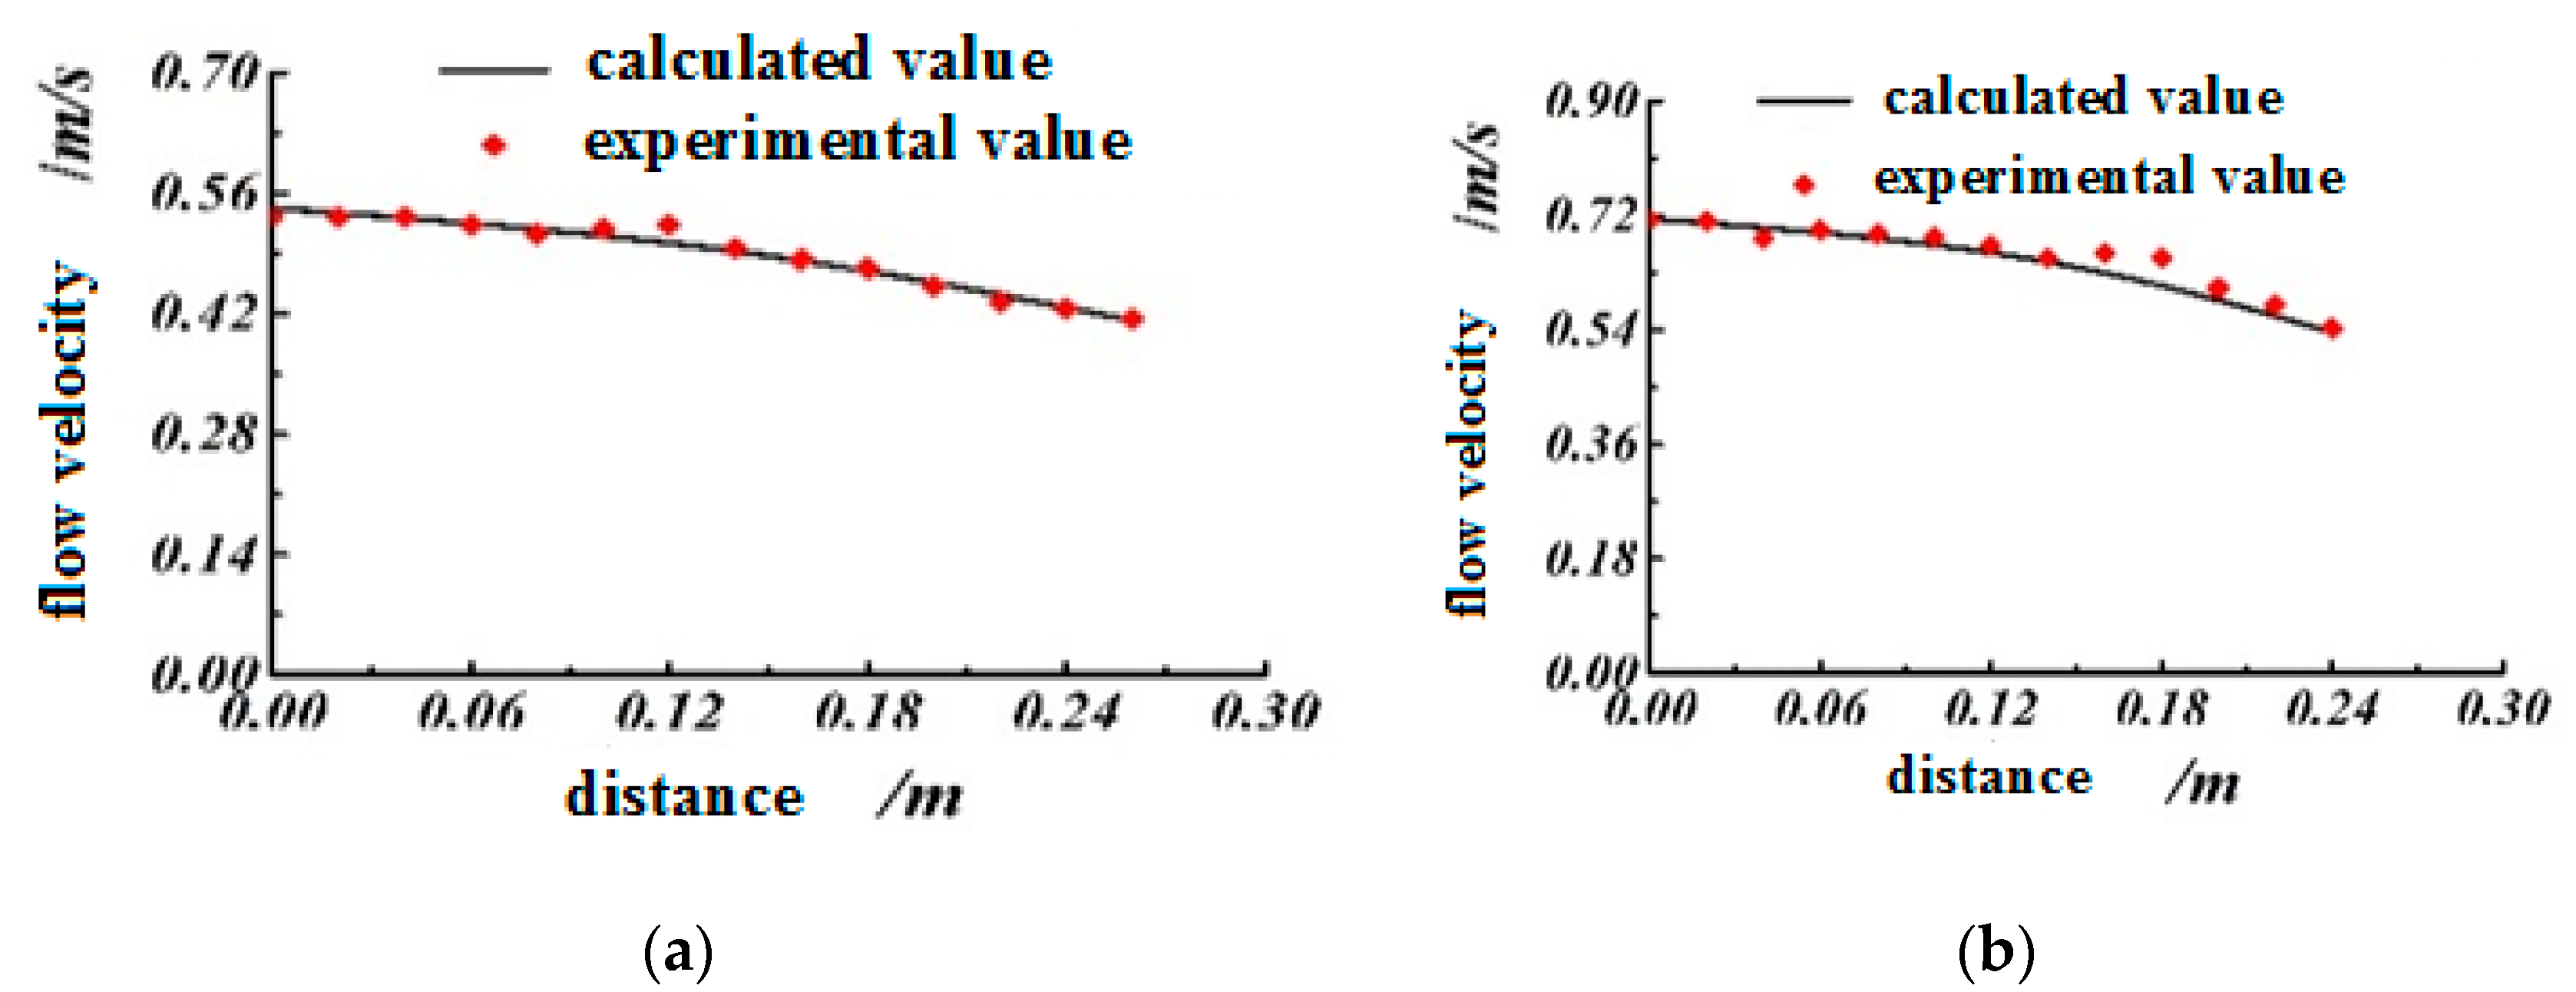
Figure 6 shows the transverse flow velocity distribution of the free water surface in the U-channel during the period of the experiment.
During flow measurement with the plate flowmeter, the transverse flow velocity of the free water surface in the sections of the channel upstream and downstream of the plate flowmeter decreased gradually along the channel center near the wall region, and the transverse flow velocity in the center of the channel was the largest.
3.1.2. Vertical Flow Velocity Distribution at the Center of a Section of the U-Channel
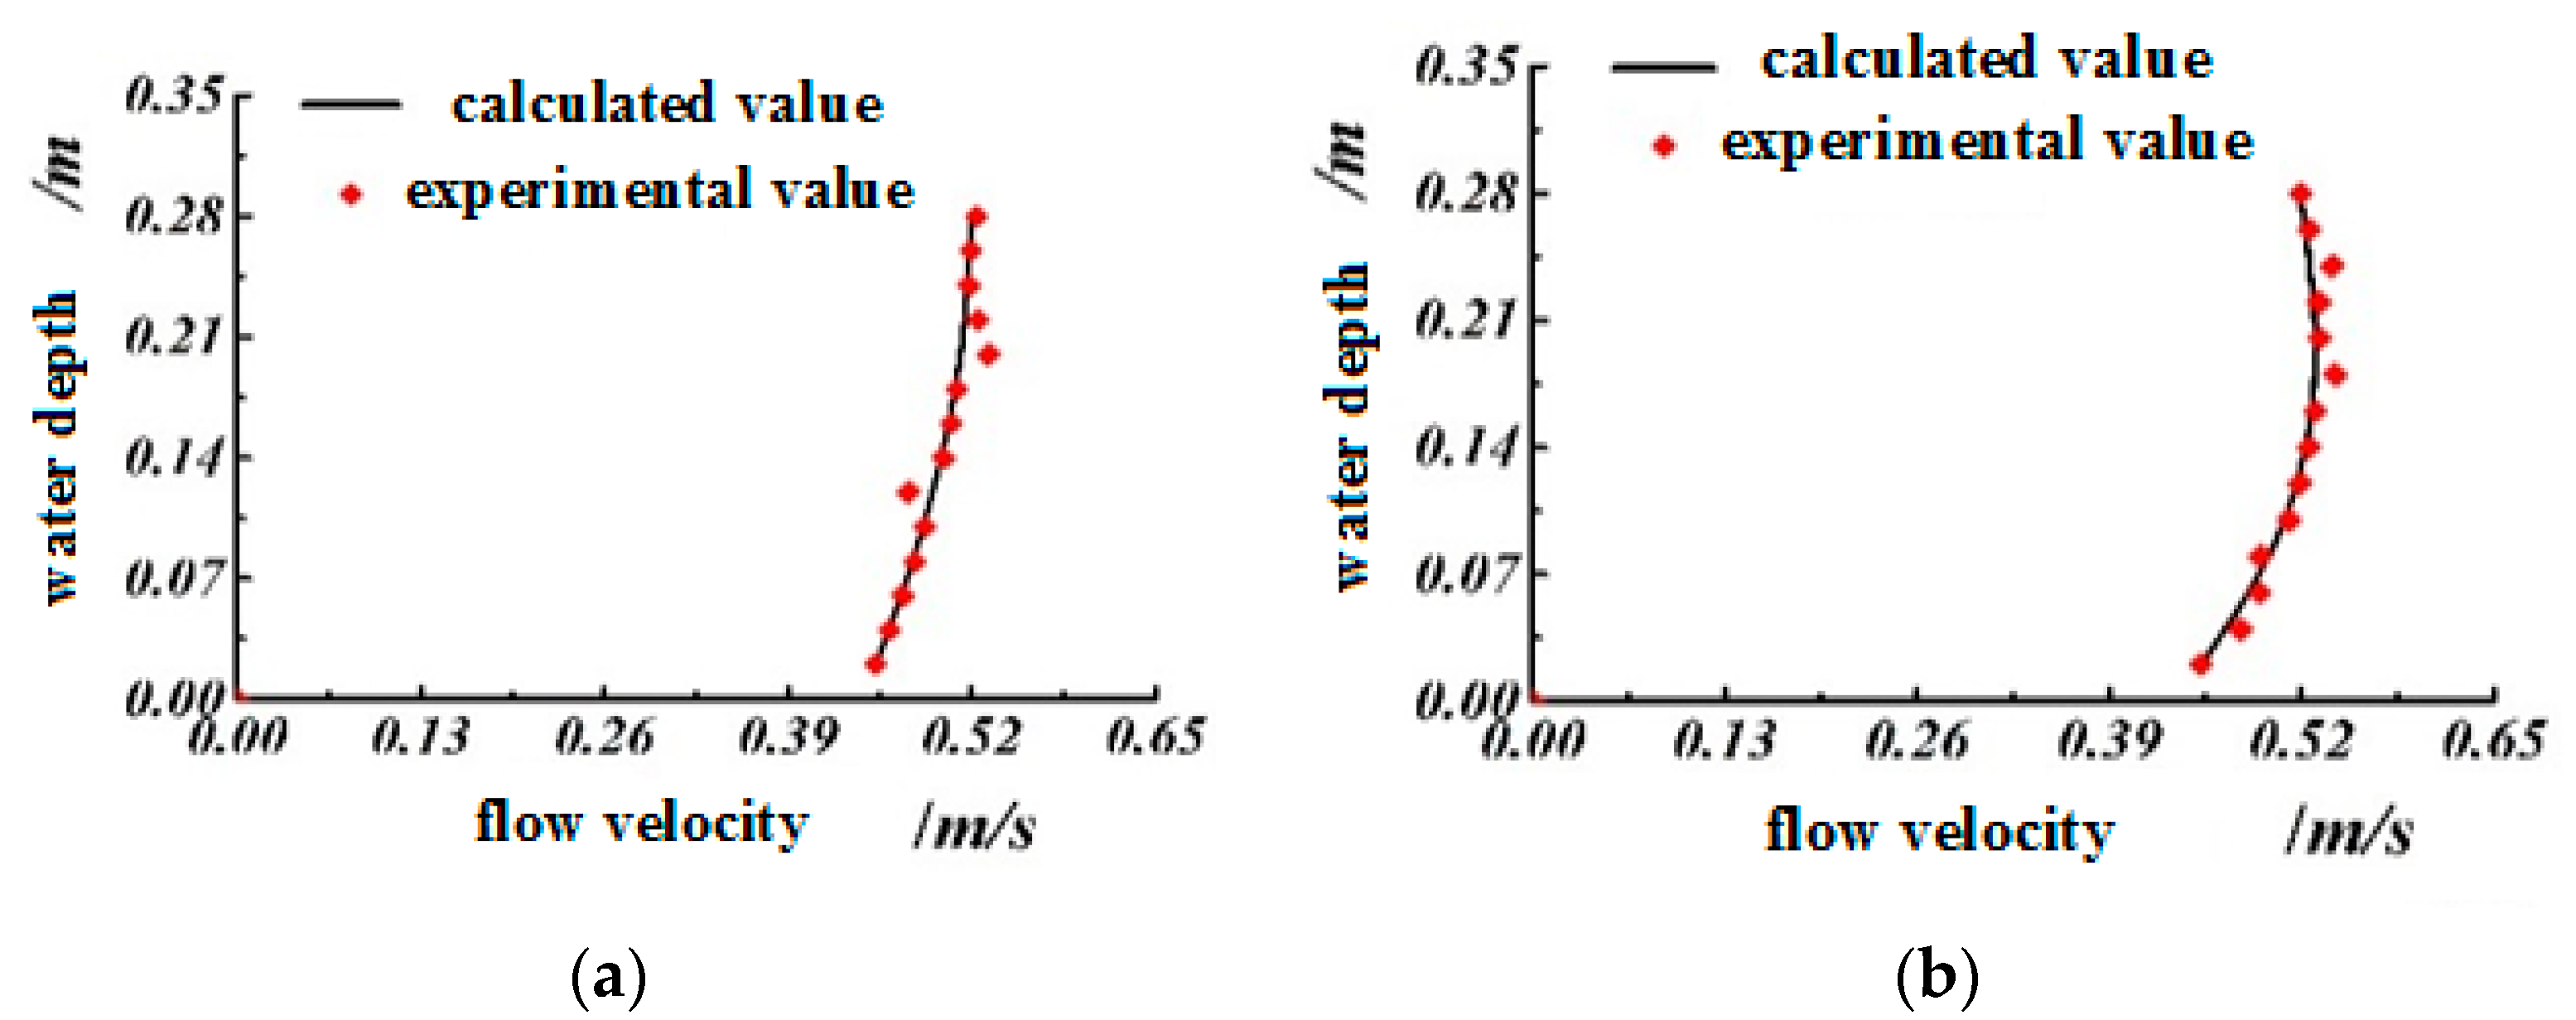
Figure 7 shows the vertical flow velocity distribution at the center of the channel section. During flow discharge measurements, the vertical flow velocity at the center of the section of the channel upstream from the plate flowmeter showed a gradually increasing trend along the bottom of the channel to the free liquid level. This showed that the plate flowmeter had little influence on the upstream vertical flow velocity. However, the downstream vertical flow velocity at the center of the channel first increased and then decreased from the bottom of the channel to the free liquid level. This indicated that the existence of the plate flowmeter changed the downstream vertical flow velocity distribution. The maximum vertical flow velocity was not located at the free liquid surface, but under it.
Figure 6 and Figure 7 show that during flow discharge measurement, the simulated transverse flow velocity and vertical flow velocity were basically consistent with the test results, with maximum relative errors of 5.3% and 6.2%, respectively, confirming that the flow velocity distribution in the flow discharge measurement process of the plate flowmeter simulated by Flow-3D software was feasible.
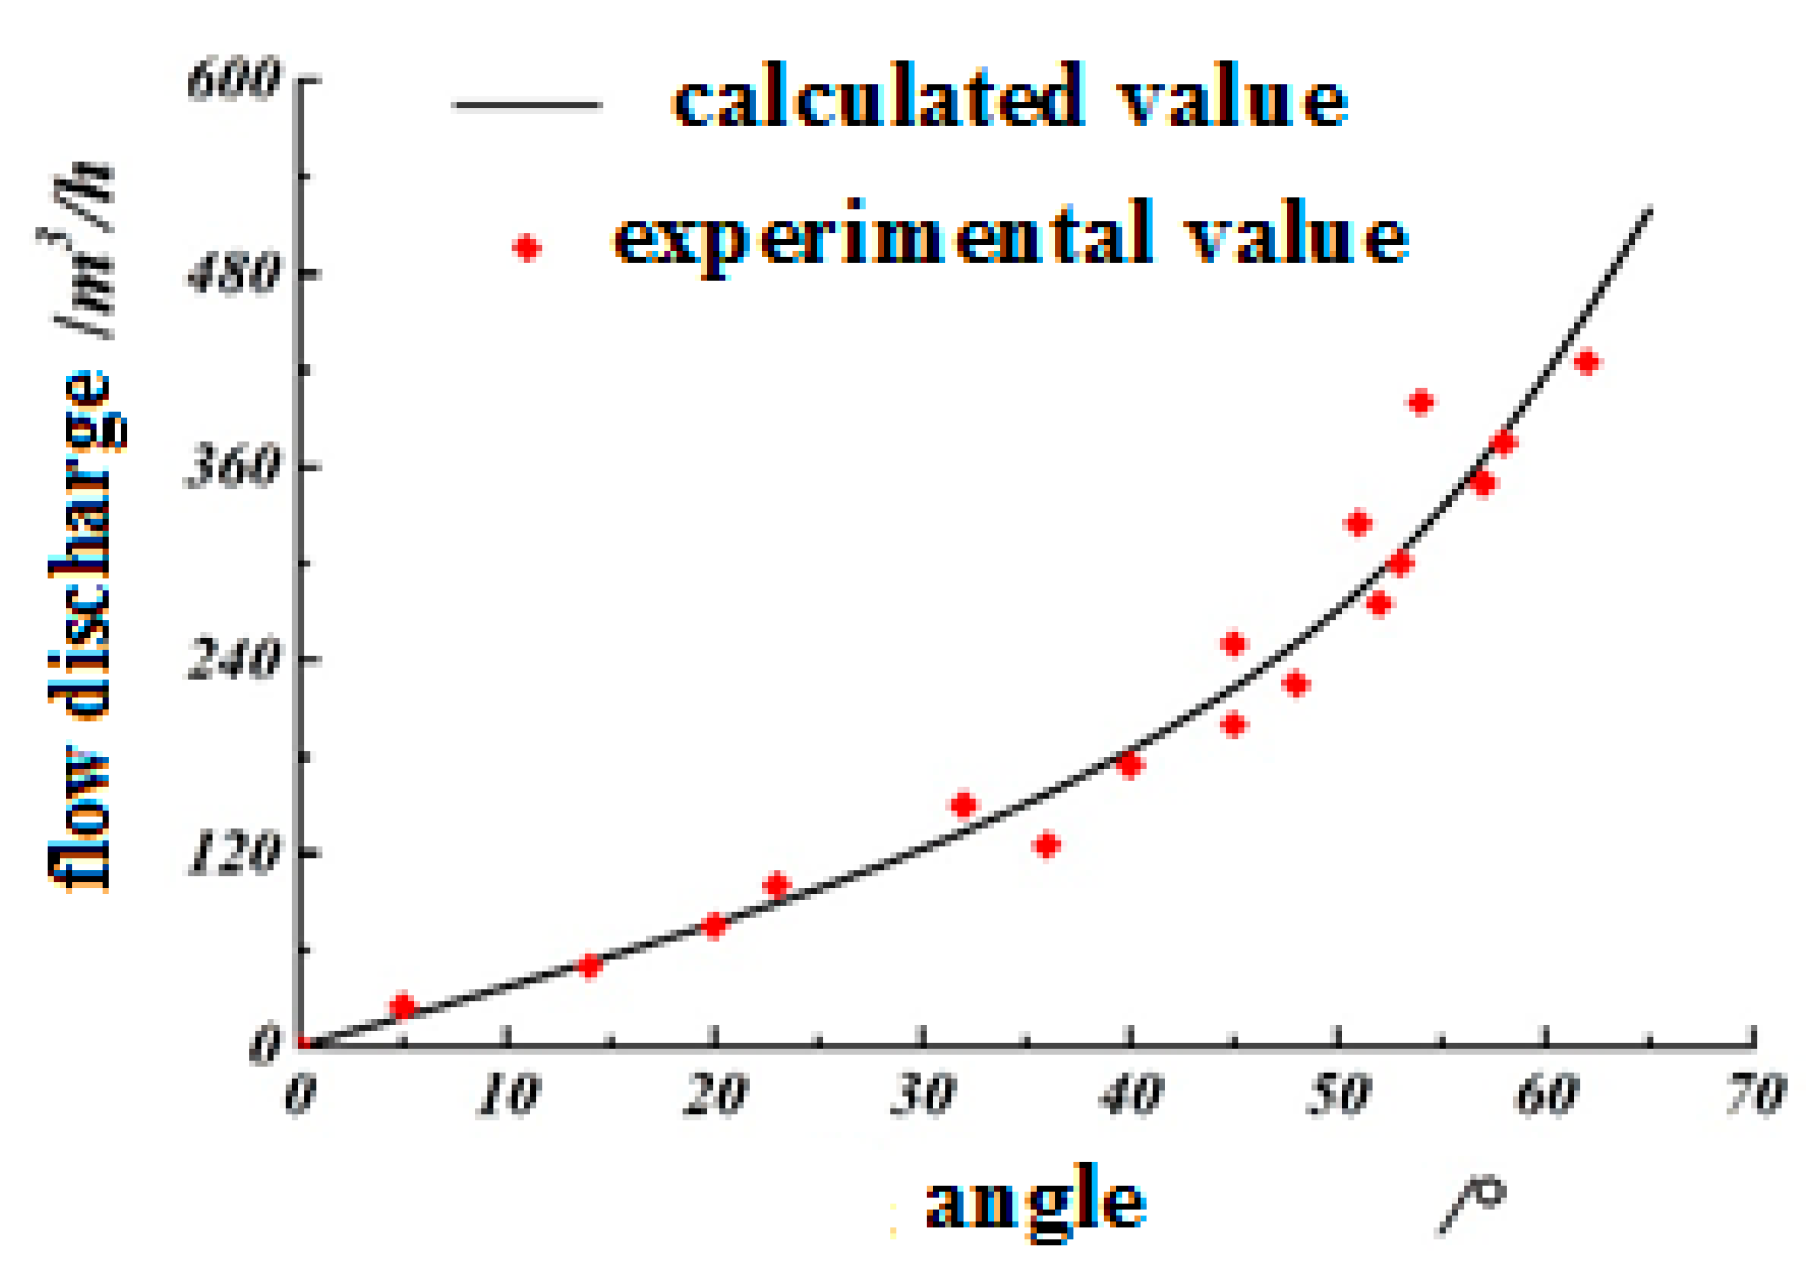
3.2. The Relationship between the Deflection Angle of the Angle-Measuring Plate and the Flow Discharge
Figure 8 shows the relationship between the deflection angle of the angle-measuring plate and the flow discharge. As can be seen, during flow measurement, the deflection angle of the angle-measuring plate increased with the flow discharge in the U-channel, and the simulated results were basically consistent with the test results The maximum relative error did not exceed 6.8%, which proved that the relationship between the flow discharge from the channel and the deflection angle of the angle-measuring plate, as analyzed through numerical simulations, was feasible.
3.3. The Velocity Distribution of the Channel Section during Flow Discharge Measurements with the Plate Flowmeter
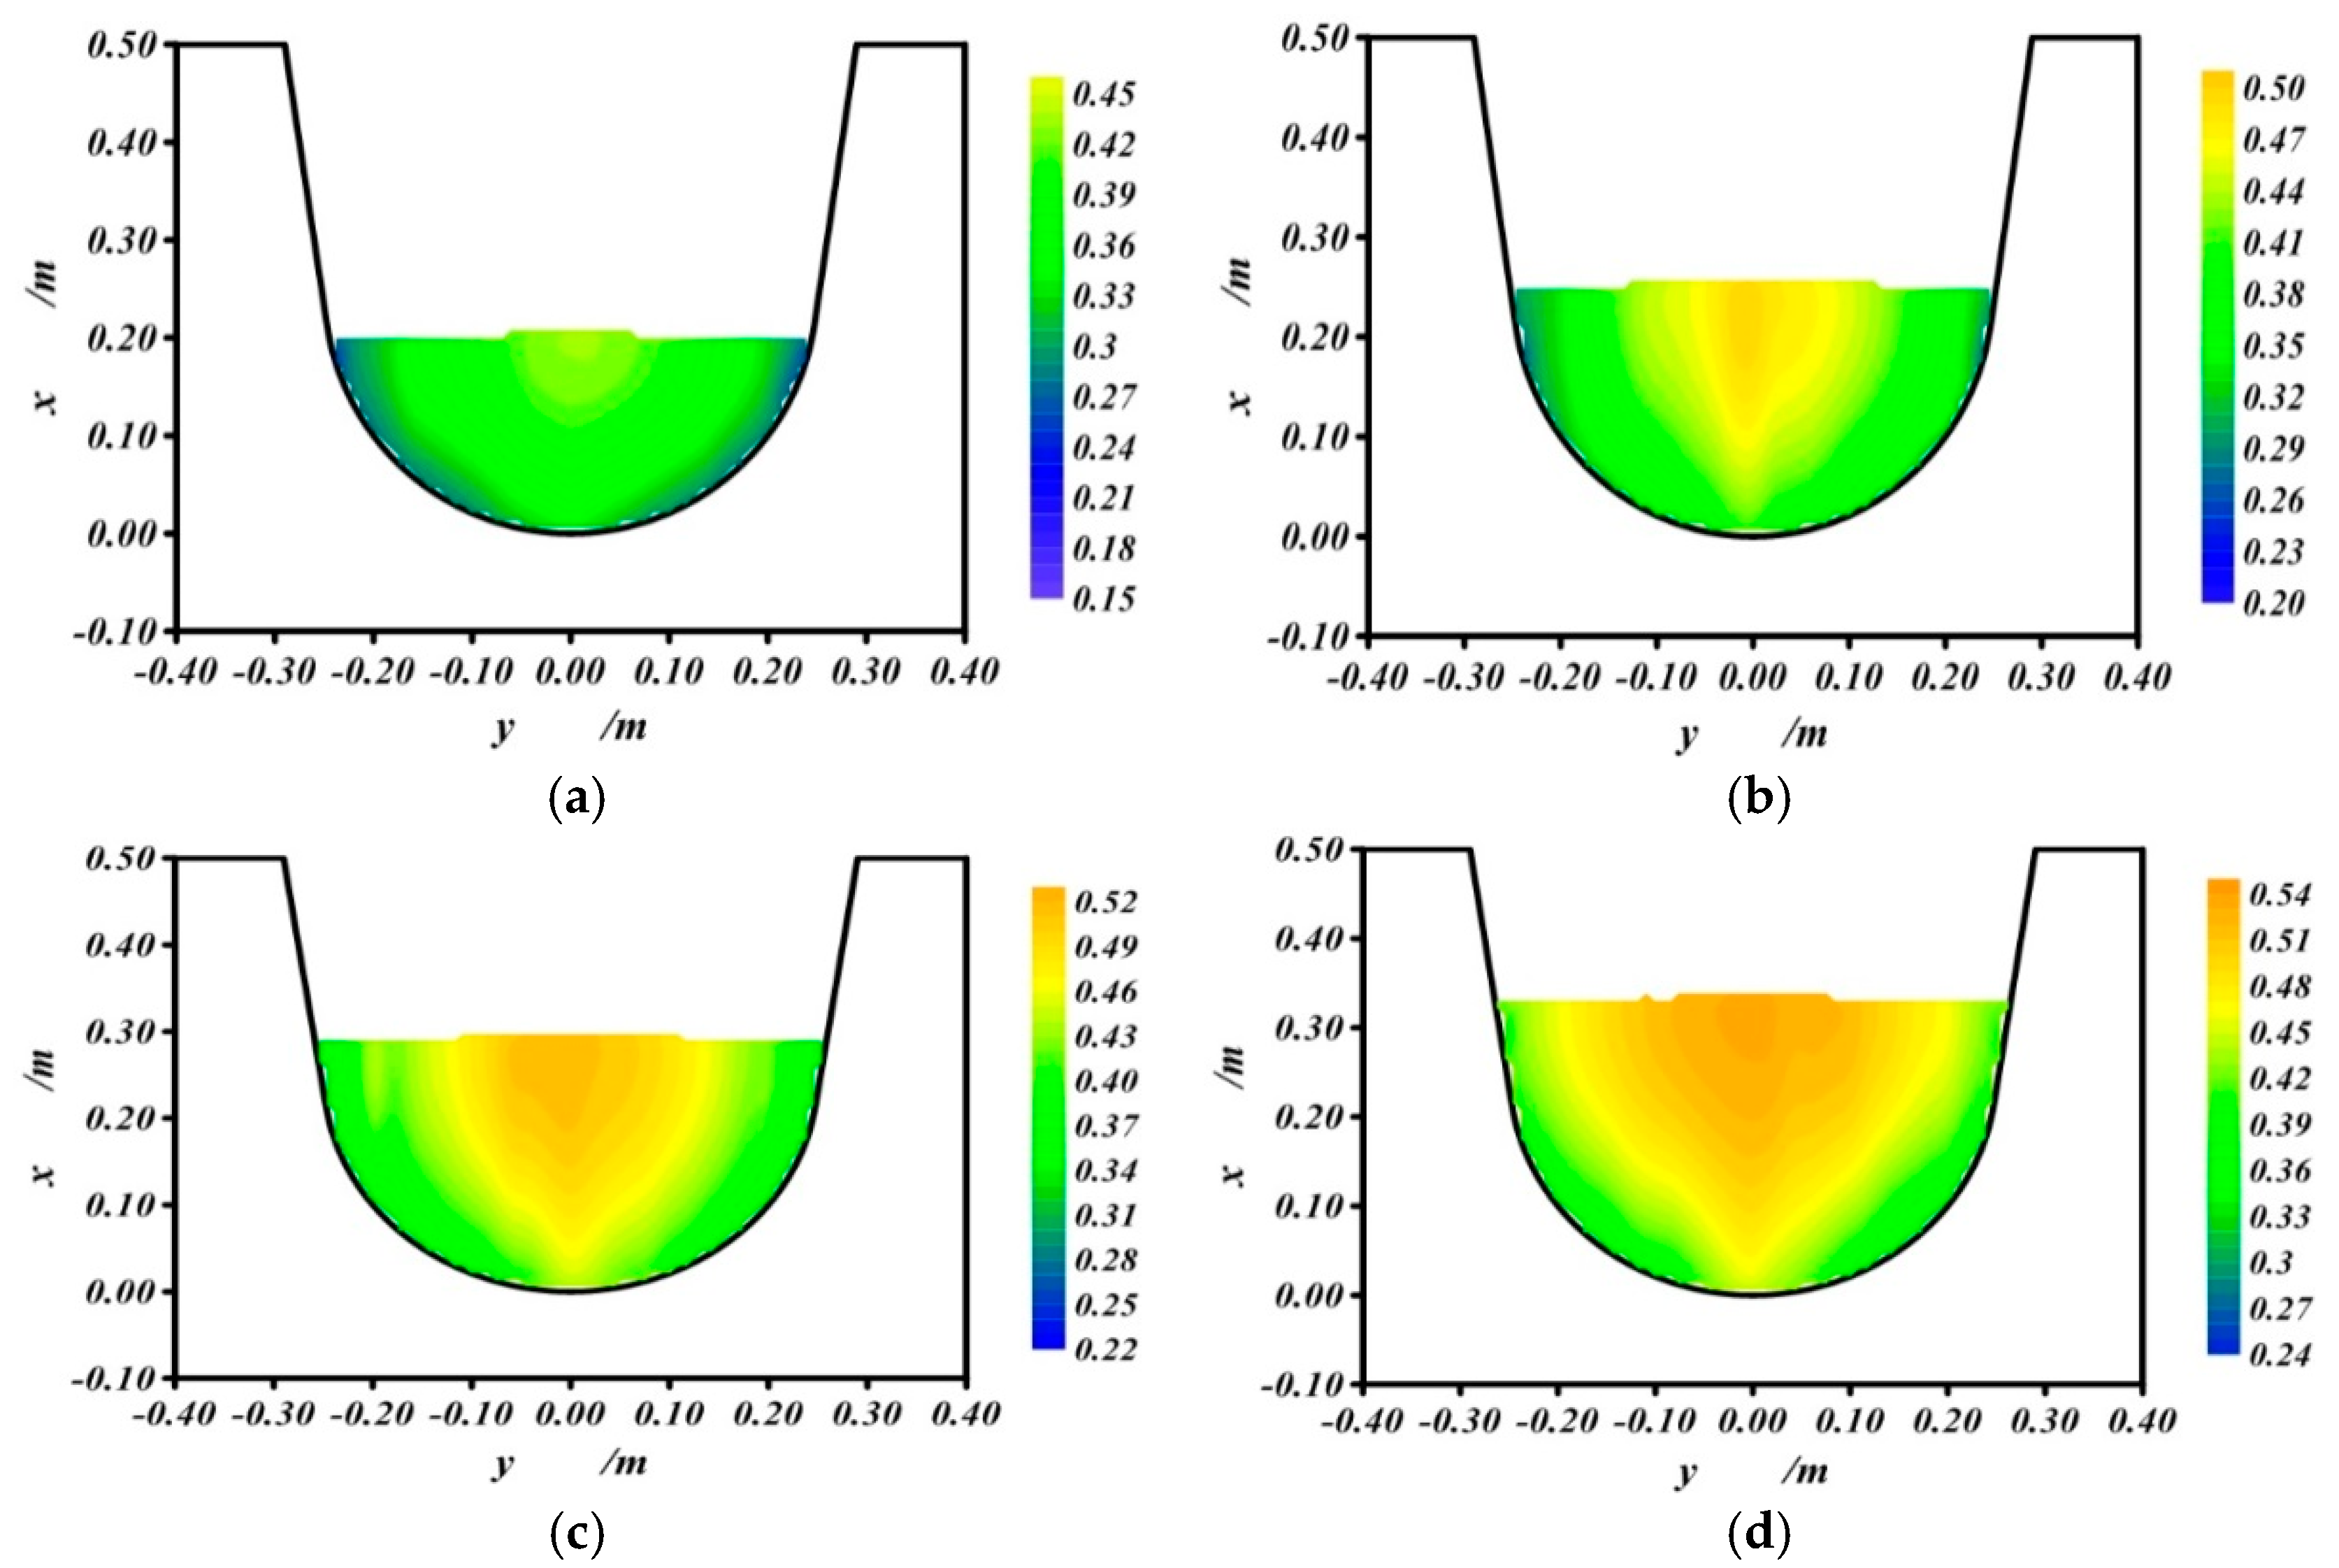
3.3.1. The Velocity Distribution of the Upstream Section of the Plate Flowmeter
Using the upstream section of the D50 U-channel (with a slope of i = 1/2000), which was 0.5 m away from the plate flowmeter, as an example, the velocity distributions of the section were analyzed at flow discharges (Q) of 125 m3/h, 175 m3/h, 225 m3/h, and 275 m3/h. The results are shown in Figure 9, indicating the following:
- (1)
- Under the same channel slope conditions, the increase in flow discharge in the U-channel led to an increase in the transverse flow area of the fluid. It can be seen from the above figure that the water level upstream of the plate flowmeter gradually increased, varying from 0.02 m to 0.31 m. The main reason was that the plate flowmeter swung downstream under the action of the flow, which caused a velocity wave inside the flow field. However, the wave velocity generated by the flow wave was very small compared to that that was upstream in the channel, and the disturbance wave did not spread upstream. The flow in the upstream area could be regarded as open channel uniform flow. According to the formula for open channel uniform flow, the water level rose gradually as the flow increased;
- (2)
- For the velocity distribution of any transverse section, the flow velocity upstream of that section caused by the action of the plate flowmeter decreased gradually as water depth increased. The main reason was that the flow was affected by the viscous force in the boundary area, resulting in the flow velocity near the wall being equal to zero. The farther away this was from the inner wall of the U-channel, the greater the flow velocity. This meant that after installing the plate flowmeter in the U-channel, the flow velocity of the upstream transverse section still showed a symmetrical and uniform distribution;
- (3)
- The flow velocity at the center of the water surface of the upstream section decreased in a divergent manner, which conformed to the law of decreasing velocity from the center to both sides of the open channel uniform flow. The main reason was that under the action of the flow, the angle-measuring plate swung downstream and remained in that position, which reduced the influence of the plate flowmeter on the upstream flow field. According to the experimental observations, the angle-measuring plate was located near the water surface under the flow action, which reduced the disturbance to the flow field below the water surface and improved the measurement accuracy to a certain extent.
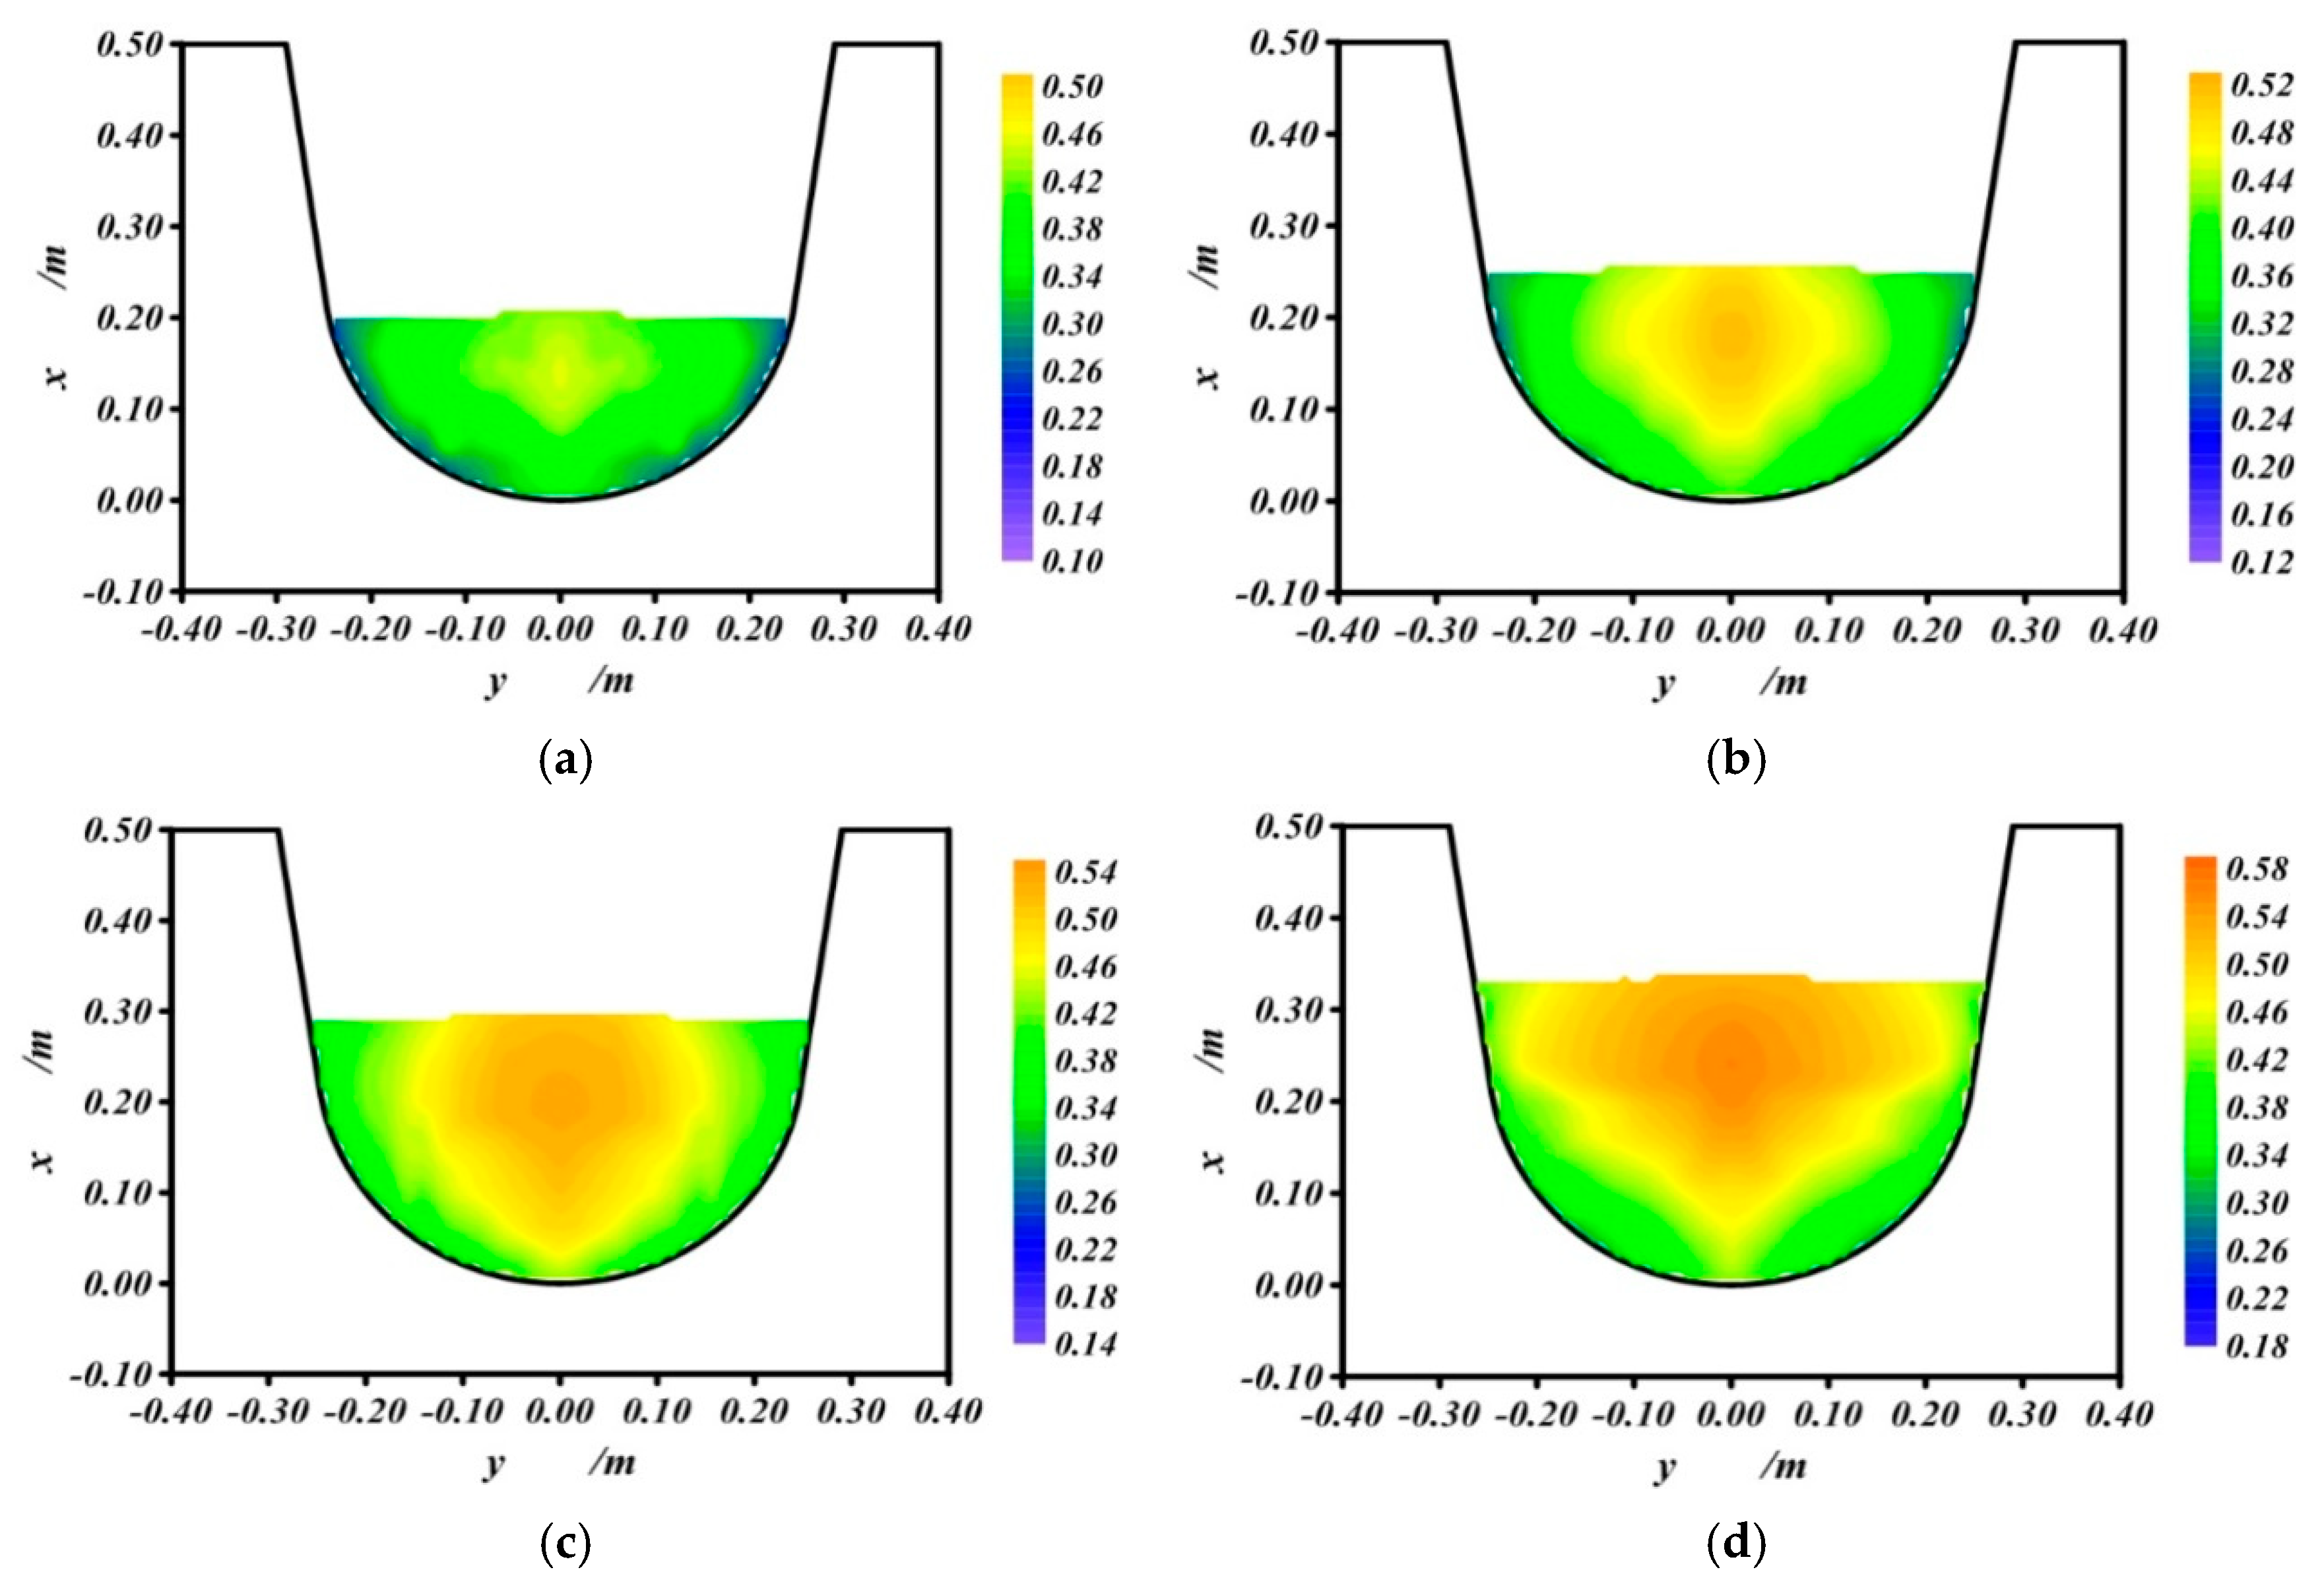
3.3.2. The Velocity Distribution of the Downstream Section of the Plate Flowmeter
Using the downstream section of the D50 U-channel (with a slope of i = 1/2000), which was 0.5 m away from the plate flow measuring device, as an example, the velocity distributions were analyzed at flow discharges (Q) of 125 m3/h, 175 m3/h, 225 m3/h, and 275 m3/h. The results are shown in Figure 10.
Under the same channel slope conditions, as flow discharge increased, the water level of the downstream transverse section of the channel also gradually increased, and the variation in the amplitude of the water level was basically consistent with that of the upstream section. The flow velocity of the downstream vertical section caused by the plate flowmeter first increased and then decreased from the water surface to the bottom of the channel. The maximum flow velocity was located below the water surface. The flow velocity of the downstream transverse section caused by the plate flow measuring device was greater in the middle and smaller on both sides, decreasing gradually from the center to the inner wall of the channel. The main reason was that the existence of the angle-measuring plate produced a local hydraulic jump in the downstream fluid, and the flow on both sides was also subjected to the viscosity and adsorption of the wall surface, making the flow velocity change, as mentioned above.
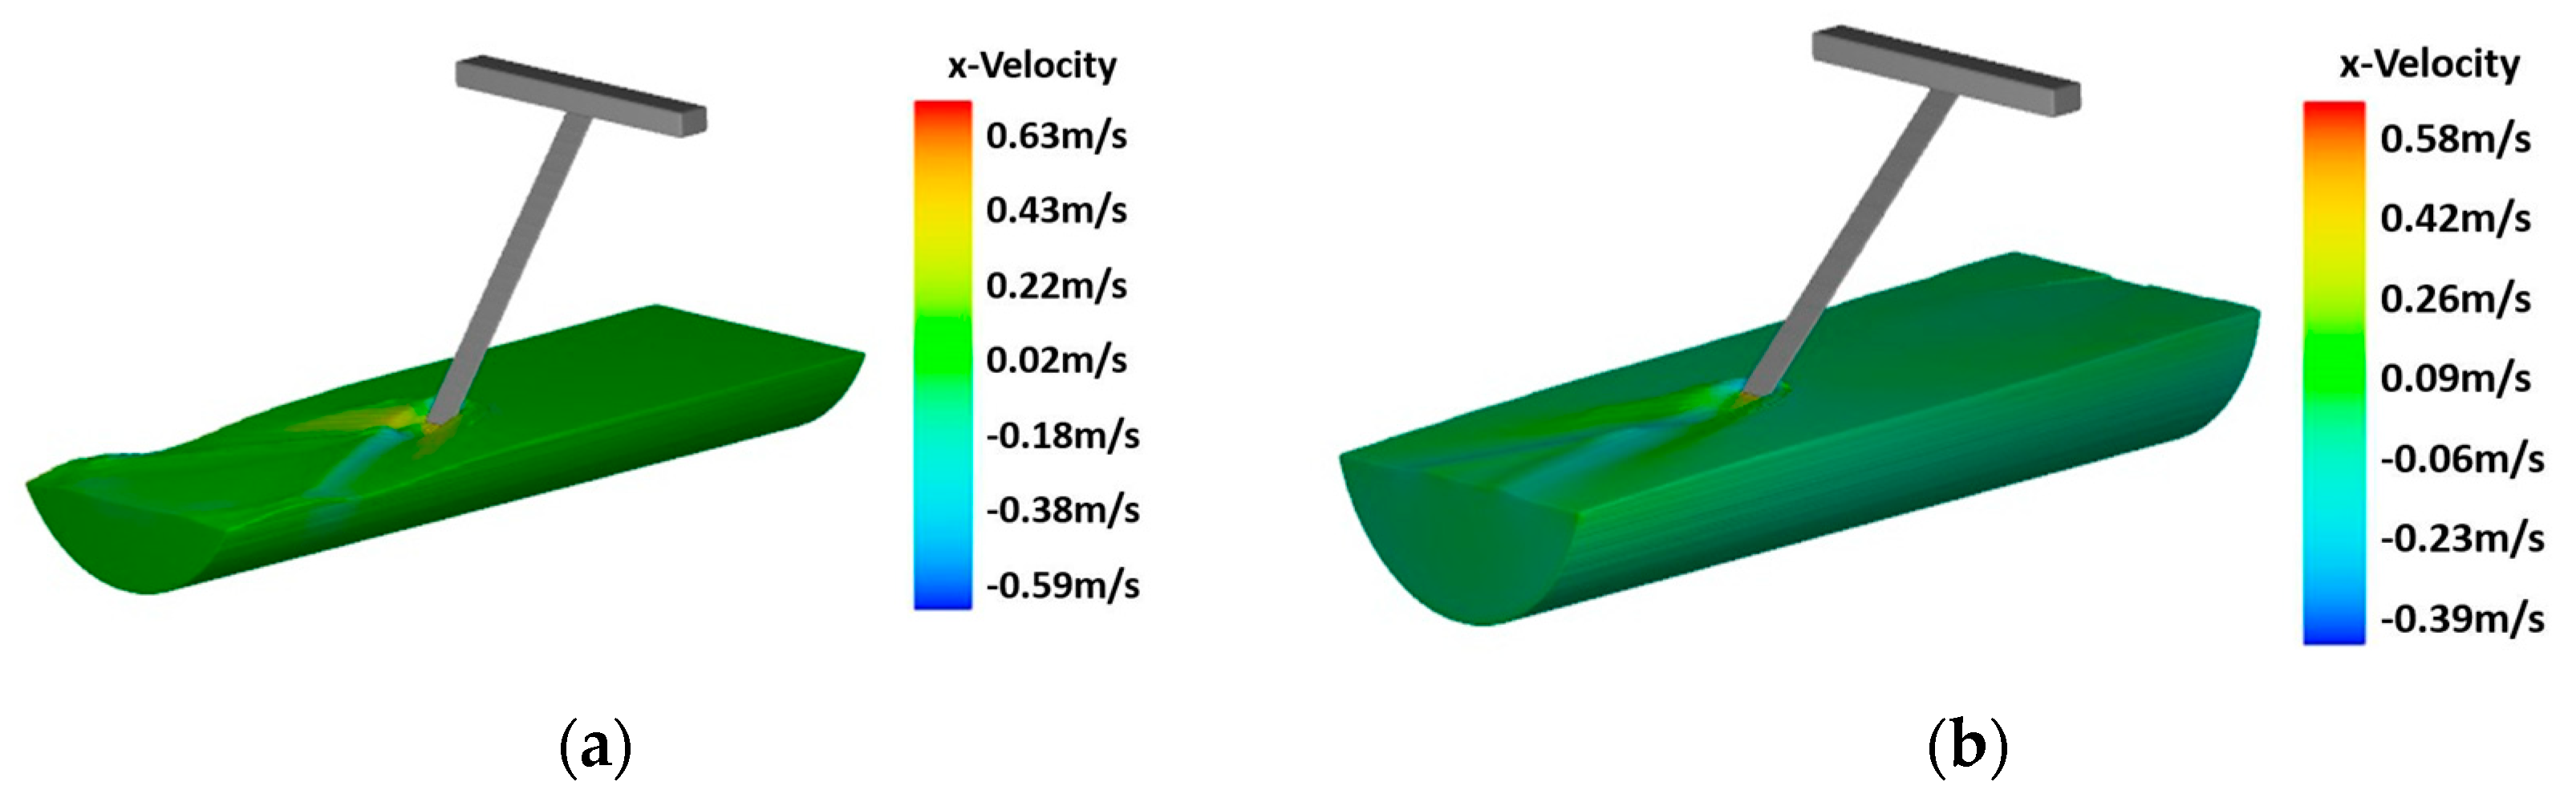
3.4. Study of the Range of Influence of the Plate Flowmeter on the Flow
Using the D50 U-channel (with a slope of i = 1/2000) as an example, the distribution of the flow velocity under the influence of the plate flowmeter was analyzed at water discharges (Q) of 150 m3/h and 450 m3/h. The results are shown in Figure 11.
The results indicated the following:
- (1)
- The angle-measuring plate swung downstream at a fixed angle under the action of the flow. There was an interaction between the flow and the angle-measuring plate, and the angle-measuring plate was located near the water surface during the flow discharge measurement process and did not disturb the flow below the water surface. A local water jump occurred only in the position where the angle-measuring plate was in contact with the flow, resulting in a slight increase in the water surface line;
- (2)
- The angle-measuring plate essentially floated on the water surface, indicating that it was related to the height of the downstream water level, which was related to the flow discharge in the U-channel;
- (3)
- The distributions of the flow velocity in the upstream and downstream sections of the plate flowmeter in the U-channel were symmetrical;
- (4)
- Water surface waves were generated in the downstream area near the angle-measuring plate. When water flowed around the angle-measuring plate, there was a local cavity low-pressure area behind the angle-measuring plate. When the pressure inside the liquid dropped below the liquid vapor pressure at the same temperature, a large number of bubbles were formed. The bubbles collapsed when they reached a higher pressure, which transformed the potential energy stored in the bubble into fluid kinetic energy in the smaller volume. When the fluid kinetic energy was transmitted to the angle-measuring plate in the fluid, a pressure pulse was generated on the surface of the angle-measuring plate;
- (5)
- The range of influence of the plate flowmeter on the flow in the U-channel was different for different flow discharges. For the flow conditions mentioned above, the maximum range of influence of the plate flowmeter on the flow in the U-channel was between 0.75 m upstream and 1.24 m downstream of the plate flowmeter. This conclusion can provide references for studying the flow discharge measuring performance and hydraulic characteristics of the plate flowmeter.
4. Conclusions
We concluded the following:
- (1)
- In the process of measuring flow discharge with the plate flowmeter, the transverse flow velocity, the vertical flow velocity, and the relationship between measured flow discharge and the deflection angle of the angle-measuring plate were simulated using Flow-3D software. The simulation results and test results were compared, and it was found that the simulation results were basically consistent with the experimental results. The maximum relative errors of the transverse flow velocity, the vertical flow velocity, and the relationship between measured flow discharge and the deflection angle of the angle-measuring plate were 5.3%, 6.2%, and 6.8% respectively, proving that it was feasible to use Flow-3D software to simulate the hydraulic characteristics of flow in the process of measuring flow discharge with the plate flowmeter;
- (2)
- In the process of measuring flow discharge with the plate flowmeter, the transverse flow velocities of the upstream and downstream free water surface decreased gradually from the center of the channel to the side wall of the channel. From the water surface to the bottom of the channel, the vertical flow velocity at the center of the upstream section of the channel decreased gradually. However, the vertical flow velocity at the center of the downstream section of the channel first increased and then decreased, and the maximum flow velocity was below the water surface;
- (3)
- The maximum range of influence of the plate flowmeter on the flow in the U-channel was between 0.75 m upstream and 1.24 m downstream of the plate flowmeter.
Author Contributions
Writing—original draft, Y.L.; formal analysis, Y.G.; investigation, X.J.; writing—review & editing, X.S. and funding acquisition, X.Z.
Funding
The research was funded by the National Natural Science Foundation of China (51179116, 51109155) and the Natural Science Foundation of Shanxi Province (2015011067, 201701D221137).
Acknowledgments
The research was supported by the Collaborative Innovation Center of New Technology of Water-Saving and Secure and Efficient Operation of Long-Distance Water Transfer Project at Taiyuan University of Technology.
Conflicts of Interest
The authors declare no conflict of interest.
Data Availability
The data used to support the findings of this study are available from the corresponding authors upon request.
References
- Liu, M.; Yang, L.; Min, Q. Water-saving irrigation subsidy could increase regional water consumption. J. Clean. Prod. 2019, 213, 283–288. [Google Scholar] [CrossRef]
- Wu, D.; Cui, Y.; Luo, Y. Irrigation efficiency and water-saving potential considering reuse of return flow. Agric. Water Manag. 2019, 221, 519–527. [Google Scholar] [CrossRef]
- Ferro, V. Simple flume with a central baffle. Flow Meas. Instrum. 2016, 9, 53–56. [Google Scholar] [CrossRef]
- He, W.; Wang, Y.; Cai, M. Cylinder flow measuring flume for U-shape channel. J. Hydraul. Eng. 2006, 37, 573–577. [Google Scholar]
- Liu, Y.; Wang, W.; Hu, X. Effect of bottom slope of U-shaped channel measurement with round head pier. J. Hydroelectr. Eng. 2015, 34, 57–63. [Google Scholar]
- Marais, G.V.R.; van Haandel, A.C. Design of grit channels controlled by Parshall flumes. Water Sci. Technol. 1996, 33, 195–210. [Google Scholar] [CrossRef]
- Heiner, B.; Savage, B.M.; Barfuss, S.L. Parshall flume discharge correction coefficients through modelling. Water Manag. 2015, 167, 279–287. [Google Scholar]
- Vatankhah, A.R.; Mahdavi, A. Simplified procedure for design of long-throated flumes and weirs. Flow Meas. Instrum. 2012, 26, 79–84. [Google Scholar] [CrossRef]
- Shen, B.; Ji, Q.; Cheng, J. Design method of long-throated flumes. J. Drain. Irrig. Mach. Eng. 2003, 21, 23–26. [Google Scholar]
- Jeffrey, A. Tuhtan, Juan Francisco Fuentes-Perez, Gert Toming, Maarja KruusmaaFlow velocity estimation using a fish-shaped lateral line probe with product-moment correlation features and a neural network. Flow Meas. Instrum. 2017, 54, 1–8. [Google Scholar]
- Lv, H.; Liu, H.; Zhu, X.; Pan, Z. Experimental research on airfoil-shaped flow flume. Trans. Chin. Soc. Agric. Eng. 2006, 22, 119–123. [Google Scholar]
- Lv, H.; Zhu, F.; Ma, X.; Pan, Z. Improvement of Flow Rate Formula of Un-sill Parobolic Throatless Flume. Irrig. Drain. 1999, 18, 30–34. [Google Scholar]
- Ma, Y.; Fan, M.; Wang, A.; Ma, S. Research and applications of real-time discharge telemetry system in irrigation district based on cutthroat flume. J. Shandong Agric. Univ. (Nat. Sci.) 2013, 44, 86–89. [Google Scholar]
- Zhang, Z.; Xiao, H.; Mao, Z.; Chen, J. Research on standardized designment and manufacturing process of straight wall type water measuring flume in U-Shaped channel. J. Xi’an Univ. Technol. 2011, 27, 417–422. [Google Scholar] [CrossRef]
- Lv, H.; Zhu, X.; Zhang, C.; Lu, D. Selection Type and Design for Flow Measurement Flume with Parobolic Throat in U—Shaped Channel. Irrig. Drain. 2001, 20, 55–57. [Google Scholar]
- Liu, Y. A brief discussion on measuring water of triangle weir. Earthq. Res. Shanxi 1982, 3, 3–6. [Google Scholar]
- Ma, X.; Zhu, X.; Wang, W.; Yin, Y. Development of Multimedia Software for Design of Parabolic Thin-plate Weir for U-shaped Channel Flow Measurement. Res. Soil Water Conserv. 2002, 9, 78–81. [Google Scholar]
- Liu, Y.; Wang, W.; Hu, X. Experiment and simulation of factors affecting flow measurement of water-measuring column with round head in U-shaped channel. Trans. Chin. Soc. Agric. Eng. 2014, 19, 105–114. [Google Scholar]
- Sojka, M.; Kozłowski, M.; Stasik, R.; Napierała, M.; Kęsicka, B.; Jaskuła, J.; Liberacki, D.; Bykowski, J.; Wróżyński, R. Sustainable Water Management in Agriculture—The Impact of Drainage Water Management on Groundwater Table Dynamics and Subsurface Outflow. Sustainability 2019, 11, 4201. [Google Scholar] [CrossRef] [Green Version]
- Mou, X.; Li, C.; Li, G.; Li, J. Research on Hydraulic Characteristics Numerical Simulation of U-shaped Channel Straight Wall Measuring Flume. J. North China Inst. Water Conserv. Hydroelectr. Power 2010, 31, 16–19. [Google Scholar]
- Zhong, X.; Ma, X.; Wang, W.; Xu, K.; Fan, K. Numerical simulation of hydraulic properties of cut-throat flow measuring flume on trapezoidal canal with arc bottom. J. Northwest AF Univ. (Nat. Sci. Ed.) 2016, 44, 218–224. [Google Scholar]
- Zhong, X.; Ma, X.; Yang, P. Numerical Simulation on Discharge Relation of Arc-Based Trapezoidal Canal and Cut-throat Flow Measurement Flume. Res. Soil Water Conserv. 2016, 23, 340–345. [Google Scholar]
- Sun, B.; Lv, H.; Pan, Z. Numerical simulation of hydraulic characteristics on the airfoil-shaped measuring-flume in rectangular canal. Agric. Res. Arid Areas 2010, 28, 155–158. [Google Scholar]
- Sun, B.; Lv, H.; Zhang, K.; Shi, X.; Dinh, T.H.; Zhou, Y.S. Numerical simulation and experimental research of hydraulic jumps on the airfoil-shaped measuring flume in U-shaped canal. J. Exp. Fluid Mech. 2013, 27, 65–71. [Google Scholar]
- Dinh, T.H.; Sun, B.; Yu, J.; Lv, H. Study on Hydraulic Jump Characteristics of Airfoil-shaped Measuring Flume in U-shaped Channel. Water Sav. Irrig. 2012, 4, 32–36. [Google Scholar]
- Ji, Q.; Yuan, X.; Ge, Y.; Pang, S. Numerical simulation research on hydraulic characteristics of cylinder measuring flume in trapezoidal channel. J. Irrig. Drain. 2012, 31, 59–61. [Google Scholar]
- Liu, Y.; Wang, W.; Hu, X.; Liu, J. Experiment and simulation of factors affecting flow measurement of water-measuring column with round head in U-shaped channel. Trans. Chin. Soc. Agric. Eng. 2014, 30, 97–106. [Google Scholar]
- Huang, S.; Zhang, X.; Su, X.; Ou, G. Fluid-solid interaction analysis of centrifugal pump based on whole flow field. Fluid Mach. 2015, 43, 38–42. [Google Scholar]
- Xiao, R.; Zhu, W.; Yang, W.; Liu, J.; Wang, F. Stress analysis of Francis hydraulic turbine runner based on FSI. J. Drain. Irrig. Mach. Eng. 2013, 31, 862–866. [Google Scholar]
- Wang, J. Research on Flow Measurement Performances and Hydraulic Characteristics of Standardized U-Shaped Channel Flow Measuring Device in Shanxi Province; Taiyuan University of Technology: Taiyuan, China, 2017. [Google Scholar]
- Guo, Z. The Experimental Study on Flow Measurement Performance and Hydraulic Characteristics of D50U Shaped Channel Plate Column Combined Flow Measurement Device; Taiyuan University of Technology: Taiyuan, China, 2018. [Google Scholar]
- Guo, R.; Zhou, Y. Research on portable automatic ultrasonic flow measurement device for U-shape canal. Yangtze River 2018, 49, 49–51. [Google Scholar]
Figure 1.
Diagram of the plate flowmeter: 1—leveling knob; 2—stainless steel stent; 3,8—levels; 4—ultrasonic probe; 5—power and signal processing module; 6—angle sensor; 7—angle-measuring plate; 9—capacitive touch screen; 10—scalable steel frame.
Figure 1.
Diagram of the plate flowmeter: 1—leveling knob; 2—stainless steel stent; 3,8—levels; 4—ultrasonic probe; 5—power and signal processing module; 6—angle sensor; 7—angle-measuring plate; 9—capacitive touch screen; 10—scalable steel frame.

Figure 2.
Mathematical model of the local measurement system: (a) the inlet flow stabilizing device, (b) the tail-water outflow device, (c) and the channel testing device.
Figure 2.
Mathematical model of the local measurement system: (a) the inlet flow stabilizing device, (b) the tail-water outflow device, (c) and the channel testing device.

Figure 3.
Schematic diagram of mesh generation: (a) front view; (b) left view; (c) top view.


Figure 4.
Cross-sectional diagram of a U-channel.

Figure 5.
Experimental system device: (a) schematic diagram; (b) physical diagram.

Figure 6.
Transverse flow velocity distribution of the free water surface during flow measurement with the plate flowmeter: (a) upstream transverse flow velocity; (b) downstream transverse flow velocity.
Figure 6.
Transverse flow velocity distribution of the free water surface during flow measurement with the plate flowmeter: (a) upstream transverse flow velocity; (b) downstream transverse flow velocity.

Figure 7.
The vertical flow velocity distribution at the center of the channel section in the process of flow measurement with the plate flowmeter: (a) upstream vertical flow velocity; (b) downstream vertical flow velocity.
Figure 7.
The vertical flow velocity distribution at the center of the channel section in the process of flow measurement with the plate flowmeter: (a) upstream vertical flow velocity; (b) downstream vertical flow velocity.

Figure 8.
The relationship between the flow discharge and the angle in the process of using a plate flowmeter in a U-channel.
Figure 8.
The relationship between the flow discharge and the angle in the process of using a plate flowmeter in a U-channel.

Figure 9.
The velocity distribution of the upstream section of the plate flowmeter: (a) Q = 125 m3/h, (b) Q = 175 m3/h, (c) Q = 225 m3/h, and (d) Q = 275 m3/h.
Figure 9.
The velocity distribution of the upstream section of the plate flowmeter: (a) Q = 125 m3/h, (b) Q = 175 m3/h, (c) Q = 225 m3/h, and (d) Q = 275 m3/h.

Figure 10.
The velocity distribution of the downstream section of the plate flowmeter: (a) Q = 125 m3/h, (b) Q = 175 m3/h, (c) Q = 225 m3/h, and (d) Q = 275 m3/h.
Figure 10.
The velocity distribution of the downstream section of the plate flowmeter: (a) Q = 125 m3/h, (b) Q = 175 m3/h, (c) Q = 225 m3/h, and (d) Q = 275 m3/h.

Figure 11.
The distribution of the flow velocity range of influence on the plate flowmeter: (a) Q = 150 m3/h (x direction), (b) Q = 450 m3/h (x direction), (c) Q = 150 m3/h (y direction), (d) Q = 450 m3/h (y direction), (e) Q = 150 m3/h (z direction), and (f) Q = 450 m3/h (z direction).
Figure 11.
The distribution of the flow velocity range of influence on the plate flowmeter: (a) Q = 150 m3/h (x direction), (b) Q = 450 m3/h (x direction), (c) Q = 150 m3/h (y direction), (d) Q = 450 m3/h (y direction), (e) Q = 150 m3/h (z direction), and (f) Q = 450 m3/h (z direction).


© 2019 by the authors. Licensee MDPI, Basel, Switzerland. This article is an open access article distributed under the terms and conditions of the Creative Commons Attribution (CC BY) license (http://creativecommons.org/licenses/by/4.0/).
Share and Cite
MDPI and ACS Style
Li, Y.; Gao, Y.; Jia, X.; Sun, X.; Zhang, X. Numerical Simulations of Hydraulic Characteristics of A Flow Discharge Measurement Process with A Plate Flowmeter in A U-Channel. Water 2019, 11, 2382. https://doi.org/10.3390/w11112382
AMA Style
Li Y, Gao Y, Jia X, Sun X, Zhang X. Numerical Simulations of Hydraulic Characteristics of A Flow Discharge Measurement Process with A Plate Flowmeter in A U-Channel. Water. 2019; 11(11):2382. https://doi.org/10.3390/w11112382
Chicago/Turabian StyleLi, Yongye, Yuan Gao, Xiaomeng Jia, Xihuan Sun, and Xuelan Zhang. 2019. "Numerical Simulations of Hydraulic Characteristics of A Flow Discharge Measurement Process with A Plate Flowmeter in A U-Channel" Water 11, no. 11: 2382. https://doi.org/10.3390/w11112382
Note that from the first issue of 2016, this journal uses article numbers instead of page numbers. See further details here.