Streamflow and Sediment Declines in a Loess Hill and Gully Landform Basin Due to Climate Variability and Anthropogenic Activities


1
School of Hydraulic Engineering, Dalian University of Technology, Dalian 116024, China
2
Science and Technology Promotion Centre, Ministry of Water Resources P.R.C., Beijing 100038, China
3
Three Gorges Construction and Operation Management Department, China Three Gorges Corporation, Yichang 443133, China
4
College of Hydrology and Water Resources, Hohai University, Nanjing 210098, China
*
Author to whom correspondence should be addressed.
Water 2019, 11(11), 2352; https://doi.org/10.3390/w11112352
Submission received: 24 September 2019
/
Revised: 5 November 2019
/
Accepted: 7 November 2019
/
Published: 9 November 2019
(This article belongs to the Section Hydrology)
Abstract
:Streamflow and sediment runoff are important indicators for the changes in hydrological processes. In the context of environmental changes, decreases in both streamflow and sediment (especially in the flood season) are often observed in most of the tributaries of the middle Yellow River in China’s Loess Plateau. Understanding the effect of human activities could be useful for the management of soil and water conservation (SWC) and new constructions. In this paper, changes in streamflow and sediment during the flood season (June–September) of the 1966–2017 period in a typical loess hill and gully landform basin were analyzed. Basin-wide rainfall of the flood season decreased nonsignificantly with an average rate of −0.6 mm/flood season for the whole study period by using the trend-free pre-whitening based Mann–Kendall trend test, while the decreasing rate was weakened on the time scale. A remarkable warming trend (1985–1999) and two decreasing trends (1966–1984 and 2000–2017) were observed, and the overall increasing trend could be found in air temperature series with a rate of 0.01 °C/flood season during the study period. Statistical models were developed to describe the rainfall-runoff and rainfall-sediment processes in the pre-impact period (when the hydrological series was stationary). Furthermore, the relative effects of climate variability and human activities on hydrological changes were quantified. Results proved the dominant role of human activities (versus climate variability) on the reductions of both streamflow and sediment load. The relative contribution of human activities to streamflow decrease was 84.6% during the post-impact period 1995–2017, while the contributions were 48.8% and 80.1% for two post-impact periods (1982–1996 and 1997–2017), respectively, to the reduction of sediment load. Besides, the effect of the exclusion of anomalous streamflow or sediment events on change-point detection was also analyzed. It indicated that the anomalous events affect the detection of change points and should be given full consideration in order to decide whether to remove them in the change-point detection. Otherwise, the full series with anomalous samples will completely affect the attribution results of hydrological changes. We also suggest that large-scale SWC measures with different construction quality and operational life could intercept and relieve most floods and high sediment concentration processes, but may amplify the peaks of streamflow and sediment when the interception capacities are exceeded under the condition of extreme rainstorm events.
1. Introduction
Environmental changes caused by climate variability and anthropogenic activities affect the hydrological processes, with two important indicators of changes in streamflow and sediment runoff [1,2,3,4,5]. In most of the watersheds in North China, water resource availability is low because the water demand in arid areas is far greater than the amount of water available [6,7,8,9,10]. In the past decades, soil erosion has been a great threat to the ecological environment and flood control safety. People recognize that soil erosion is a great hazard to the ecological environment and flood control safety, thus encouraging the construction of soil and water conservation (SWC) measures and ecological restoration projects, including hillslope terracing and warping dam construction, afforestation, and pasture reestablishment [11]. In agriculture, a terrace is a piece of sloped plane that has been cut into a series of successively receding flat surfaces or platforms, which resemble steps, for the purposes of more effective farming. A warping dam, also called silt dam or check dam, is a dam built in a gully formed in a soil and water loss area for the purpose of creating newly arable land by silt deposition in front of the dam, decreasing gully slope, and mitigating gully erosion by raising the gully-bed step-by-step. The Loess Plateau is a typical region with the implementation of SWC measures, which have eased soil erosion and reduced sediment concentrations in rivers [12,13,14]. However, climate variability is also very important and sometimes dominate contribution to hydrological regime changes in some basins [15,16] and some periods [17]. It is, therefore, useful to attribute changes in streamflow and sediment to either human impacts or climate changes.
Previous studies have conducted attribution analysis of streamflow and sediment changes. For example, Nilawar and Waikar [2] use the Soil & Water Assessment Tool (SWAT) model to determine the relative effects of climate and land use changes on streamflow and sediment concentration in an Indian basin. Tan and Gan [18] estimated the higher proportions of human contribution than that of climatic contribution to the generally decreased streamflow of Canada in recent decades. Zhao et al. [19] quantified the anthropogenic and climatic contributions to changes in water discharge and sediment load of the Yangtze River and found that the decrease in sediment load was mainly caused by human activities, especially dam construction. Awotwi et al. [20] analyzed the climate and anthropogenic impacts on runoff in the Lower Pra River Basin of Ghana, suggesting that the dominant small-scale alluvial gold mining activity significantly contributes to the net runoff variability. Restrepo and Escobar [21] showed that the rate of anthropogenic soil erosion in the Magdalena basin (1980–2010) probably exceeds the rate of climate-driven erosion by several orders of magnitude. Pokhrel et al. [22] conducted a review of the integrated effects of changing climate, land use, and dams on Mekong River hydrology. In China’s Loess Plateau, there are also many similar studies for the basins with the loess hill and gully landform [23,24,25,26,27]. It was found that increasing vegetation coverage was the primary factor driving the significant reduction in sediment load from the 1960s in some basins in the Loess Plateau (e.g., [23]), and more evapotranspiration and less surface runoff and soil water content were produced than before [24]. Liang et al. [25] suggested that the Grain-for-Green Project help the ecological restoration actions over the sloping parts of the landscape to weaken the impact of those in channels (i.e., warping dams) on streamflow. The attribution case studies in the Huangfuchuan catchment suggested that human activities were the dominant influencing factor of changes in streamflow and sediment [26,27].
From many previous studies, we could get a global picture that anthropogenic activities have a larger contribution than that of climate change to streamflow and sediment reductions for most studied basins. In most of previous attribution analysis studies, the method of bisection for abrupt change point detection was used to separate the whole studied hydrological series to pre- and post-impact sub-periods. In the pre-impact period, the hydrological regime is assumed to be stationary without obvious disturbances. Then, hydrological behaviors between these two sub-periods are compared and further resolve the contributions of climate variability and anthropogenic activities with hydrological simulation models. However, many previous studies may neglect to check the presence of anomalous flood events and whether the anomalous events should be removed from the attribution analysis (such analysis procedure is rarely found in the published literature on similar topics), and this may result in the identification of a false abrupt change point.
The main objective of this paper is to analyze the relative effects of climate variability and human activities on streamflow and sediment load in a typical tributary (Yunyan River) of the middle Yellow River. The presence of possible anomalous flood events was checked before abrupt change detection, and the role of anomalous samples on change point detection was also analyzed. In the pre-impact period, statistical models for calculating periodic streamflow and sediment yield were built and tested, and further were used to simulate the “natural” streamflow and sediment processes in the post-impact period. Thus, the changes in streamflow and sediment load and their attribution could be obtained. This study basin is chosen because it is located in the typical loess hill and gully region of China’s Loess Plateau, and could provide a case study for similar catchments.
2. Materials and Methods
2.1. Study Basin and Data
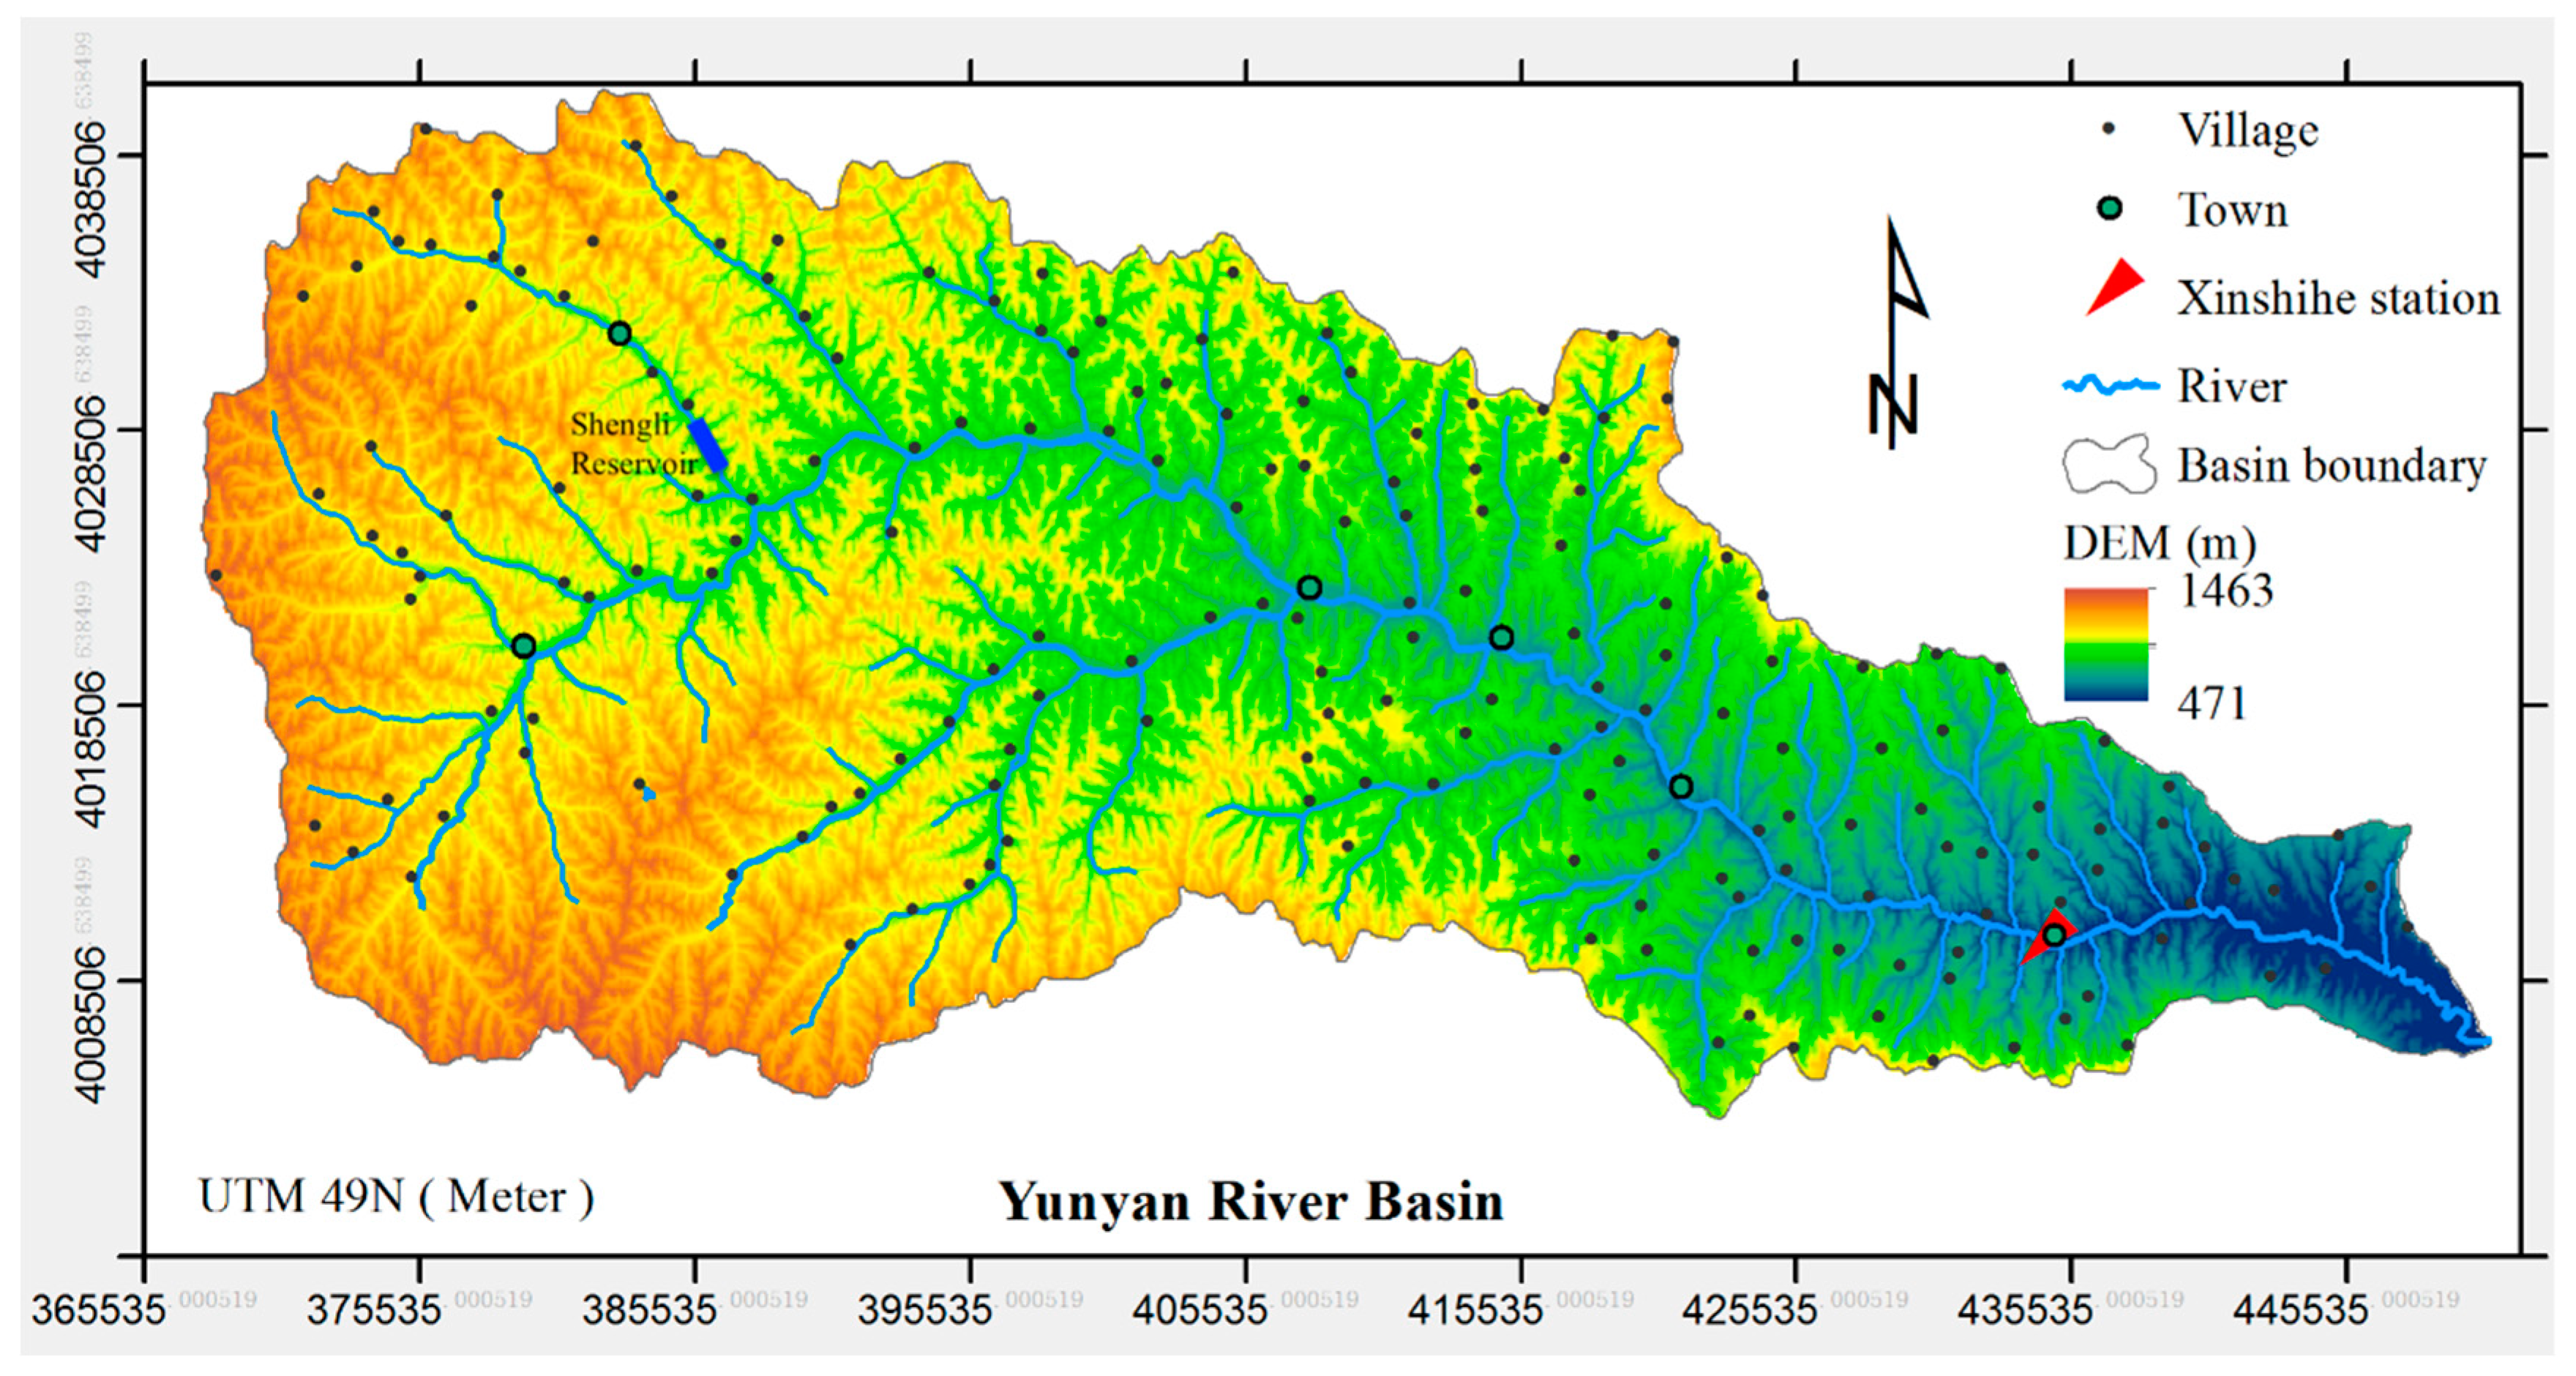
We select a typical loess hill and gully landform area, Yunyan River Basin, in China’s Loess Plateau to conduct the comprehensive analysis of its changes in streamflow and sediment. The Yunyan River (also called Fenchuan River) is a tributary of the middle Yellow River with a length of 113 km (Figure 1). The channel gradient ranges from 0.43% to 0.89% with the earthy (cohesive sediment) and bedrock riverbeds for the upstream and downstream, respectively. It covers an area of 1785 km2 and 93% of its area is controlled by the Xinshihe hydrological station which was established in 1966. The underlying surface is dominated by the loess hill and gully landform. Totally six towns and 187 villages are settled along the rivers, which would certainly consume a large number of water resources and affect the sediment yielding processes.
The climate of this basin is semi-arid and average annual precipitation is about 500–600 mm. Generally, precipitation in the flood season (from June to September) approximately accounts for 70% of the total yearly precipitation amount. Thus, runoff volume and sediment yield induced by rainstorms during the flood season are of great significance for flood control. The observed multi-year mean streamflow and sediment transport at the Xinshihe station are 32.32 million m3/year and 0.77 million t/year, respectively, during the period of 1966–2017.
The 0.5 Degree Gridded Monthly China Surface Precipitation and Air Temperature Dataset (Version 2) was used to obtain the areal mean monthly precipitation and air temperature of the study basin from 1966 to 2017. This meteorological dataset is interpolated from 2472 climate stations of mainland China by China Meteorological Administration and released after a high data quality control. At the Xinshihe station, streamflow is monitored throughout the year, but sediment load is only monitored from May to October due to the very low sediment concentration during the dry season. The flow and sediment runoff induced by rainstorms during the flood season are of great significance for flood control. To analyze the changes in streamflow and sediment consistently, the streamflow and sediment load data during the flood season at the Xinshihe station from 1966 to 2017 were used in this paper.
The SWC measures, including hillslope terracing, warping dam construction, afforestation, and pasture reestablishment, have been implemented from different periods in the Yunyan River Basin. According to the statistics of Liu [28], the proportion of conservation of erosion-prone area by the SWC measures (defined as composite coverage) was 84.0% in the 2010s (Table 1). In addition to the statistics of effective warping dam in Table 1, Li and Liu [29] stated that a total of four backbone warping dams (with storage capacity > 500 thousand m3) and 1594 small/medium dams were built as of 2011 in the Yunyan River Basin, controlling the basin area of 220 km2 and 1276 km2, respectively. The gap between the two sets of data in Table 1 and Reference [29] reflects the warping dam that has lost its interception function or destroyed. Only 31 of 1598 dams are effective because of the unreasonable engineering design and poor construction quality of these warping dams. In the Yunyan River Basin, most of the warping dam was built in the 1970s and before. However, since most of these warping dams were spontaneously built by the people under the encouragement of national policies, they lacked scientific design and guidance, and construction quality was poor. These warping dams were particularly prone to damage during future operations (especially under heavy rainstorm conditions). Besides, on average, the backbone and small/medium warping dams in the middle reaches of the Yellow River have an operational life of approximately 31 and 14 years, respectively [17,28]. Therefore, the warping dams built in the 1970s and before were basically silted up in the 2010s.
2.2. Trend Test and Abrupt Change Detection
The trend-free pre-whitening (TFPW) based Mann–Kendall (MK) trend test method [30,31,32] was used to test the statistical trends in climatic variables (i.e., rainfall and air temperature) and streamflow series during the flood season (from June to September). The data described in Section 2.1 were collected to analyze the trends and detect the change points. The increasing or decreasing trend corresponds to the positive or negative value of Sen’s slope, respectively. Additionally, significance level p = 0.05 was used for the trend test. The natural hydrological processes would be disturbed by climate variability and human activities, and the abrupt change points may occur in hydrological regime when the change magnitude reaches a certain extent. The abrupt change points could be detected by using the order clustering (OC) analysis method [17,33], which constructs a time-variant statistic, , as follows:
where is a n-sized tested time series and the subscripts i and j are the sequence numbers ( and ). and represent the average values of two subseries of and , respectively, and the change point could be detected through the following objective function:
2.3. Attribution Analysis Methods for Hydrological Changes
The target hydrological time series is divided into the pre- and post-impact periods separated at the detected change point . During the pre-impact period, the hydrological regime is assumed to be stationary and without considerable disturbances. This assumption is applied in most of the attribution analysis of hydrological changes [4,6,7,8,10,15,16,17,19,24,25]. The detection of abrupt change point and the pre-impact period (or the phrase of “non-impact”, “baseline” period in some previous studies) is based on some predefined statistical implications. The influences of climate and anthropogenic sources on hydrology are tested by statistical methods and the statistically significant abrupt change is detected to define the pre- and post-impact periods. This means that, in the pre-impact period, the disturbances are non-statistically significant though the influencing factors (e.g., precipitation and air temperature) do change. Accordingly, climatic or anthropic factors produce obvious changes in hydrological regime for the post-impact period. On a multiyear time scale, the relative contributions of climatic and anthropic factors to the changes in streamflow or sediment load could be separated using the following conceptual framework:
where and are the change in streamflow (or sediment load) caused by climate variability and human activities, respectively; is the average value of observed streamflow (or sediment load) for the pre-impact period, while and are the observed and calculated streamflow (or sediment load) for the post-impact period, respectively. In this study, the total runoff volume and sediment load during the flood season were calculated by using the following statistical models.
The formation of groundwater runoff is related to the underlying surface and its deep geography, trend, and water recharge. If these complicated processes are regarded as relatively stable in a short period, then rainfall becomes a major factor in the change of groundwater runoff [10,34].
where Rg is groundwater runoff volumes (×104 m3) and P is the cumulative rainfall amount (mm) for the flood season (June–September). The parameter C1 reflects the storage capacity and recharge of the groundwater layer, while K1 reflects the correlation between groundwater runoff and rainfall, including the effects of the subsurface structure and water recharge. For surface runoff estimation, the following empirical equation could be used [10,34].
where Rs is surface runoff volumes (×104 m3) for the flood season. The parameter K2 is mainly related to the characteristics of the underlying surface, and mainly reflects the adjustment trend between the underlying surface and rainfall. The total runoff volume of the flood season, Q, is equal to groundwater runoff plus surface runoff.
Rainfall intensity is one of the important factors determining the sediment yield. In this study basin, the rainfall intensity varies from month to month during the flood season, so there are also differences in sediment yield characteristics. Following the method described in a previous study [35], the total sediment yield of the flood season, S (×104 kg), could be estimated as:
where and are the exponent parameters of rainfall variables; , , , and are monthly rainfall (mm) of June, July, August, and September, respectively, and their operator reflects the inter-monthly difference within the flood season; and are the empirical parameters that need to be calibrated. This empirical equation has been successfully applied to several catchments in the middle Yellow River region [35].
The statistical runoff/sediment models were calibrated in the pre-impact period and were used to simulate the streamflow and sediment load (without obvious disturbances from human activities). The model performances were tested with the indices of Pearson correlation coefficient (CC) and index of agreement (IOA).
where cov is the covariance for the model-calculated data (cal) and the observed data (obs), σobs and σcal are the standard deviation of obs and cal, respectively.
where represents the time increments, and is the observed mean. The denominator is defined as the potential error. IOA varies from 0.0 (poor model) to 1.0 (perfect model), similarly to coefficient of determination. This is considered an improved model evaluation tool over coefficient of determination because IOA takes into account differences in observed and modeled means (biases) and variances, as well as correlation [36]. Furthermore, using the conceptual framework defined in Equation (3), the relative effects of climate variability and human activities ( and ) were estimated, and the corresponding changes in streamflow and sediment load due to these two factors were quantified.
3. Results
3.1. Changes in Flood Season’s Climatic and Hydrological Variables
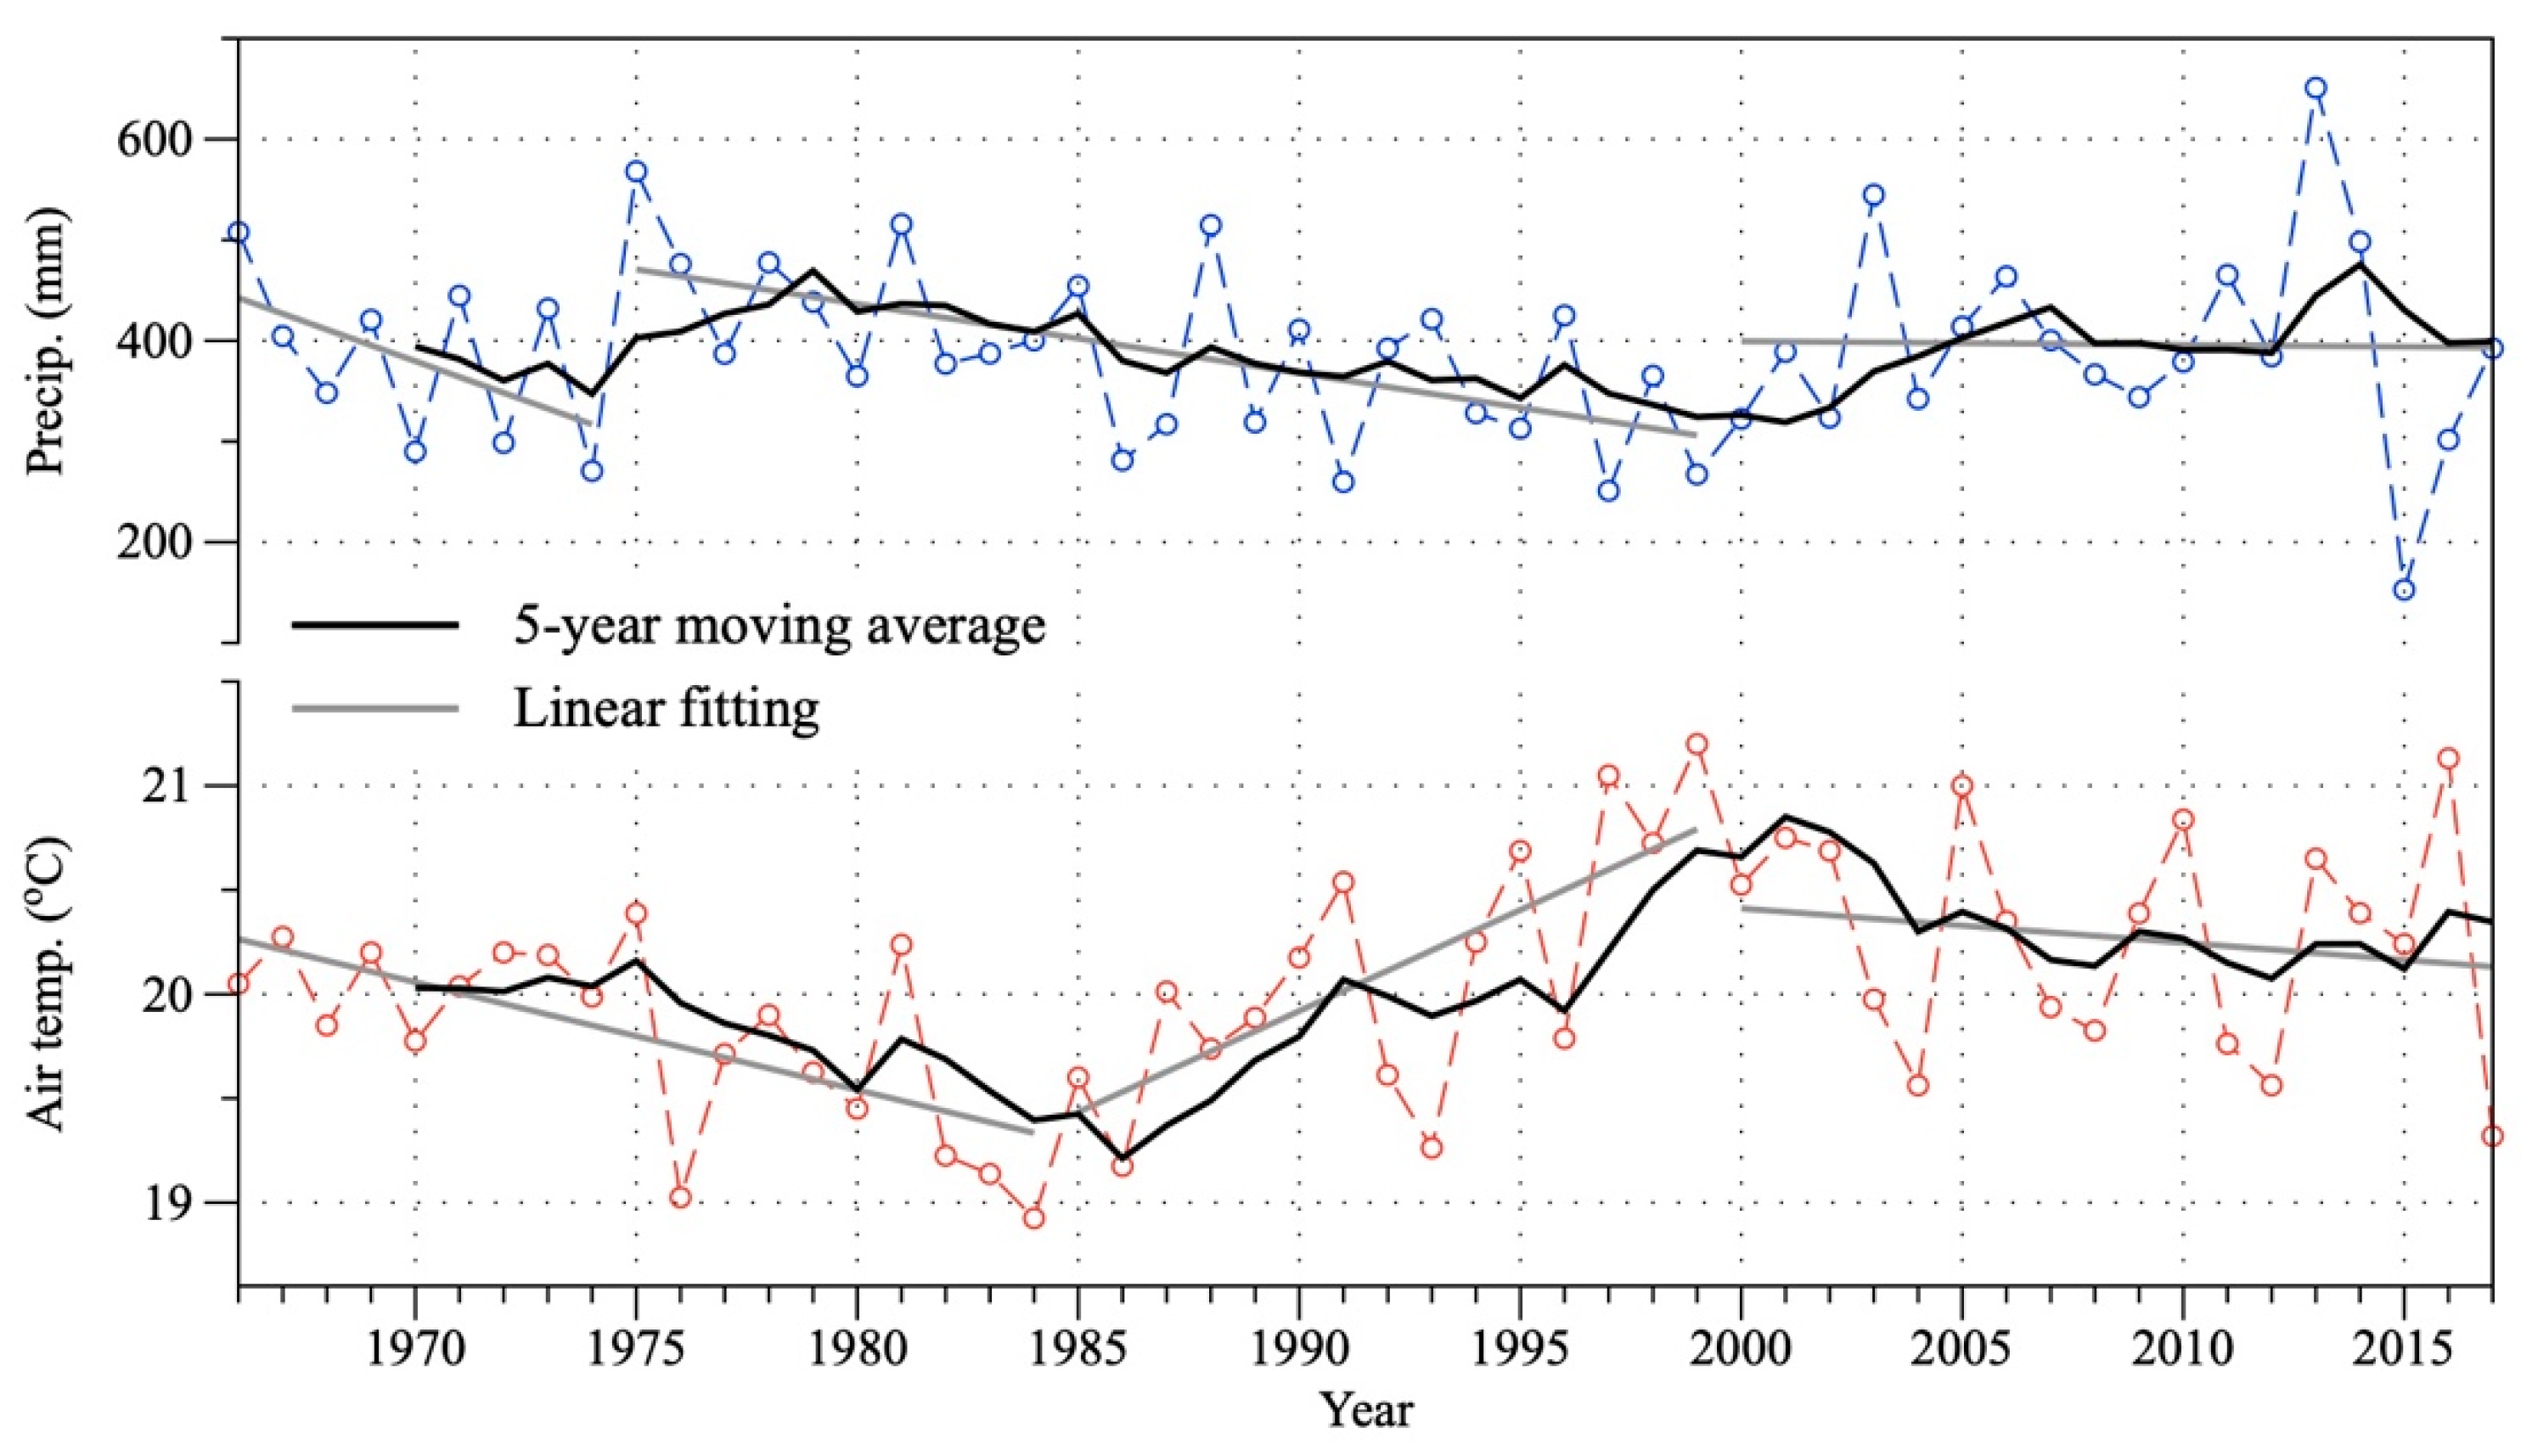
The average rainfall amount in the flood season was 389.7 mm for the period 1966–2017. The decreasing trend was detected from the TFPW-MK test with a rate of −0.6 mm per flood season, but the change trend was not statistically significant with p-value = 0.124. During three sub-periods of 1966–1974, 1975–1999, and 2000–2017 (separated according to the 5-year moving average series), the decreasing trend of basin-wide rainfall was weakened with the rates of −15.7, −6.9, and −0.4 mm/flood-season, respectively (Figure 2). In the mean air temperature time series (1966–2017), the average value was 20.1 °C, and a significant warming trend (p-value = 0.003) was detected with a rate of 0.01 °C /flood season. However, the obvious increasing trend of mean air temperature (rate = 0.1 °C/flood-season, p-value < 0.0001) could only be found in the sub-period from 1985 to 1999. For the other two sub-periods (1966–1984 and 2000–2017), the decreasing trends (with rates of −0.05 and −0.02 °C/flood-season, respectively) were observed. The trends in both sub-periods were statistically significant (p-value < 0.0001 and p-value = 0.025, respectively).
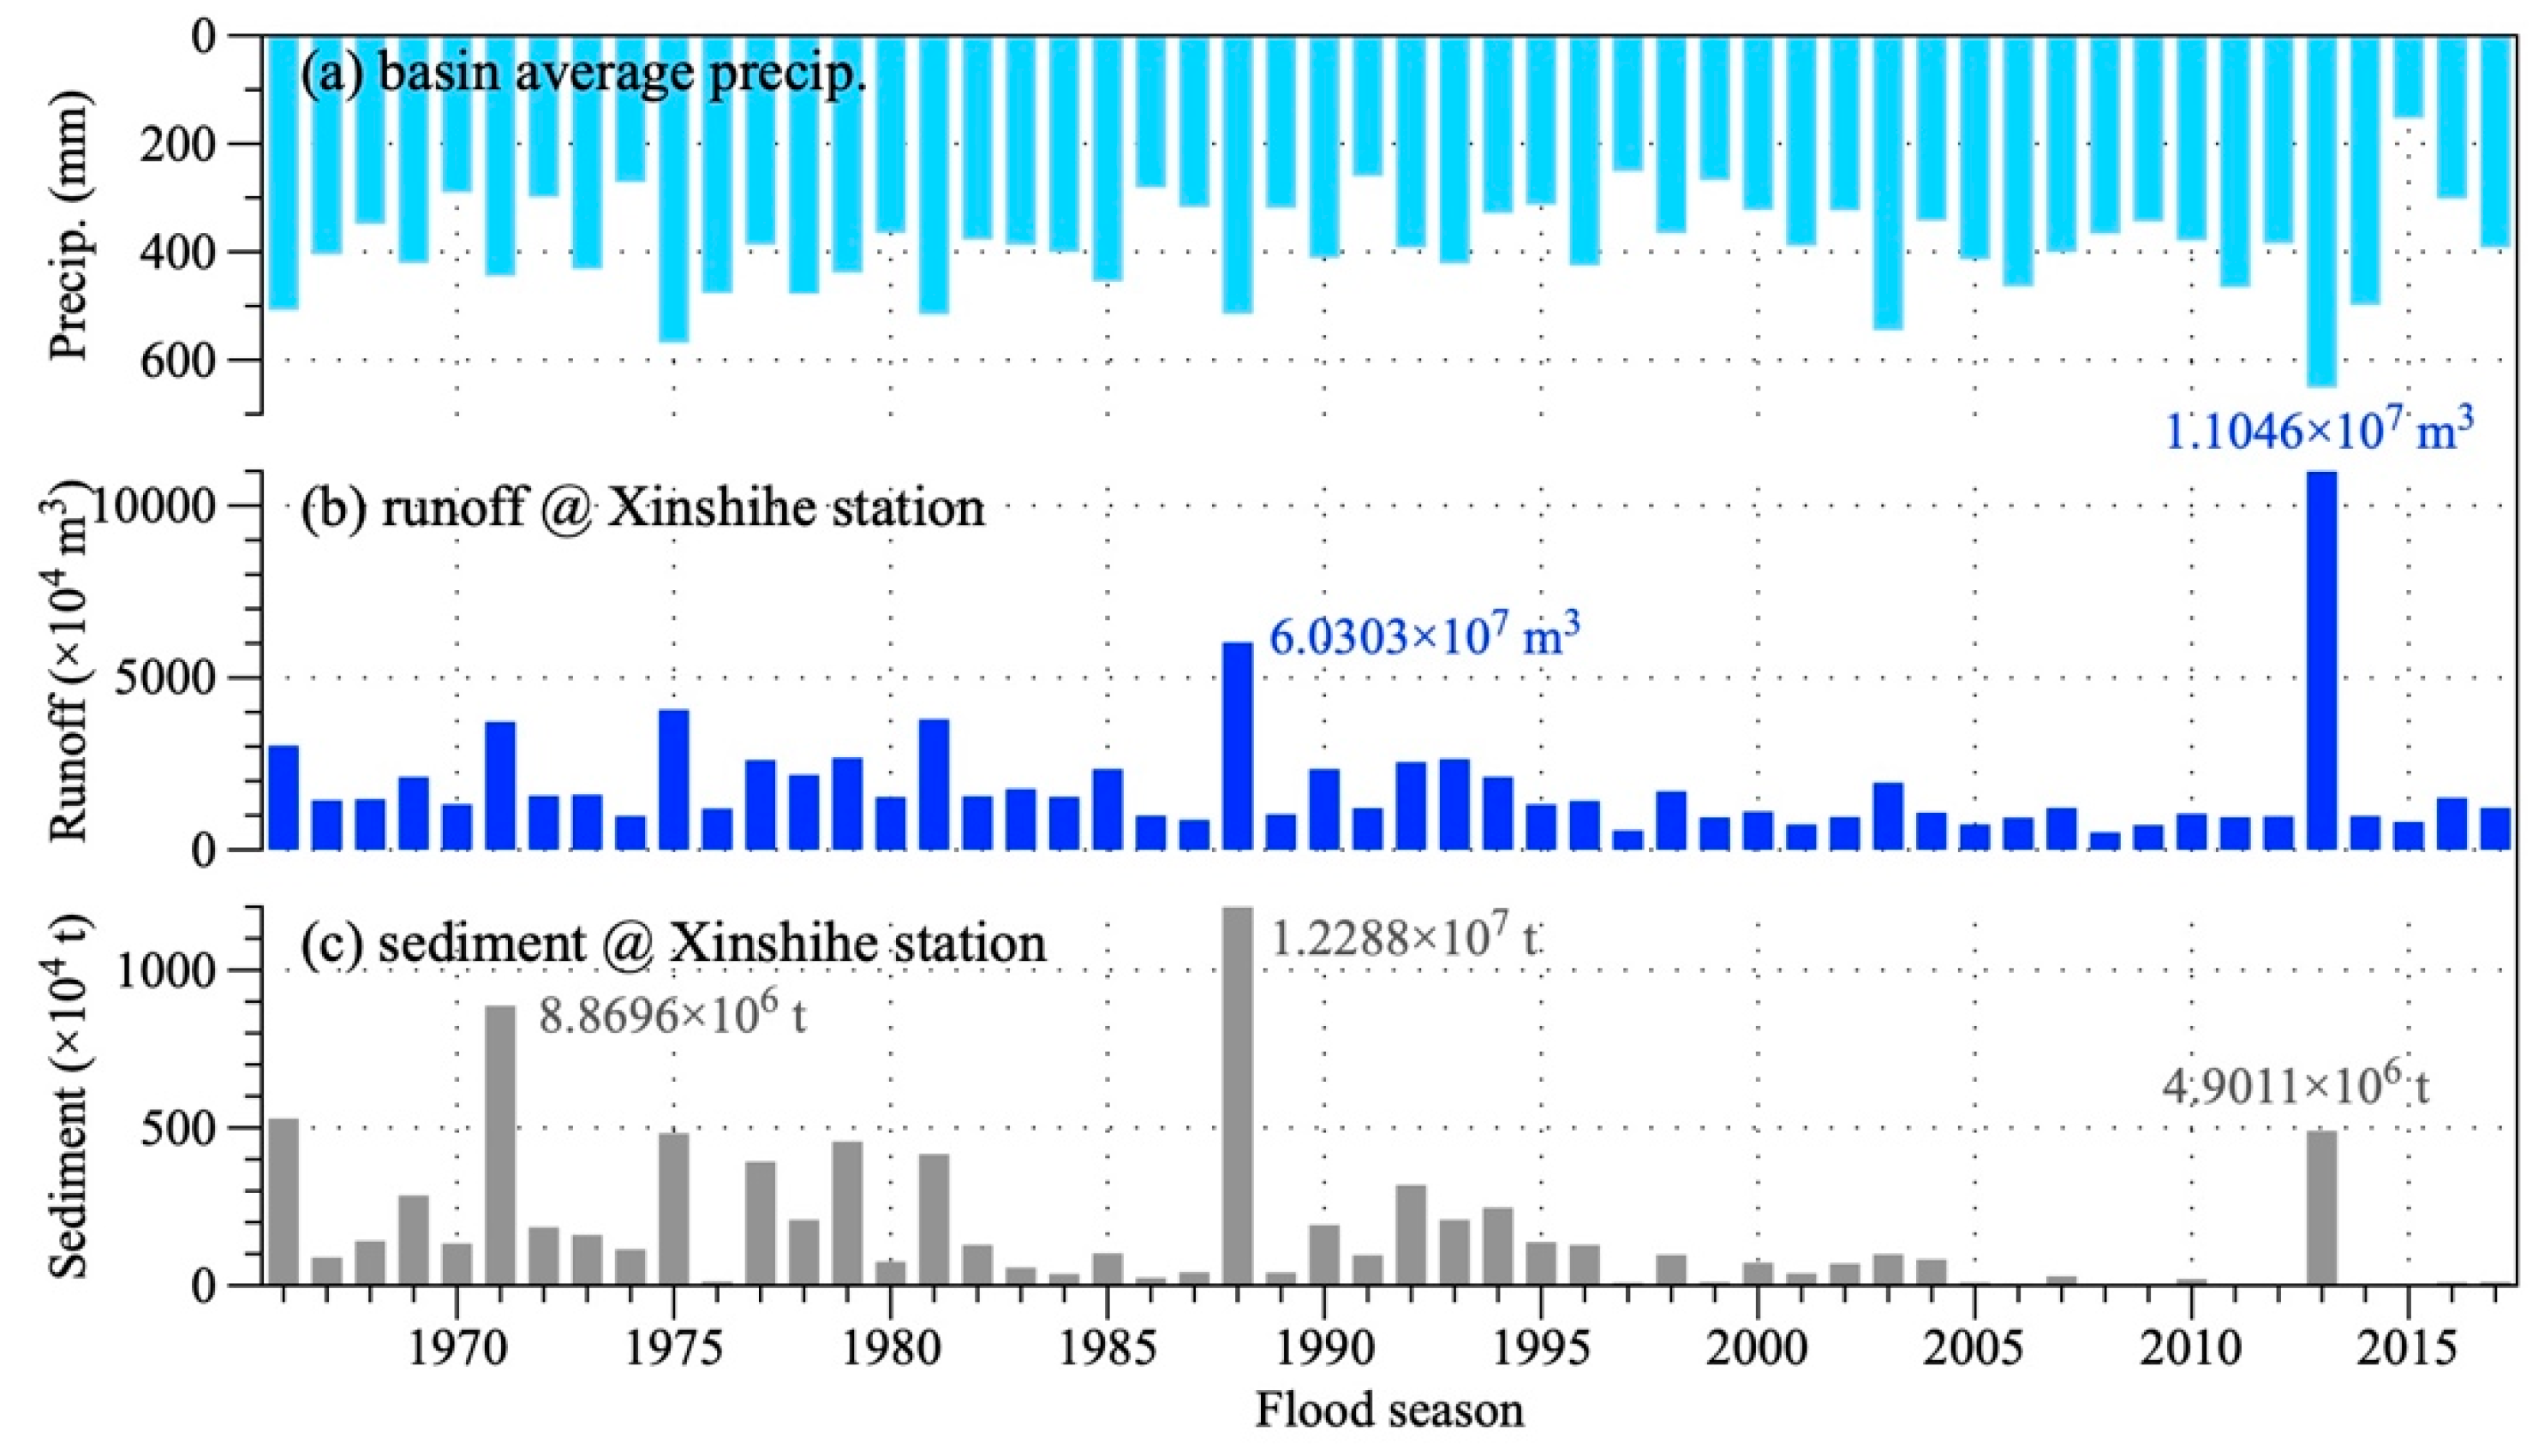
Figure 3 shows the flood-season’s streamflow and sediment concentration at the Xinshihe station from 1966 to 2017. It was obvious that the streamflow and sediment runoff time series were consistent due to their common driving factor of rainfall. In general, both streamflow and sediment load experienced the statistically significant decreasing trends (p-value < 0.0001) with the rates of −20.3 × 10⁴ m3/flood season and −4.1 × 10⁴ t/flood season, respectively. The average flood season’s runoff and sediment transport were 1860.6 × 104 m3 and 165.7 × 10⁴ t, respectively. However, one should notice several anomalous streamflow and sediment load events in the declining series. This may be caused by anthropogenic factors and will be analyzed in the next section.
3.2. Separation of Pre- and Post-Impact Periods
As seen from Figure 3, there were two anomalous water volumes (1988 and 2013, 3.8 and 6.9 times of the average of the other 50 flood seasons, respectively) and three anomalous sediment loads (1971, 1988, and 2013, 7.2, 10.0, and 4.0 times of the average of the other 49 flood seasons, respectively). The anomalous runoff or sediment values in the data series should be checked whether they were “natural” (following the inherent principles of runoff/sediment yields processes) or considerably disturbed by external factors (such as reservoir flood releasing and warping dam collapse) before model building. The runoff coefficient for these three flood seasons were 0.05, 0.07, and 0.10, respectively, which were the first three flood seasons with the largest runoff coefficient (at least 108% larger than the average value of other flood seasons). In addition, the consistency in time patterns of daily and monthly precipitation and runoff/sediment may suggest that there was no considerable reservoir discharge of pre-flood season water (Figure 4). Thus, we inferred that the warping dam system in this catchment may have broken during the floods in these three flood seasons. By revisiting the historical records (including local water yearbook, disaster investigation report, and public news report), we found the warping dam damage reports for these three flood seasons. In these three flood seasons, the very intense rainstorm process caused the failure or damage of warping dams and other water conservancy facilities. It caused the concentrated releasing of runoff and sediment that should have stayed in the warping dam systems for agricultural use and evapotranspiration, resulting in very high flow/sediment flood events. Therefore, the flood seasons disturbed by warping dam damage, 1971, 1988, and 2013, should be excluded from the streamflow and sediment load data series when calibrating the statistical models in this case study because these years cannot be considered “natural” as streamflow and sediment were significantly impacted by anthropogenic activities.
Figure 5 compares the abrupt change detection using the OC analysis method with or without the exclusion of three anomalous flood seasons at the Xinshihe station. It was obvious that these anomalous flood seasons could largely affect the abrupt change detection, and should be excluded from the runoff/sediment sample series. Finally, the detected abrupt change point years were 1994 and 1981 for the runoff and sediment load series, respectively. The distinct difference of abrupt change points in runoff and sediment series indicated that climate change and SWC measures had different impacts on runoff and sediment yield processes. For example, runoff yield is directly related to rainfall amount, but the sediment yield is not necessarily the same, it is more likely to be related to rainfall intensity. In addition, due to the infiltration characteristics of water, SWC measures such as forests/pastures, terraces, and warping dams have different interception capacities for water and sediment. With the OC analysis, therefore, two periods of 1966–1994 and 1995–2017 were defined as the pre- and post-impact periods for runoff series, respectively, while the corresponding two periods for sediment series were 1966–1981 and 1982–2017.
According to the analysis of precipitation and air temperature in the pre-impact period (Figure 2), basin-wide precipitation decreased while air temperature increased over time. Based on the results of abrupt change point detection, however, the impact of the changes in climate aspects on hydrological regime was statistically nonsignificant in the pre-impact period.
For such attribution analysis studies, accurate detection of change points is of great importance because it controls the separation of the pre- and post-impact periods. Ideally, the detected change point is obvious and there is no other alternative. However, the trends and changes in hydrological series are sometimes fluctuating. This may result in difficulties in the detection of changepoints with the prevalent methods, and further introduce uncertainties in final analysis results. In Figure 5, two years (1981 and 1996) in the sediment load series with the sample size of 49 are very close to the minimum statistic value. Using a change point of 1996 instead of 1981 may significantly change the results above. Thus, such one-change-point detection approaches have limitations and uncertainties because different approaches (including both parametric and nonparametric) often exhibit different efficiencies and accuracies [37]. We used the Double Mass Curve (DMC) analysis method [38] to check the rationality of the change points in Figure 6. Results supported the detection of change point 1994 in runoff series (Figure 6a). Besides, the DMC analysis of sediment load series showed that the year of 1981 is the most possible abrupt change point, and thus supported the separation of pre- and post-impact periods at 1981. However, Figure 6b showed the year of 1996 was another potential change point. Using two possible changes points for attribution analysis may be better than just one. This will not affect the determination of the pre-impact period. Based on the analysis above, two post-impact periods (1982–1996 and 1997–2017) could be defined for the sediment load series.
3.3. Attribution of Streamflow and Sediment Declines
The statistical models, Equations (4), (5), and (6), were established and tested with the data in the pre-impact periods (excluding the anomalous data points). Figure 7 shows the calibrated parameters, observed and calculated flood season’s runoff/sediment series, the changes of runoff/sediment, and their separated contributions of climate variability and human activities. The calculated performance indices for the statistical models were: CC = 0.80 and IOA = 0.89 for the runoff model in the pre-impact period (1966–1994), while the corresponding indices were CC = 0.62 and IOA = 0.73 for the sediment model in the pre-impact period (1966–1981). Results showed that, in most flood seasons of the post-impact period except for the warping dam damage seasons, the total changes (, ) were negative due to the water/sediment reducing functions of both climate variability and SWC measures.
Totally, the average flood season’s runoff was reduced by 883.3 × 10⁴ m3 from the pre- (1966–1994) to the post-impact (1995–2017) period in the Yunyan River Basin during the period of 1995–2017, while the separated contributions of climate variability and human activities were 15.7% (−139.1 × 10⁴ m3) and 84.3% (−744.3 × 10⁴ m3), respectively. Accordingly, the contribution percentages of climate variability and human activities to sediment reduction were 28.6% (−50,609.8 kg) and 71.4% (−126,293.7 kg), respectively, of average change of −176,903.6 × 104 kg per flood season from the pre- (1966–1981) to the post-impact (1982–2017) period. It was obvious that human activities (e.g., SWC measures) had overwhelming contribution to water/sediment reduction in recent decades. If two change points were used for sediment series, the attribution results of two post-impact periods could also be obtained (Table 2). Compared with the first post-impact period, human activities in the second post-impact period had a more significant effect on sediment interception, occupying an absolute dominant proportion in sediment reduction.
4. Discussion
Among most of previous studies on attribution of streamflow and sediment declines, the target hydrological data series was often used directly to analyze its trend and abrupt change detection (e.g, [38,39,40]). This procedure implies an assumption that the influence mechanism of climate variability or human activities on hydrological processes is consistent over time. However, the influence magnitude of human activities often changes. The SWC measures (landscape engineering, terracing, warping dams, and reservoirs, etc.) may be damaged by extreme rainstorms and then an anomalous effect (e.g., from water/sediment-reducing infrastructures in the usual situation to flood/sediment amplifiers under extreme condition) [17]. In the Yunyan River Basin, vegetation coverage of the erosion-prone area was 66%, 66%, and 81% in the late 1970s, the late 1990s, and 2013, respectively [28]. The basin has only few terraces covering an area of 23.2 km2 (1.3% of total basin area), and warping dams are the main SWC measure within the basin [28]. Liu [28] and Li et al. [17] suggested that, on China’s Loess Plateau, the backbone warping dams would fail after the sedimentation capacity reaches 77% of the total storage capacity, while the percentage for small and medium dams is 88%. Because the warping dams with long years of operation in the basin are common and such dams are prone to failure, they can cause these anomalous events which can affect the change point detection results. Neglecting such analysis will lead to the wrong change points (see Figure 5 for details).
We suggest that the pre-analysis of anomalous data samples is very important for attribution analysis studies for any catchment. In many previous studies, there may be fewer cases of anomalous data samples, so pre-analysis does not affect the attribution analysis. This may cause some scholars to ignore the importance of such pre-analysis. However, in most of small and medium-size catchments on China’s Loess Plateau, pre-analysis should be given full attention because such catchments cannot fully smooth out these anomalous events on monthly or yearly time scale. Generally, the following possible main driving factors could be considered in the pre-analysis of anomalous hydrological samples:
- Basin-wide continuous rainfall process. Abundant rainfall amount makes the soil vadose zone fully saturated, and mountains with steep slopes may collapse into the channels becoming an important source of sediment during the flood events.
- High rainfall intensity events. It is an important driving factor for high sediment concentration process and dam-break floods. On China’s Loess Plateau, the rainfall thresholds (≥25 mm/day, ≥50 mm/day, ≥100 mm/day) often have strong positive correlations with streamflow and sediment load during extreme flood events. These thresholds are empirical values estimated by previous studies (e.g., [28,41]) from statistical analysis using large amounts of rainfall, sediment and streamflow data from multiple basins in the middle reaches of the Yellow River. Therefore, these thresholds are regional, related to the rainfall characteristics and the underlying soil, vegetation, and geomorphological features. Usually, statistical methods are used to establish the relationship between these thresholds and streamflow (or sediment yield), and then to make predictions.
- Dam-break records or unusual reservoir flood discharge records. When water or sand storage is greater than the reservoir (or warping dam) storage capacity, much more water or sand than normal would be released and even the hydrological projects may be damaged.
- The debris in the river channels. The debris (e.g., construction waste, garbage, landslide, illegal construction on the river beach) due to human activities or upstream drifting will cause the blockage of river channel, and further cause a concentrated release of water and sand.
As an example, we analyzed here why the 2013 flood season was anomalous in streamflow and sediment. Continuous rainfall in the Yunyan River Basin made the soil vadose zone fully saturated, and the gully surface of the mountain was easy to collapse. Liu [28] found that the landslide caused by the rainstorm of July 2013 was more serious in the upstream area with dense arbor (shrub) vegetation than the downstream area. The local water conservancy department pointed out three reasons for such a landslide [28]: (a) The roots of the arbor (shrubs) are shallow; (b) There is a layer of cohesive soil under the surface loess soil, which is easy to form a shear plane; and (c) The roots of arbor (shrub) vegetation are more likely to trigger gravity erosion than other vegetation. The landslide could provide an abundant sand source for soil erosion.
However, this is not the dominant cause of the high flow and high sediment concentration events. The July 2013 rainstorm event provided much more water and sand than the storage capacity of warping dams and reservoirs, and further caused the dam-break extreme flow and sediment events. This was likely the main cause of the anomalous flood season in 2013. Shengli Reservoir is located in the upper reaches of Yunyan River (Figure 1), with a total storage capacity of 5.82 million m3. It was built in 1959 and was full of sediment in 1970. Afterwards, it was elevated and the effective storage capacity was 1.98 million m3. On 22 July 2013, Shengli Reservoir and its surrounding areas were hit by heavy rainfall. As a result, the road collapsed, which led to the blockage of the discharge of the culvert, resulting in a sharp rise in the water level of the reservoir. Heavy rains occurred again in the early morning of 25 July, and the reservoir water level rose again. At this time, the side wall of the spillway and the stilling pool collapsed. In order to ensure the safety of the reservoir, the floods were discharged from the Shengli Reservoir, thus allowing a large amount of storage sand to be discharged. During the flood discharge process, a large number of trees drifting from the upper forest area and many cross-river bridges in the Yunyan River encountered, causing the river channel to block, and then suddenly bursting, eventually forming the extreme flow and sediment event.
From the above case with anomalous data sample, we found that some SWC measures were destroyed and then largely affected the streamflow and sediment runoff. This is different to other years with regular anthropogenic impacts. Therefore, the exclusion of anomalous samples in the pre-analysis is necessary for such cases.
On the whole, our analysis stated that human activities are the main reason for the reduction of runoff and sediment load in the Yunyan River Basin in the past few decades. This finding is consistent with that in some other Loess Plateau’s catchments in previous studies [9,10,17,34,35,42]. For instance, Zhao et al. [43] showed that land use changes and warping dams in 2006 reduced the sediment yield nearly by 80% in the Xiaoshilata and Yangjiagou Watersheds. Zhao et al. [44] used warping dam deposits to investigate sediment yield change in the Loess Plateau and stated that SWC measures reduced sediment yield by about 75% during 1964–1990. Tian et al. [26] supported the statement that human activities accounted the dominant role on runoff/sediment changes with a case study in the Huangfuchuan catchment, but also pointed out that the relative contributions from climate variability and human activities to runoff and sediment load changes at annual scale were different from that at flood season scale.
This study could be a positive demonstration of the benefits from the SWC measures (including hillslope terracing, warping dam construction, afforestation, and pasture reestablishment) project and the Grain-for-Green ecological restoration campaign in the Loess Plateau. On the time trends, one could also find the decreasing negative effect of human activities on both runoff and sediment yields, i.e., the relative contribution of human activities became greater over time to a certain extent and more and more water/sediment were reduced (see the inserted panels in Figure 7). This showed that the interception capacity of SWC measures is changing over time. However, SWC measures are not the ultimate effective, once-and-for-all means of soil erosion control. The measures constructed in different years have different quality (or capacity) of water/sediment interception. In the main sediment-producing areas of the Yellow River, including the Yunyan River Basin in this study, although the forest and pasture vegetation in all areas has been greatly improved compared with the 1970s, the vegetation types are mainly herbaceous plants and shrubs-grass mixed vegetation. There are sporadic sparse forests or economic forests. This vegetation pattern may be an inevitable outcome of local rainfall and temperature conditions. The capacity of such vegetation to intercept water and sediment is limited. In the case of extreme rainstorms (e.g., the rainstorm of July 2013), it is likely to be uprooted and new soil erosion will be added. The quality of the terraced fields constructed in different areas of the middle reaches of the Yellow River is also uneven. In particular, the artificial terraces implemented in the 1960s, 1970s, and 1980s have lower quality grades, narrow fields, and some slopes. Due to years of disrepair, some terraces implemented in the 1960s and 1970s have collapsed. Warping dam is the most effective measure for SWC in most of the middle reaches of the Yellow River. The dams built in the 1970s accounted for a large proportion. However, due to the lack of scientific guidance, these old dams do not meet the design standards, so the number is large but the quality is poor, and the ability to withstand floods is low. These warping dams are prone to be flooded and collapsed in the event of a large flood. Therefore, although the water and sediment of the Yunyan River has been greatly reduced and the soil erosion has been effectively governed, this does not mean that there will be no high sediment concentration flood events in the future.
The analysis indicated that we cannot slow down the comprehensive management of soil erosion in the Yunyan River Basin because it has not yet been fundamentally governed. Thus, we suggest to continue to consolidate the achievements of the Grain-for-Green Project of the Yunyan River Basin at the government policy level and maintain the continuity of SWC measures construction and management. First, comprehensive management of hills, rivers, forests, farmland, lakes, and grasses should be carried out on a small watershed scale. It is necessary to scientifically allocate measures such as engineering, forestry, and farming, gradually improve the design standards of SWC measures, improve the ability of SWC measures to withstand rainstorms and floods, and maintain and enhance regional SWC functions. Second, the “post-SWC” work should also be strengthened. The management and maintenance mechanism after the construction of existing SWC measures should be established to ensure the long-term operation of the project. For instance, damaged terraces and warping dams need to be repaired. These recommendations may apply equally to other similar loess hill and gully landform regions in the middle reaches of the Yellow River.
5. Conclusions
Water resources in the flood season are very important for the semi-arid and arid basins in China’s Loess Plateau. However, in the past half-century or more, the streamflow and sediment load have been considerably reduced. This paper analyzed the effects of climate variability and human activities on flood season’s streamflow and sediment declines in a typical loess hill and gully landform basin (Yunyan River Basin) in the middle reach of Yellow River during the period of 1966–2017. Basin-wide rainfall of the flood season showed a weakened decreasing trend from the rates of −15.7 mm/flood-season (1966–1974) to −0.4 mm/flood-season (2000–2017), and finally the whole period (1966–2017) demonstrated a nonsignificant decreasing trend with a rate of −0.6 mm/flood-season. For the changes of mean air temperature, a remarkable warming trend (rate = 0.1 °C/flood-season for 1985–1999) and two decreasing trends (with rates of −0.05 and −0.02 °C/flood-season for 1966–1984 and 2000–2017, respectively) were observed. Both streamflow and sediment load were reduced largely due to the factors of climate variability and human activities. Excluding the anomalous hydrological samples, the streamflow and sediment load series were divided into pre- and post-impact periods in 1994 and 1981, respectively. On average, about −883.3 × 10⁴ m3/flood season runoff volume and −176,903.6 × 104 kg/flood-season sediment load were reduced from the pre- to the post-impact periods.
Attribution analysis showed that human activities (e.g., SWC measures) were the dominating driving factor for streamflow and sediment declines in the Yunyan River Basin. The corresponding contribution percentage of streamflow decrease was 84.3% during the post-impact period 1995–2017, while the relative contributions were 48.8% and 80.1% for two post-impact periods (1982–1996 and 1997–2017), respectively, to the reduction of sediment load. The study also demonstrated the role of anomalous hydrological events in such attribution analysis studies. Results suggested that the anomalous hydrological samples need to be given enough attention in order to ensure the accuracy of the attribution analysis of hydrological changes.
Author Contributions
Conceptualization, B.L. and C.Z.; methodology, Q.C. and B.L.; validation, Q.C., C.Z., and S.Z.; formal analysis, Q.C. and B.L.; investigation, Q.C. and C.Z.; resources, C.Z.; data curation, S.Z.; writing—original draft preparation, Q.C.; writing—review and editing, C.Z. and B.L.
Funding
This research was funded by National Key R&D Program of China (2016YFC0402706), General Program of National Natural Science Foundation of China (41877147), Fundamental Research Funds for the Central Universities of China (2018B43314), and sponsored by the Qing Lan Project.
Conflicts of Interest
The authors declare no conflict of interest.
References
- Wang, S.; Fu, B.; Piao, S.; Lü, Y.; Ciais, P.; Feng, X.; Wang, Y. Reduced sediment transport in the Yellow River due to anthropogenic changes. Nat. Geosci. 2016, 9, 38–41. [Google Scholar] [CrossRef]
- Nilawar, A.P.; Waikar, M.L. Use of SWAT to determine the effects of climate and land use changes on streamflow and sediment concentration in the Purna River basin, India. Environ. Earth Sci. 2018, 77, 783. [Google Scholar] [CrossRef]
- Xiao, Z.; Liang, Z.; Li, B.; Hou, B.; Hu, Y.; Wang, J. New flood early warning and forecasting method based on similarity theory. J. Hydrol. Eng. 2019, 24, 04019023. [Google Scholar] [CrossRef]
- Wang, X. Advances in separating effects of climate variability and human activities on stream discharge: An overview. Adv. Water Resour. 2014, 71, 209–218. [Google Scholar] [CrossRef]
- Li, D.; Liang, Z.; Zhou, Y.; Li, B.; Fu, Y. Multicriteria assessment framework of flood events simulated with vertically mixed runoff model in semiarid catchments in the middle Yellow River. Nat. Hazards Earth Syst. Sci. 2019, 19, 2027–2037. [Google Scholar] [CrossRef] [Green Version]
- Gao, P.; Mu, X.M.; Wang, F.; Li, R. Changes in streamflow and sediment discharge and the response to human activities in the middle reaches of the Yellow River. Hydrol. Earth Syst. Sci. 2011, 15, 1–10. [Google Scholar] [CrossRef] [Green Version]
- Bao, Z.; Zhang, J.; Wang, G.; Fu, G.; He, R.; Yan, X.; Jin, J.; Liu, Y.; Zhang, A. Attribution for decreasing streamflow of the Haihe River basin, northern China: Climate variability or human activities? J. Hydrol. 2012, 460–461, 117–129. [Google Scholar] [CrossRef]
- Gao, Z.; Zhang, L.; Zhang, X.; Cheng, L.; Potter, N.; Cowan, T.; Cai, W. Long-term streamflow trends in the middle reaches of the Yellow River Basin: Detecting drivers of change. Hydrol. Proces. 2016, 30, 1315–1329. [Google Scholar] [CrossRef]
- Gao, G.; Zhang, J.; Liu, Y.; Ning, Z.; Fu, B.; Sivapalan, M. Spatio-temporal patterns of the effects of precipitation variability and land use/cover changes on long-term changes in sediment yield in the Loess Plateau, China. Hydrol. Earth Syst. Sci. 2017, 21, 4363–4378. [Google Scholar] [CrossRef] [Green Version]
- Li, B.; Liang, Z.; Zhang, J.; Wang, G.; Zhao, W.; Zhang, H.; Wang, J.; Hu, Y. Attribution analysis of runoff decline in a semiarid region of the Loess Plateau, China. Theor. Appl. Climatol. 2018, 131, 845–855. [Google Scholar] [CrossRef]
- Fu, B.; Wang, S.; Liu, J.; Liang, W.; Miao, C. Hydrogeomorphic ecosystem response to natural and anthropogenic changes in the Loess Plateau of China. Annu. Rev. Earth Planet. Sci. 2017, 45, 223–243. [Google Scholar] [CrossRef]
- Zhao, G.; Klik, A.; Mu, X.; Wang, F.; Gao, P.; Sun, W. Sediment yield estimation in a small watershed on the northern Loess Plateau, China. Geomorphology. 2015, 241, 343–352. [Google Scholar] [CrossRef]
- Chen, N.; Ma, T.; Zhang, X. Responses of soil erosion processes to land cover changes in the Loess Plateau of China: A case study on the Beiluo River basin. Catena 2016, 136, 118–127. [Google Scholar] [CrossRef]
- Zhao, G.; Mu, X.; Han, M.; An, Z.; Gao, P.; Sun, W.; Xu, W. Sediment yield and sources in dam-controlled watersheds on the northern Loess Plateau. Catena 2017, 149, 110–119. [Google Scholar] [CrossRef]
- Zhao, G.; Tian, P.; Mu, X.; Jiao, J.; Wang, F.; Gao, P. Quantifying the impact of climate variability and human activities on streamflow in the middle reaches of the Yellow River basin, China. J. Hydrol. 2014, 519, 387–398. [Google Scholar] [CrossRef]
- Wu, J.; Miao, C.; Yang, T.; Duan, Q.; Zhang, X. Modeling streamflow and sediment responses to climate change and human activities in the Yanhe River, China. Hydrol. Res. 2018, 49, 150–162. [Google Scholar] [CrossRef]
- Li, B.; Liang, Z.; Bao, Z.; Wang, J.; Hu, Y. Changes in streamflow and sediment for a planned large reservoir in the middle Yellow River. Land Degrad. Dev. 2019, 30, 878–893. [Google Scholar] [CrossRef] [Green Version]
- Tan, X.; Gan, T.Y. Contribution of human and climate change impacts to changes in streamflow of Canada. Sci. Rep. 2015, 5, 17767. [Google Scholar] [CrossRef]
- Zhao, Y.; Zou, X.; Gao, J.; Xu, X.; Wang, C.; Tang, D.; Wang, T.; Wu, X. Quantifying the anthropogenic and climatic contributions to changes in water discharge and sediment load into the sea: A case study of the Yangtze River, China. Sci. Total Environ. 2015, 536, 803–812. [Google Scholar] [CrossRef]
- Awotwi, A.; Anornu, G.K.; Quaye–Ballard, J.; Annor, T.; Forkuo, E.K. Analysis of climate and anthropogenic impacts on runoff in the Lower Pra River Basin of Ghana. Heliyon 2017, 3, e00477. [Google Scholar] [CrossRef] [Green Version]
- Restrepo, J.D.; Escobar, H.A. Sediment load trends in the Magalena River basin (1980–2010): Anthropogenic and climate-induced causes. Geomorphology 2018, 302, 76–91. [Google Scholar] [CrossRef]
- Pokhrel, Y.; Burbano, M.; Roush, J.; Kang, H.; Sridhar, V.; Hyndman, D.W. A review of the integrated effects of changing climate, land use, and dams on Mekong River hydrology. Water 2018, 10, 266. [Google Scholar] [CrossRef]
- Yang, X.; Sun, W.; Li, P.; Mu, X.; Gao, P.; Zhao, G. Reduced sediment transport in the Chinese Loess Plateau due to climate change and human activities. Sci. Total Environ. 2018, 642, 591–600. [Google Scholar] [CrossRef] [PubMed]
- Yan, R.; Zhang, X.; Yan, S.; Zhang, J.; Chen, H. Spatial patterns of hydrological responses to land use/cover change in a catchment on the Loess Plateau, China. Ecol. Indic. 2018, 92, 151–160. [Google Scholar] [CrossRef]
- Liang, W.; Bai, D.; Wang, F.; Fu, B.; Yan, J.; Wang, S.; Yang, Y.; Long, D.; Feng, M. Quantifying the impacts of climate change and ecological restoration on streamflow changes based on a Budyko hydrological model in China’s Loess Plateau. Water Resour. Res. 2015, 51, 6500–6519. [Google Scholar] [CrossRef]
- Tian, P.; Mu, X.; Liu, J.; Hu, J.; Gu, C. Impacts of climate variability and human activities on the changes of runoff and sediment load in a catchment of the Loess Plateau, China. Adv. Meteorol. 2016, 2016. [Google Scholar] [CrossRef]
- Zhao, G.; Mu, X.; Jiao, J.; Gao, P.; Sun, W.; Li, E.; Wei, Y.; Huang, J. Assessing response of sediment load variation to climate change and human activities with six different approaches. Sci. Total Environ. 2018, 639, 773–784. [Google Scholar] [CrossRef]
- Liu, X. Cause of Water and Sediment Sharp Decline in the Yellow River in Recent Years; Science Press: Beijing, China, 2016. (In Chinese) [Google Scholar]
- Li, J.; Liu, L. Analysis on the sediment retaining amount by warping dams above Tongguan section of the Yellow River in recent years. Yellow River 2018, 40, 1–6. (In Chinese) [Google Scholar]
- Mann, H.B. Nonparametric tests against trend. Econometric 1945, 13, 245–259. [Google Scholar] [CrossRef]
- Kendall, M.G. Rand Correlation Methods; Charles Griffin: London, UK, 1975. [Google Scholar]
- Yue, S.; Pilon, P.; Phinney, B.; Cavadias, G. The influence of autocorrelation on the ability to detect trend in hydrological series. Hydrol. Process. 2002, 16, 1807–1829. [Google Scholar] [CrossRef]
- Xie, P.; Chen, G.; Li, D.; Zhu, Y. Comprehensive diagnosis method of hydrologic time series change-point analysis. Water Resour. Power 2005, 23, 11–14. (In Chinese) [Google Scholar]
- Dai, M.Y. Runoff estimation model based on the separation from its cause of formation. In Study of Changes in Runoff and Sediment Load in the Yellow River; Wang, G., Fan, Z., Eds.; The Yellow River Water Conservancy Press: Zhengzhou, China, 2002; Volume 1, pp. 981–990. (In Chinese) [Google Scholar]
- Dai, M.Y. Water and sediment changes and the calculation comparison of hydrological methods in the Wuding River basin. In Study of Changes in Runoff and Sediment Load in the Yellow River; Wang, G., Fan, Z., Eds.; The Yellow River Water Conservancy Press: Zhengzhou, China, 2002; Volume 1, pp. 991–1009. [Google Scholar]
- Willmott, C.J. On the validation of models. Phys. Geogr. 1981, 2, 184–194. (In Chinese) [Google Scholar] [CrossRef]
- Xie, P.; Gu, H.; Sang, Y.F.; Wu, Z.; Singh, V.P. Comparison of different methods for detecting change points in hydroclimatic time series. J. Hydrol. 2019, 577, 123973. [Google Scholar] [CrossRef]
- Li, B.; Yu, Z.; Liang, Z.; Song, K.; Li, H.; Wang, Y.; Zhang, W.; Acharya, K. Effects of climate variations and human activities on runoff in the Zoige alpine wetland in the eastern edge of the Tibetan Plateau. J. Hydrol. Eng. 2014, 19, 1026–1035. [Google Scholar] [CrossRef]
- Cui, T.; Yang, T.; Xu, C.; Shao, Q.; Wang, X.; Li, Z. Assessment of the impact of climate change on flow regime at multiple temporal scales and potential ecological implications in an alpine river. Stoch. Environ. Res. Risk Assess. 2018, 32, 1849–1866. [Google Scholar] [CrossRef]
- Wang, X.; Yang, T.; Yong, B.; Krysanova, V.; Shi, P.; Li, Z.; Zhou, X. Impacts of climate change on flow regime and sequential threats to riverine ecosystem in the source region of the Yellow River. Environ. Earth Sci. 2018, 77, 465. [Google Scholar] [CrossRef]
- Wang, G.; Fan, Z. Study of Changes in Runoff and Sediment Load in the Yellow River; The Yellow River Water Conservancy Press: Zhengzhou, China, 2002. (In Chinese) [Google Scholar]
- Xu, J. Variation in annual runoff of the Wudinghe River as influenced by climate change and human activity. Quat. Int. 2011, 244, 230–237. [Google Scholar] [CrossRef]
- Zhao, G.; Kondolf, G.M.; Mu, X.; Han, M.; He, Z.; Rubin, Z.; Wang, F.; Gao, P.; Sun, W. Sediment yield reduction associated with land use changes and check dams in a catchment of the Loess Plateau, China. Catena 2017, 148, 126–137. [Google Scholar] [CrossRef]
- Zhao, T.; Yang, M.; Walling, D.E.; Zhang, F.; Zhang, J. Using check dam deposits to investigate recent changes in sediment yield in the Loess Plateau, China. Glob. Planet. Chang. 2017, 152, 88–98. [Google Scholar] [CrossRef]
Figure 1.
Map of the Yunyan River Basin.

Figure 2.
Time series of flood season’s rainfall and mean air temperature over the Yunyan River Basin from 1966 to 2017.
Figure 2.
Time series of flood season’s rainfall and mean air temperature over the Yunyan River Basin from 1966 to 2017.

Figure 3.
Time series of flood season’s rainfall and mean air temperature over the Yunyan River Basin from 1966 to 2017.
Figure 3.
Time series of flood season’s rainfall and mean air temperature over the Yunyan River Basin from 1966 to 2017.

Figure 4.
Daily (panels a–c) and monthly (panels d–f) rainfall, streamflow, and sediment discharge of the Yunyan River Basin for the 1971, 1988, and 2013 flood seasons. Daily rainfall series is from the observations at Yan’an rain gauge (109°27′ E, 36°35′ N, 15 km northwest of the basin), while monthly rainfall series is from the 0.5 Degree Gridded Dataset. Streamflow and sediment load are measured at the Xinshihe hydrological station. The unit of rainfall represents the total amount, while the units of flow and sediment discharge represent the average.

Figure 5.
The time-variant statistic of the order clustering (OC) analysis method for the flood season’s (a) runoff (×104 m3) and (b) sediment load (×104 t). Black dashed line represents the statistic of OC analysis using all 52 sample points from 1966 to 2017, while blue solid line used 49 sample points excluding the flood seasons of 1971, 1988, and 2013.

Figure 6.
The plot of cumulative rainfall versus (a) cumulative runoff or (b) cumulative sediment load with the Double Mass Curve (DMC) analysis during 1966 to 2017 (49 samples with the exclusions of 1971, 1988, and 2013 flood seasons). The solid lines represent the linear fits of data samples.
Figure 6.
The plot of cumulative rainfall versus (a) cumulative runoff or (b) cumulative sediment load with the Double Mass Curve (DMC) analysis during 1966 to 2017 (49 samples with the exclusions of 1971, 1988, and 2013 flood seasons). The solid lines represent the linear fits of data samples.

Figure 7.
Comparisons of flood season’s runoff and sediment and their changes due to climate variability and human activities in the post-impact period in the Yunyan River Basin. Panels (a) and (b) are for runoff volume and sediment load at Xinshihe station, respectively. , , and represent the total runoff change and the separated changes due to climate variability and human activities, respectively, while , , and are the corresponding notations for sediment load.


Table 1.
Statistics of soil and water conservation (SWC) measures in the Yunyan River Basin (Liu [28]).
Table 1.
Statistics of soil and water conservation (SWC) measures in the Yunyan River Basin (Liu [28]).
| Erosion-Prone Area (km2) | Forest/Pasture Coverage of Erosion-Prone Area (%) | Forest/Pasture Area in 2014 (km2) 1 | |||
|---|---|---|---|---|---|
| 1970s | 2014 | Total Area | Coverage > 30% | Coverage > 50% | |
| 1704 | 66.0 | 81.2 | 1537 | 1533 | 1520 |
| Terrace in 2014 (km2) | Warping Dam land in 2011 (km2) | Effective Warping Dam in 2011 | Composite Coverage (%) 3 | ||
| Number | Controlling Area Ratio (%) 2 | ||||
| 22.8 | 25.33 | 31 | 4.4 | 84.0 | |
1 The data of forest/pasture area were obtained from the remote sensing interpretation of the HJ-1 CCD images (spatial resolution = 30 m). The vegetation coverage of each pixel (30 m) was calculated based on the Normalized Difference Vegetation Index (NDVI), and the results were verified with field investigation. 2 Controlling area ratio of warping dam represents the ratio of the control area of effective warping dam to the corresponding water erosion area. 3 Composite coverage = forest/pasture coverage of erosion-prone area + (terrace area + warping dam land area)/erosion-prone area.
Table 2.
Attribution analysis of flood season’s sediment reduction for different post-impact periods.
Table 2.
Attribution analysis of flood season’s sediment reduction for different post-impact periods.
| Post-Impact Period | Total Change (×104 kg/flood-season) | Climatic Contribution | Anthropogenic Contribution |
|---|---|---|---|
| 1982–1996 | −119,708.7 | 51.2% | 48.8% |
| 1997–2017 | −216,940.0 | 19.9% | 80.1% |
| 1982–2017 | −176,903.5 | 28.6% | 71.4% |
© 2019 by the authors. Licensee MDPI, Basel, Switzerland. This article is an open access article distributed under the terms and conditions of the Creative Commons Attribution (CC BY) license (http://creativecommons.org/licenses/by/4.0/).
Share and Cite
MDPI and ACS Style
Chang, Q.; Zhang, C.; Zhang, S.; Li, B. Streamflow and Sediment Declines in a Loess Hill and Gully Landform Basin Due to Climate Variability and Anthropogenic Activities. Water 2019, 11, 2352. https://doi.org/10.3390/w11112352
AMA Style
Chang Q, Zhang C, Zhang S, Li B. Streamflow and Sediment Declines in a Loess Hill and Gully Landform Basin Due to Climate Variability and Anthropogenic Activities. Water. 2019; 11(11):2352. https://doi.org/10.3390/w11112352
Chicago/Turabian StyleChang, Qingrui, Chi Zhang, Song Zhang, and Binquan Li. 2019. "Streamflow and Sediment Declines in a Loess Hill and Gully Landform Basin Due to Climate Variability and Anthropogenic Activities" Water 11, no. 11: 2352. https://doi.org/10.3390/w11112352
Note that from the first issue of 2016, this journal uses article numbers instead of page numbers. See further details here.