Article

Integrated Modelling for Groundwater Contamination from Polluted Streams Using New Protection Process Techniques

by
Ismail Abd-Elaty
1,
Martina Zelenakova
2,*,
Salvatore Straface
3,
Zuzana Vranayová
4 and
Mohamed Abu-hashim
5
1
Water and Water Structures Engineering Department, Faculty of Engineering, Zagazig University, Zagazig 44519, Egypt
2
Department of Environmental Engineering, Faculty of Civil Engineering, Technical University of Kosice, Kosice 04200, Slovakia
3
Department of Environmental and Chemical Engineering, University of Calabria, Ponte P. Bucci, 87036 Rende, Italy
4
Department of Building Services, Faculty of Civil Engineering, Technical University of Kosice, Kosice 04200, Slovakia
5
Soil Science Department, Faculty of Agriculture, Zagazig University, Zagazig 44519, Egypt
*
Author to whom correspondence should be addressed.
Water 2019, 11(11), 2321; https://doi.org/10.3390/w11112321
Submission received: 22 August 2019 / Revised: 13 October 2019 / Accepted: 15 October 2019 / Published: 6 November 2019
(This article belongs to the Section Water Quality and Contamination)

Abstract

:
Evaluating water quality indicators is a crucial issue in integrated water resource management, since potable water is an essential resource for the world’s health and sustainable development. The current study was developed using a coupled model of MODFLOW and MT3DMS (Mass Transport 3-Dimension Multi-Species) to integrate two water supply systems, surface water (polluted drains and canals) and ground water, to identify the contamination process of the groundwater from drains as fresh water is polluted and the contamination level exceeds the standard limits. The study was applied to two cases: the first was a hypothetical simulation and the second was the real case of the Nile Delta Aquifer (NDA). Four different scenarios were simulated to first identify groundwater contamination by total dissolved solids (TDS), and then select the more efficient protection process. The first scenario involved changing polluted drain and canal boundary conditions regarding head and concentration; the second consisted of studying the location of the polluted drain in a low permeability layer or a confined aquifer; the third was based on installing a cut-off wall in the polluted drain sides; and the fourth investigated the use of lining materials for polluted drains. The results reveal that aquifer contamination was decreased by increasing the water head of canals by 50 cm and decreasing the drain head by 50 cm and concentration by 25%, whereby large quantities of groundwater were protected. The percentages of salt repulsion in the hypothetical case were +10.66, +12.89, and +24.99%, while in NDA they were +6.29, +8.71, and +25% respectively compared with the base case. Decreasing the aquifer hydraulic conductivity led to decrease in aquifer contamination, in which the confined aquifer pollution was less than the unconfined aquifers due to the clay cap, which plays a significant role in minimizing the solute transport into the groundwater reservoir, and to reduction of the aquifer salt variation by +19.01% for the hypothetical case. The results indicate that the cut-off wall is effective for contamination management in shallow aquifers (hypothetical case) and the reduction in aquifer salt was +28.49%, whereas it had no effect in the deep aquifer (NDA), where the salt was reduced by just +0.34%. Using the drain lining scenario prevented contamination from the polluted drains and protected the freshwater in the aquifer, so that the aquifer salt mass reductions were +91.02 and +70.13% for the hypothetical case and NDA respectively, indicating that this method is more effective for controlling groundwater contamination. Polluted drains should be located in a low permeability layer to minimize the water degradation. This study represents a new contribution to groundwater protection techniques by changing the boundary conditions, installing a cut-off wall and using linings for polluted drains, and shows the way forward for the future treatment of polluted stream networks.

1. Introduction

Major constraints on arid-region water bodies are water contamination, droughts, and modification to rivers for irrigation purposes. Contamination of aquatic ecosystems has a substantial impact in the development of agriculture, municipalities and other sources [1]. The threat of groundwater contamination is increasing due to rapid increase in industrialization and urbanization [2]. From the sustainable development perspective, environmental, economic and social impacts are consequences of water pollution in any region of the world. Thus careful attention should be paid to preserving water resources [3]. Prevention and remediation strategies for groundwater pollution can be successfully carried out if the location, concentration, and release history of contaminants can be accurately identified [4]. The term water contamination refers to water that is degraded by human activities. The major pollution sources in water bodies are initiated from the collection and discharge of the waste water from households, industry, agricultural activities that contribute to the groundwater crises [5]. Soil and water are considered as the main resources which affect agricultural sustainability efforts and guarantee the yield production. In recent years, the pressure on these resources has grown extraordinarily. The agriculture drainage was applied to compensate the water scarcity to improve the cultivated lands and increase the farmer’s social and economic status [6]. Several challenges face the water sector in Egypt, including limited water resources from the river Nile, which represents more than 90% of water supply and comes from outside its borders, low rainfall, non-renewable groundwater, overpopulation, and water quality degradation [7]. The problems of water quality occur with repeated re-use, disposal into closed basins, injections and percolation into deep wells, which all lead to the groundwater contamination [8].
The Nile River basin has changed markedly with time; however its historical legacy still affects present-day geopolitics [9]. Dating from 1959, Egypt and Sudan have a right to respectively 55.0 billion cubic meters (BCM) and 18.5 BCM from 84 BCM of total Nile flow [10]. In 2011, the Ethiopian government started to build the Grand Ethiopian Renaissance Dam Project (GERDP) on the Blue Nile River at Guba, 60 kilometers from Sudan, which holds 74 BCM storage capacities [11]. Mulat (2014) [12] identified the impact of GERDP filling and operation on the performance of High Aswan Dam (HAD) and showed that the filling period of 6 years had little impact on HAD without additional management investment. Abd-Elhamied et al., (2018) [13] performed a numerical study to simulate and investigate the impact of GERDP on water resources in the Nile delta, and their study indicated that the reduction in Nile flow would impact on groundwater recharge and increase the aquifer salinity. In addition, with its growth in population, Egypt is expanding its agricultural land and re-use of agricultural drainage water in irrigation approximately by 405,000 hectares in the Nile delta [14].
The drainage system designs have a great impact on the water quality parameters. The sources of open drain water are from the sub-surface drains by infiltration of excess irrigation water and seepage from soils. The drainage water quality depends on contamination substances used in agricultural activities and other waste disposal in it [15]. The Bahr El-Baqar drain is the most dangerous polluted drain in the Eastern Nile delta of Egypt [16] with total length 170 km [17]. It passes through a densely populated area of Qalubyia, Sharkia, Ismailia and Port Said Governorates. In addition, it receives and carries the greatest loads of waste water at about 3 BCM per year into Manzala Lake [18]. Moreover, Saad (1997) [19] indicated that the total water of the Bahr El-Baqar drain comes from drainage water sources: agricultural 58%, industrial 2%, and domestic and commercial 40%, as shown in Figure 1. El-Badry (2016) [20] indicated that the industrial activities and agricultural drains are main reasons for such pollution in Manzala Lake, Egypt.
Contamination of water decreases the quality and quantity of groundwater as well as surface water. Hydraulic conductivity and water retention properties also affect the groundwater solute transport model in the vadose zone [21]. The sources of groundwater pollution can be classified as having either natural or anthropogenic sources. The natural sources are mainly due to geological formations with shallow groundwater mass (water–rock interaction in cold waters), infiltration from low-quality surface water bodies (streams, rivers, and lakes), seawater intrusion, and effect of geothermal fluids (water–rock interaction in hot waters). The anthropogenic sources are generally ascribed to extreme use of agricultural, pesticides and fertilizers, mining wastes, disposal of industrial wastes, waste disposal sites, and imperfect well construction [22].
Chen et al. (2016) [23] simulated the groundwater contamination in Tainan City, Taiwan, and the study revealed that the total mass of pollutants in the aquifer increased by 72% after 10 years. Wang et al. (2018) [24] studied the groundwater quality of Turfy Swamps in the Changbai Mountain area below the highway as the related pollutant, and showed a great influence on the groundwater quality of these wetlands with increasing highway operation time. Paradis et al. (2016) [25] investigated groundwater nitrate concentration using a number of different groundwater flow and mass transport simulations to evaluate the potential impact of climate change and agricultural adaptation scenarios on Prince Edward Island, Canada. According to the simulations for year 2050, the climate and agricultural adaptation would lead to a 25 to 32 % increase in N-NO3 concentration throughout the Island aquifer system, while the change in groundwater recharge regime induced by climate change would only contribute 0 to 6 %. Their simulations showed that the study needs to develop and apply better agricultural management practices to ensure sustainability of long-term groundwater resources. Chintalapudi et al. (2017) [26] assessed the groundwater quality contamination threat around the industrial cluster at Rajasthan State Industrial Development and Investment Corporation (RIICO) in Jaipur district of Rajasthan, India. The potential of industrial activity to be the most dangerous source of pollution of the groundwater varies depending on the type of industry, the way of disposing of the waste output, and the contents of heavy elements.
Several simulations have been applied to identify the groundwater contamination in the Nile Delta aquifer (NDDA) using different field measurements and numerical techniques. Sherif and Al-Rashed (2001) [27] simulated the groundwater quality in the northern parts of the Delta using the SUTRA model (Saturated-Unsaturated Variable-Density Ground-Water Flow with Solute or Energy Transport) and showed that over pumping was the main factor in water pollution, and that future pumping should be practiced in the middle of the Nile delta and reduced in the eastern and western parts.
The environmental impacts of over-abstraction on the migration of contamination from industrial and agriculture activities using VISUAL MODFLOW(El-Arabi, 2007; Morsy 2009; Hendy 2012) [29,30,31] were simulated and showed changes in the groundwater systems in the north part of the eastern Nile delta that led to increases in the groundwater salinity. However, Mabrouk et al (2013) [32] investigated the impact of sea level rise on the northeastern Nile Delta, and revealed an increase in the extraction rates of brackish water and the salinity of groundwater. Sherif et al. (2012) [33] simulated the groundwater salinity using 3-D of FEFLOW (Finite Element subsurface FLOW system) in the Nile delta and revealed that the salinity increased with the aquifer depth due to SWI (Sea Water Intrusion). Moreover, Abd-Elhamid et al., (2018) [34] investigated and evaluated groundwater salinity related to seepage from open drains, considering different pumping schemes in unconfined aquifers. Furthermore, Abd-Elaty et al., (2014, 2019 and 2019) [35,36,37] identified the groundwater level and its salinity in the Nile delta for the current status-quo under different scenarios of SLR (Sea Level Rise), over abstraction, and shortage in Nile flow, indicating that the future freshwater storage capacity will be damaged under these conditions. Hussein et al., (2019) [38] simulated and predicted pollutant movements from the polluted industrial zone in 10th of Ramadan city to the Quaternary aquifer using MODFLOW-2000 with MT3D code. Their results reveal that the water of oxidation ponds should not be used for irrigation purposes without sufficient treatment processes to eliminate the high concentration of the predicted pollutants.
Protection of groundwater from pollution is considered more appropriate to remediation [39]. Stefania et al., (2016) [40] simulated remediation scenarios of groundwater pollution by Cr (Chromium) (VI) sourced from a steelworks area that affects the Alpine aquifer system in the Aosta Plain (N Italy). The first scenario was activation of a hydraulic barrier composed of 5 wells (BW), which would drop the Cr(VI) concentrations below 5 µg per liter after 3 years from its start of operation. The second was the removal of the pollution sources from the unsaturated zone, which would have better results with respect to the activation of the hydraulic barrier where full remediation of the Cr(VI) groundwater plume would be obtained after 17 years from the sources removal, with a fall of 82% in Cr(VI) mass in the aquifer within the first 6 years. The third was faster remediation in a combination of the previous two scenarios. Talabi and Kayode (2019) [41], in which the prevention methods included proper waste disposal, monitoring of hazardous materials, conducting environmental audit periodically, oxygen sparing, bioremediation, air stripping, chemical oxidation and thermal treatment.
The aim of this study was to use the numerical models of MODFLOW and MT3DMS for solute transport to integrate the two water supply systems, surface water (polluted drains and canals) and groundwater, to identify the contamination process of the groundwater from polluted drains. The scientific significance of this work lies also in developing different techniques for groundwater protection which will be simulated, including changing canal and drain boundary conditions for head and concentration to demonstrate the influence of surface water level management and aquifer hydraulic conductivity to present the effect of confined and unconfined aquifers on groundwater contamination. A cut-off wall at the drain side was applied to present the role of installing physical barriers, and using lining materials on polluted drains to show the selection of polluted stream position. All these techniques will show the way towards the future design of irrigation and drainage networks. The study is simulated and the model is set up without considering the effect of seawater intrusion; on the other hand the model analysis is not related to coastal aquifers where the concentration differences between the Soult transport boundaries are less than 5000 ppm.

2. Materials and Methods

2.1. Description of Coupled Groundwater Flow and Solute Transport Model

The hypothetical model was simulated using the finite difference model of Visual MODFLOW −2000 [42]. The partial-differential equation of groundwater flow used in MODFLOW [43] is
t ( K x x h x ) + y ( K y y h y ) + z ( K z z h z ) + W = S s h t
The solute transport model was simulated using the 3-D of MT3D model and the partial differential equation can be written as follows [44]:
C t = x i ( D i j c x j ) + x i ( V i C ) + q s Ɵ ( C s ) + k = 1 N ( R k )
where Kxx, Kyy, and Kzz indicate aquifer conductivity along the x, y and z axes (L T−1), h: flow head (m), W: sources and/or sink of water (s−1), Ss: specific storage (m−1), t: time (T), C: groundwater concentration (ML−3), Dij: dispersion tensor (L2 T−1), i,j: represent the cell indices, Vi: seepage velocity (L T−1), qs: water flux of sources (positive) and sinks (negative) (T−1), θ: media porosity (dimensionless), Cs: sources or sinks concentration (ML−3), Rk: the rate of solute production or decay in reaction k of N different reactions (ML−3 T−1).

2.2. Hypothetical Case Study

This case was simulated to investigate the distribution and prevention of contamination in groundwater from the polluted drains. The model was carried out using a rectangular domain with ratio 2 to 1; horizontal direction (length L) of 100 m and the vertical direction of 50 m with the study width of 5 m. The hypothetical study has the drain package located on the left side to simulate the polluted drain, while the right side consists of the river package, and the bottom domain has the no flow boundary in it. Figure 2 presents the vertical cross section of the hypothetical study area.

2.2.1. Boundary Condition and Data Set

The numerical model MODFLOW was applied in the hypothetical study case study using the square cell dimension of 25 m2 with 20 columns, 10 layers and one row. Figure 3 shows the flow boundary condition by assigning the drain to the left side with water stage of (−2.50) below the ground surface (G.S), width of 5 m and depth of 3 m, while the river was assigned the stage of (−1.50) below G.S and width of 5 m with a water depth of 3 m. The concentration boundary condition was assigned a constant concentration of TDS with 5000 ppm in the polluted drain. The initial boundary condition was set at zero. Moreover, the model hydraulic parameters were set at 60 and 6 m/day for horizontal and vertical hydraulic conductivity, while the specific yield and specific storage were set at 0.15 and 0.001 respectively. In addition, the effective and total porosity were set at 0.20 and 0.25 respectively. The longitudinal (αL) and transverse (αT) dispersivity were set at 15 and 1.50 m while the diffusion coefficient was set at 0.0001 m2 per day.
The model results for head and concentration are presented in Figure 4, which indicates that the flow initiated from the high level from canal to drain, while the solute transport is from high concentration of drain to canal. The contamination reached 1037.50 ppm at the drain location and decreased in the river direction to reach 20 ppm at river location; also the aquifer salt mass balance was 4.091 × 10³ kg.

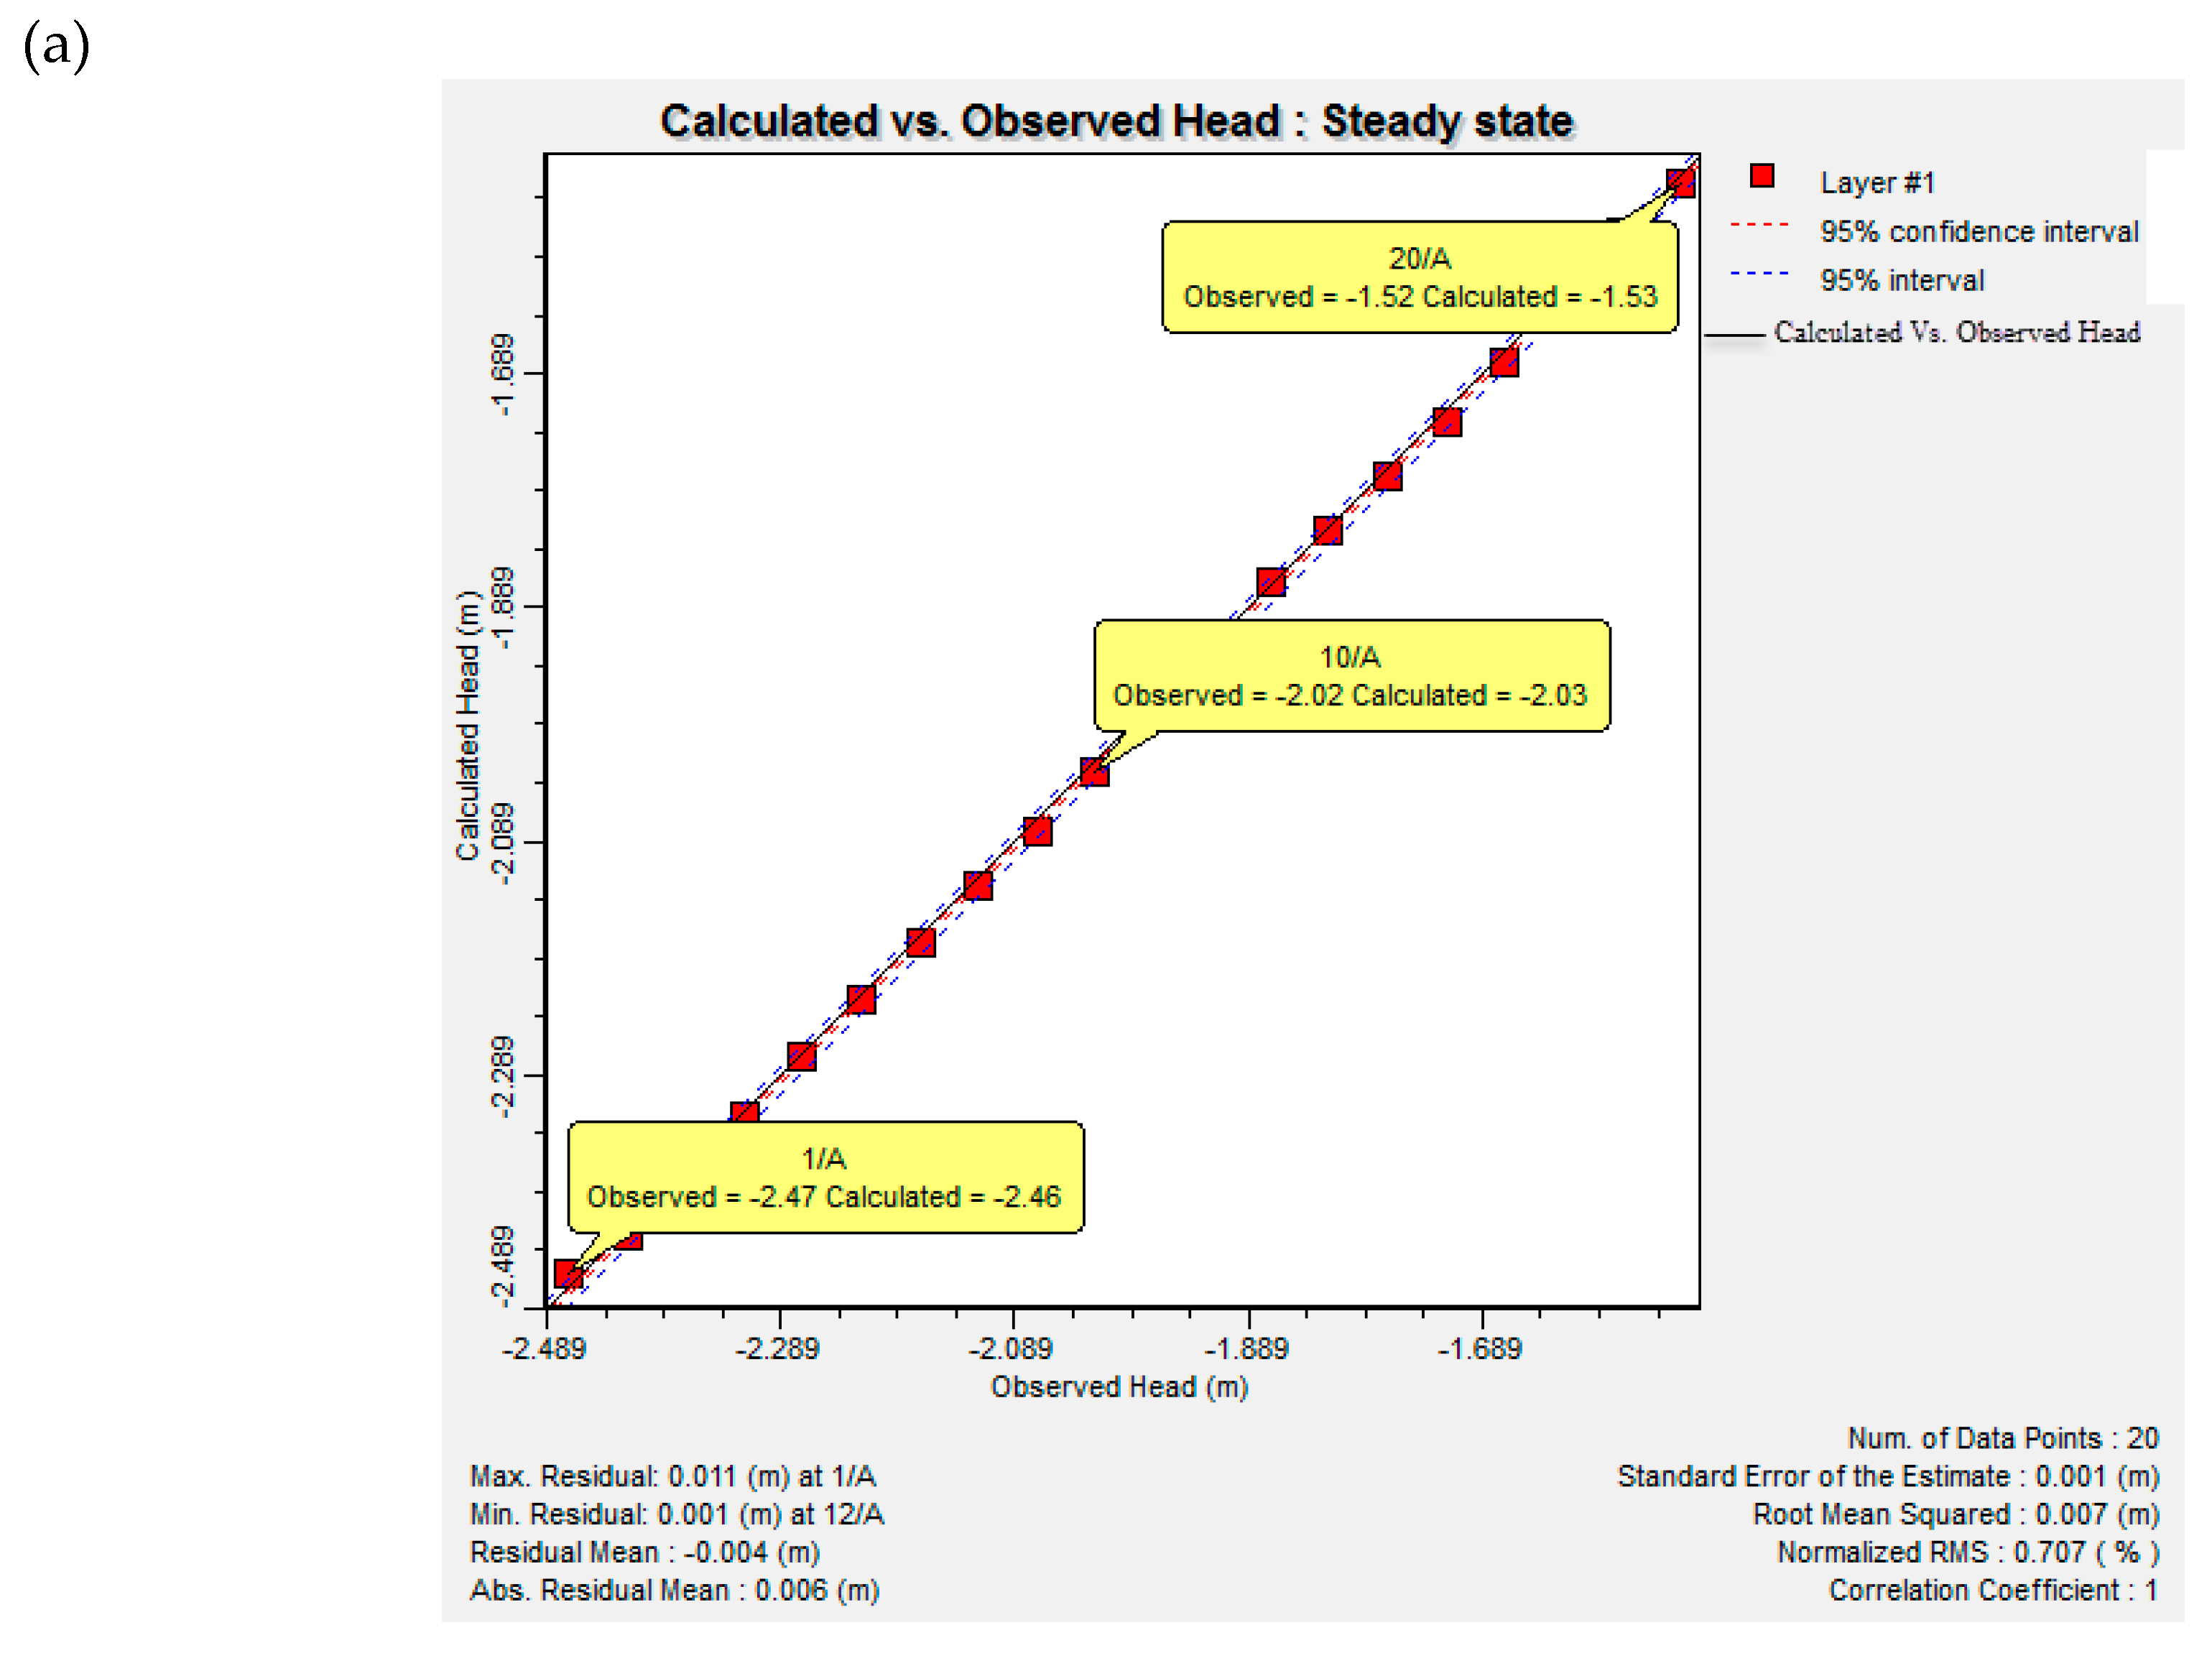
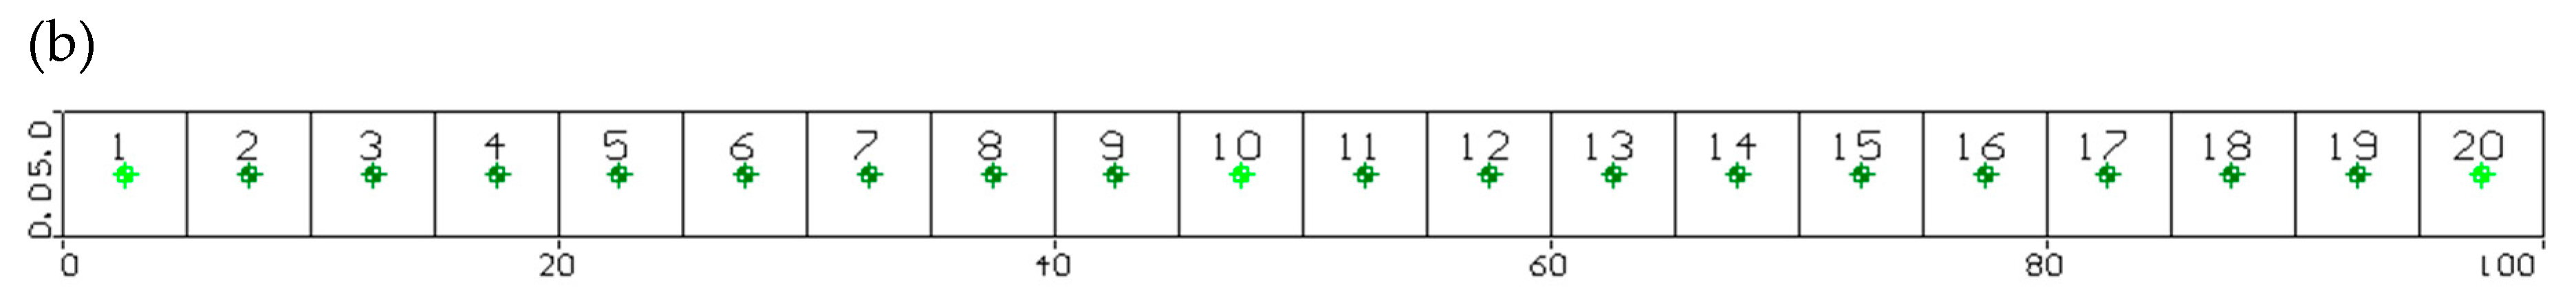
2.2.2. Calibration of Hypothetical Model

The analytical solution was used to develop the groundwater flow for this case study based on the general solution to Forchheimer’s equation by Bear (1972) [45] as follows:
h = ( h 0 2 + ( h L 2 h 0 2 L + W × L K ) × X W K × X 2 ) 0.50
where L is the distance between two rivers (L), h0: upstream fixed head (x = 0), hL: downstream fixed head (x = L), (it is assumed here that hL > h0), h is phreatic surface elevation at distance (x) (L), K: aquifer hydraulic conductivity (L T−1), and W is the annual average rate of recharge (L T−1).
Figure 5a represents the calibration of flow model between analytical solution and numerical model using 20 points, so that the maximum and minimum residual was +0.011 and +0.001 m with mean residual −0.004 m. The root mean square (RMS) is 0.007 m with normalized RMS of 0.707%. Additionally, the distribution of observation well locations for the hypothetical model is presented in Figure 5b.

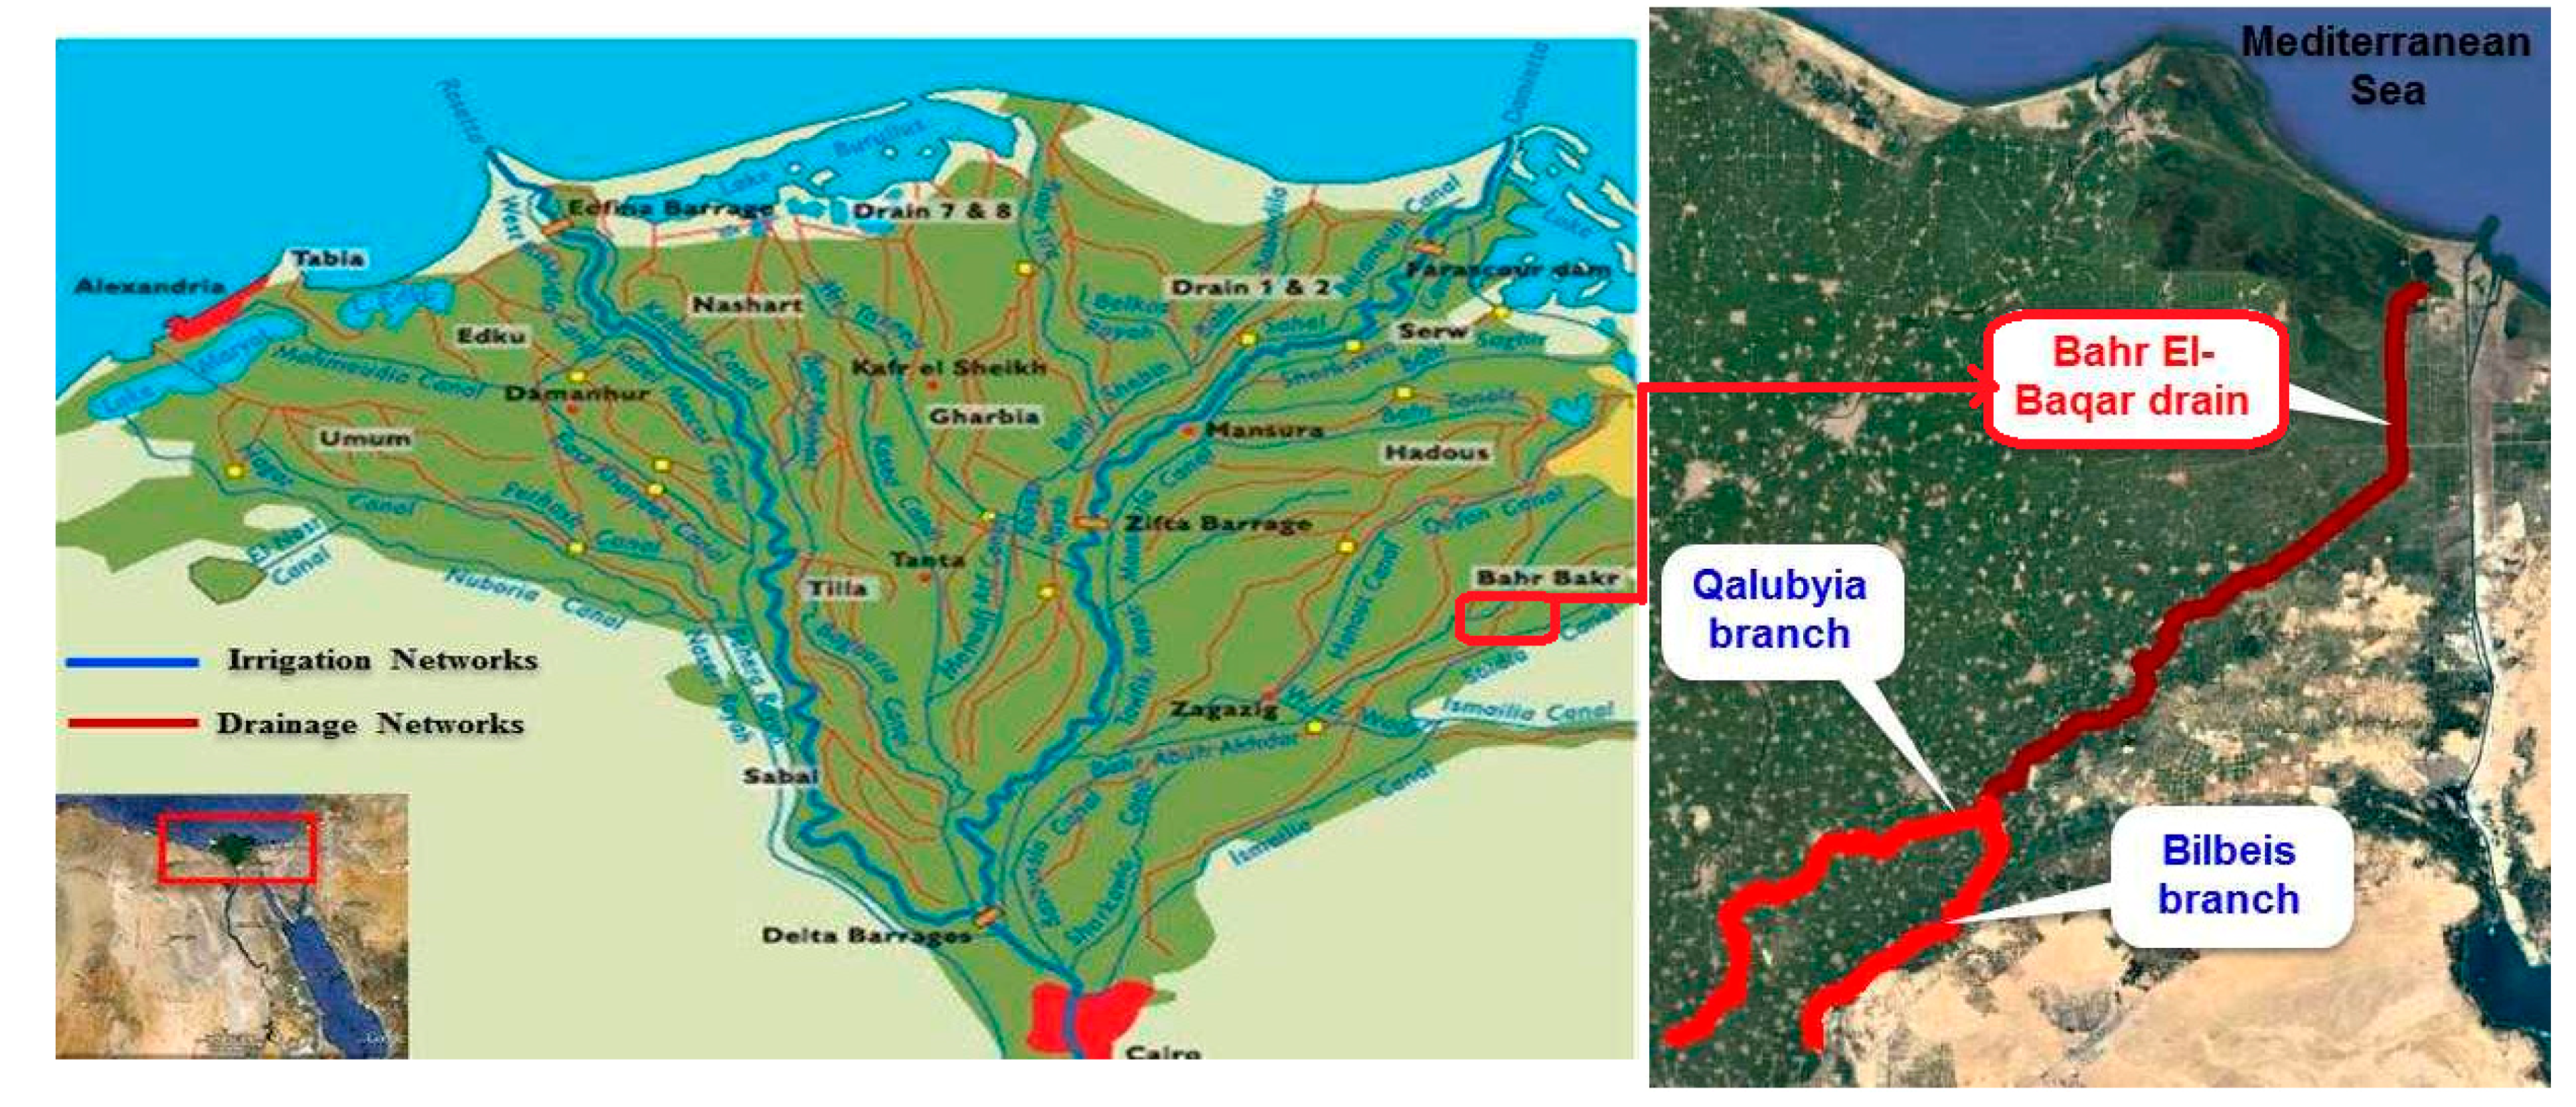
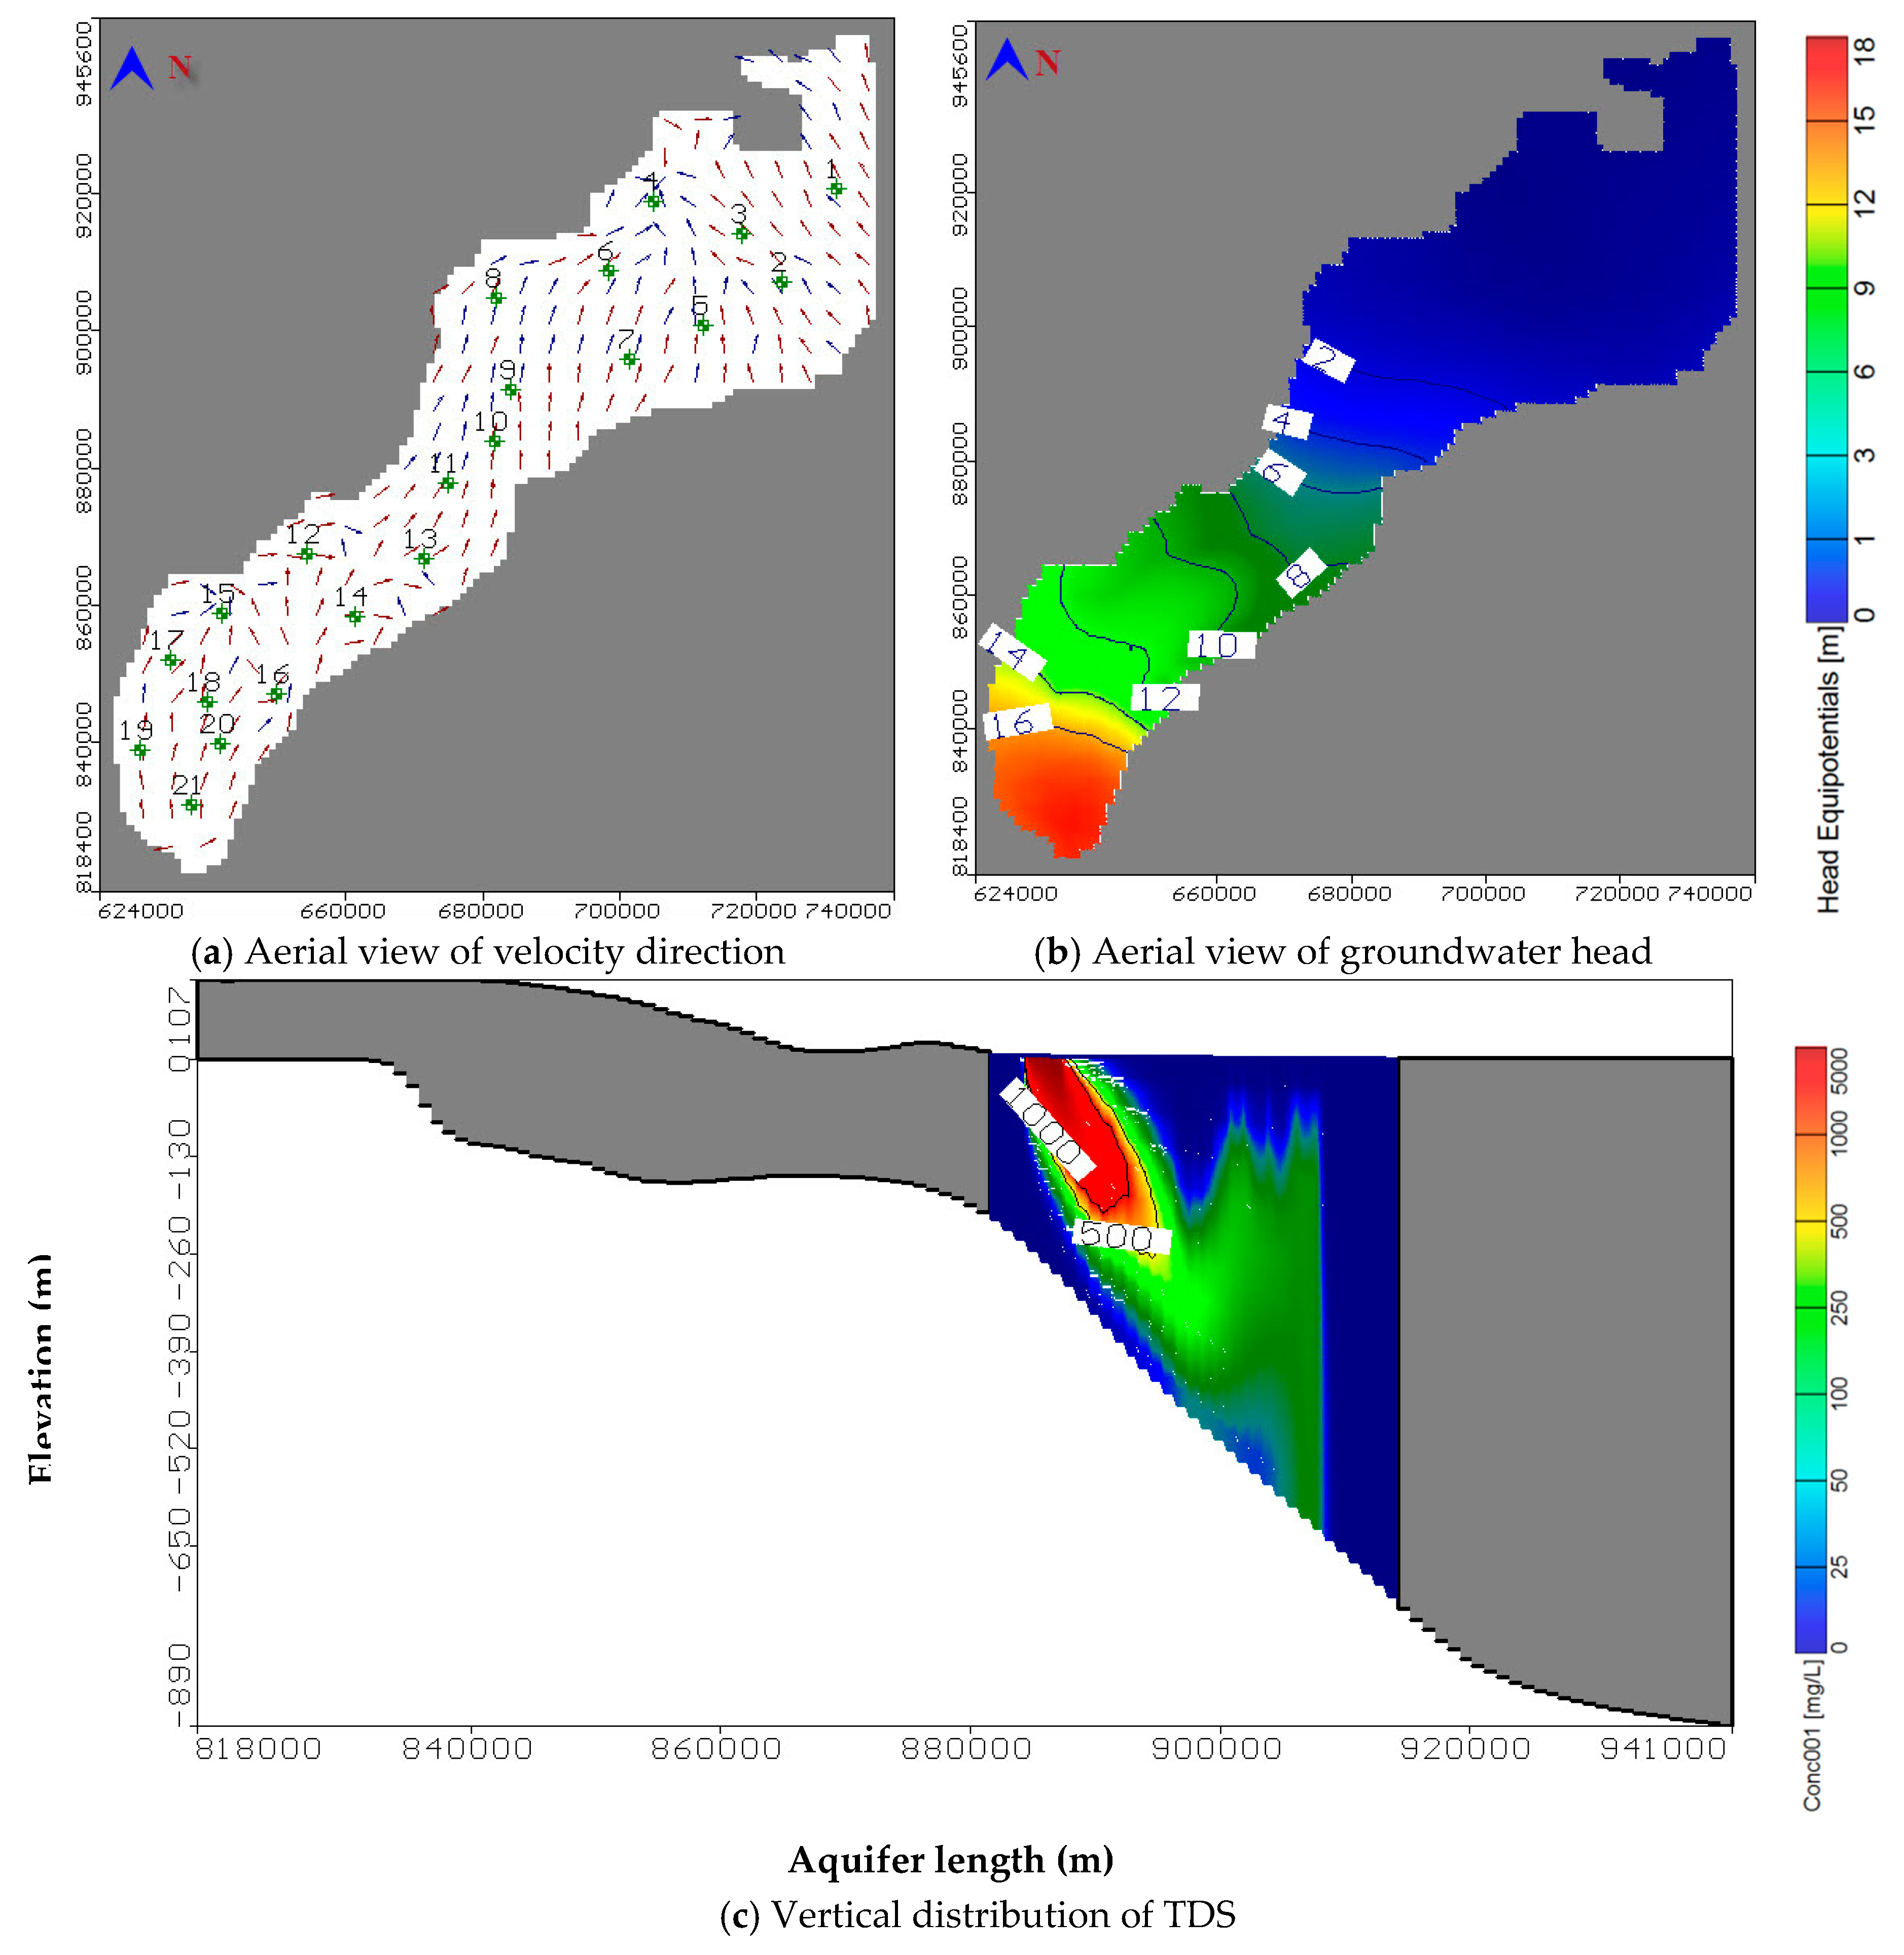
2.3. Nile Delta Aquifer Case Study

The Nile delta, a large river delta, extends up to 300 km along the coastal line of the Mediterranean Sea and its length reaches 200 km from north to south. It has an area of 25,000 km2 as shown in Figure 6 [15], with an average of rainfall of 25 mm per year in the south and middle to 200 mm per year in the north [46]. Average daily temperature ranges from 17 °C in the north to 25 °C in the south [47]. Evaporation rates vary between 4 to 7 mm per day from the north to the south [48].

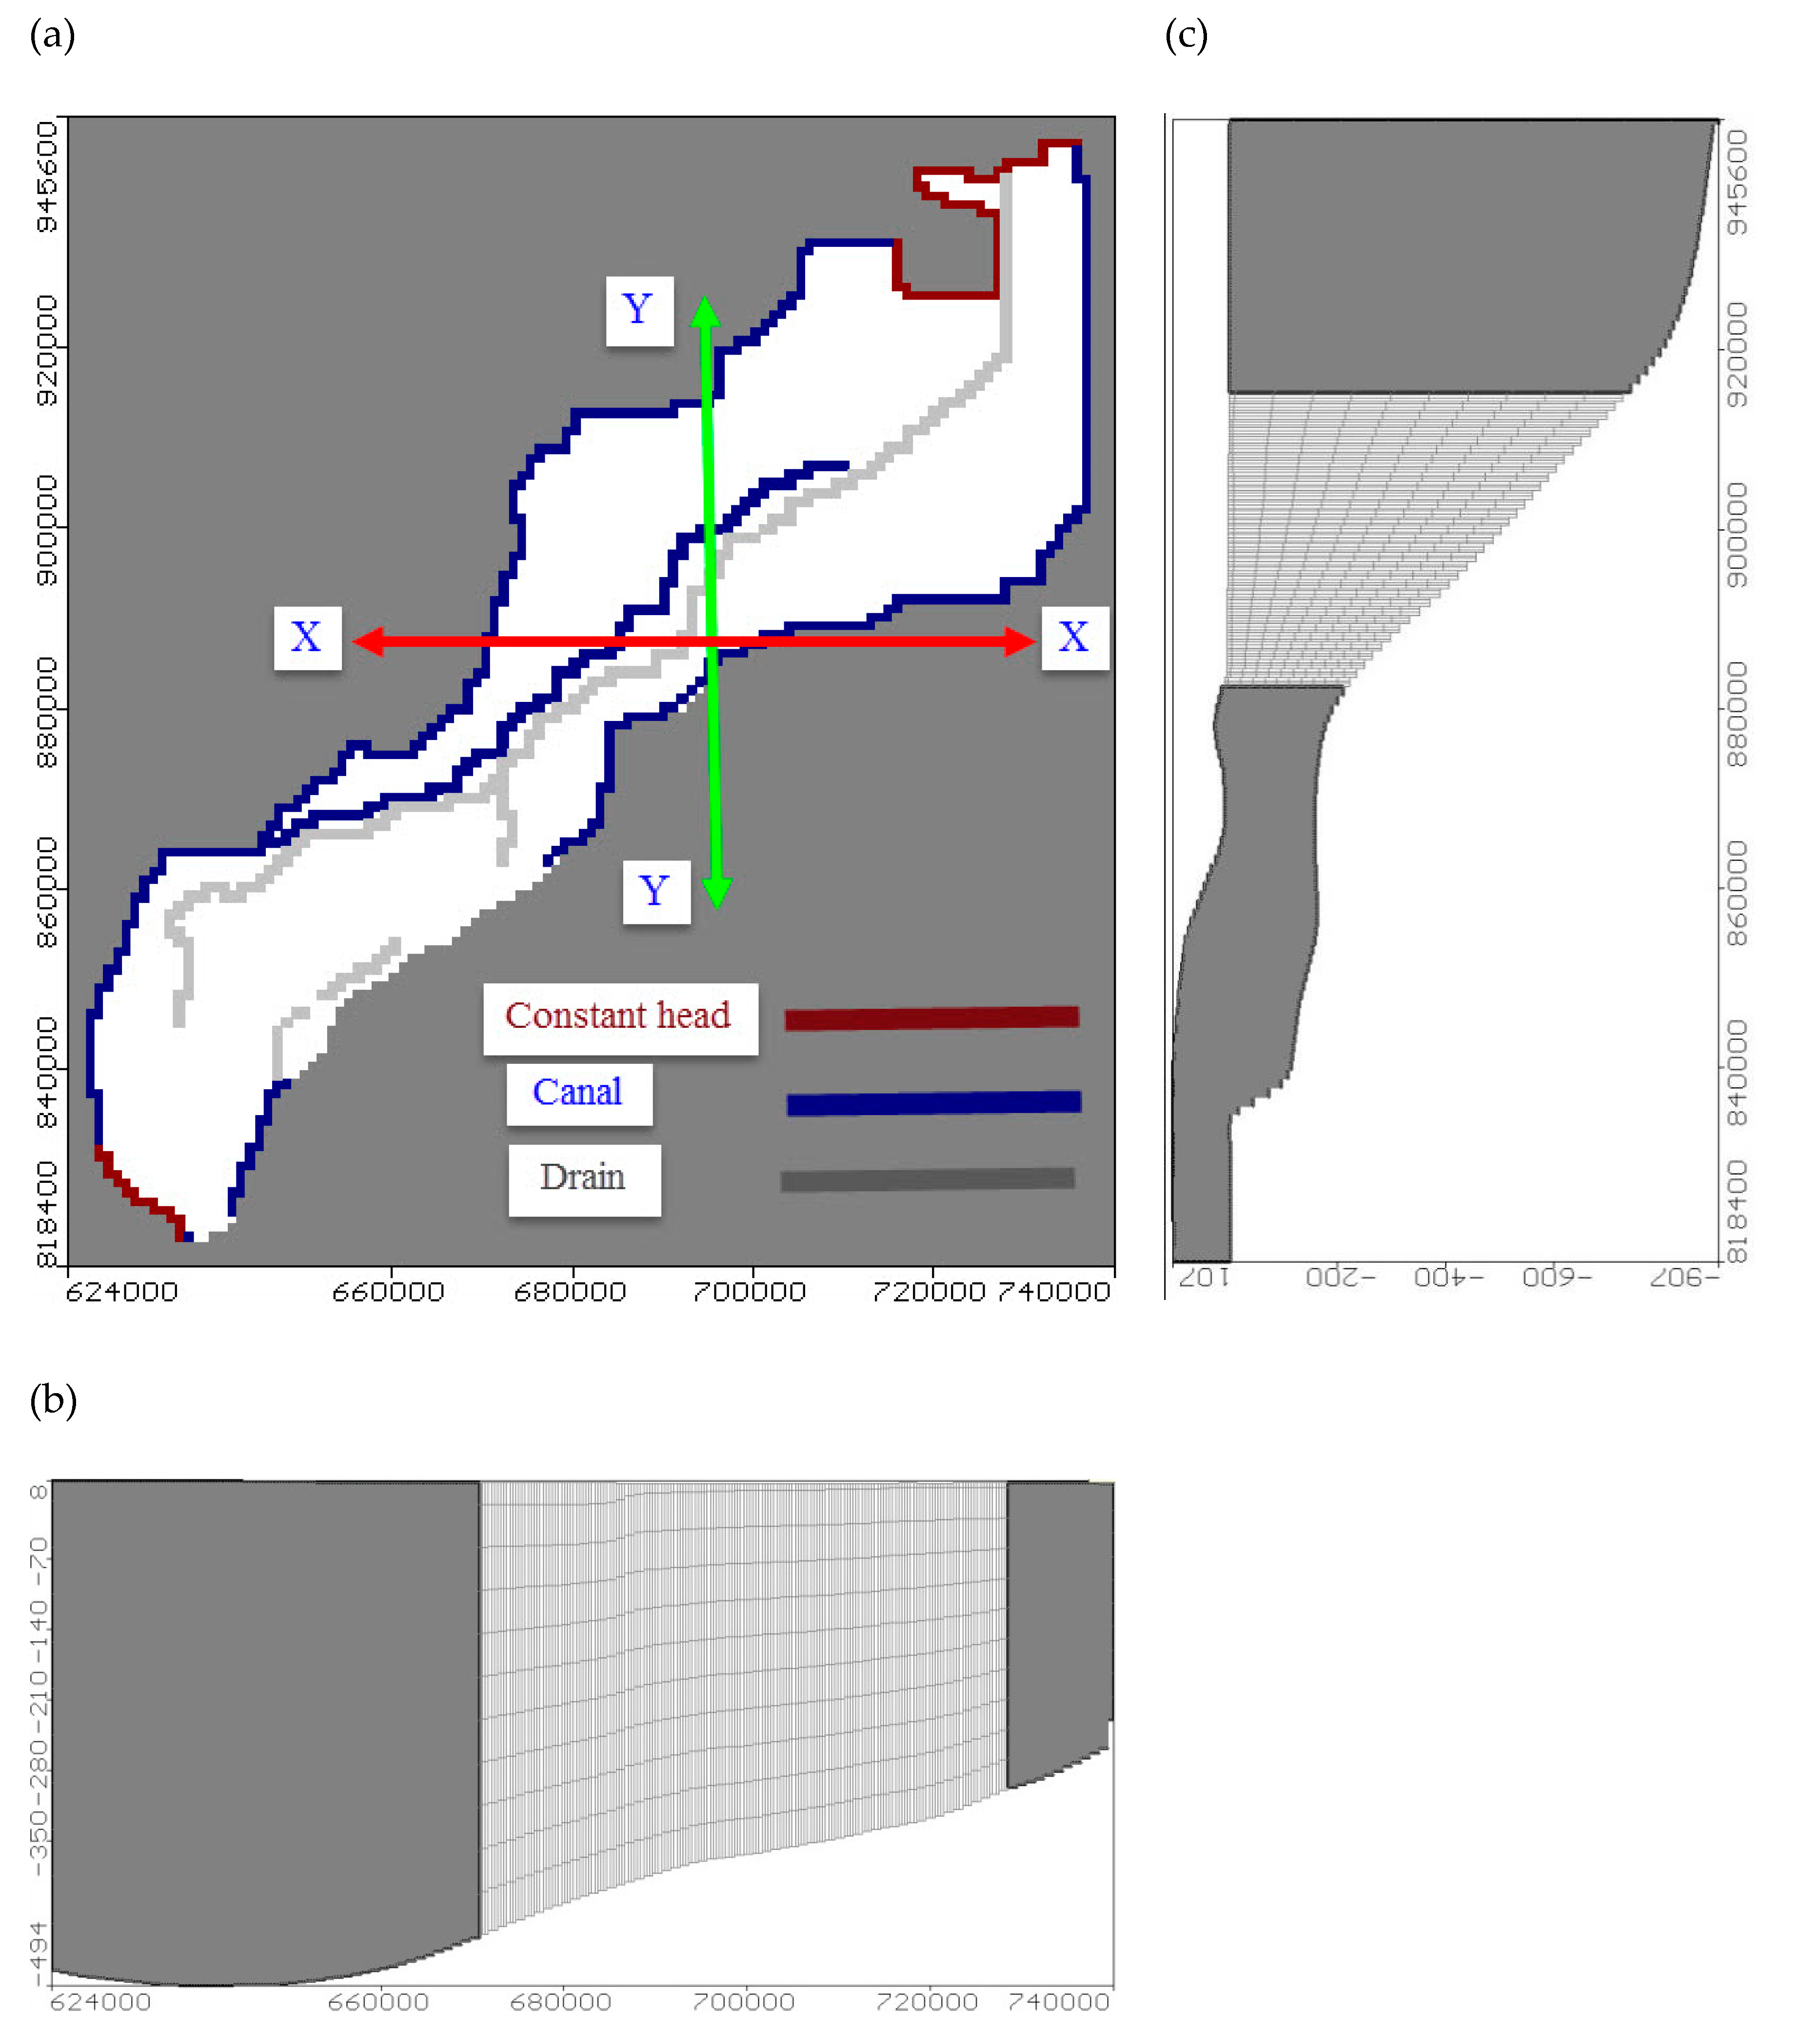
2.3.1. Numerical Modelling Set-up of Nile Delta

The numerical model was carried out using MODFLOW 2010.10 software over an area of 14,755 km2 using 380 rows and 350 columns for active and inactive cell using cell dimension of 333 m × 333 m as shown in Figure 7a. The model was developed using 10 layers, the first layer representing clay soil with 20 m thickness [49] and other layers from the second to the tenth are Quaternary aquifer with equal thickness of 100 m. Figure 7b,c presents the vertical model sections between the Ismailia canal and Bibles drain for the NDA.
The flow boundary was assigned using a constant head of zero along the Mediterranean shore line at the north boundary, while the west side was assigned with constant head varying from 16.50 in the south to zero in the north. The river package was assigned and started at 16.15 m in the south to 7 m in the east above MSL for Ismailia Canal. The initial values of hydraulic parameters used in the model were based on [46] reports and other studies (see Table 1). The aquifer recharge rate depends on the values of water seepage from the canal plus the excess water from the irrigation process and rainfall values with ranges between 0.25 and 0.80 mm/day; these values were calculated by [50]. Transport of multiple reactive solutes in groundwater was simulated using package of MT3DMS [51] from Visual MODFLOW software. The solute transport model was developed based on a calibrated groundwater flow model. The boundary condition was applied using constant concentration of Total Dissolved Solid (TDS) set at zero for all boundaries except for 2000 mg/L for the Bahr El-Baker drain. The initial concentration for the model was assigned as zero mg/L.

2.3.2. Hydrological and Hydraulic Parameters of Nile Delta

Groundwater bearing formations in the Nile delta are differentiated into two main aquifer systems; the first is tertiary aquifers including the Miocene, the Oligocene and Eocene aquifers. The second is quaternary aquifers including the Holocene, composed of silt and sandy clay with thickness ranges from 10 to 70 m, while the Pleistocene aquifer underlies the clay cap rock to a depth of 1000 m and consists of graded quartzitic sands with lenses of clay; these findings were consistent with [49]. In addition, 20% of groundwater quality in the Nile delta did not comply with the drinking water standards, especially at the fringes, which have low thickness of clay protection in the south, and the coastal zones which suffer from sea water intrusion (SWI), which could impact on food security [15].

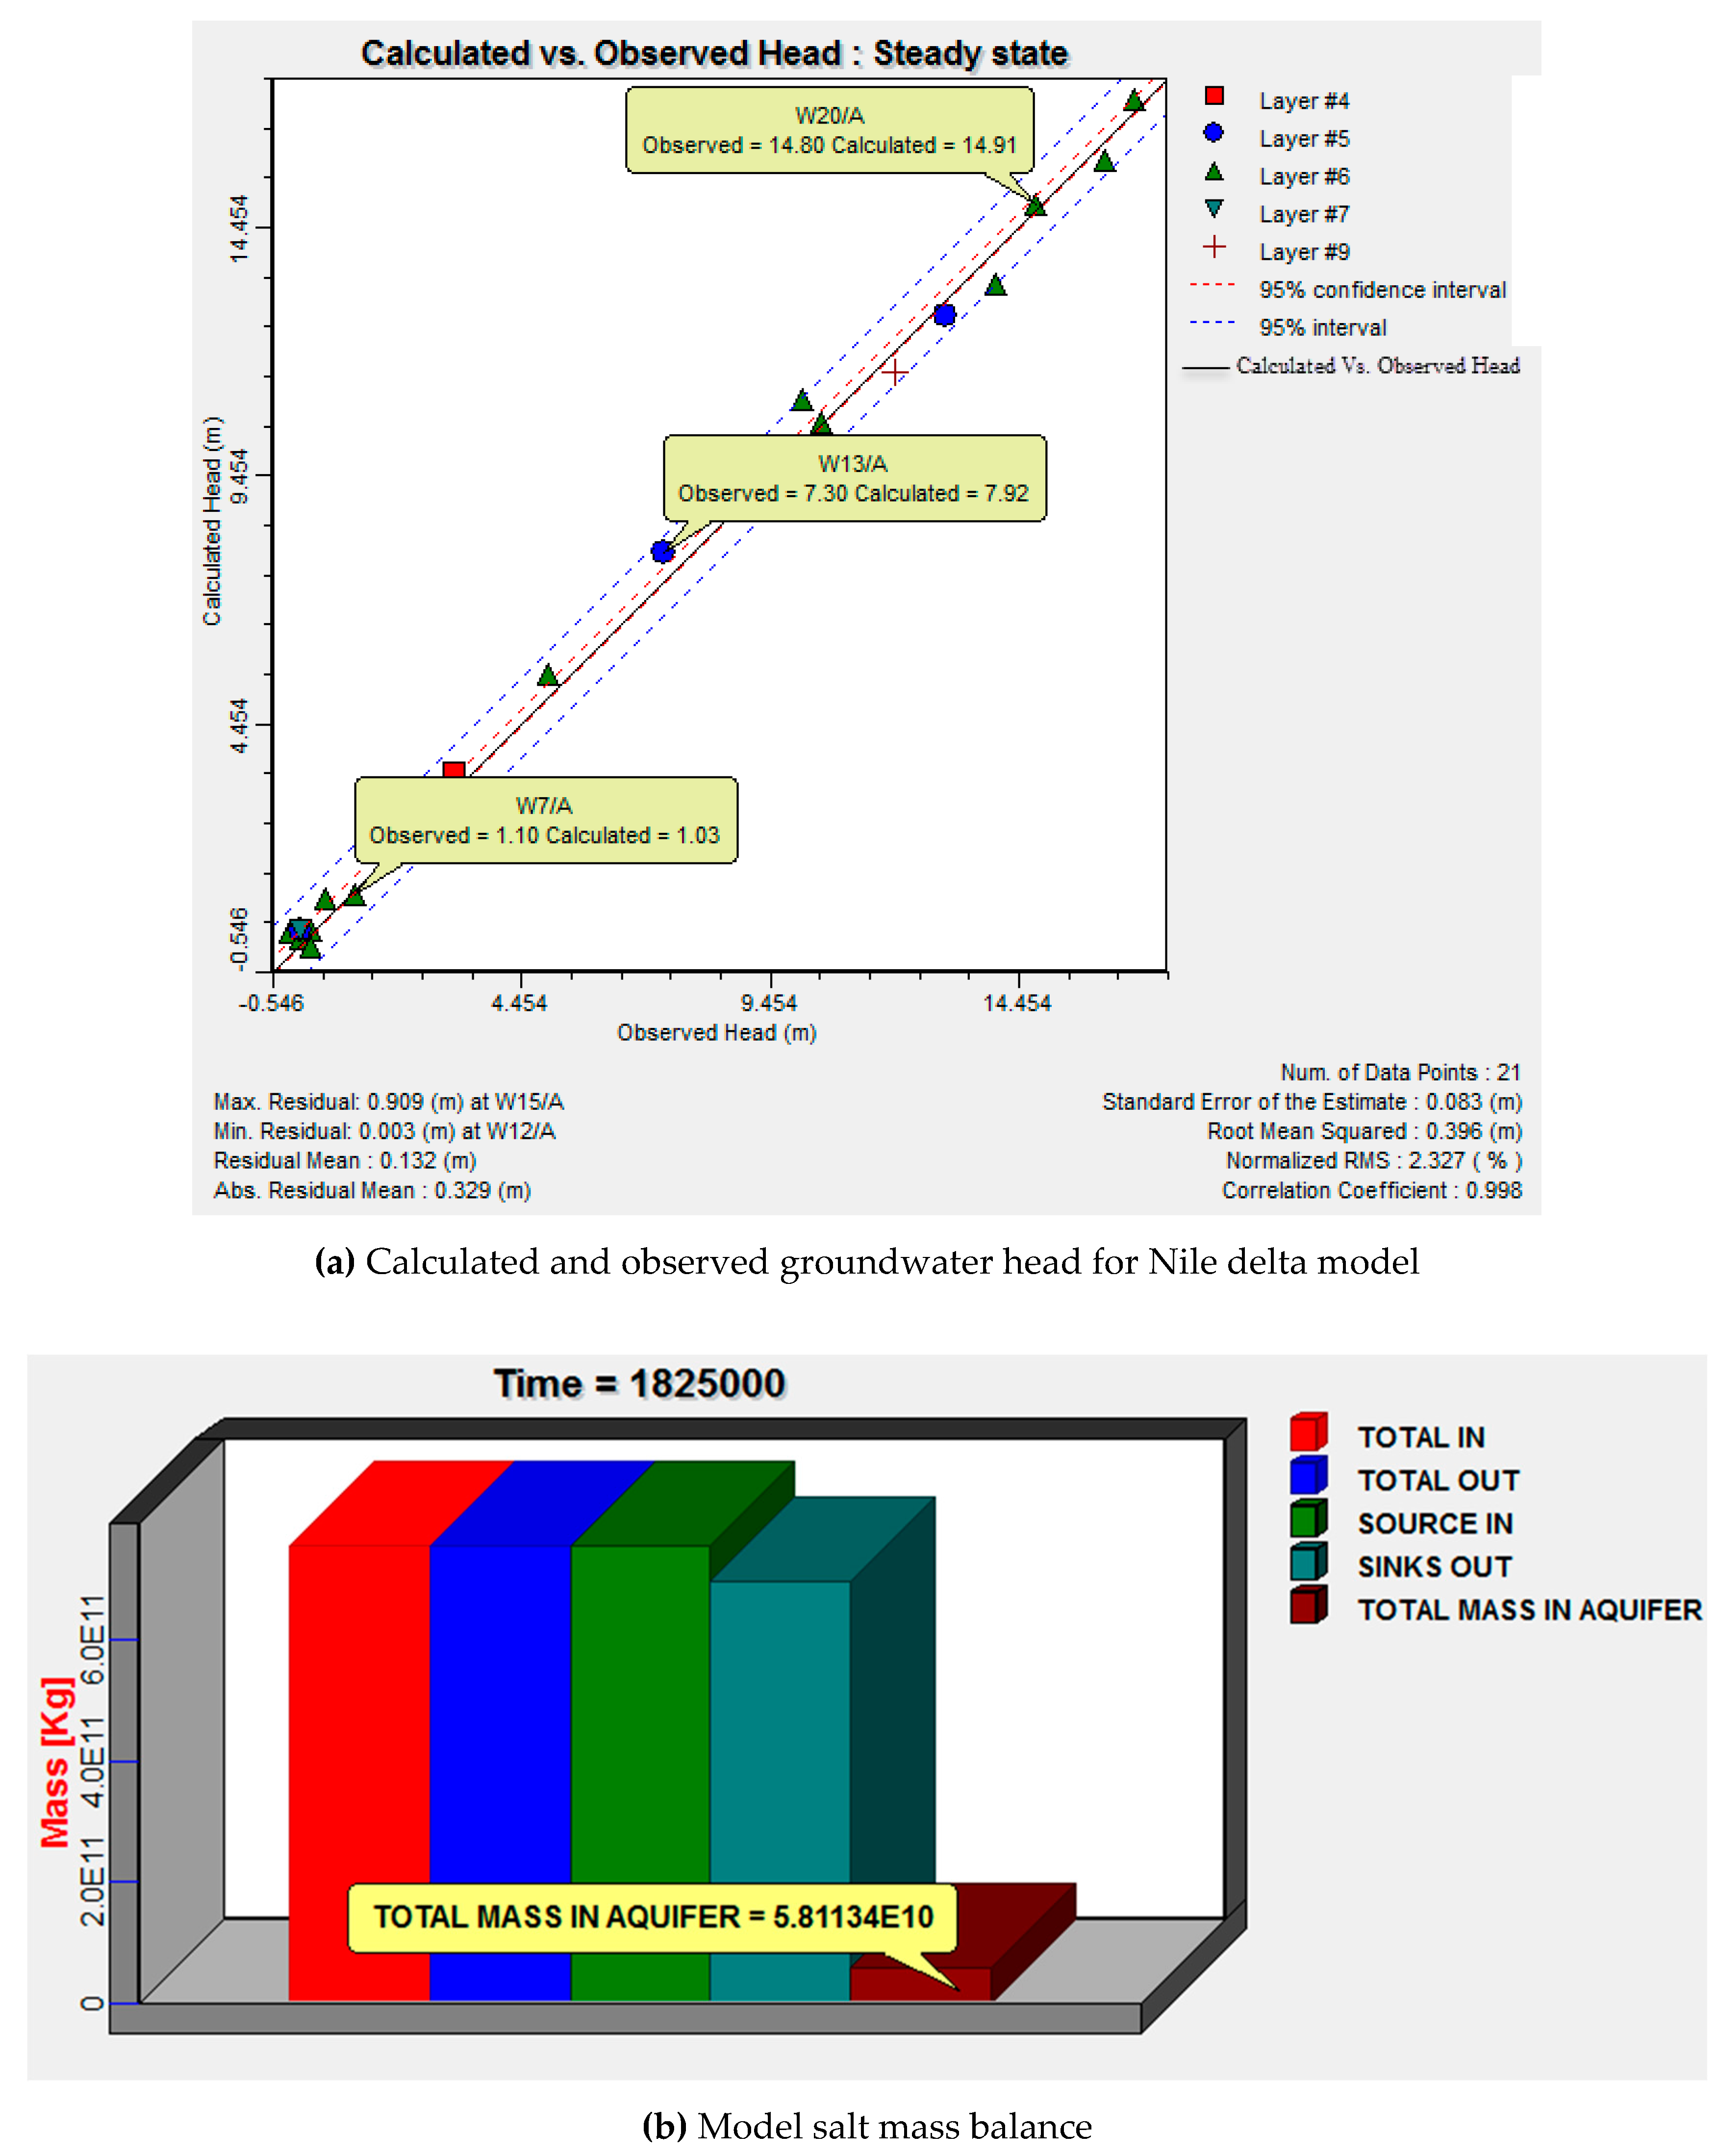
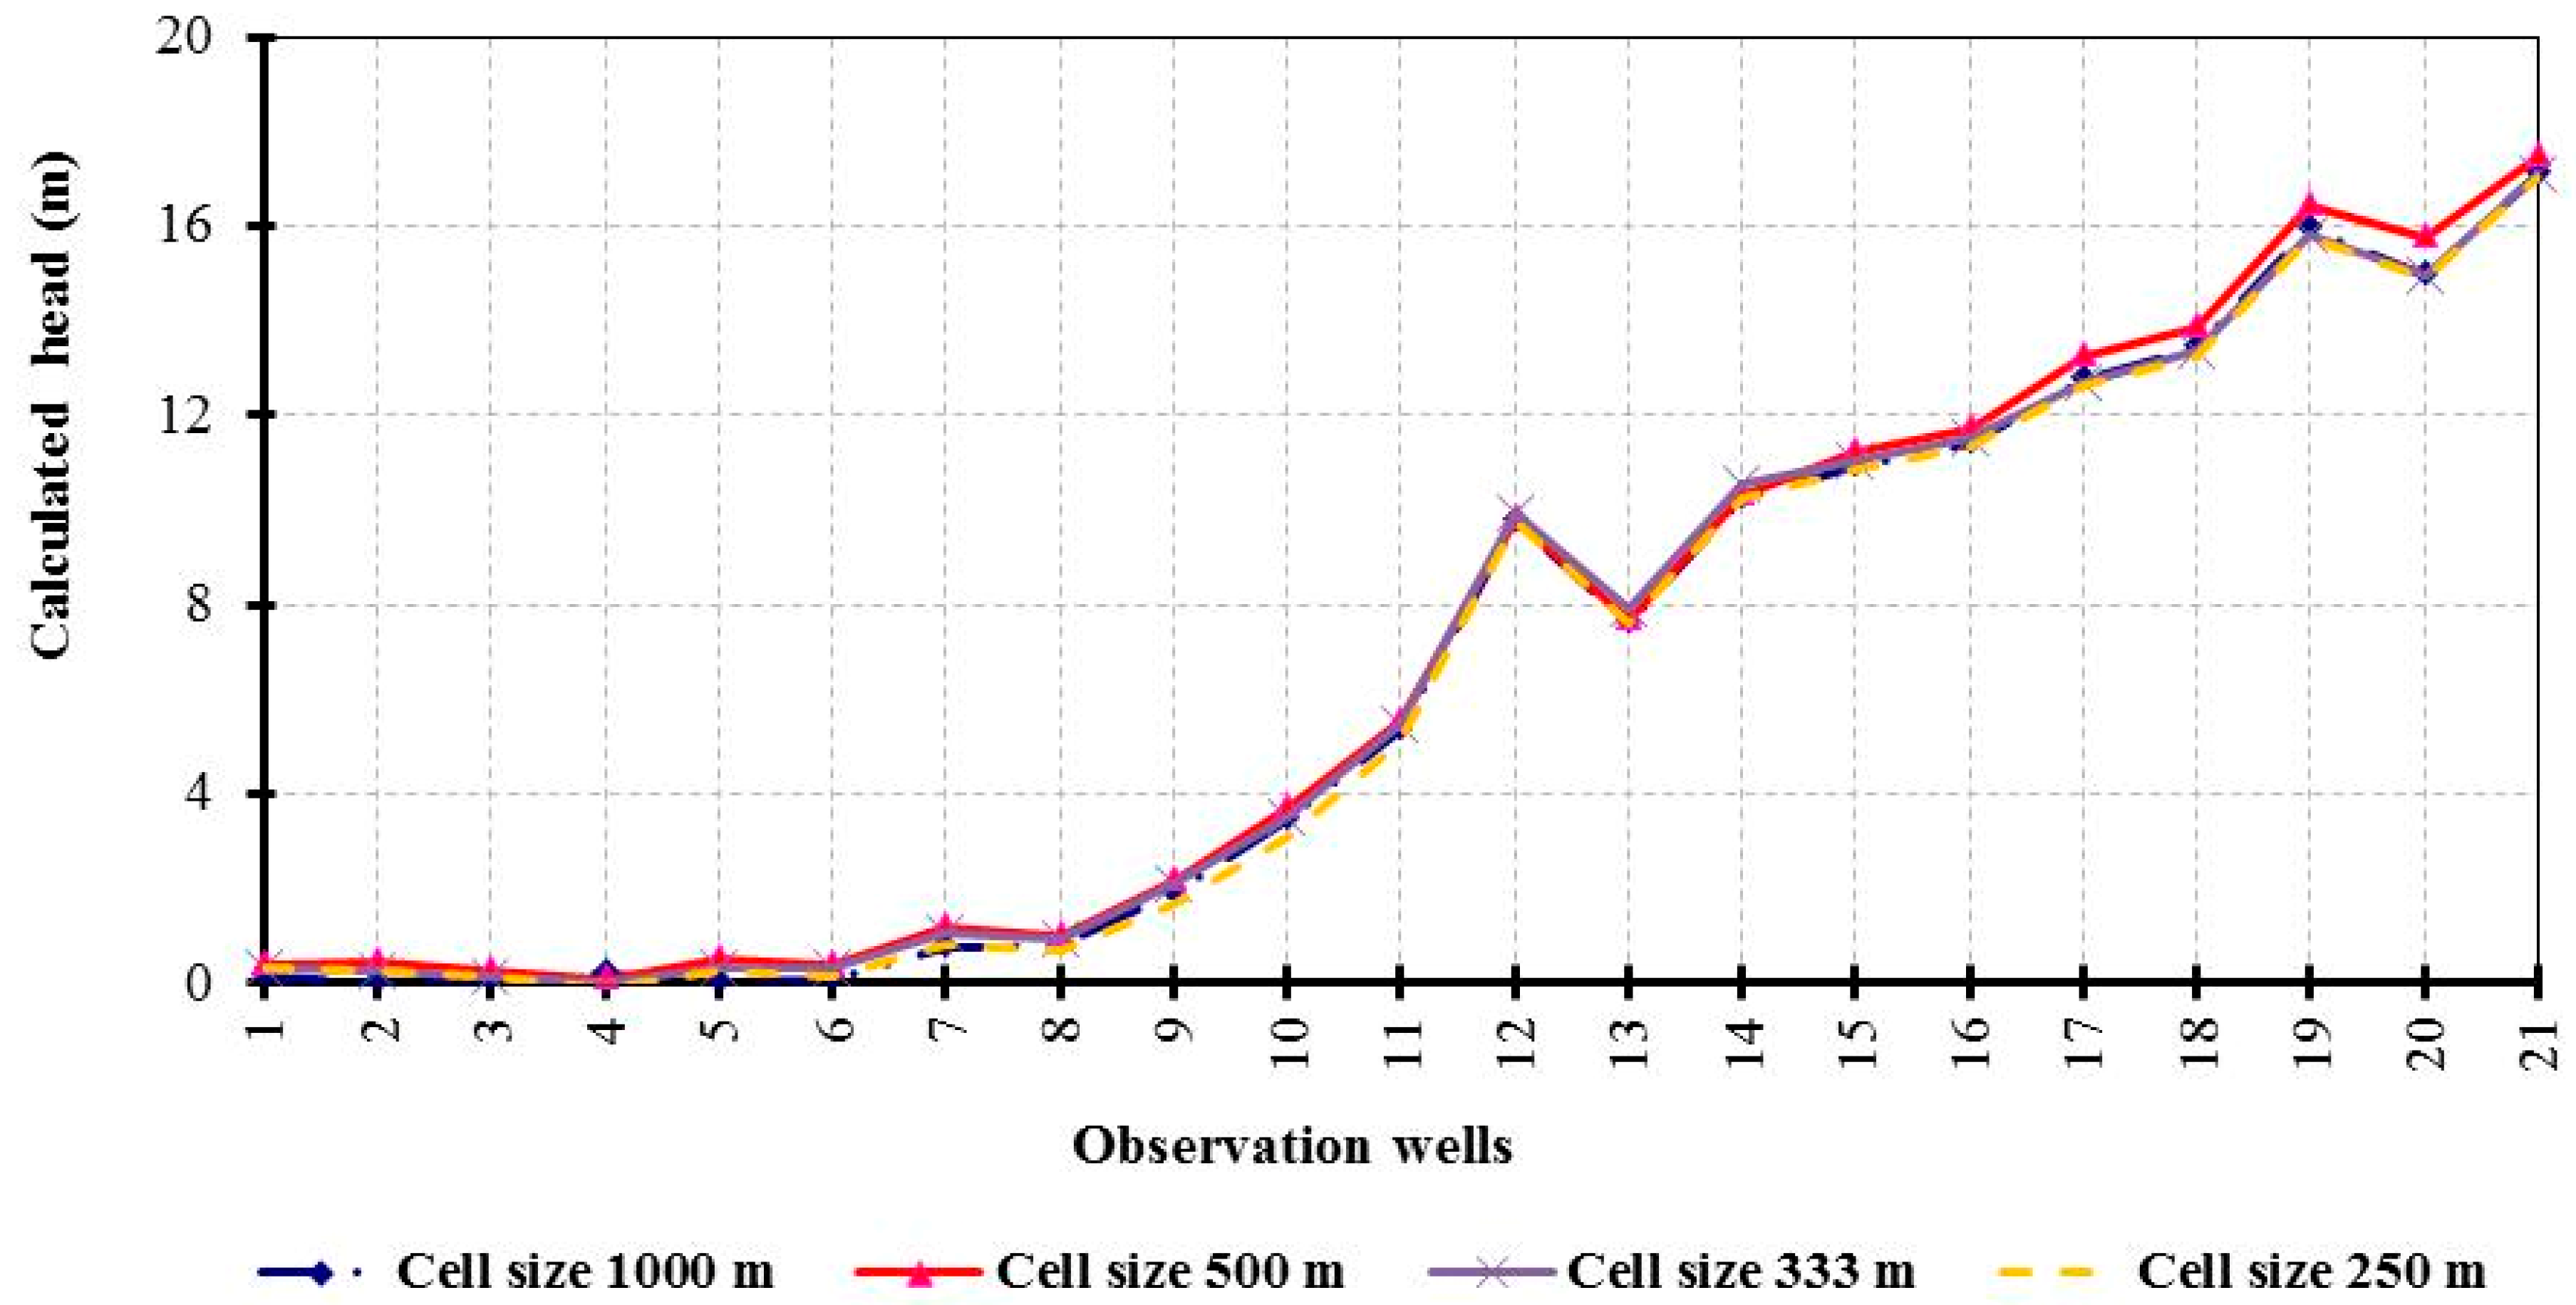
2.3.3. Calibration Model of Nile Delta Model

The most effective step in groundwater and solute transport modelling is that the differences between the calculated model head and the measured head from observation wells can be identified. The numerical model outputs for the flow are presented in Figure 8a, which shows the flow pattern and the locations of 21 observation wells, whereby the flow direction is from high level in the south to low level in the north. Figure 8b also presents the groundwater head in NDA, whereby the head varies from 18 m in the south to zero in the north. On the other hand, the model total inflow and outflow reached 2,590,833 m3 per day. The results of the calibration displayed agreement between the calculated and observed head as presented in Figure 9a, showing that the residual range varied between +0.909 and +0.003 m, with a root mean square (RMS) of 0.396 m, and a normalization RMS of 2.327%.
Moreover, Figure 8c shows the results of solute transport model for the total dissolved solid (TDS) in the vertical cross section, the pollution spread in horizontal direction and in aquifer depth, while the model mass balance reached 5.81134 × 10¹⁰ kg as shown in Figure 9b.
The Nile Delta Model (NDM) for flow and solute transport were simulated using different values of cell dimensions to check their sensitivity. Figure 10 shows the groundwater head with change in grid size, with the model grid sizes divided between 1000 m × 1000 m, 500 m × 500 m and 250 m × 250 m: the figure indicates low change in groundwater head with grid change. Moreover, the percentages of contamination change due to the cell size were +1.19, +0.616 and −0.612% for cell sizes 1000, 500 and 250 m respectively, and these values show that the model is stable for use in future scenarios for cell dimensions of 333 m.

3. Results and Discussions

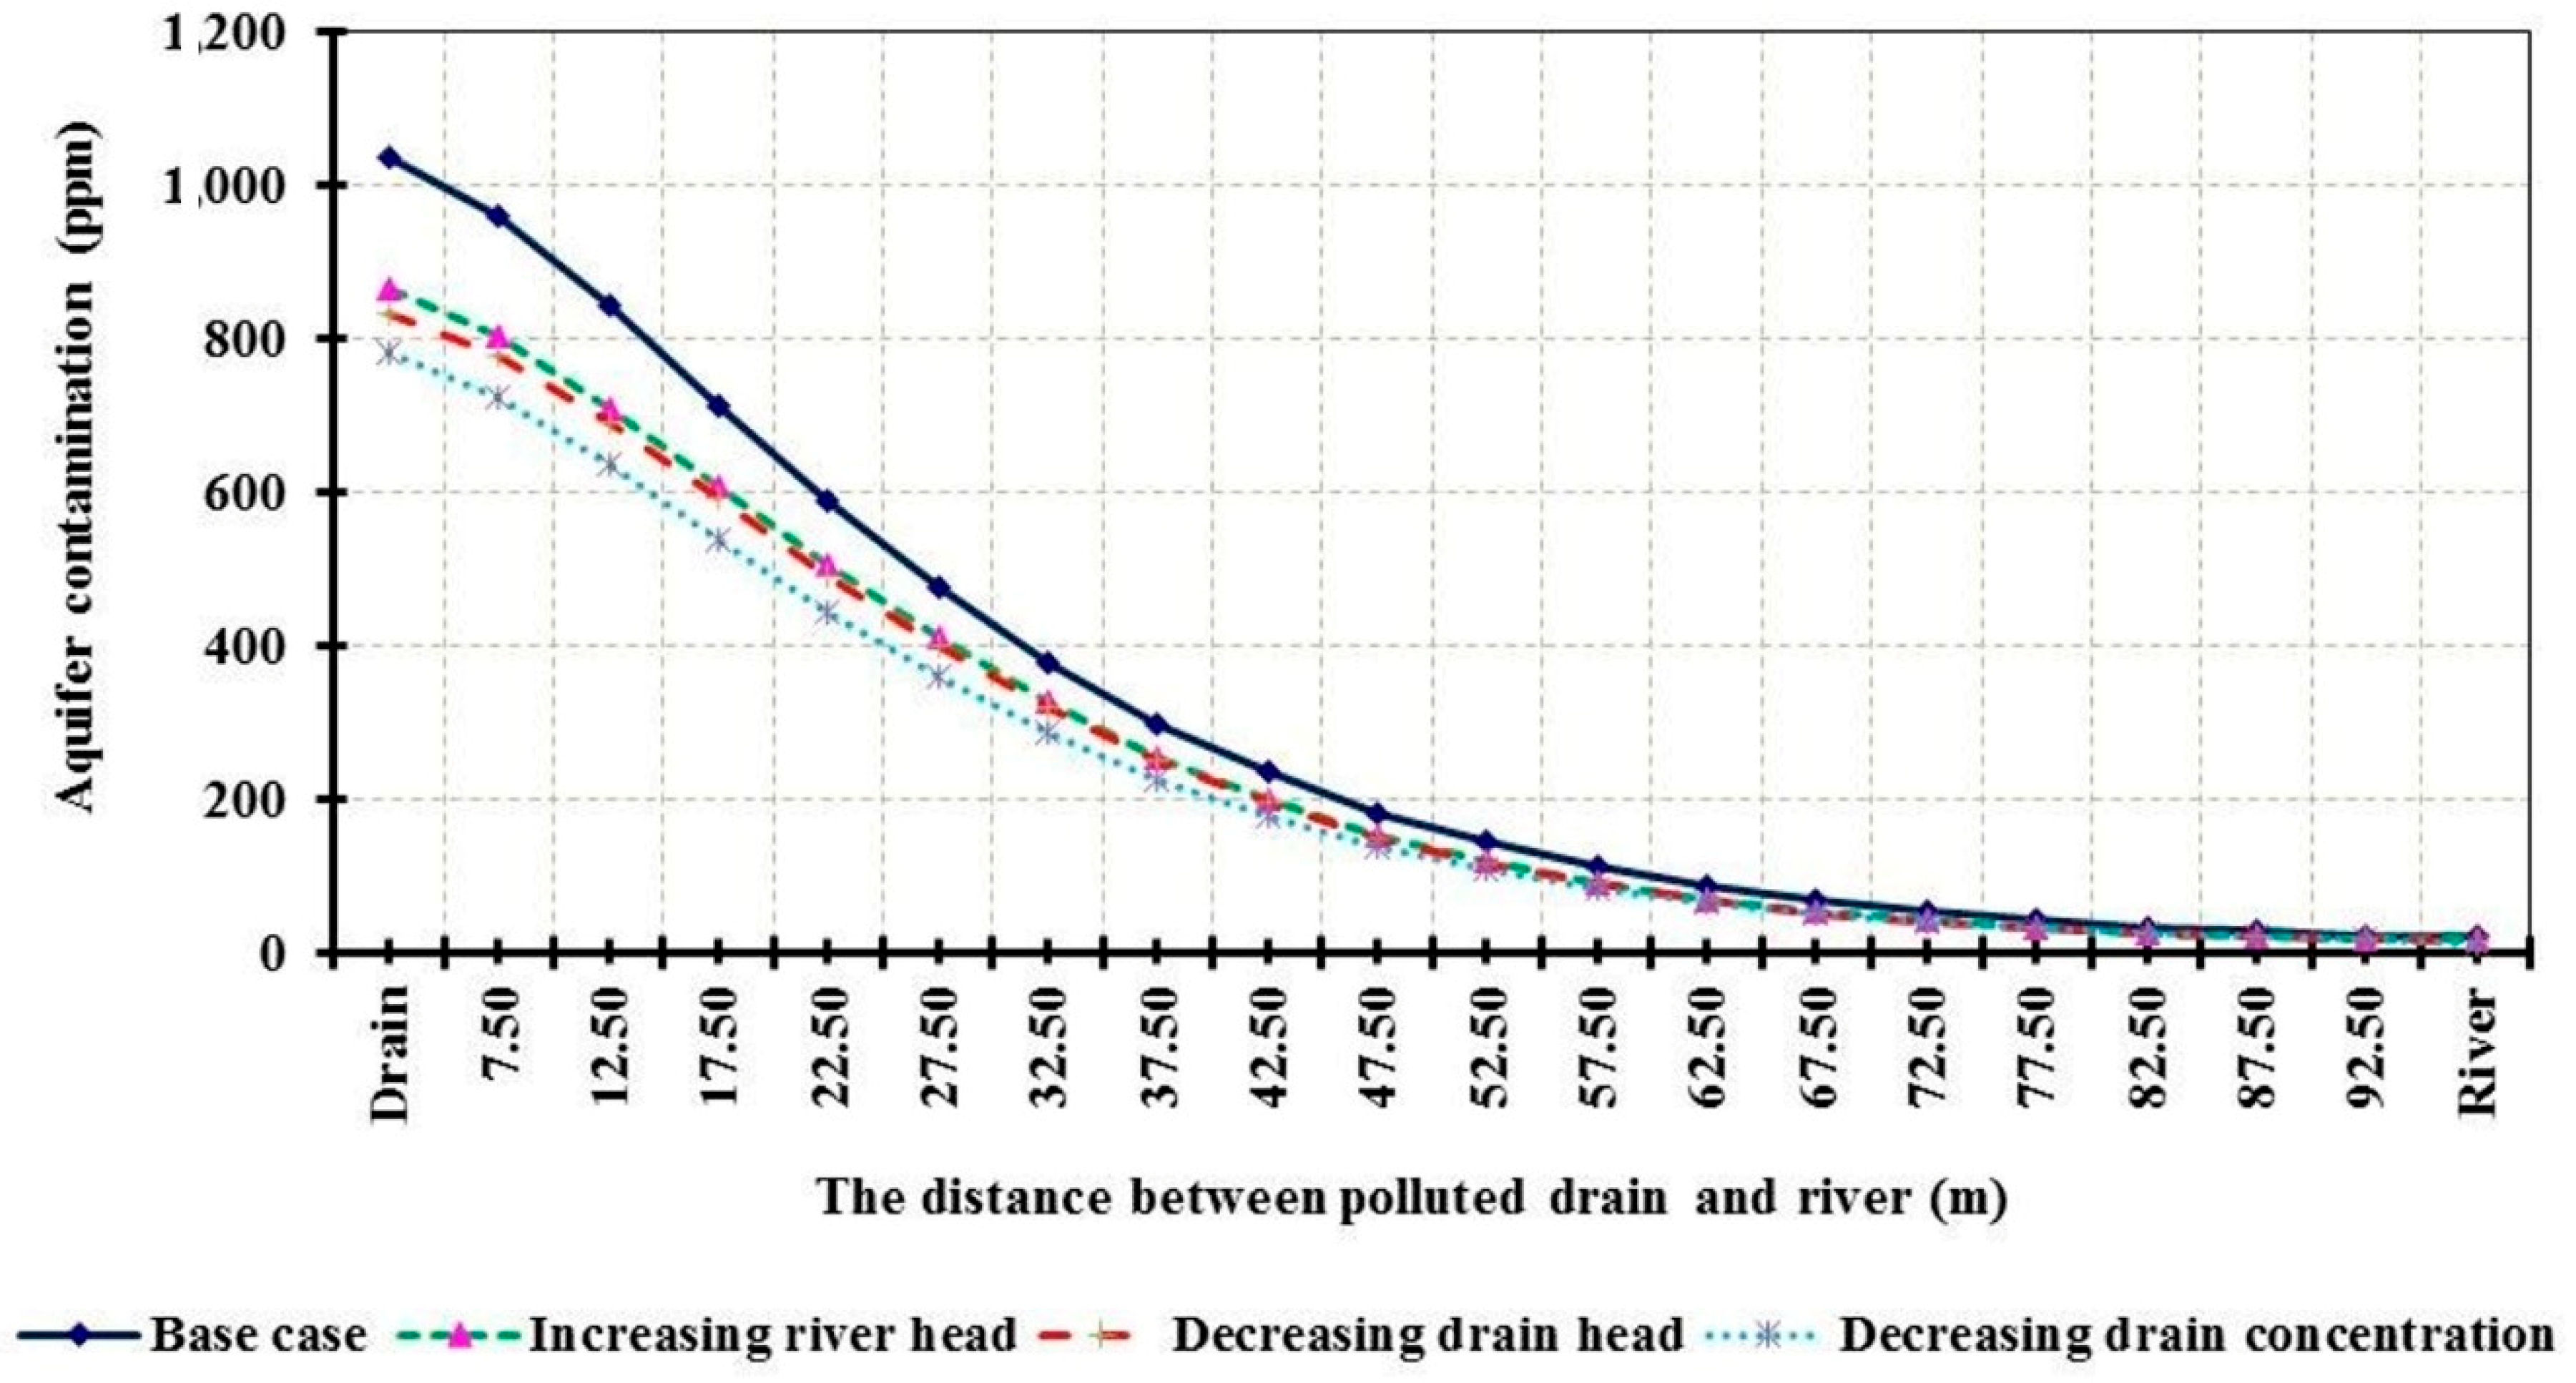
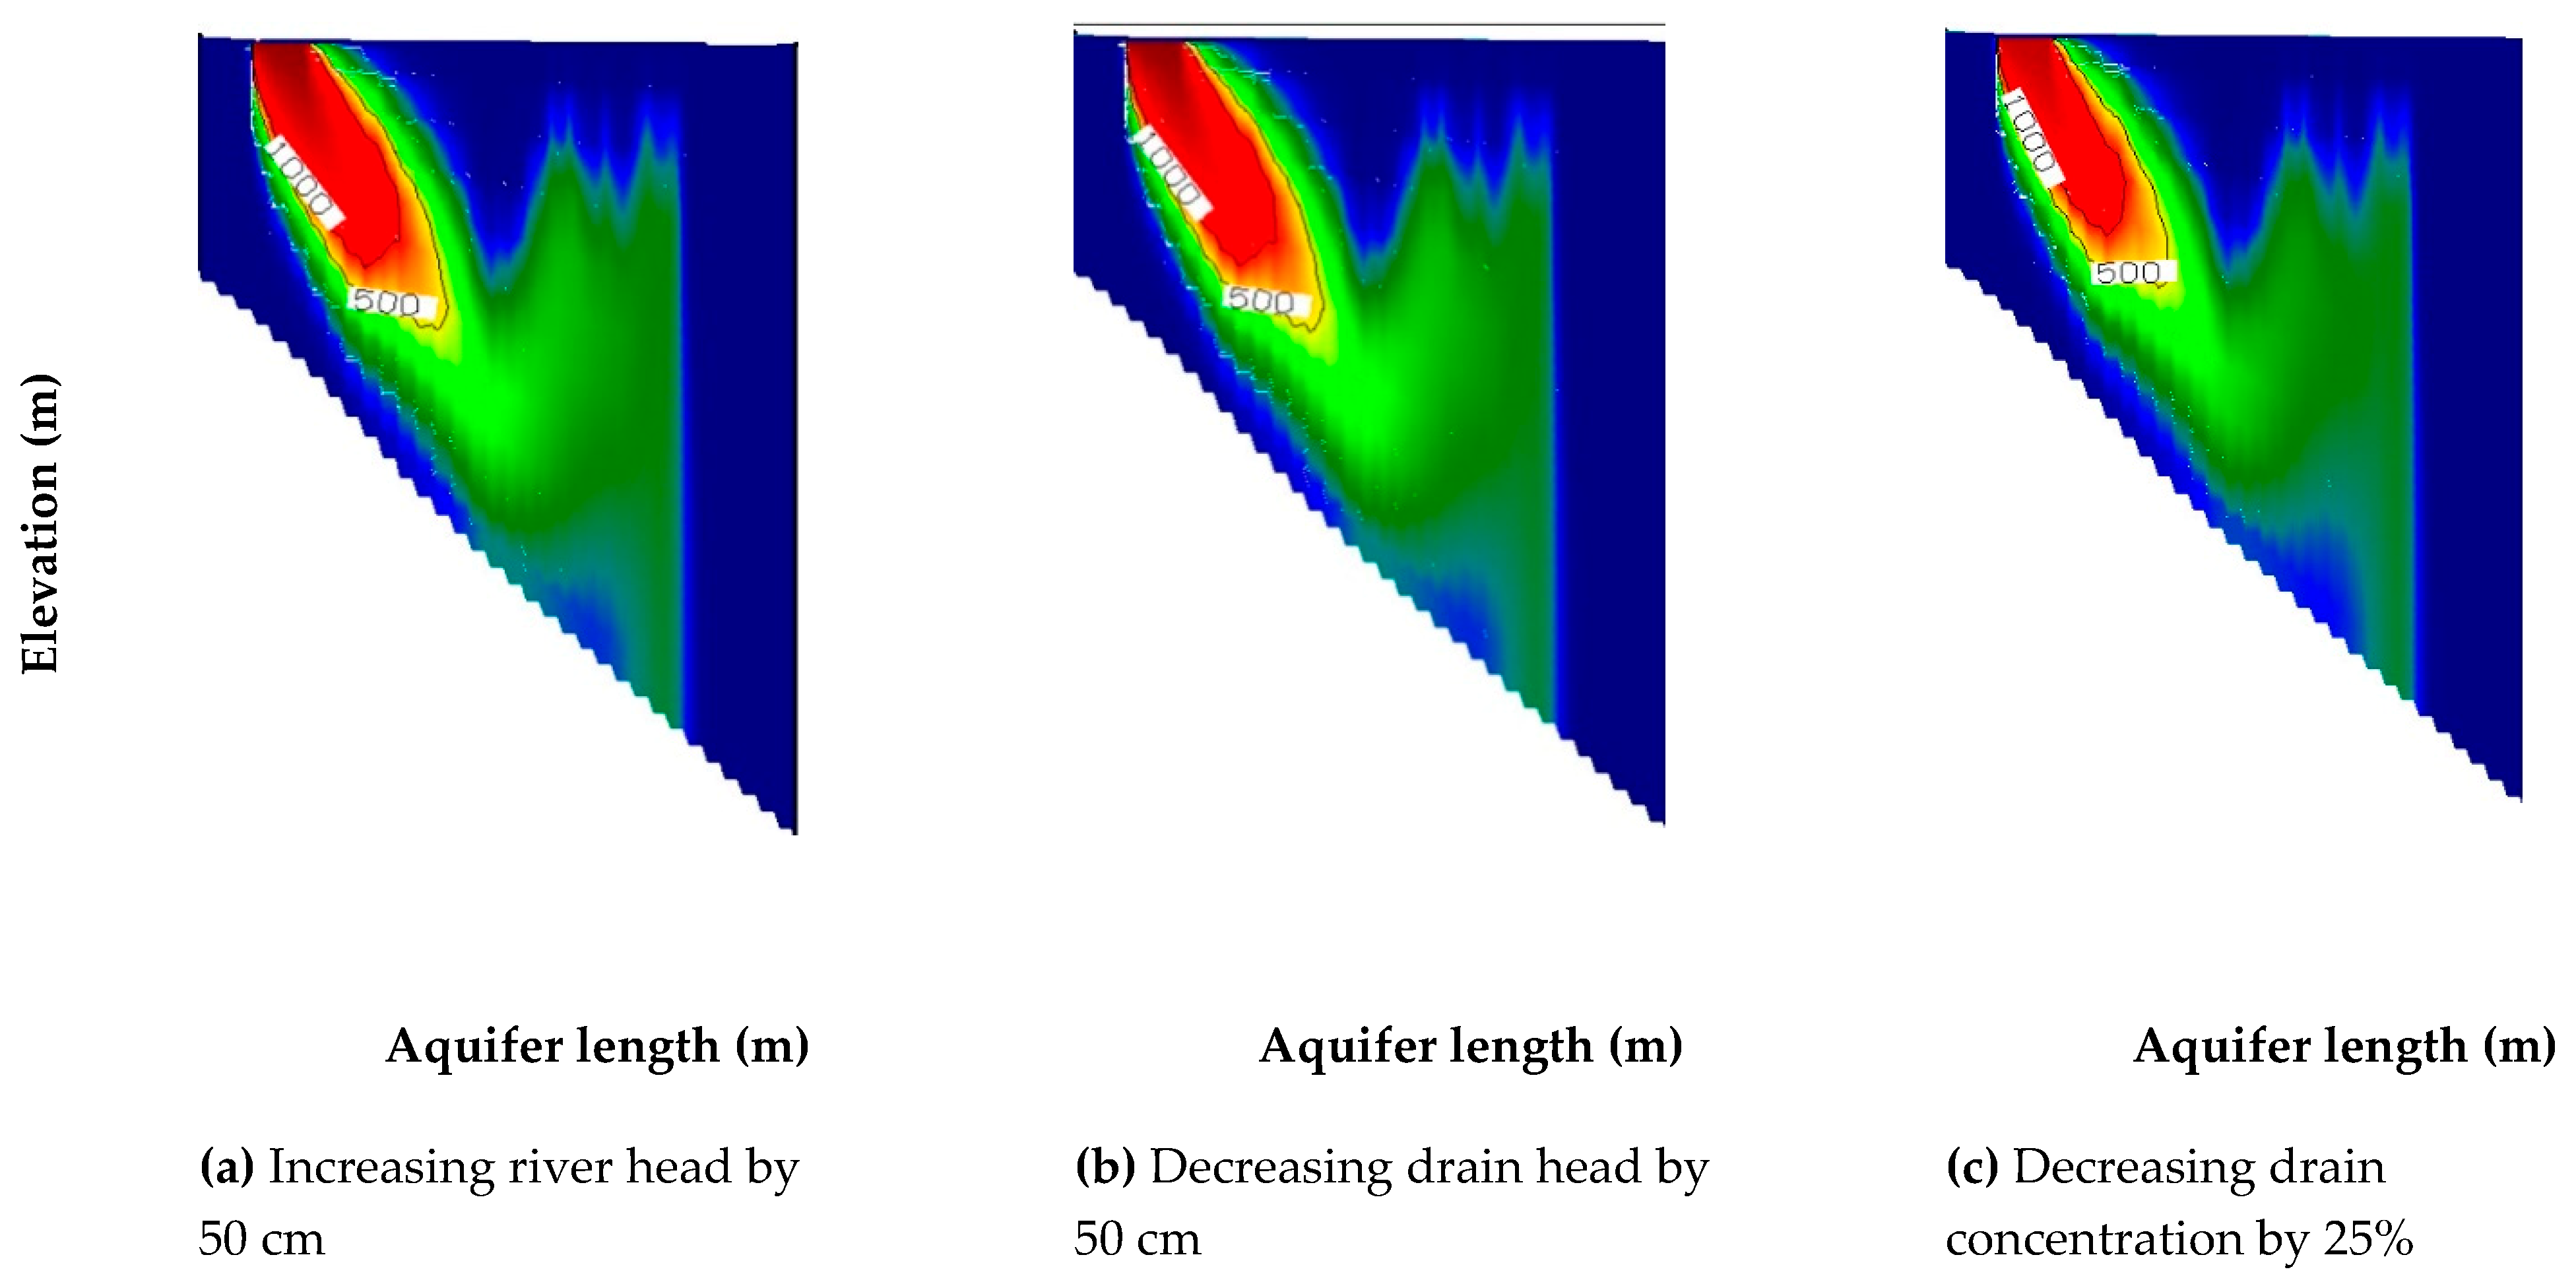
3.1. Impact of River and Drain Boundary Condition on Groundwater Quality

Three cases for changing boundary conditions; increasing the river stage to a level of (−0.75), decreasing the drain stage to a level of (−3.25) from ground surface, and decreasing the drain contamination concentration by 25% to 3750 ppm. The results in Figure 11 show the relation between the distance from polluted drain to the canal and the contamination extension for the three proposed scenarios of hypothetical stages and concentrations. The contamination was decreased in the three cases and reached 865.83, 834.25 and 781.23 ppm at the drain position and 15.31, 14.75 and 9.03 ppm at the river position respectively. Moreover, decreasing the drain head and its concentration parallel with increasing the canal head led to decrease in the aquifer pollution in drain direction. This figure revealed that the contamination decreased in canal direction. Thus the canal and drain stage should be controlled to decrease the contamination extension. The salt mass balance was 3.6547 × 10³, 3.5636 × 10³ and 3.0683 × 10³ kg compared with 4.091 × 10³ kg for the base case.
Three stages of boundary conditions were simulated to identify their impacts on contamination extension in the aquifer. The first and second scenarios were applied by increasing the river stage and decreasing drain stage by 50 cm, while the drain concentration was decreased by 25% in the third scenario. The results indicate that the contamination decreased in the three scenarios, as shown in Figure 12. Moreover, the total salt mass in the Nile aquifer for the three scenarios decreased to 5.44554 × 10¹⁰, 5.30492 × 10¹⁰ and 4.35852 × 10¹⁰ kg respectively, compared with 5.81134 × 10¹⁰ kg.
Thus the head of irrigation and drainage should be managed to protect the freshwater in the aquifer from contamination. The obtained results agree with the findings of [27,31,36], who simulated the groundwater quality in the northern parts of the Delta, and showed that lowering of groundwater levels due to over pumping was the main factor of water pollution. Moreover, the actual measures in order to change the boundary conditions for head and concentrations in irrigation and drainage networks can be achieved by means of three measures. The first is re-use of agricultural drainage water before mixing with domestic-industrial waste water. This water is mixed with fresh water according to the salinity degree which is needed for water supply systems and lift in irrigation canals to support the water level in irrigation networks. The second is mitigation of the polluted streams, which is done by mixing with domestic-industrial wastewater applying the hydraulic method. This involves using the submerged porous media with light weight that can overlap, flipping the water and increasing the dissolved oxygen in it; this method can mitigate the polluted load in these streams. The third is constructed wetlands (CWs) for sustainable water management in rural and remote areas of semi-arid regions; these are special systems designed to utilize natural processes within the ecosystem as well as vegetation-soil microorganisms to achieve wastewater treatment and to secure enough safe water for agriculture and protect the natural water resources from overexploitation and contamination. The quality of the treated waste water using this system is within the permissible limits of the Egyptian standards [52]. The outlet from the system supplied the irrigation canal with 20 m3 per day for agricultural purposes in the middle of the Delta [53]. The Mega project of the CWs initiated in the eastern part of Egypt close to the Manzalla Lake and the end of the Main Drain (Bar Elbakr drain) was intended to treat 25,000 m3 per day of polluted drainage water to make it suitable for irrigation purposes and to supply the lake with good quality water to protect the ecology of Lake Manzala [54].

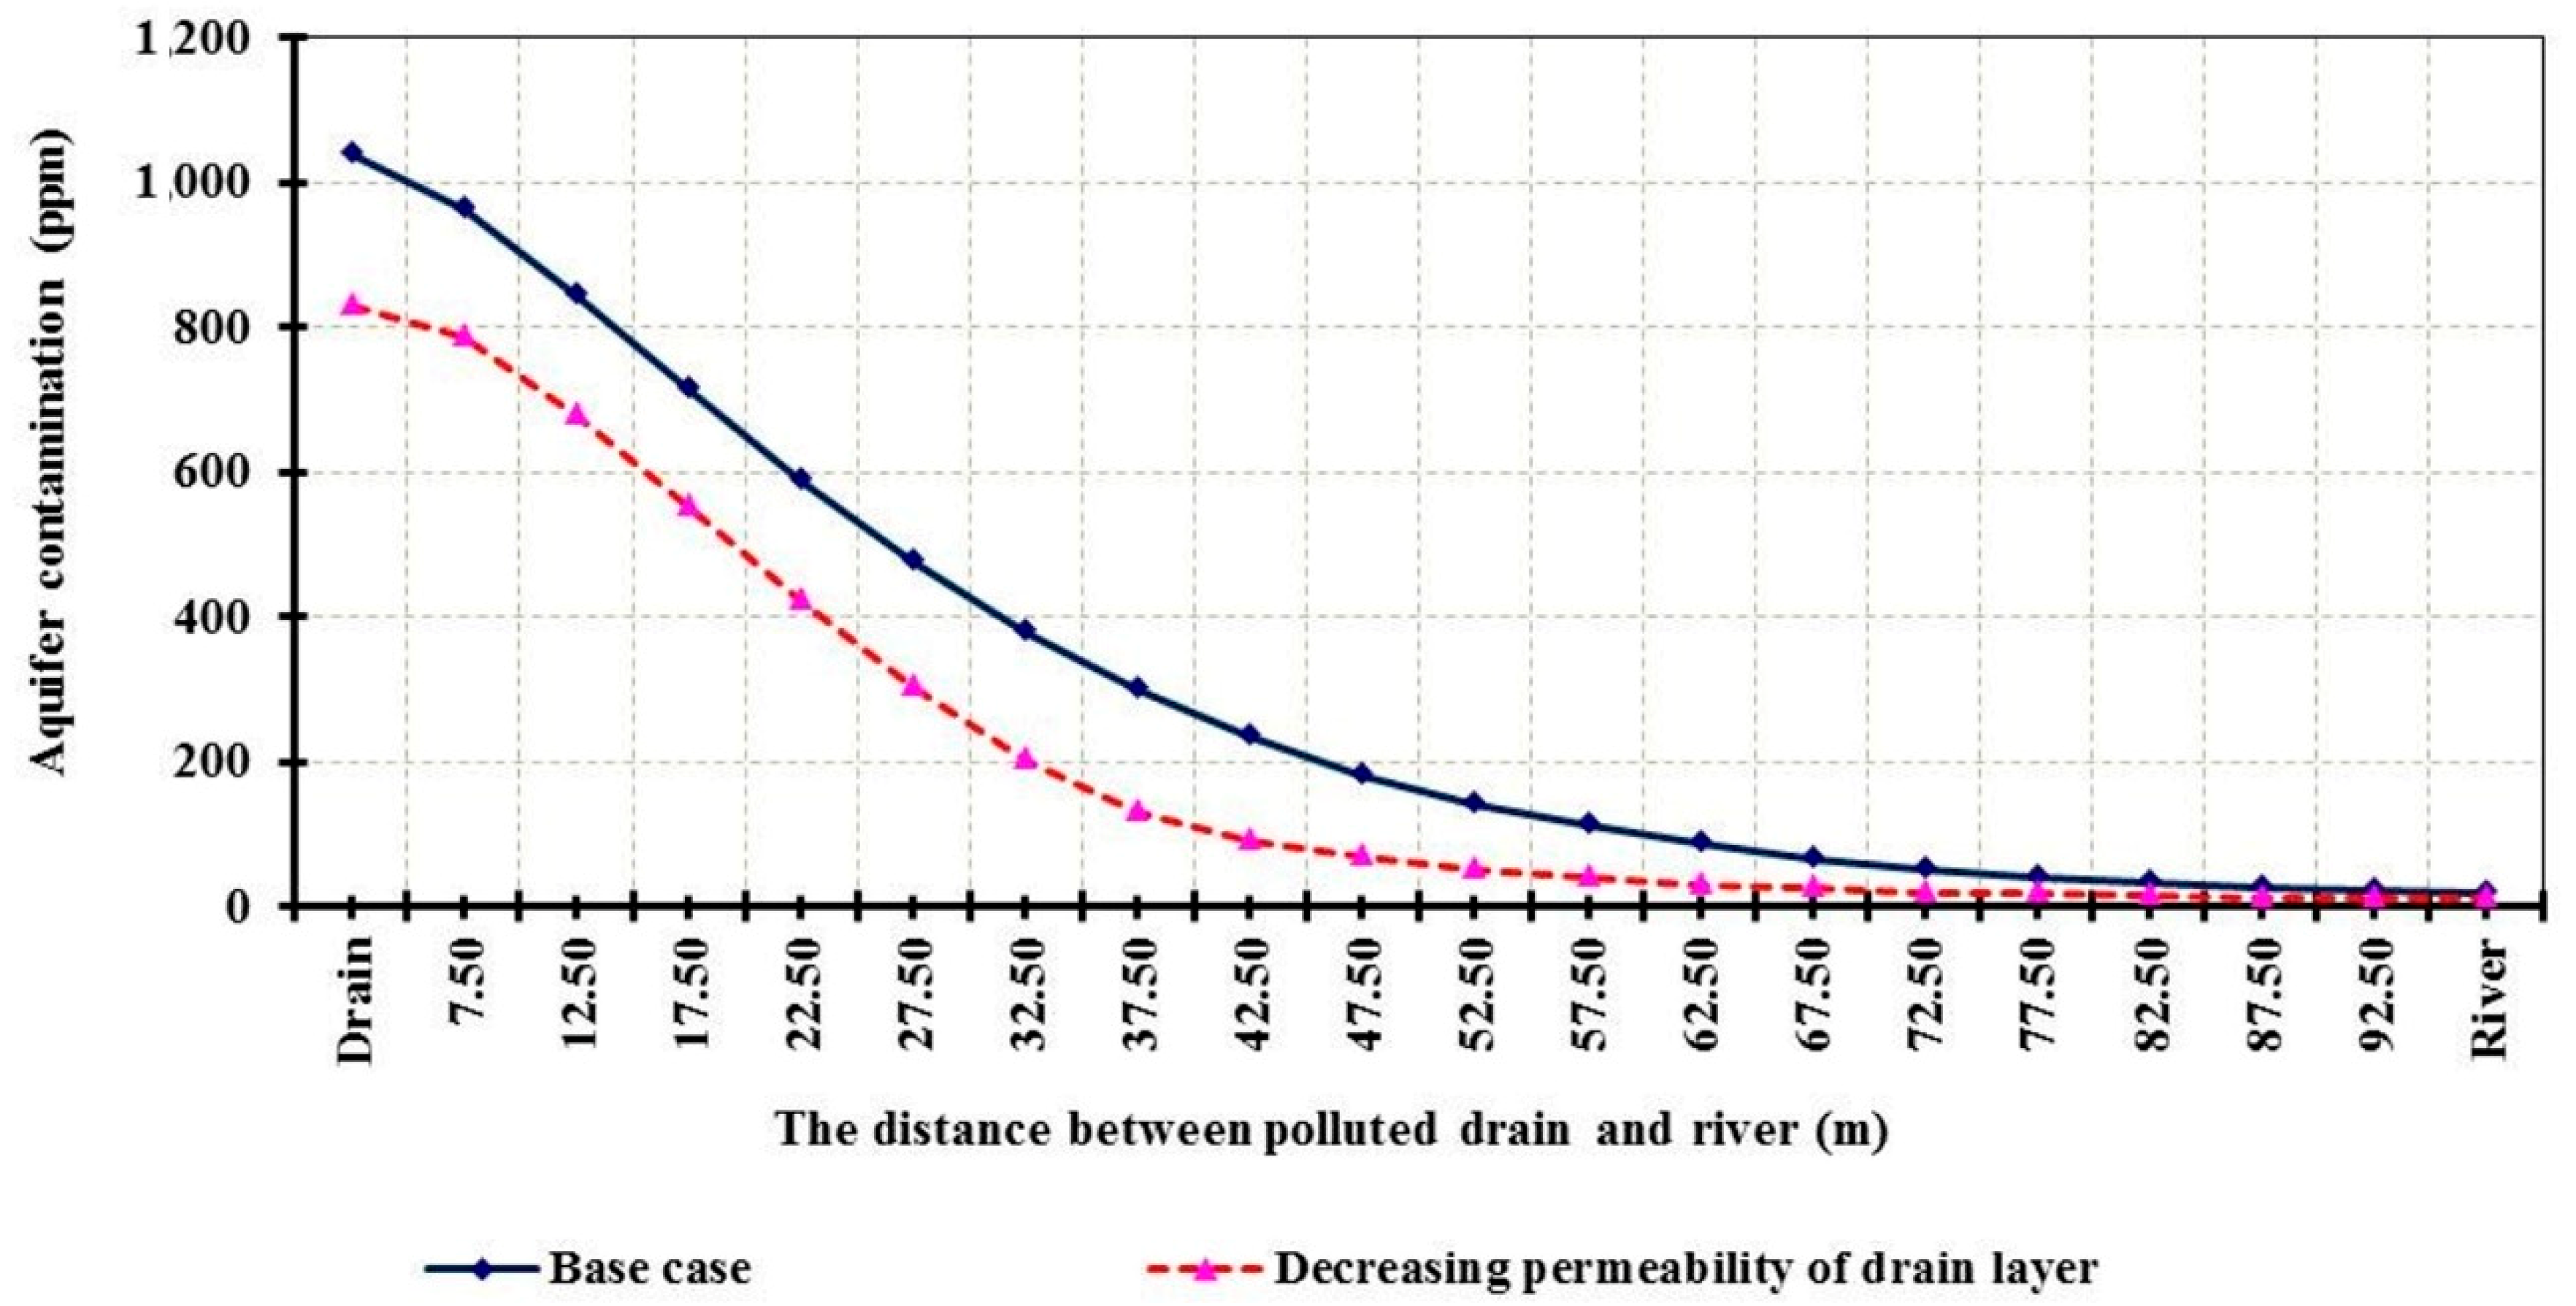
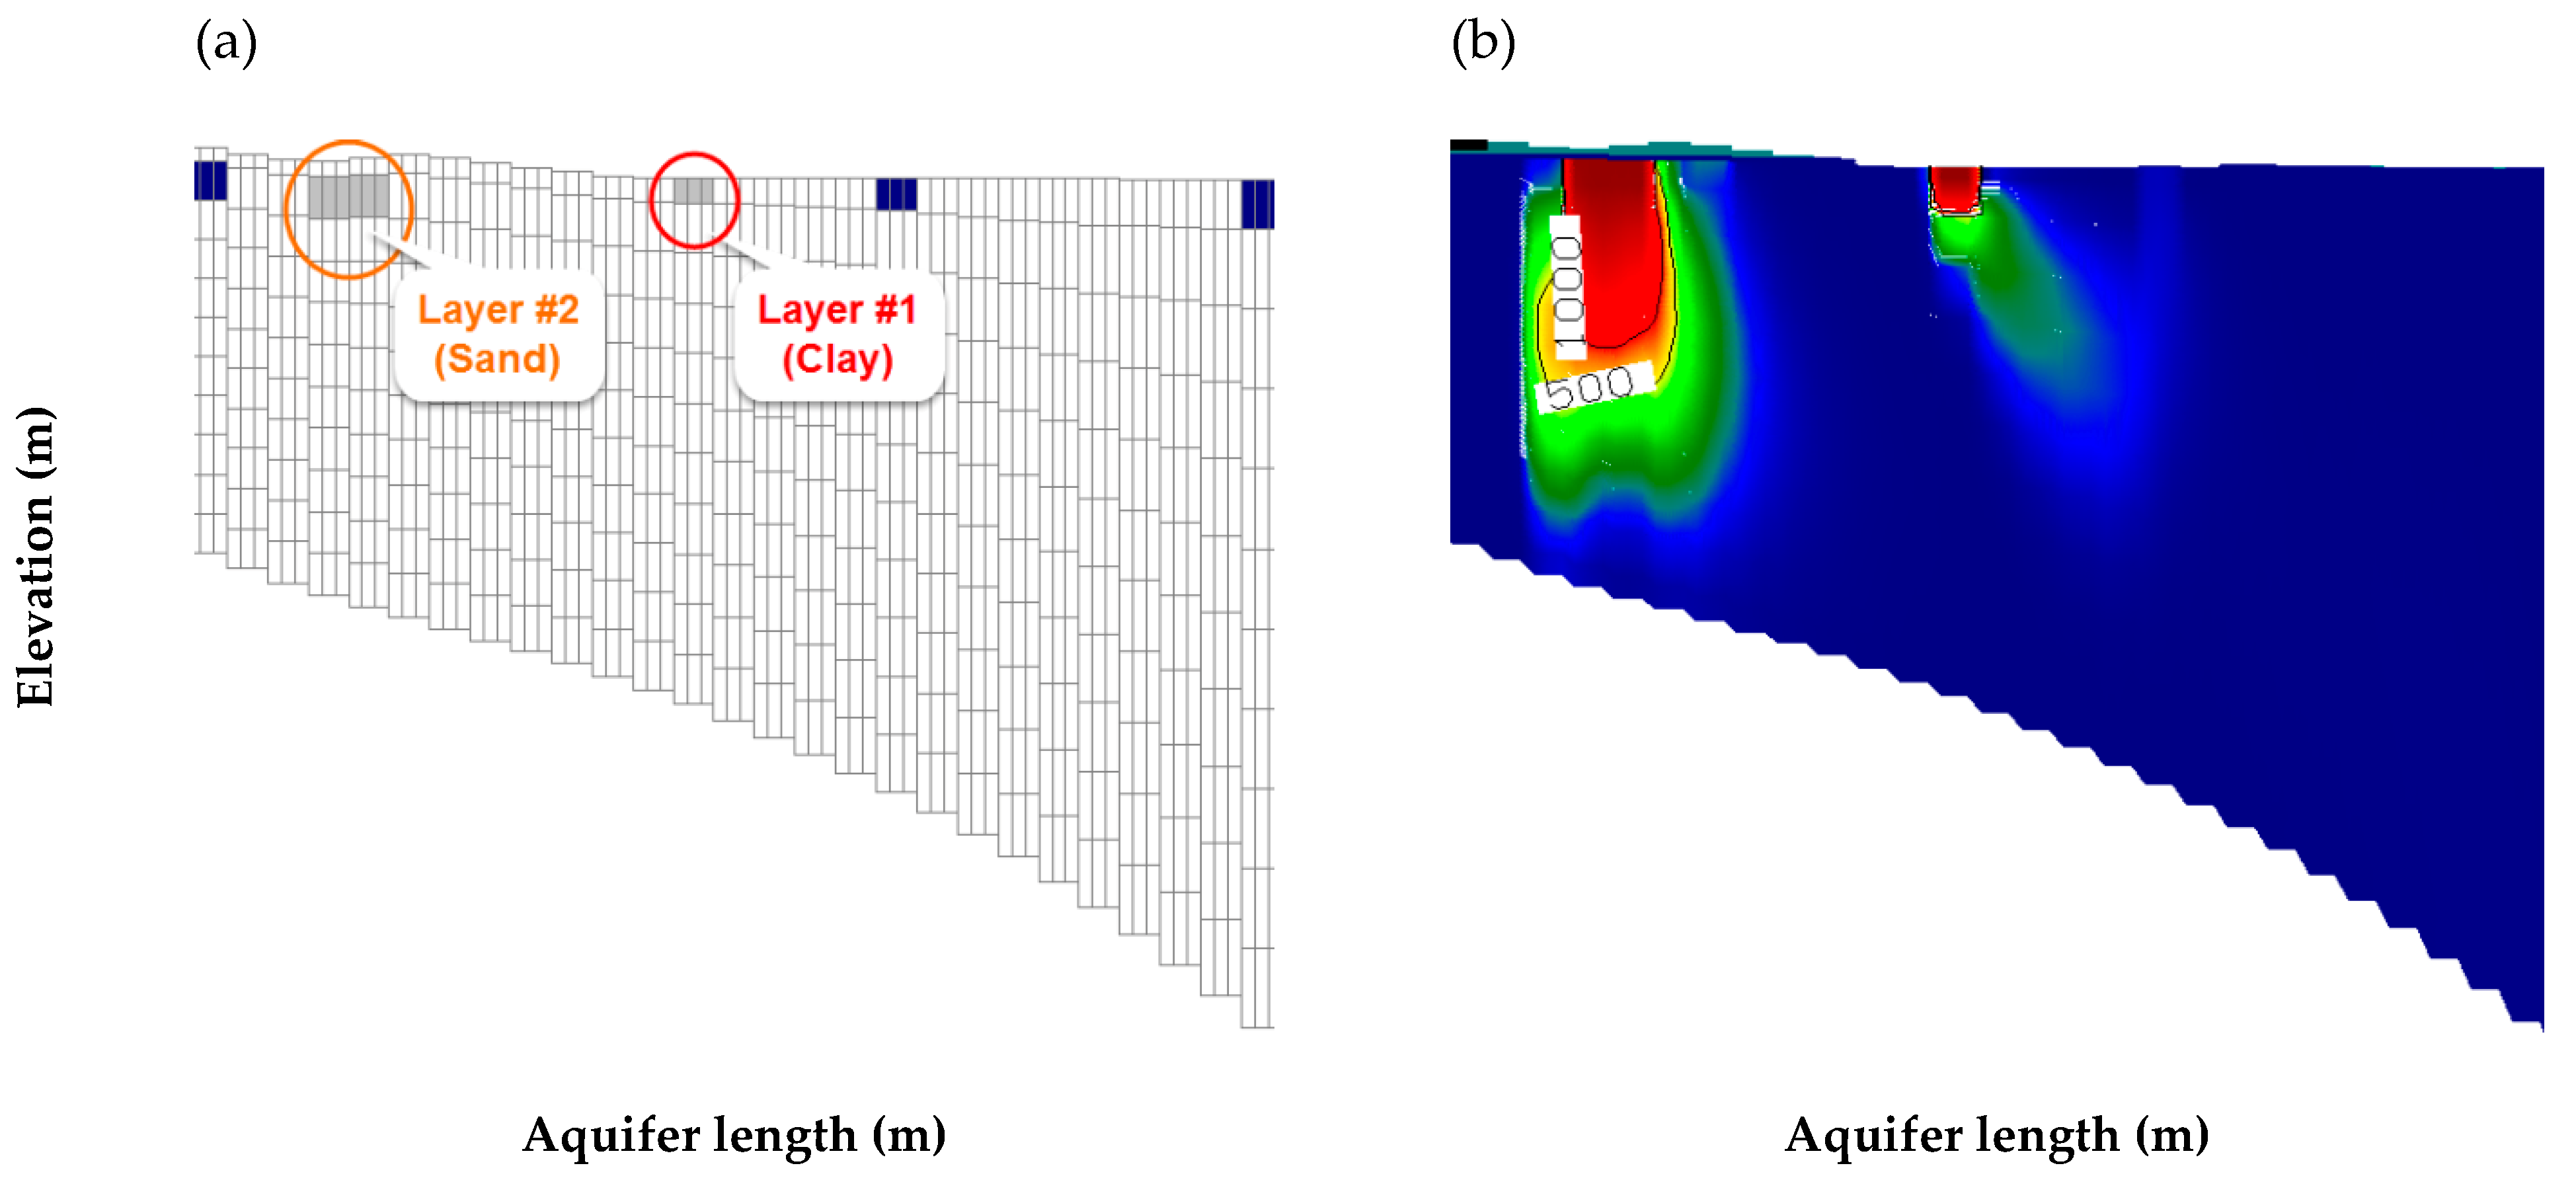
3.2. Impact on Groundwater Quality of Installing Polluted Drain in Low Permeability Layers

The aquifer hydraulic conductivity for the top layer where the polluted drain is located was decreased to 0.06 m per day; this value was 0.01% of the vertical hydraulic conductivity for the hypothetical aquifer, which was 6 m per day. This result shows that the contamination decreased with reduction in the top layer permeability as shown in Figure 13, which presents the contamination extension with the distance, whereby the contamination reached 827.91 and 11.76 ppm at the drain and river positions respectively. Thus the drain should be installed in a confined layer to protect the groundwater from pollution. Moreover, the salt mass in the aquifer was 3.3135 × 10³ kg compared with the base case.
Figure 14a shows the two locations of the drain in the vertical section of the Nile delta aquifer; the first was in the top layer of the Holocene, while the second was in the Quaternary layer. The distribution of pollution in the aquifer is presented in Figure 14b, which shows how it changed based on the position of the polluted drain in a confined or an unconfined layer. The model results indicate that the clay cover for the confined aquifers is effective for minimizing the contamination from polluted drains more than the unconfined aquifers. Moreover, installing the drain in a low permeability layer such as clay decreased the contamination more than installing it in a high permeability layer, such as sand, where there is little or no protective clay cap. From these results it is concluded that the selection of drain position should be set up in a layer with low conductivity or in a confined aquifer. These findings are in accord with the approaches of [29,30,31], who simulated the environmental impacts of polluted drains on the migration of contamination using the VISUAL MODFLOW.

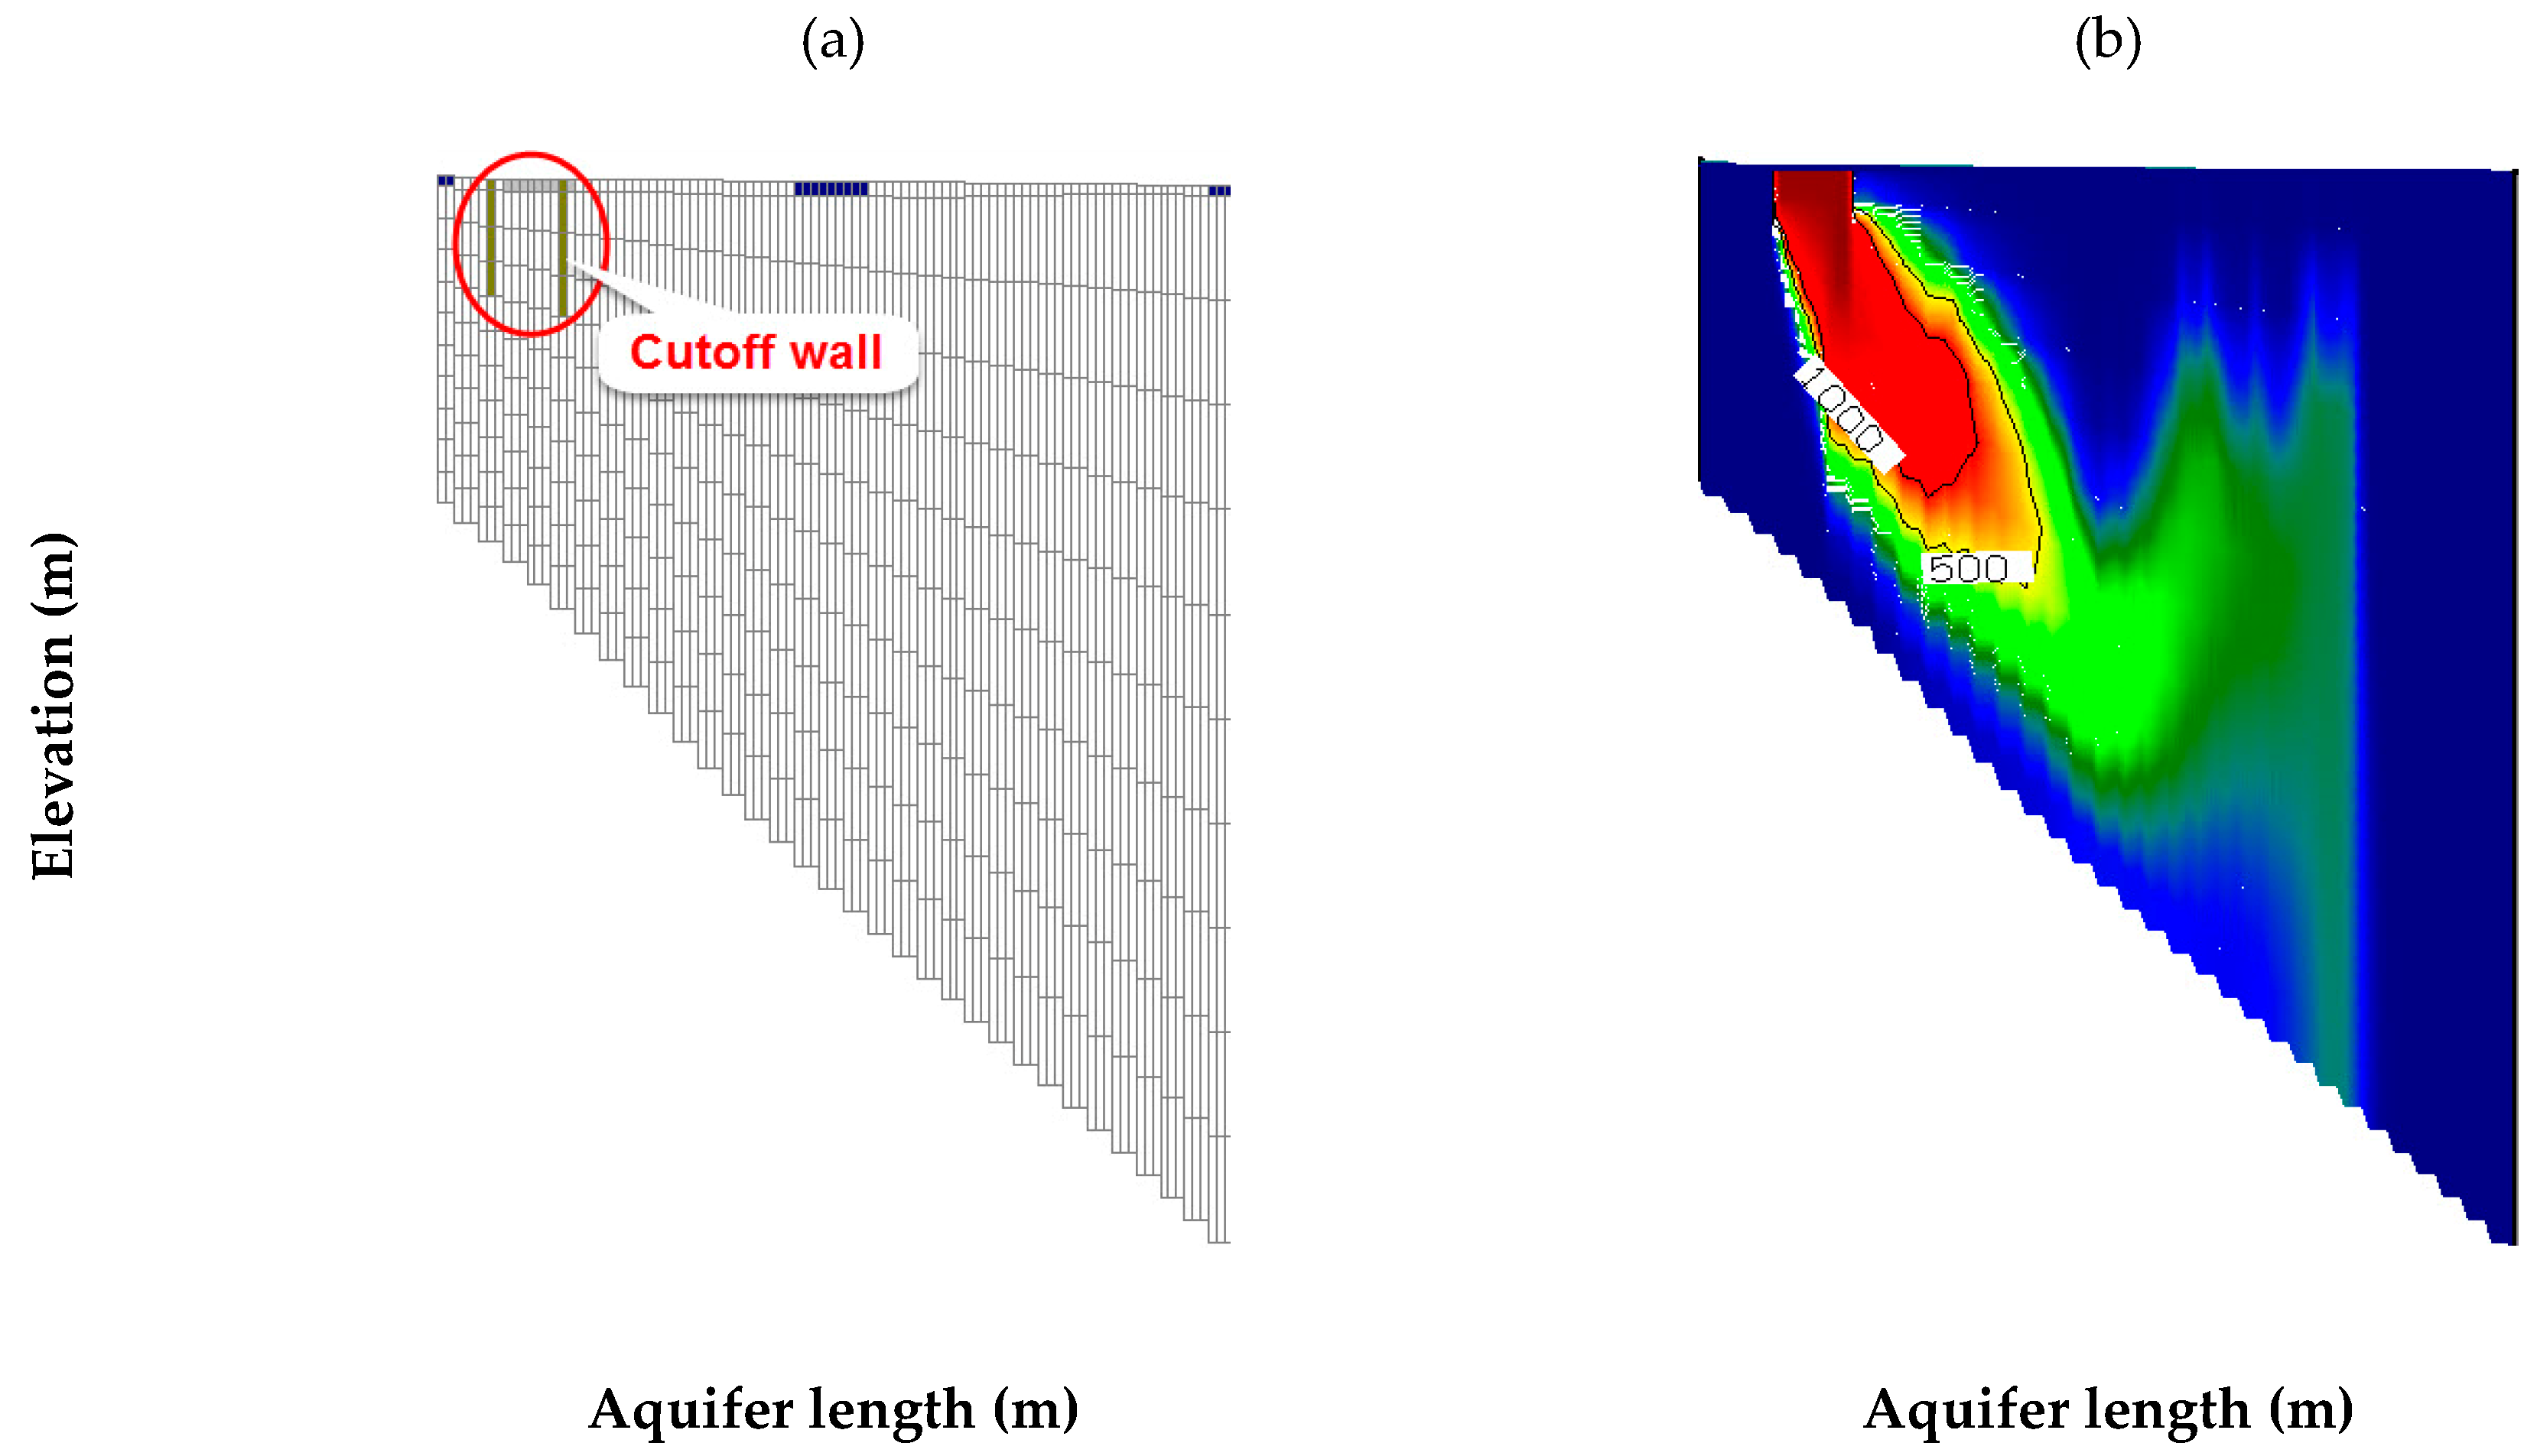
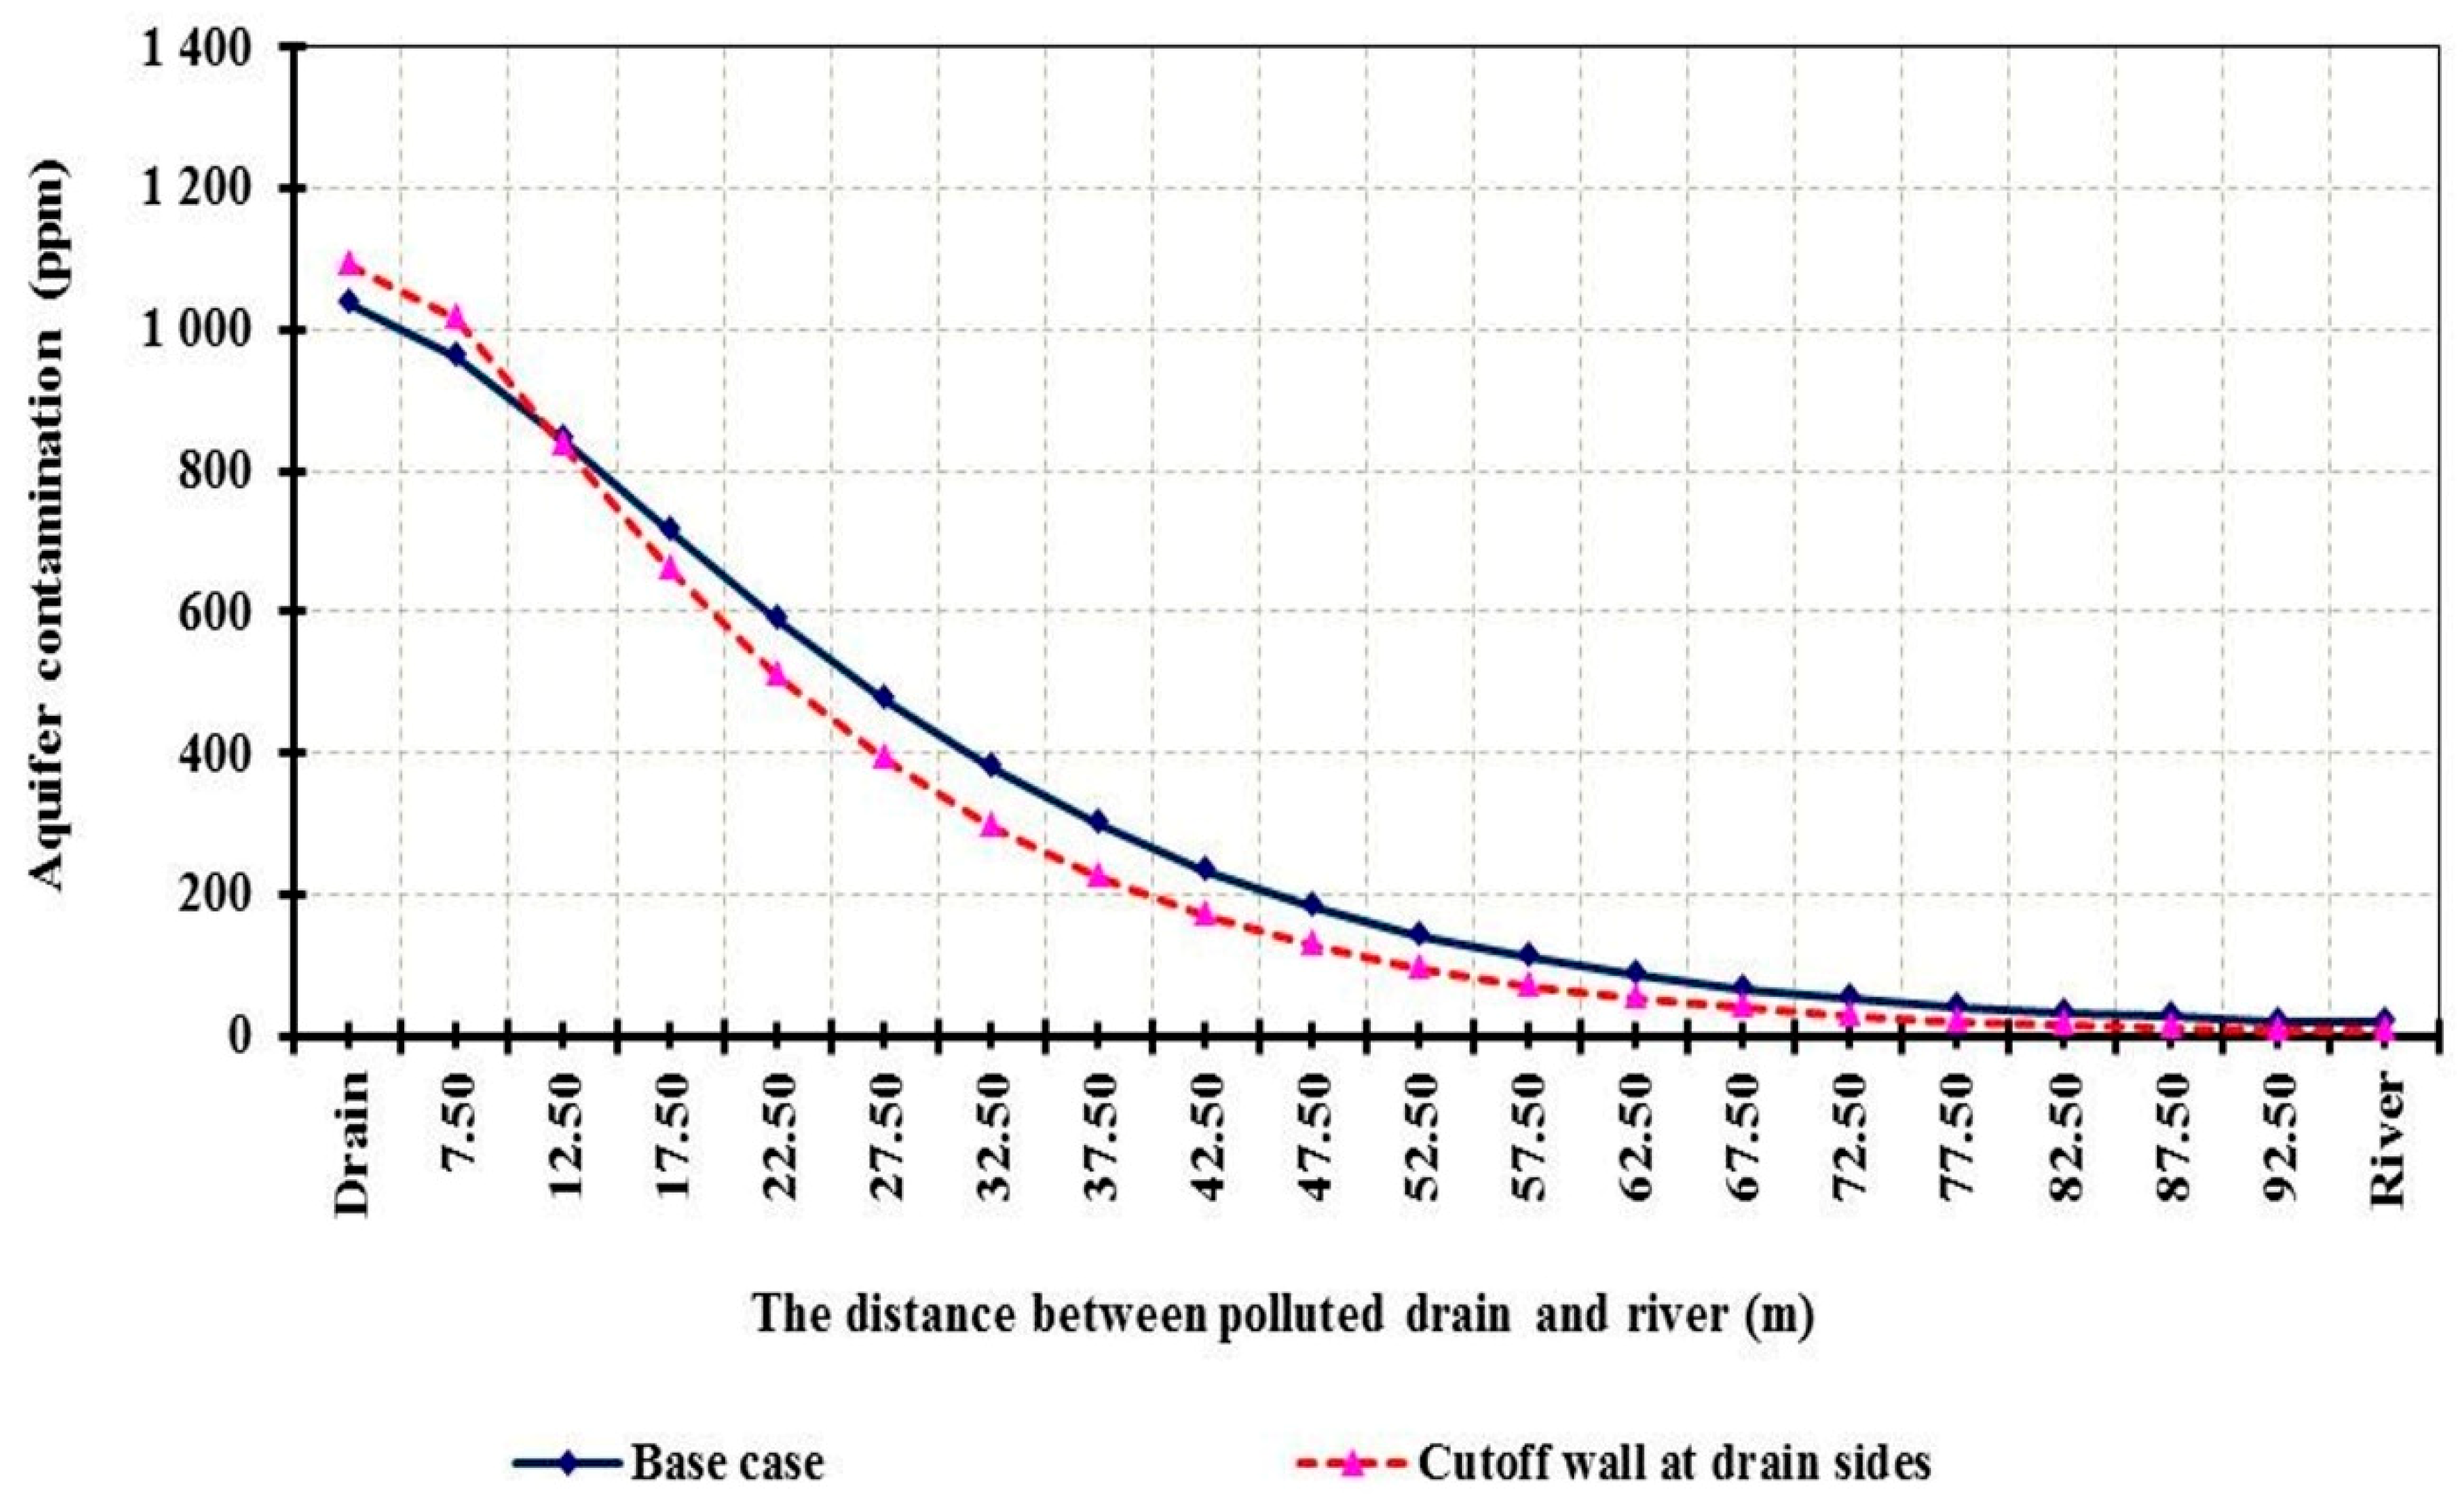
3.3. Impact on Groundwater Quality of Installing Cutoff Wall on Polluted Drain Sides

The cut-off wall was installed at a depth of 20 m from G.S behind the two drain sides for the hypothetical case, and at 85 m for the Nile aquifer as shown in Figure 15a. The cut-off wall materials are chemical or cement grout and sheet piling. The results indicate that installing the cut-off wall on the drain sides led to a decrease in the extension of contamination behind the drain and an increase in the concentration at the top layers; nevertheless the contamination decreased gradually with depth as shown in Figure 16. The figure shows contamination extension with the aquifer length according to the installed cut-off wall on the drain sides for the hypothetical case where the contamination increased to 1091.22 at drain position and started decreasing from a distance of 12.50 m to reach 7.89 ppm at river position with a value of 2.9272 × 10³ for the salt mass.
The same results were observed for the Nile aquifer in the top layer, while the contamination increased with the depth, this due to the cut-off walls having no effect in deep aquifers, as presented in Figure 16b. These results reveal that the cut-off wall can be used to manage the contamination in shallow aquifers, while it has no effect in deep aquifers such as the deep aquifer of the Nile Delta, where the total salt mass for the NDA was 5.79137 × 10¹⁰ compared with 5.81134 × 10¹⁰ kg for the base case. However, the material cost of cut-off walls should be considered. These results were consistent with Abd-Elhamid et al., (2015, and 2018) [55,56], who identified the groundwater level and salinity using a diaphragm wall and cut-off wall to protect the northern coasts of Egypt from rise in sea level.

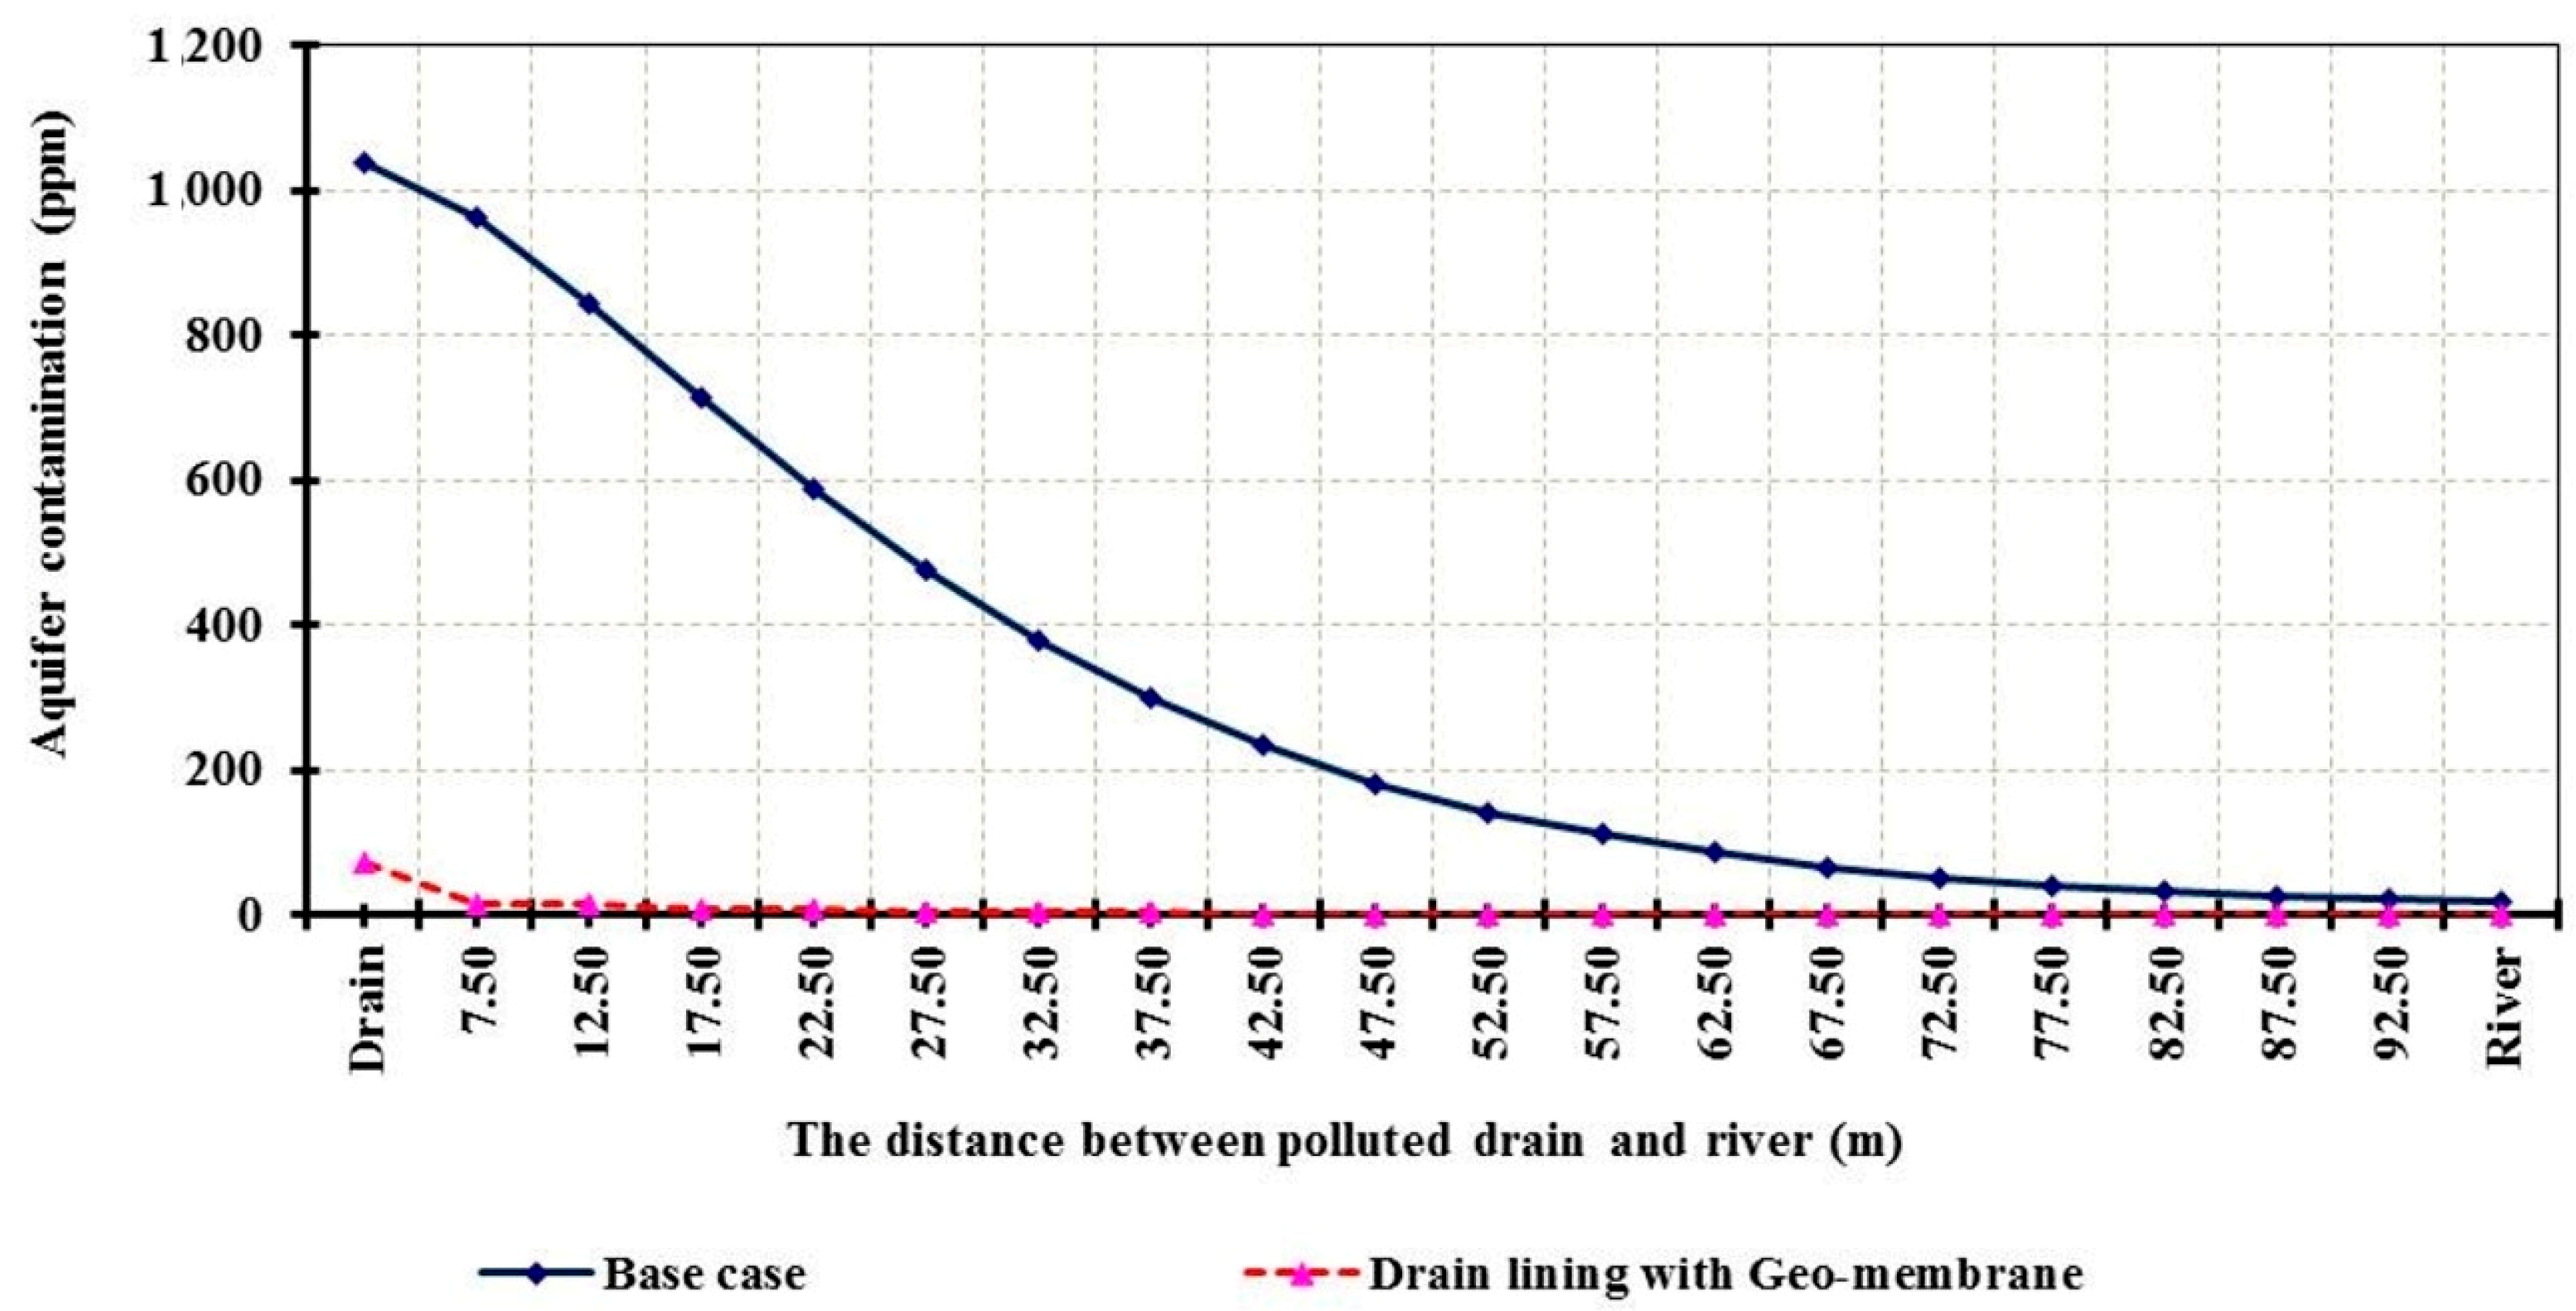
3.4. Impact on Groundwater Quality of Using Lining Materials for Polluted Streams

This scenario was developed to simulate the impact of lining materials on the groundwater and surface water contamination. It was carried out by changing the conductance of the polluted drain using lining made from low permeability material for protecting the aquifer from contamination; this was applied using geo-membrane material. The permeability of geo-membrane used was 0.58 × 10⁻⁹ m per sec (5 × 10⁻⁵ m per day). The simulated results for the hypothetical case indicate that minimizing the drain conductance using low values of permeability led to decrease in the contamination in the aquifer which had lower values of 71.16 and 0.15 ppm at the drain and river positions respectively, as shown in Figure 17. That presents the relation between the distances from the polluted drain and contamination extension. Thus the drain should be fitted with a low conductivity layer to minimize the water degradation. This was explained in the sense that in the drains the contamination was practically cut off. The salt mass was reduced to 0.36758 × 10³ kg compared with 4.091 × 10³ in the base case. Otherwise, minimizing the river conductance by lining irrigation networks will lead to increased contamination in the aquifer. This was explained in terms of the river seepage and flow direction from river to drain, which was decreased by using the lining. This case indicates that the lining of canals has a negative impact on groundwater quality.
This scenario was carried out and assigned for the NDA with lining of polluted drains using geo-membrane with permeability of 5 × 10⁻⁵ m/day. Figure 18 indicates that the contamination was decreased in the aquifer and the total salt mass was 1.73598 × 10¹⁰ kg compared with 5.81134 × 10¹⁰ kg in the base case. Thus the results reveal that the drain lining could be used to protect the aquifer and surface water from polluted drains, and the drains should be fitted with low-permeability linings to reduce the groundwater and surface water degradation. These results are in agreement with those of Abd-Elaty et al. (2016) [57], in that the aquifers which have low permeability lead to decrease in the groundwater salinity using the SEAWAT code.

3.5. Comparison between the Different Scenarios for Management of Polluted Drains and Its Effect on Groundwater Quality

The simulation results for the two cases of hypothetical case study and NDA are presented in the current study. Table 2 presents the results of aquifer salt volume and the aquifer salt variation (where C0 is the initial salt concentration and C is the salt concentration in the given scenario) for the two cases including the investigated scenarios; base case, stream boundary conditions, cut-off wall, and lining. For the two cases the accumulation salt was calculated to be 4.091 × 10³ and 5.81134 × 10¹⁰ kg for hypothetical and NDA respectively in the base case. Moreover, changes in the streams boundary conditions by increasing the canal head, decreasing the drain head and concentration caused the salt to decrease from 3.6547 × 10³, 3.5636 × 10³ and 3.0683 × 10³ kg with variations in aquifer salt of +10.66, +12.89 and +24.99% for the hypothetical case. At the same time the salt volumes in NDA reached 5.44554 × 10¹⁰, 5.30492 × 10¹⁰ and 4.35852 × 10¹⁰ kg with aquifer salt variations of +6.29, +8.71 and +25% respectively. These results reveal the stream boundary conditions effect on the groundwater contamination. Studying the polluted drain position by changing the hypothetical permeability for the polluted drain to 0.06 m/day led to salt accumulation by 3.3135 × 10³ kg with increase in salt of +19.01%. For the Nile Delta, the cross-section was carried out in two positions, the first in the clay cap and the second in sand, in which the value of salt in the base case was 5.81134 × 10¹⁰ kg. The protection of the aquifer from salinity is managed using the cut-off wall and lining, whereby the salt was decreased to 2.9272 × 10³ and 0.36758 × 10³ respectively for the hypothetical case with salt repulsion of +28.49 and +91.02%, while in NDA it was decreased to 5.79137 × 10¹⁰ with the cut-off wall and 1.73598 × 10¹⁰ using lining, with changes in aquifer salt by +0.34 and +70.13% respectively. The obtained results indicate that the groundwater salinity could be managed using the cut-off wall in the shallow aquifer, but it has no effect in deep aquifers; nevertheless the lining of polluted drains is an effective method to manage the groundwater contamination in both shallow and deep aquifers. Moreover, using the lining for polluted drains is the best compared with the other method, which involves collecting the waste water in the wetlands for treatment and thus to protect the aquifer from contamination. This method can be used considering the conditions of geotechnical properties of soil, types of lining materials and the types of pollutant loads and elements in these drains.

4. Conclusions

Groundwater contamination depends on the integration between the groundwater and surface water systems of irrigation and drain networks, so that canal and drain alike received their water from a high head of aquifer while the aquifer is recharged by these networks from a low head. This process linking the two systems, especially in the case of polluted drains, should be managed to protect the aquifer freshwater. This study was carried out to simulate and investigate the impact of canal heads and polluted drain heads and concentrations, aquifer hydraulic parameters, cut-off wall installation and polluted drain lining on the groundwater quality, using the finite difference model of MODFLOW and solute transport model. The results of this study reveal that increasing the river head and decreasing the drain head and concentration led to decrease in the groundwater contamination with positive salt repulsion of +10.66, +12.89 and +24.99% in the simulation, while it was +6.29, +8.71 and +25% respectively in NDM, by increasing the water head of canals by 50 cm and decreasing the drain head by 50 cm and concentration by 25%. The location of drains in sand or clay layers is sensitive, since the groundwater contamination is reduced in clay layers more than in sand. The variation in aquifer salt was +19.01% for the hypothetical case, while in the NDM two different drain locations were investigated, the first in a clay layer and the second in sand. The protection of the groundwater from polluted streams was achieved by lining the polluted drains using geo-membrane material and installing cut-off walls in the drain sides. Using cut-off walls in shallow aquifers is effective and could control the stream pollution, while in a deep aquifer it has no effect. The shallow aquifer salt repulsion was +28.49%, with practically no effect in the deep aquifer, where the salt decreased by just +0.34%. On the other hand, in the case of lining of polluted drains it reached +91.02 and +70.13% for the hypothetical case and NDM respectively. Thus the comparison of these methods shows that the lining method is the most effective and the best method for reducing pollutant migration, and this method can be applied universally, while considering the conditions and geotechnical properties of the soil, lining material types and the sources of pollutant loads and elements in these drains.

Author Contributions

All authors contributed substantially to conception, methodology, software validation, data acquisition, analysis, investigation and interpretation of data. All authors participated in drafting the article or revising it critically; supervision and they give final approval of the version to be submitted. Also, all the author participated in project administration and funding acquisition. They are accountable for all aspects of the work in ensuring that the accuracy or integrity of any part of the work is appropriately investigated.

Funding

This work is fortunate to be supported by the Ministry of Education of the Slovak Republic through project VEGA 1/0217/19 Research of Hybrid Blue and Green Infrastructure as Active Elements of a Sponge City, and by the Slovak Research and Development Agency through project APVV-18-0360 Active Hybrid Infrastructure Towards a Sponge City. Also, the first, third and the fifth authors would like to acknowledge the partial financial support from the Academy of Scientific Research and Technology (ASRT) of Egypt via the bilateral collaboration Italian (CNR)–Egyptian (ASRT) project titled Experimentation of the new Sentinel missions for the observation of inland water bodies on the course of the Nile River.

Acknowledgments

The authors wish to express their sincere appreciation to the Department of Water and Water Structures Engineering, Faculty of Engineering, Zagazig University Egypt, for the instrument and software facilities, also the Department of Environmental Engineering, Faculty of Civil Engineering, Technical University of Kosice, Kosice 04200, Slovakia, however, the Department of Environmental and Chemical Engineering, University of Calabria, Ponte P. Bucci, 87036 Rende, Italy, finally the Department of Building Facilities, Faculty of Civil Engineering, Technical University of Kosice, Slovakia.

Conflicts of Interest

The authors declare no conflict of interest.

References

  1. Zelenakova, M.; Purcz, P.; Pintilii, R.D.; Blistan, P.; Hlustik, P.; Oravcova, A.; Abu-Hashim, M. Spatio-temporal Variations in Water Quality Parameter Trends in River Waters. Rev. Chim. 2018, 69, 2940–2974. [Google Scholar]
  2. MWRI. Integrated Water Resources Management Plan; Ministry of Water Resources and Irrigation: Giza, Egypt, 2005. [Google Scholar]
  3. Kalhor, K.; Ghasemizadeh, R.; Rajic, L.; Alshawabkeh, A. Assessment of groundwater quality and remediation in karst aquifers: A review. Groundw. Sustain. Dev. 2019, 8, 104–121. [Google Scholar] [CrossRef] [PubMed]
  4. Huang, L.; Wang, L.; Zhang, Y.; Xing, L.; Hao, Q.; Xiao, Y.; Yang, L.; Zhu, H. Identification of Groundwater Pollution Sources by a SCE-UA Algorithm-Based Simulation/Optimization Model. Water 2018, 10, 193. [Google Scholar] [CrossRef]
  5. Bear, J. Hydraulics of Groundwater; McGraw-Hill: New York, NY, USA, 1979. [Google Scholar]
  6. Vlahinic, M. Socio-economic and health aspects of drainage in relation to environment and sustainable agriculture. In Proceedings of the 6th drainage workshop, drainage and the environment, Ljubljana, Slovenian, 21–29 April 1996. [Google Scholar]
  7. El-Atfy, H. Integrated National Water Resources Plan in Egypt. Minist. Water Resour. Irrig. Alex. Gov. Egypt 2007. ppt. Available online: http://switch.cedare.int/cedare.int/files28%5CFile2182.pdf (accessed on 22 January 2019).
  8. Belcher, H.W.; Fogiel, A. Research Literature Review of Water Table Management Impacts on Water Quality; Agricultural Engineering Department, Michigan State University: East Lansing, MI, USA, 1991. [Google Scholar]
  9. Veilleux, J.C. The Human Security Dimensions of Dam Development: The Grand Ethiopian Renaissance Dam. Glob. Dialogue 2013, 15, 1–15. [Google Scholar]
  10. Samaan, M.M. The Win-Win-Win Scenario in the Blue Nile’s Hydropolitical Game: Application on the Grand Ethiopian Renaissance Dam; Forschungsberichte aus dem Institut für Sozialwissenschaften; TU-Braunschweig: Braunschweig, Germany, 2014. [Google Scholar]
  11. Tesfa, B.C. Benefit of Grand Ethiopian Renaissance Dam Project (GERDP) for Sudan and Egypt. J. Energy Water Environ. Econ. 2013, 1, 1–12. [Google Scholar]
  12. Mulat, A.G.; Moges, S.A. Assessment of the Impact of the Grand Ethiopian Renaissance Dam on the Performance of the High Aswan Dam. J. Water Resour. Prot. 2014, 6, 583–598. [Google Scholar] [CrossRef] [Green Version]
  13. Abd-Elhamid, H.; Abd-Elaty, I.; Sherif, M. Evaluation of potential impact of Grand Ethiopian Renaissance Dam on Seawater Intrusion in the Nile Delta Aquifer. Int. J. Environ. Sci. Technol. 2019, 16, 2321–2332. [Google Scholar] [CrossRef]
  14. Abu-hashim, M.; Mohamed, E.; Belal, A. Identification of Potential Soil Water Retention Using Hydric Numerical Model at Arid Regions by Land-use Changes. Int. Soil Water Conserv. Res. 2015, 3, 305–315. [Google Scholar] [CrossRef]
  15. MWRI. Adaptation to Climate Change in the Nile Delta through Integrated Coastal Zone Management; Ministry of Water Resources and Irrigation: Giza, Egypt, 2013. [Google Scholar]
  16. Abdel-Shafy, H.I.; Aly, R.O. Water Issues in Egypt Resources, Pollution and Protection Endeavors. Cent. Eur. J. Occup. Environ. Med. 2002, 81, 3–21. [Google Scholar]
  17. Taha, A.A.; El-Mahmoudi, A.S.; El-Haddad, I.M. Pollution sources and related environmental impacts in the new communities southeast Nile delta, Egypt. Emir. J. Eng. Res. 2004, 9, 35–49. [Google Scholar]
  18. Omran, E.S.; El Razek, A. Mapping and screening risk assessment of heavy metals concentrations in soils of the Bahr El-Baker Region, Egypt. J. Soil Sci. Environ. Manag. 2012, 6, 182–195. [Google Scholar]
  19. Saad, A.K. Environmental Hydrogeologic Impacts of Groundwater Withdrawal in the Eastern Nile Delta Region with Emphasis on Groundwater Pollution Potential. Ph.D. Thesis, Institute of Environmental Studies, Ain Shams University, Cairo, Egypt, 1997. [Google Scholar]
  20. El-Badry, A.E.A. Distribution of Heavy Metals in Contaminated Water and Bottom Deposits of Manzala Lake, Egypt. J. Environ. Anal. Toxicol. 2016, 6, 344. [Google Scholar]
  21. Kumar, P.; Singh, A. Groundwater Contaminant Transport Modelling for Unsaturated Media using Numerical Methods (FEM, FDM). Int. J. Recent Technol. Eng. (IJRTE) 2019, 8, 2277–3878. [Google Scholar]
  22. Baba, A.; Tayfur, G. Groundwater contamination and its effect on health in Turkey. Environ. Monit. Assess. 2011, 183, 77–94. [Google Scholar] [CrossRef] [Green Version]
  23. Chen, C.S.; Tu, C.H.; Chen, S.J.; Chen, C.C. Simulation of Groundwater Contaminant Transport at a Decommissioned Landfill Site-A Case Study, Tainan City, Taiwan. Int. J. Environ. Res. Public Health 2016, 13, 467. [Google Scholar] [CrossRef]
  24. Wang, H.; Nie, L.; Xu, Y.; Du, C.; Zhang, T.; Wang, Y. Effects of Highway-Related Pollutant on the Groundwater Quality of Turfy Swamps in the Changbai Mountain Area. Int. J. Environ. Res. Public Health 2018, 15, 1652. [Google Scholar] [CrossRef]
  25. Paradis, D.; Vigneault, H.; Lefebvre, R.; Savard, M.M.; Ballard, J.M.; Qian, B. Groundwater nitrate concentration evolution under climate change and agricultural adaptation scenarios: Prince Edward Island, Canada. Earth Syst. Dyn. 2016, 7, 183–202. [Google Scholar] [CrossRef] [Green Version]
  26. Chintalapudi, P.; Pujari, P.; Khadse, G.; Sanam, R.; and Labhasetwar, P. Groundwater quality assessment in emerging industrial cluster of alluvial aquifer near Jaipur, India. Environ. Earth Sci. 2017, 76, 8. [Google Scholar] [CrossRef]
  27. Sherif, M.; Al-Rashed, M. Vertical and Horizontal Simulation of Seawater Intrusion in the Nile Delta Aquifer. In Proceedings of the First International Conference on Saltwater Intrusion and Coastal Aquifers, Monitoring, Modeling, and Management, Essaouira, Morocco, 23–25 April 2001. [Google Scholar]
  28. El Monayeri, D.; Elgohary, E.H. Enhancement of Self—Purification Process of Open Drains in Egypt; Faculty of Engineering, Zagazig University Workshop: Zagazig, Egypt, 2017. [Google Scholar]
  29. El-Arabi, M. Environmental Impact of New Settlements in Groundwater in a Region in the Nile Delta. Master’s Thesis, Faculty of Engineering, Zagazig University, Zagazig, Egypt, 2007. [Google Scholar]
  30. Morsy, W.S. Environmental Management to Groundwater Resources for Nile Delta Region. Ph.D. Thesis, Faculty of Engineering, Cairo University, Cairo, Egypt, 2009. [Google Scholar]
  31. Hendy, M. Study Groundwater Management at the North of Sharkia Directorate’s. Master’s Thesis, Faculty of Engineering, Zagazig University, Zagazig, Egypt, 2012. [Google Scholar]
  32. Mabrouk, M.B.; Jonoski, A.; Solomatine, D.; Uhlenbrook, S. A review of Seawater Intrusion in the Nile Delta Groundwater System—The basis for Assessing Impacts due to Climate Changes and Water Resources development. J. Hydrol. Earth Syst. Sci. 2013, 10, 10873–10911. [Google Scholar] [CrossRef]
  33. Sherif, M.M.; Sefelnasr, A.; Javadi, A. Incorporating the Concept of Equivalent Freshwater Head in Successive Horizontal Simulations of Seawater Intrusion in the Nile Delta Aquifer, Egypt. J. Hydrol. 2012, 464–465, 186–198. [Google Scholar] [CrossRef]
  34. Abd-Elhamid, H.F.; Abdelaal, G.M.; Abd-Elaty, I.; Said, A.M. Evaluation of groundwater vulnerability to seepage from open drains considering different pumping schemes in unconfined aquifers. In Proceedings of the Twenty-First International Water Technology Conference, IWTC21, Ismailia, Egypt, 28–30 June 2018. [Google Scholar]
  35. Abd-Elaty, I.M.; Abd-Elhamid, H.F.; Fahmy, M.R.; Abdelaal, G.M. Study of Impact Climate Change and Other on Groundwater System in Nile Delta Aquifer. Egypt. J. Eng. Sci. Technol. 2014, 17, 2061–2079. [Google Scholar]
  36. Abd-Elaty, I.; Sallam, G.; Strafacec, S.; Scozzari, A. Effects of climate change on the design of subsurface drainage systems in coastal aquifers in arid/semi-arid regions: Case study of the Nile delta. Sci. Total Environ. 2019, 672, 283–295. [Google Scholar] [CrossRef] [PubMed]
  37. Abd-Elaty, I.; Eldeeb, H.; Vranayova, Z.; Zelenakova, M. Stability of Irrigation Canal Slopes Considering the Sea Level Rise and Dynamic Changes: Case Study El-Salam Canal, Egypt. Water 2019, 11, 1046. [Google Scholar] [CrossRef]
  38. Hussein, E.E.; Fouad, M.; Gad, M.I. Prediction of the pollutants movements from the polluted industrial zone in 10th of Ramadan city to the Quaternary aquifer. Appl. Water Sci. 2019, 9, 20. [Google Scholar] [CrossRef] [Green Version]
  39. Michalopoulos, D.; Dimitriou, E. Assessment of Pollution Risk Mapping Methods in an Eastern Mediterranean Catchment. J. Ecol. Eng. 2018, 19, 55–68. [Google Scholar] [CrossRef]
  40. Stefania, G.A.; Rotiroti, M.; Fumagalli, L.; Zanotti, C.; Bonomi, T. Numerical Modeling of Remediation Scenarios of a Groundwater Cr(VI) Plume in an Alpine Valley Aquifer. Geosciences 2018, 8, 209. [Google Scholar] [CrossRef]
  41. Talabi, A.O.; Kayode, T.J. Groundwater Pollution and Remediation. J. Water Resour. Prot. 2019, 11, 89885. [Google Scholar] [CrossRef]
  42. Harbaugh, A.W.; Banta, E.R.; Hill, M.C.; McDonald, M.G. MODFLOW-2000, the U.S. Geological Survey Modular Ground-Water Model—User Guide to Modularization Concepts and the Ground-Water Flow Process; USGS Open-File Report 00-92; U.S. Geological Survey: Reston, VA, USA, 2000.
  43. McDonald, M.G.; Harbaug, A.W. A Modular Three-Dimensional Finite-Difference Ground-Water Flow Model; USGS TWRI Chapter 6-A1; United States Government Printing Office: Reston, VA, USA, 1988; 586p. Available online: http://pubs.usgs.gov/twri/twri6a1/ (accessed on 24 January 2019).
  44. Javandel., I.; Doughty, C.; Tsang, C.F. Groundwater Transport: Handbook of Mathematical Models; American Geophysical Union Water Resources Monogram: Washington, WA, USA, 1984. [Google Scholar]
  45. Bear, J. Dynamics of Fluids in Porous Media; Dover Publications, Inc.: New York, NY, USA, 1972. [Google Scholar]
  46. RIGW. Hydrogeological Map of Nile Delta. Scale 1: 500,000, 1st ed.; RIGW: Nile Delta, Egypt, 1992. [Google Scholar]
  47. SNC. Egypt’s Second National Communication, Egyptian Environmental Affairs Agency (EEAA-May 2010). In Under the United Nations Framework Convention on Climate Change on Climate Changem; EEAA: Cairo, Egypt, 2010. [Google Scholar]
  48. WMRI-NWRC. Unpublished Report under the Matching Supply and Demand Project; Water Management Research Institute, National Water Research Center, Ministry of Water Resources and Irrigation: Kanater El-Khairia, Egypt, 2002. [Google Scholar]
  49. Sallouma, M.K.M. Hydrogeological and Hydrochemical Studies East of Nile Delta, Egypt. Ph.D. Thesis, Faculty of Science Ain Shams University, Cairo, Egypt, 1983; 166p. [Google Scholar]
  50. RIGW. Projected of the Safe Yield Study for Groundwater Aquifer in the Nile Delta and Upper Egypt; Part 1; Ministry of Irrigation, Academy of Scientific Research and Technology, and Organization of atomic Energy: Kanater El-Khairia, Egypt, 1980. (In Arabic) [Google Scholar]
  51. Zheng, C.; Wang, P.P. MT3DMS—A Modular Three-Dimensional Multispecies Transport Model for Simulation of Advection, Dispersion and Chemical Reactions of Contaminants in Ground-Water Systems. In Documentation and User’s Guide: Contract Report SERDP-99-1; U.S. Army Engineer Research and Development Center: Vicksburg, MS, USA, 1999. [Google Scholar]
  52. AEE. Institute for Sustainable Technology, Sustainable Concept towards a Zero Outflow Municipality; Contract Nr ME8/AIDCO/2001/0515/59768, Final report SEKEM Pilot System; AEE: Gleisdorf, Austria, 2008. [Google Scholar]
  53. Abdel-Shafy, H.; El-Khateeb, M. Integration of septic tank and constructed wetland for the treatment of wastewater in Egypt. Desealinitaion Water Treat. 2013, 51, 3539–3546. [Google Scholar] [CrossRef]
  54. TVA. Tennessee Valley Authority, Lake Manzala Wetland Project Mission Report; Project No. EGY/93/G31; Prepared for Operational Unit for Development Assistance: Cairo, Egypt, 1999. [Google Scholar]
  55. Abd-Elhamid, H.F.; El-Kilany, M.E.; Javadi, A.A. A cost-effective method to protect the coastal regions from sea level rise A case study: Northern coasts of Egypt. J. Water Clim. Chang. 2015, 7, 114–127. [Google Scholar] [CrossRef]
  56. Abd-Elhamid, H.F.; Abd-Elaty, I.; Negm, A.M. Control of Saltwater Intrusion in Coastal Aquifers Groundwater in the Nile Delta. In The Handbook of Environmental Chemistry; Springer International Publishing AG: Cham, Switzerland, 2018. [Google Scholar] [CrossRef]
  57. Abd-Elaty, I.; Abd-Elhamid, H.F.; Javadi, A. Numerical analysis of the effects of changing hydraulic parameters on saltwater intrusion in coastal aquifers. Eng. Comput. 2016, 33, 2546–2564. [Google Scholar] [CrossRef]
Figure 1. Discharge of (a) domestic sewage, (b) solid waste in water, (c) raw industrial sewage, and (d) agricultural sewage in polluted Bahr El-Baker drain, Egypt [28].
Water 11 02321 g001
Figure 2. Vertical section of Hypothetical study area.
Water 11 02321 g002
Figure 3. Hypothetical model grid and boundary condition for (a) head and (b) concentration
Water 11 02321 g003
Figure 4. Hypothetical model results for (a) flow direction and (b) contamination
Water 11 02321 g004
Figure 5. Hypothetical case for (a) calibration differences between calculated and observed groundwater head and (b) location of observation wells.
Water 11 02321 g005aWater 11 02321 g005b
Figure 6. The Nile Delta aquifer in Egypt (http://entroportal.nilebasin.org).
Water 11 02321 g006
Figure 7. Numerical model geometry and boundary condition (a) a real view, (b) section in X-direction from East to West and (c) section in Y-direction from North to South in NDA.
Water 11 02321 g007
Figure 8. Numerical model results for flow and solute transport in NDM.
Water 11 02321 g008
Figure 9. Model calibration results for head and solute transport in NDM.
Water 11 02321 g009
Figure 10. Sensitivity analysis results for grid size in NDM.
Water 11 02321 g010
Figure 11. Relation between contamination extension and distance from polluted drain to canal according to the three proposed scenarios of hypothetical stages and concentrations.
Water 11 02321 g011
Figure 12. Vertical distribution of TDS in NDM for three scenarios of boundary conditions.
Water 11 02321 g012
Figure 13. Relation between contamination extension and distance from polluted drain to canal according to the hypothetical permeability scenario.
Water 11 02321 g013
Figure 14. Vertical section in NDM for polluted drain (a) position in clay and sand layers and (b) distribution of TDS.
Water 11 02321 g014
Figure 15. Vertical section in NDM for cutoff wall (a) location and depths and (b) distribution of TDS.
Water 11 02321 g015
Figure 16. Relation between contamination extension and distance from polluted drain to canal according to the hypothetical cutoff wall scenario.
Water 11 02321 g016
Figure 17. Relation between contamination extension and distance from polluted drain to canal according to the hypothetical drain lining scenario.
Water 11 02321 g017
Figure 18. Vertical distribution of TDS in NDM at drain lining.
Water 11 02321 g018
Table 1. Summary of boundary conditions, hydraulic parameters inputs and solution methods for NDA model.
ItemBoundary Conditions and Hydraulic ParametersValueDimension
AquiferHoloceneHorizontal hydraulic conductivity (Kh)0.10–0.25m.day−1
Vertical hydraulic conductivity (KV)0.01–0.025m.day−1
Effective porosity (neff)50%
Total porosity (nT)60%
Specific yield (Sy)0.10-
Specific storage (Ss)1 × 10⁻⁷m−1
QuaternaryHorizontal hydraulic conductivity (Kh)5–100m.day−1
Vertical hydraulic conductivity (KV)0.50–10m.day−1
Effective porosity (n)20%
Total porosity (n)30%
Specific yield (Sy)0.15-
Specific storage (Ss)0.005m−1
Longitudinal dispersivity (αL)10m
Transverse dispersivity (αT)1m
Molecular diffusion coefficient(D*)1 × 10⁻⁴m2 day−1
Model Solution MethodImplicit finite-difference solver with the upstream-weighting(GCG)-
Number of column (Δx = 333 m)350-
Number of raw (Δy = 333 m)380-
Initial time step0.01day
Table 2. Summary of salt mass and percentage salt reduction for different scenarios.
CaseSalt Volume (kg)Salt Repulsion (%)(C0C)/C0
Hypothetical CaseNile Delta AquiferHypothetical CaseNile Delta Aquifer
Base case4.091 × 1035.81134 × 1010--
Boundary conditionsIncreasing river head3.6547 × 1035.44554 × 1010+10.66+6.29
Decreasing drain head3.5636 × 1035.30492 × 1010+12.89+8.71
Decreasing drain contamination3.0683 × 1034.35852 × 1010+24.99+25
Installing polluted drain in low permeability layer3.3135 × 1035.83873 × 1010+19.01-
Installing cut-off wall on polluted drain sides2.9272 × 1035.79137 × 1010+28.49+0.34
Using lining materials for polluted drains0.36758 × 1031.73598 × 1010+91.02+70.13

