Article

Is Flood Irrigation a Potential Driver of River-Groundwater Interactions and Diffuse Nitrate Pollution in Agricultural Watersheds?

1
Department of Chemistry, Life Sciences and Environmental Sustainability, University of Parma, Parco Area delle Scienze 11/A, 43124 Parma, Italy
2
Department of Theoretical and Applied Sciences, University of Insubria, Via JH Dunant 3, 21100 Varese, Italy
3
Institute for Electromagnetic Sensing of the Environment, National Research Council, Via Bassini 15, 20133 Milan, Italy
4
Department of Life Sciences and Biotechnology, University of Ferrara, Via L. Borsari 46, 44121 Ferrara, Italy
5
Department of Earth and Environmental Sciences, University of Pavia, via Ferrata 1, 27100 Pavia, Italy
6
Marine Science and Technology Center, Klaipeda University, Klaipeda 92294, Lithuania
*
Author to whom correspondence should be addressed.
Water 2019, 11(11), 2304; https://doi.org/10.3390/w11112304
Submission received: 15 September 2019 / Revised: 26 October 2019 / Accepted: 30 October 2019 / Published: 3 November 2019

Abstract

:
In the Po plain, northern Italy, rivers within agricultural basins display steep summer increases in nitrate (NO3) concentrations. Flood irrigation in overfertilized, permeable soils may drive such diffuse pollution, facilitating interactions between NO3-rich groundwater and surface waters. We discuss multiple, indirect evidence of this mechanism in the Adda, Oglio, and Mincio rivers. These rivers drain agricultural soils with elevated nitrogen (N) surpluses, averaging 139, 193, and 136 kg ha−1 in the Adda, Oglio, and Mincio watersheds, respectively. The three rivers cross a transitional area between highly permeable and impermeable soils, where summer NO3 concentrations may increase by one order of magnitude over short distances (8–20 km). Upstream of this transitional area, a major fraction of the river flow is diverted for flood irrigation, a traditional and widespread irrigation technique for permeable soils. We speculate that diverted water solubilizes soil N excess, recharges the aquifer, and transfers soil N surplus into groundwater, resulting in NO3 pollution. Groundwater–river interactions were estimated experimentally, via water and NO3 budgets in 0.3 to 1 m3 s−1 km−1 and in 1500 to 5400 kg NO3–N day−1. The data suggest a pronounced east–west gradient of groundwater to river diffuse water inputs among the three adjacent basins, reflecting the soil permeability and the width of the river–groundwater interaction zone. Given the large stock of NO3 in groundwater, management interventions performed at the basin scale and aimed at decreasing N excess will not produce an immediate decrease in river NO3 pollution.

1. Introduction

Agricultural, industrial, and civil activities have greatly increased the levels of reactive nitrogen (N) in river basins and altered the hydrological cycle on the catchment scale [1,2]. Major N input sources are organic and synthetic fertilizers, generally exceeding crops’ N requirements. Moreover, fertilization plans seldom consider mineralization rates and factors regulating N dynamics in agricultural land, like soil properties and irrigation techniques [3,4]. A nitrogen surplus has a high impact on people and ecosystems, including health effects, eutrophication, groundwater pollution, and global warming [5,6,7].
The increasing demand of water abstraction for irrigation and, more recently, climate change, are the main factors affecting the hydrological cycle [8,9]. Large abstractions from surface and ground water have modified natural flow regimes, groundwater recharge, water retention times, and water exchange rates in surface–groundwater interaction zones [10]. In this context, the understanding of how agricultural practices affect surface water (SW)–groundwater (GW) interactions and impact water quality are important issues. This is especially true in European river basins where water quality requirements are defined by two specific directives, i.e., the Water Framework Directive [11] and the Groundwater Directive [12].
In pristine ecosystems, rivers drain their watersheds and transfer water downstream. In heavily-irrigated agricultural areas, the path of river water to coastal areas includes upstream abstraction, circulation in artificial canals, dispersal over crops, percolation, or runoff. Upon returning to the main river course, river water may be eventually diverted downstream and reused to irrigate a downstream portion of the basin. This mechanism enhances river water–soil interactions, and increases the concentrations of dissolved and particulate nutrients in aquatic ecosystems [13,14]. Barakat and colleagues [4] reviewed the N dynamics in agricultural land in relation to irrigation techniques, considering the soil water content as a first-order determinant driving N transformations. Compared to drip and subsurface drip irrigation techniques, flood irrigation and sprinkler irrigation techniques favor NO3 leaching, in particular when they are associated with near-saturation soil water content and coarse soils [15,16,17,18,19,20]. Zotarelli et al. [21] and Perego et al. [22] described the interaction effects of irrigation treatments and N application on N leaching and a low irrigation efficiency with a high rate of drainage and N loss when flood irrigation was adopted.
In recent decades, efforts have been made not only to investigate N sources and dynamics on river basin scales, but also to consider rivers and groundwater as part of a single hydrological system where the two compartments can interact, in an attempt to integrate hydrogeological and ecological aspects [13,14,23,24,25,26,27,28,29]. Studies on SW–GW interactions in human-impacted watersheds have focused on the understanding of water quality and quantity exchanges. In semi-arid areas, the main issue was how to assess the contribution of groundwater to maintain river flow, in particular during dry periods or where groundwater withdrawal for anthropic purposes could affect groundwater supply to rivers [28,30,31,32]. In contrast, in temperate agricultural watersheds with N excesses, the focus was on the N dynamics between surface and ground waters in relation to point or diffuse pollution sources, river water use, and hydrogeological settings [14,27,33,34,35,36]. Although several studies on N polluted surface–groundwater interaction zones have been performed by coupling hydrological data, environmental and isotope tracers, statistical techniques, GIS, and numerical models [28,33,37,38], a detailed understanding of the interactions between rivers and N-polluted groundwaters has not emerged. Heterogeneity and scale problems make the fluxes of groundwater toward rivers difficult to quantify, taking also N fluxes and turnover and irrigation into account [24]. The latter factor may affect water residence times, N storage zones, N flow paths in aquifers, and the interactions between rivers and N-polluted groundwaters.
The sub-basins of the Po Plain (northern Italy) are good examples of watersheds impacted by agriculture which are characterized by major hydrological and land-use alterations, by areas where the groundwater interacts with surface waters [27,39,40], and by areas vulnerability to NO3 pollution [41,42,43,44]. In these basins, the N excess in agricultural land is removed only partially by denitrification, and groundwater represents an important temporary N sink [14]. In the mid-to-long term, the NO3 accumulated in groundwater can be substantially recycled via springs, thereby polluting surface waters [41]. The aim of this work is to provide multiple pieces of evidence to support a mechanism underlying diffuse N pollution via SW–GW interactions in three adjacent sub-basins of the Po River watershed: the Adda, Oglio, and Mincio river basins. The selected rivers cross an area at the transition between permeable and impermeable soils, characterized by numerous groundwater resurgences (the spring belt zone) [14]. These rivers are regulated to supply an artificial network of irrigation canals that is 500–700 years old, and has the potential to divert a major fraction of the natural river flow during summer. This water flow regulation has deep implications for local hydrogeology, for example the recharge of the unconfined aquifer [45,46,47], and water chemistry, due to the solubilization and transport of pollutants [40,41,48]. We hypothesize that the combination of N excess, due to agriculture and farming, and flood-based irrigation practices over permeable soils enhances N leaching to groundwater; the subsequent rise of the groundwater table leads, for gaining rivers, to the replacement of the low NO3 river water employed for irrigation with NO3-rich groundwater, with the consequent transfer of contamination to the surface.

2. Materials and Methods
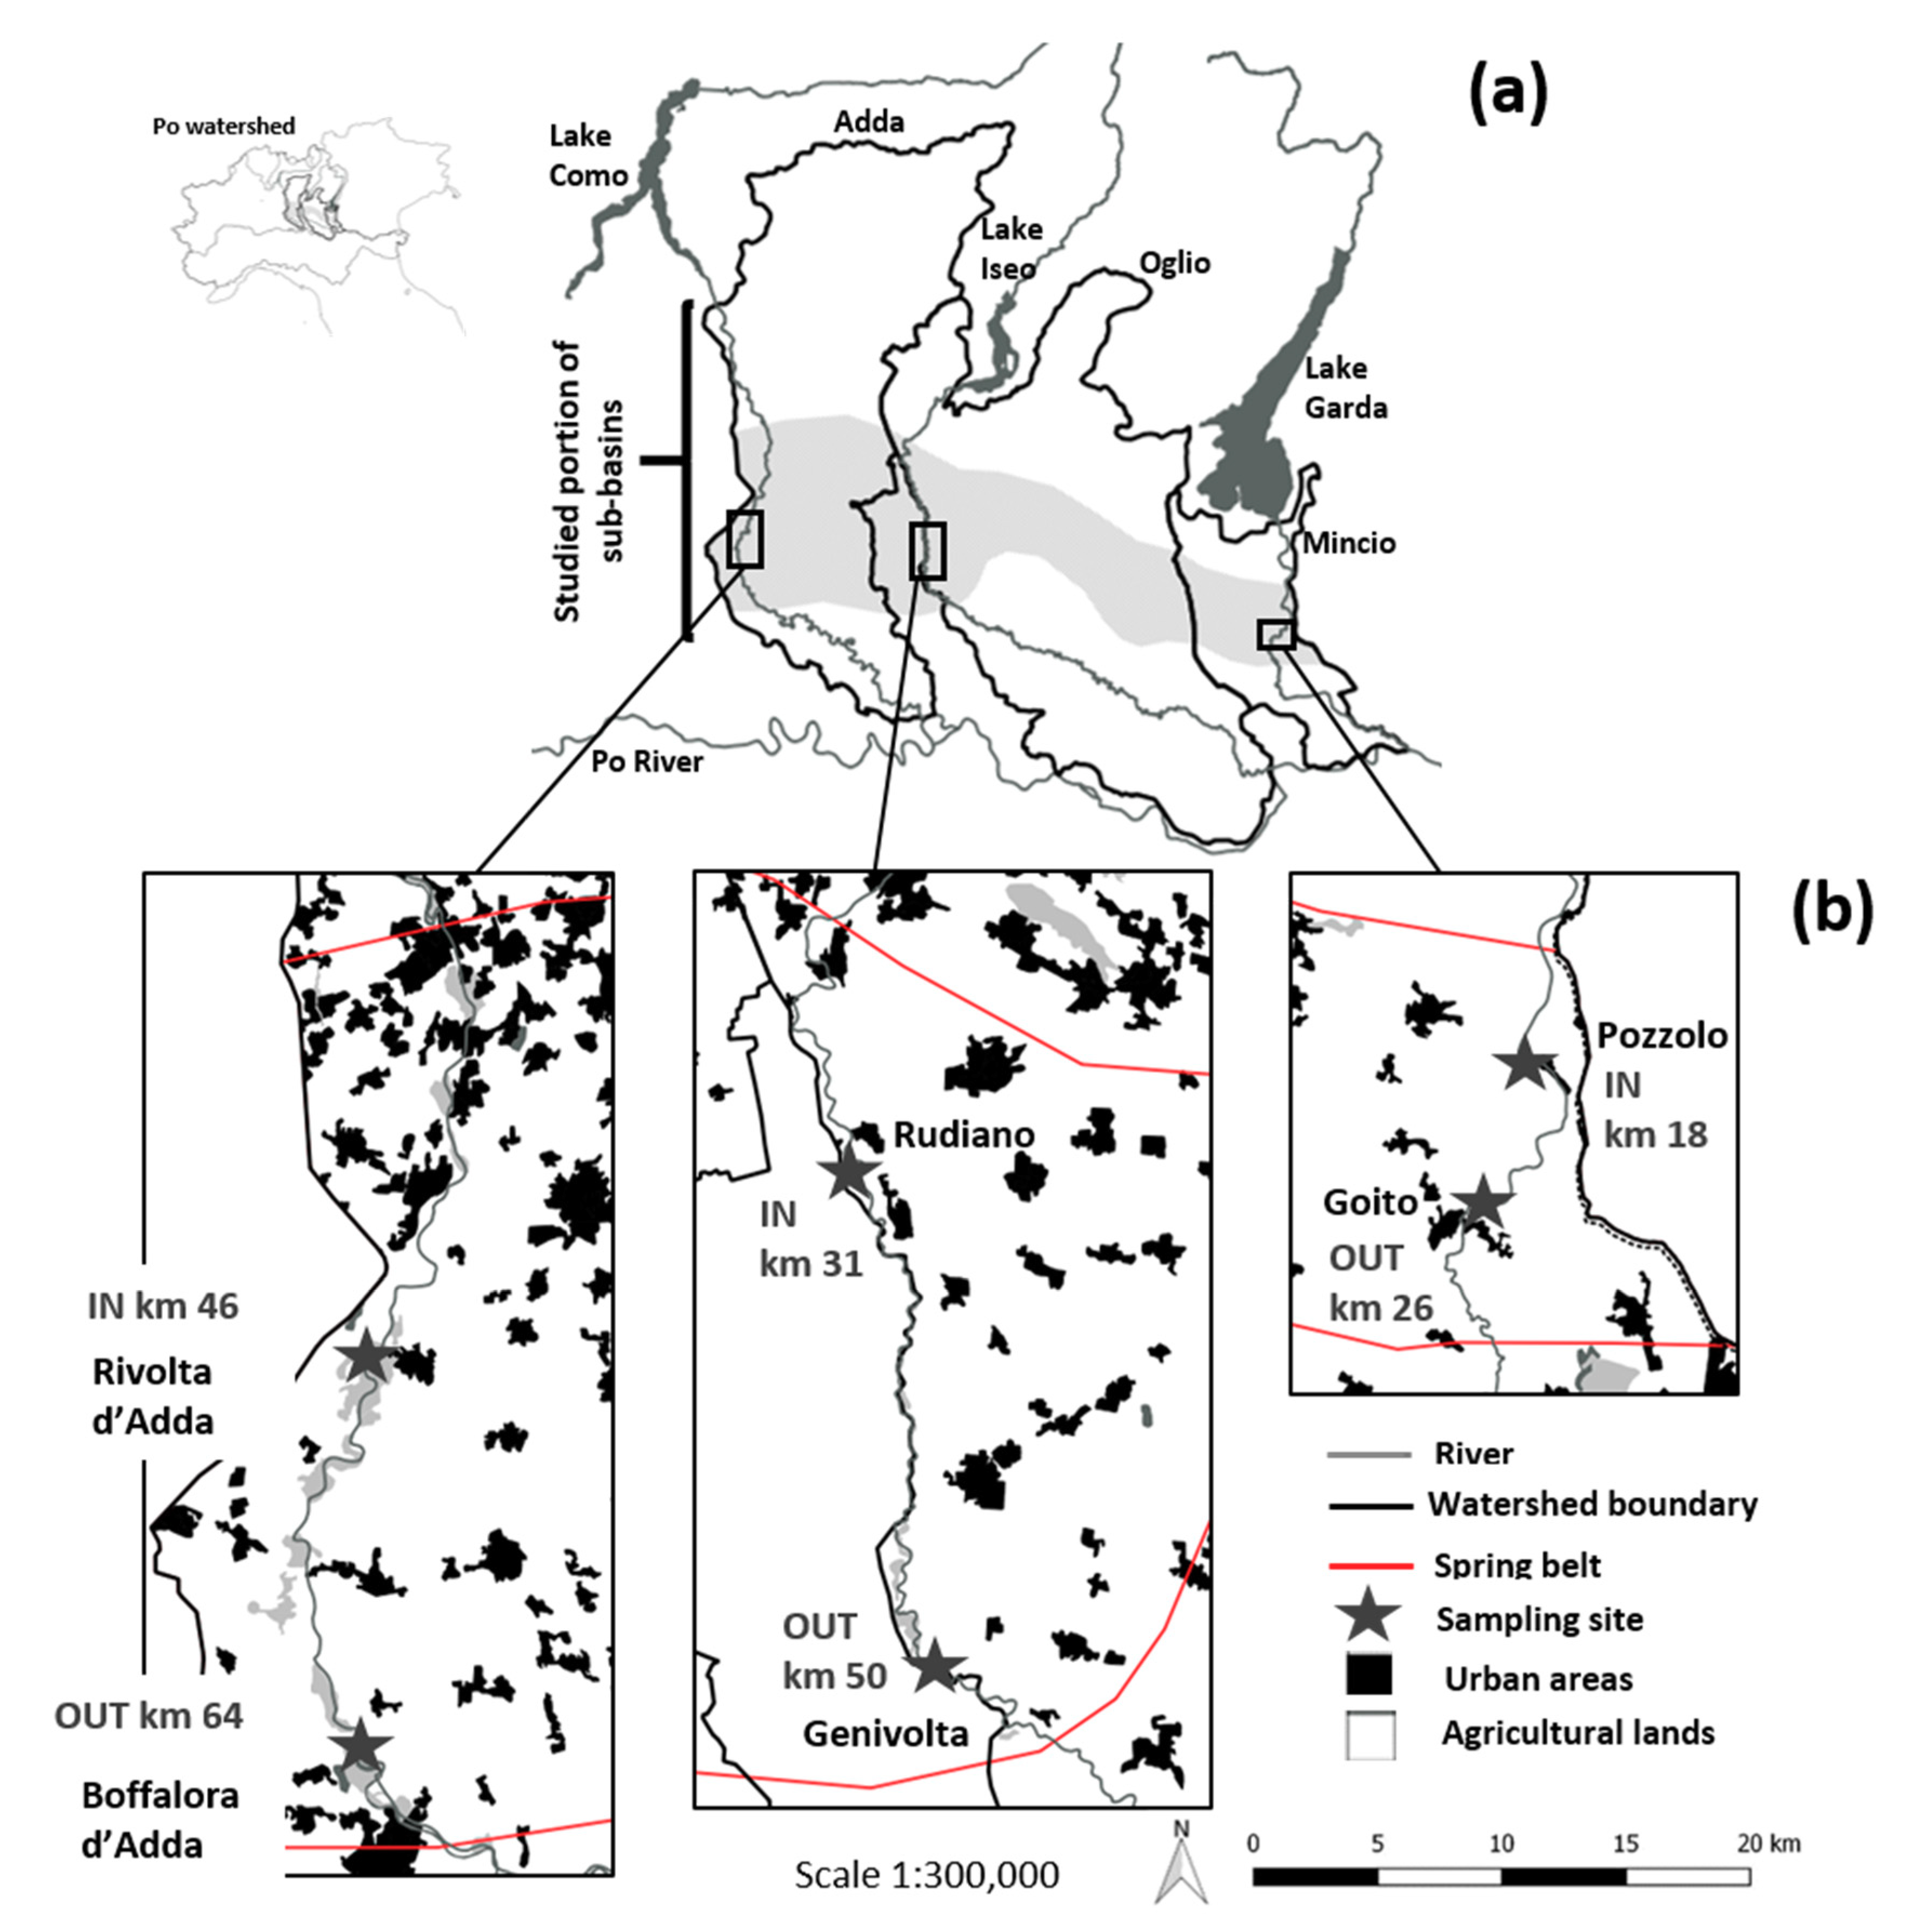
2.1. Study Area

The lower portions of the Adda, Oglio, and Mincio rivers (Lombardy Region, northern Italy) lay in the central part of the Po Plain and are left-side tributaries of the Po River (Figure 1 and Figure 2, Table 1). They originate from oligo to mesotrophic alpine lakes: Como, Iseo, and Garda, with 0.012 ± 0.001, 0.011 ± 0.001, and 0.004 ± 0.001 mg NO3–N L−1 respectively as their average concentrations. The river flows of the three rivers are regulated by the Olginate, Sarnico and Monzambano dams, respectively. The dams regulate the water discharge from lakes in order to satisfy the multiple needs of agriculture, hydropower production, tourism, and minimum vital flow, according to well-defined general rules. To maintain stable water levels in the lakes, water is retained during non-irrigation periods (from October to April) and released during summer to meet agricultural needs (from May to September). Most water abstraction structures are located within the initial 40 km of the river (Figure 3) [49]. River watersheds cover a cumulative area of ~8000 km2 and host sediment belonging to the continental depositional system of the Plio-Pleistocene age [50,51]. The unconfined aquifer is made of coarse gravels and sands (with cumulative thicknesses from 30 to 150 m). The grain size decreases from N to S and from W to E with increasing distance from the sediment source (Figure 2). Accordingly, the permeability of the aquifer in the higher plain greatly exceeds that of the lower plain. The unconfined aquifer is recharged in the Alpine foothills and all over the plain area by the direct infiltration of precipitation and irrigation water. The mean annual precipitation in the study area is ~853 mm year−1 [52,53]. Groundwater flow is directed towards the Po River (i.e., roughly oriented N–S in the pre-alpine sector), and is strongly controlled by the draining action of the Po River and its tributaries [42]. The transition between the higher and the lower plains, the so-called “spring belt area”, is characterized by numerous permanent groundwater resurgences, with 1536 springs counted in the Lombardy Region alone [54,55]. Springs originate from a difference in the rock permeability or from the presence of buried structures in the Alpine fronts that represent a barrier to the natural groundwater flow towards the Po River [56,57,58]. All the upstream reaches of the Adda, Oglio, and Mincio rivers flow across the spring belt area, which, according to the springs database [54], decreases in width form W to E, being of about 35, 35, and 20 km in the Adda, Oglio, and Mincio basins, respectively, likely due to tectonic and geomorphological constraints (Figure 1) [56]. In this area, the three rivers mostly drain the phreatic aquifer, because their beds are lower than the groundwater head [47,59].
All rivers were studied in a stretch between the lake dam, i.e., km 0, and the southernmost extreme of the spring belt, at km 70, 60, and 40 for the Adda, Oglio, and Mincio rivers, respectively (Figure 1 and Figure 2, Table 1). Within this stretch, all rivers cross the spring belt area at approximately km 40, 25, and 18, respectively. The portion of watersheds studied covers 2553, 2200, and 650 km2, representing nearly 75%, 57%, and 77% of the total area, and includes 290, 162, and 29 municipalities, all of which are within the high-medium plain of the Adda, Oglio, and Mincio basins, respectively (Table 1 and Table 2). All watersheds are characterized by intensive agriculture and livestock activities (mainly cows and pigs); the main crops include maize, feed crops and, for the Adda portion, meadows. Flooding, followed by sprinklers, are the main irrigation techniques used in all the watersheds portions under study [62].
The study area includes 8, 19, and 6 main water abstractions to supply irrigation canals for the Adda, Oglio, and Mincio rivers, respectively. The studied stretch of the Adda River is characterized by two tributaries: the Brembo River and the Belgiardino canal (Figure 3).

2.2. Water Flow, Use, Precipitation, and Associated N Loads Calculation

There are robust datasets reporting the natural and regulated flows and abstraction works for all the considered rivers, which have been regularly monitored since the 1970s [63]. The seasonal hydrology of the upstream river stretches characterizing the initial 70 km were analyzed by collecting historical series of river flows and information about the hydraulic scheme of the three systems (i.e., withdrawals of concessions for the production of hydroelectric energy and for irrigation purposes). Historical series of river flow data were validated and integrated with water discharge measurements performed by the Adda, Oglio, and Mincio Consortiums, together with the Universities of Parma, Pavia, and Insubria, in the period of 2006–2014 during seasonal monitoring activities [64]. Such activities were carried out within the frameworks of different projects aiming at determining the minimum vital flow for the three systems, where physico-chemical and biological parameters were monitored at a large number of stations. The present work reports the field data collected in 7, 6, and 5 stations of the Adda, Oglio, and Mincio rivers, respectively. In particular, water flow, temperature, electrical conductivity, and NO3 concentrations were measured. A description of the sampling and analytical methods used is reported in Section 2.4.
Irrigation data covering irrigation techniques, irrigated surface, and the water volume used for irrigation for the three dominant crops, i.e., maize, feed crops, and meadows were obtained from the 6th General Census of Agriculture [62] at the municipal level, and then aggregated to the watershed scale. These data were then compared with reference crop water needs, as suggested by D.G.R. Emilia-Romagna n.1415/2016 [65] (3000 m3 ha−1 for maize, 2500 m3 ha−1 for feed crops, and 4400 m3 ha−1 for meadows). These reference values take into account the local meteorological and environmental conditions, are site-specific for the Po River plain, and may differ from the values reported in the literature [66].
The mean annual and monthly precipitation data were downloaded from the JRC Soil Portal [67], where Gardi and colleagues [52] interpolated meteorological data from the period of 1960–1990 onto a 50 × 50 km grid [53]. The average precipitation values for the whole investigated area and for each sub-basin were obtained by clipping sub-basin boundaries and precipitation raster data via the QGIS software ver. 2.18 (QGIS Development Team, https://www.qgis.org/it/site/). The sum of the mean monthly precipitations during the irrigation (from May to September) and non-irrigation periods (from October to April) was also calculated.
During the irrigation period, the total amount of water that reaches the agricultural area was estimated as the sum of the water volume used for irrigation plus the rainwater volume during the 5 months of irrigation. This approximate mass budget of water input to the agricultural land was coupled with the load of dissolved N in irrigation and rainwater. To this purpose, N loads associated with irrigation and surface waters were determined by multiplying the abstracted river water volumes by the NO3 concentration measured upstream of the abstraction. Nitrogen loads associated with irrigation with groundwater were obtained by multiplying the withdrawn ground water volume by the measured groundwater NO3 concentrations. Nitrogen loads from rainwater were estimated by multiplying rainwater the volume during the irrigation period by their NO3 concentrations, as derived from the national maps of oxidized N compounds deposition [68].

2.3. Nitrogen Mass Balance Calculations at the Watershed Level

A N budget for the watershed portions included between each dam and the southernmost extreme of the spring belt was calculated (Figure 1). The aim of this calculation was to investigate the potential N excess generated by diffuse sources in highly vulnerable and irrigated soils, and to evaluate the NO3 pollution risk. A soil system N budget was performed using farming census data [62] at the spatial resolution of the individual municipalities included within each watershed, and then aggregated at the sub-basin level [69,70,71]. We compared N inputs (livestock manure, synthetic fertilizers, atmospheric deposition, and biological fixation) and outputs (crop uptake, ammonia volatilization, and denitrification) across the Utilized Agricultural Area (UAA) of the considered watershed portions [14,72,73]. The input and output terms and the N balance were expressed in unit of mass per time (t N year−1). The balance items per unit of area were finally calculated by dividing the annual loads by the UAA of each watershed portion (kg N ha−1 UAA year−1).

2.4. Water and N Mass Budgets along River Reaches Interacting with Groundwater: Sampling Strategies, Analytical Techniques, and Calculations

Water and NO3 mass budgets were calculated from the experimental data gathered in three reaches of each river, chosen within the spring belt zone. The chosen Adda and Oglio river reaches had similar lengths (~18 km), while the Mincio river reach was 8 km long (Figure 1). The three reaches were characterized by the presence of one irrigation abstraction (Adda), three small point sources, and 11 irrigation abstractions (Oglio), as well as one small point source and two irrigation abstractions (Mincio). The mass budget method is based on the open-channel technique, and makes it possible to calculate the net budgets of solutes or particulate matter [74]. Positive budgets mean net solutes or particulate accumulation in the stretch, while negative values mean net retention (i.e., uptake, precipitation) or loss (i.e., denitrification). The general equations used for water and NO3 loads mass budgets are:
L o u t = L i n + L p s + L d s L i d ,
Q o u t = Q i n + Q p s + Q d s Q i d ,
where L means NO3 loads, calculated at different stations multiplying discharge (Q) by NO3 concentrations. Stations in and out are located at the beginning and end of each river reach, respectively; ps indicates point sources within river reaches, id indicates irrigation abstractions within river reaches, and ds indicates a diffuse source within the river reaches. The two equations allowed us to estimate Lds and Qds, and consequently, the concentrations of NO3 in the diffuse water inputs (NO3ds). Calculated daily average diffuse water inputs to the river reaches (Qds) were expressed in cubic meters per second and in cubic meters per second per kilometer, normalizing data for each stretch length.
Our experimental approach was based on three assumptions: (i) the regulation of the hydrological regime is constant during the sampling period (the river flow at the site IN and the river flows derived to irrigate must be constant during the day); (ii) diffuse or groundwater chemical inputs to the river are homogeneous along the reach; and (iii) the groundwater chemical composition equals that of spring waters within the river basin.
The sampling campaigns were performed during the irrigation period. Water samples and flow data in the three river reaches were collected for a whole day with repeated samplings over 24 h, three times in a day in September 2013 (Adda and Oglio) and seven times in a day in August 2006 (Mincio). Multiple samplings allowed us to consider errors associated with daily NO3 concentrations and water discharge variations in the mass budget equations. Water samples of river, point sources, and abstractions, integrated over the mixed water column, were collected in 1 L glass bottles from each site: 3 times (2 riverine sites plus 1 irrigation abstraction) for the Adda river reach; 3 times (2 riverine sites plus 11 irrigation abstractions and 3 small point sources) for the Oglio river reach, and 7 times (2 riverine sites plus 2 irrigation abstractions and 1 small point source) for the Mincio river reach. In situ water temperature and electrical conductivity were measured by means of an YSI multiple probe (mod. 556 MPS). Water samples were filtered in situ with Whatman GF/F glass fiber filters (diameter 47 mm, pore size 0.45 µm), transferred to plastic vials, and cooled to 4 °C. In the laboratory, the NO3 concentrations in the water samples were determined spectrophotometrically (detection limit <0.01 mg NO3–N L−1, precision ±5%) [75,76]. Water flows at different rivers, tributaries, or abstraction sections were measured with an accuracy of ±5% using the Rio Grande ADCP (Acoustic Doppler Current Profiler) by Rivers Consortia, or were obtained from the AIPO (Interregional Agency for the Po River). During the experimental campaigns, springs located near the river courses (n = 3 for Adda and Mincio and n = 4 for Oglio) were sampled to measure NO3 concentrations in springs water and to use these data as a proxy of the groundwater chemical composition.

3. Results

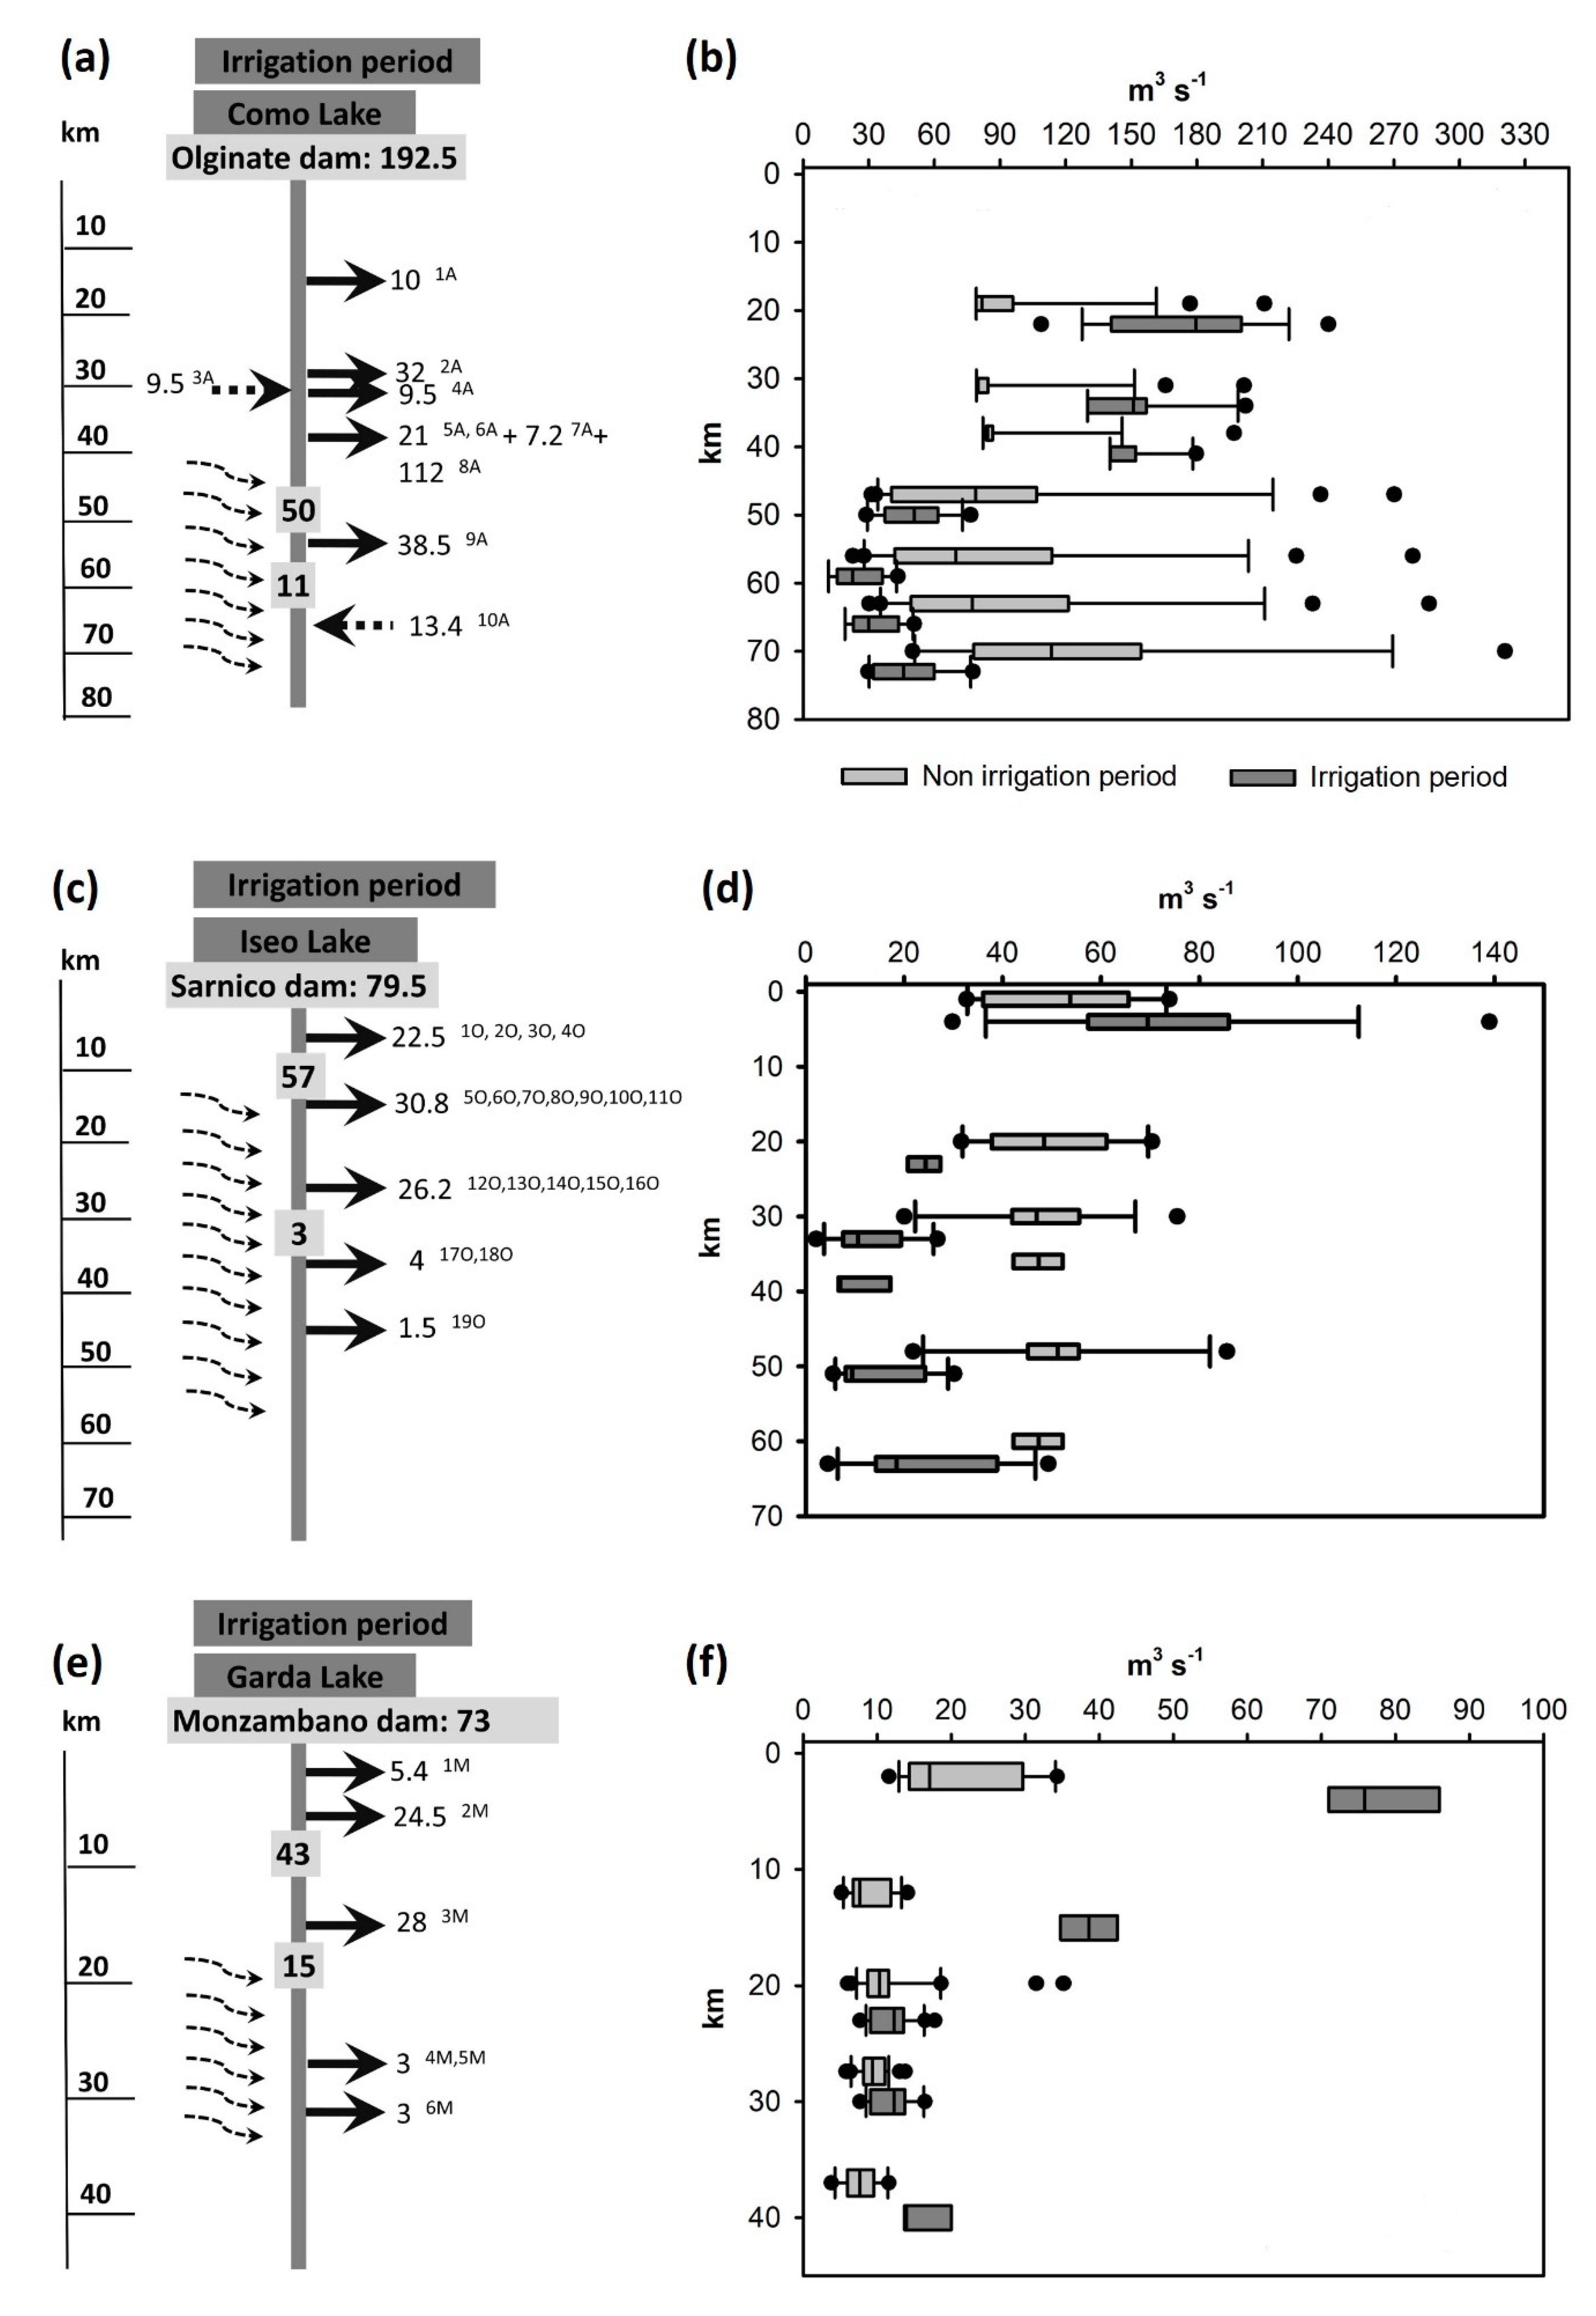
3.1. Precipitation, Water Flow, and Water Abstraction
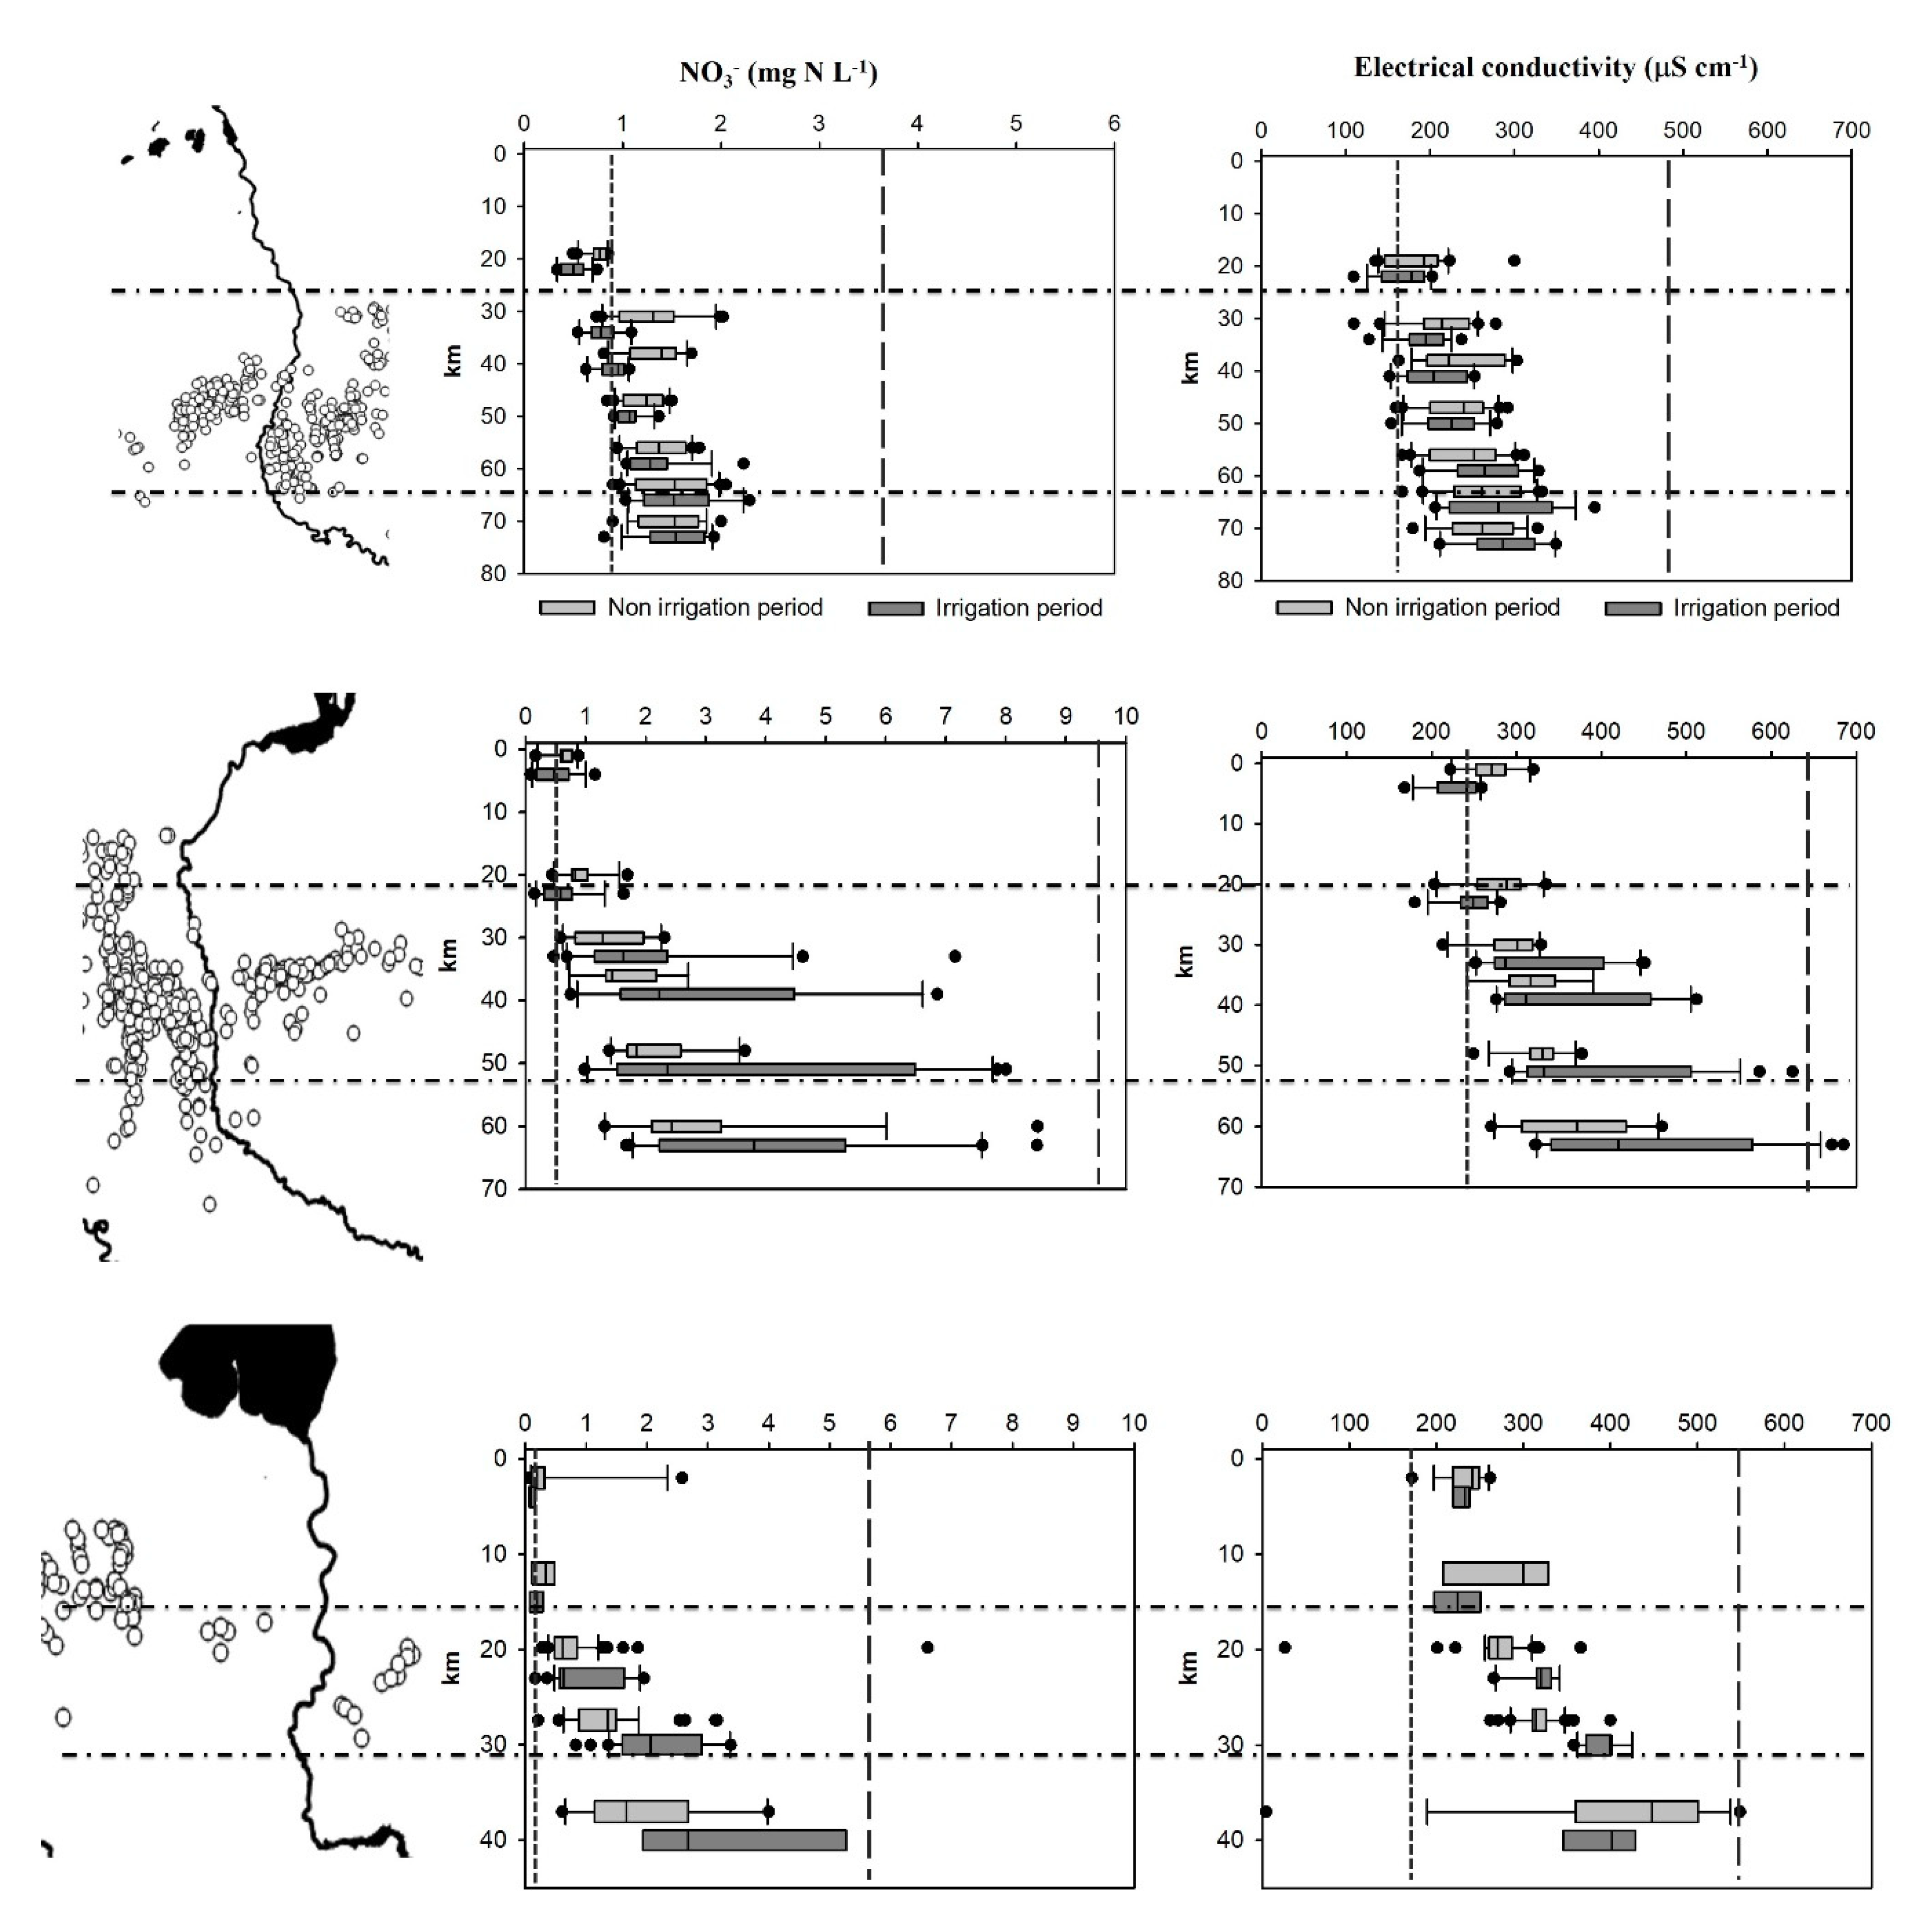
The annual average precipitation in the studied watershed portions is similar (841, 853, and 834 mm year−1). Nearly ~45% of precipitation occurs during the the 5-month irrigation period (May to September, Figure 3).
The management of the dams that regulate the flows between the Lakes Como, Iseo, and Garda and the Adda, Oglio, and Mincio rivers is similar, with highest release during the irrigation period in the three systems and water retention in the lakes during non-irrigation periods (Figure 4). As annual precipitation is similar in this geographical area, the discharge at each lake’s closing section depends on that lake’s watershed area. The Lakes Garda and Iseo drain similar watershed areas (~2200 and ~1800 km2, respectively) with the result that the average natural annual flow is ~60 m3 s−1 for both lakes. In contrast, Lake Como drains a much larger watershed area (~4500 km2), and its average natural annual flow is correspondingly higher (~160 m3 s−1). Besides a variable number of hydropower plants located within the considered stretches (8, 6, and 4 for the Adda, Oglio, and Mincio Rivers, respectively), the upstream stretch of the three rivers hosts a number of artificial abstraction canals, realized for irrigation purposes. In all watershed portions, the main source of irrigation is surface water from aqueducts and irrigation consortia, and the main irrigation techniques are flood, followed by sprinklers (Table 3).
In all study areas, between 80 and 90% of the irrigated surface is cultivated by three dominant crops. In Adda and Mincio, up to 35%, 32%, and 25% of the irrigated surface is cultivated by maize, feed crops, and meadows, respectively. The share of irrigation water among the three crops is similar: 52–56 × 106 m3 year−1 for maize, 43−48 × 106 m3 year−1 for feed crops, and 20–40 × 106 m3 year−1 for meadows. In the Oglio, ~50% of the irrigated surface is cultivated with maize, with a water supply of 150 × 106 m3 year−1, followed by feed crops (31% of irrigated surface, irrigated with 88 × 106 m3 year−1), and by meadows (5% of irrigated surface). In the Oglio and Mincio, the average water supply of maize and feed crops exceeds the crop reference water needs [65] (Table 4).
The water flow released into the Adda River from the Olginate dam in the irrigation and non-irrigation periods displays a large variability, from a minimum of ~40 to a maximum of >600 m3 s−1, (Figure 4a,b). The summer release from Lake Como averages ~200 m3 s−1 and, within the upstream 60 km stretch, the allowed water abstractions total ~230 m3 s−1, resulting in a large decrease in water flow downstream. Nevertheless, for the water flow downstream, the last abstraction is >0, likely due to diffuse water inputs. In the non-irrigation period, the water flow from the Olginate dam averages ~100 m3 s−1; such a flow remains almost unchanged along the initial 70 km stretch (Figure 4b).
A similar picture characterizes the Oglio River, with a summer release from the Sarnico dam averaging ~80 m3 s−1 and a series of abstractions along the upstream 25 km summing an identical water flow and setting the river discharge theoretically to zero (Figure 4c). However, downstream, in the last water abstraction, the river flow is generally >0 (Figure 4d), likely due to diffuse water inputs. In the non-irrigation period, the water released from the Sarnico dam averages ~50 m3 s−1; this flow remains unchanged along the upstream 60 km (Figure 4d).
In the Mincio River, the flow released from Lake Garda during summer averages 73 m3 s−1; nearly 40 m3 s−1 are diverted within the initial 5 km, another 28 m3 s−1 at km 15, and an additional 6 m3 s−1 between km 25 and km 35 (Figure 4e). The allowed water abstractions total 74 m3 s−1, close to 100% of the water released from the Monzambano dam. Downstream the last abstraction, the measured Mincio River flow is generally higher than 10 m3 s−1 (Figure 4f), likely due, as in previous rivers, to diffuse water inputs. In the non-irrigation period, the average water flow released from the Monzambano dam is lower (~20 m3 s−1; see Figure 4f), in order to retain and store water in Lake Garda.

3.2. NO3 Concentration and Electrical Conductivity

In the Mincio and Oglio rivers, and to a minor extent in the Adda, NO3 concentration and electrical conductivity increase steeply during the irrigation period, in particular along the spring belt zone (Figure 5). The input of NO3-rich waters from tributaries can be excluded, as only the Adda receives water from two tributaries in the upstream reach, but outside the spring belt zone, where the NO3 increase is registered (Figure 4 and Figure 5).
In the Adda River, from km 31 to km 65, NO3 concentrations and electrical conductivity increase by a factor ~1.9 (from 0.79 to 1.57 mg NO3–N L−1) and ~1.5 (from 192 to 284 µS cm−1), respectively. In the Oglio River, from km 20 to km 50, the NO3 concentration and electrical conductivity increase by a factor 6 (from 0.59 to 3.65 mg NO3–N L−1) and ~1.6 (from 247 to 395 µS cm−1), respectively. From km 15 to km 30 of the Mincio River, the NO3 concentration increases in summer by a factor 10, from 0.19 to 2.20 mg NO3–N L−1, while electrical conductivity nearly doubles (from 224 to 393 µS cm−1); see Figure 5. Differences in the relative increase of the two parameters likely depend on each river flow and the dilution capacity of the nutrient-poor lake water. They also depend on the amount and chemistry of the drained water. To provide reference values for NO3 and electrical conductivity, the average values measured in the three alpine lakes and in a number of springs located close to each river course are reported in Figure 5. Values measured along the Adda, Oglio, and Mincio rivers, despite the large variability in the multiannual dataset, fall within these reference values, assumed as end members. In the case of the Mincio and Oglio rivers, at the end of the stretch considered in this study, the NO3 concentrations and electrical conductivity values approach those of adjacent springs (~4 and ~14 mg NO3–N L−1 and 550 and 700 µS cm−1, respectively), whereas this is not the case for the Adda River (~4 mg NO3–N L−1 and 450 µS cm−1).

3.3. Nitrogen Mass Balances at the Watershed Scale

According to the Millenium Ecosystem Assessment definition [77] the analyzed sub-basins of the three rivers are agricultural ecosystems, with cultivated lands representing an important fraction (>30%) of the total surface. Total N inputs from agricultural and livestock activities in the investigated portions of the Adda, Oglio, and Mincio watersheds were ~28,100, ~44,400, and ~17,000 t N year−1, respectively (Table 5). The main input term was represented by livestock manure in all basins, followed by synthetic fertilizers. The main output term was crop uptake, representing some 60–70% of the total output (Table 5). In all basins N inputs to agricultural soils largely exceeded outputs, resulting in a condition of large N surplus (from ~6200 t year−1 in the Mincio basin to ~19,000 t year−1 in the Oglio basin). Areal annual N surplus in the three sub-basins varied between 136 and 193 kg ha−1 (Table 5).

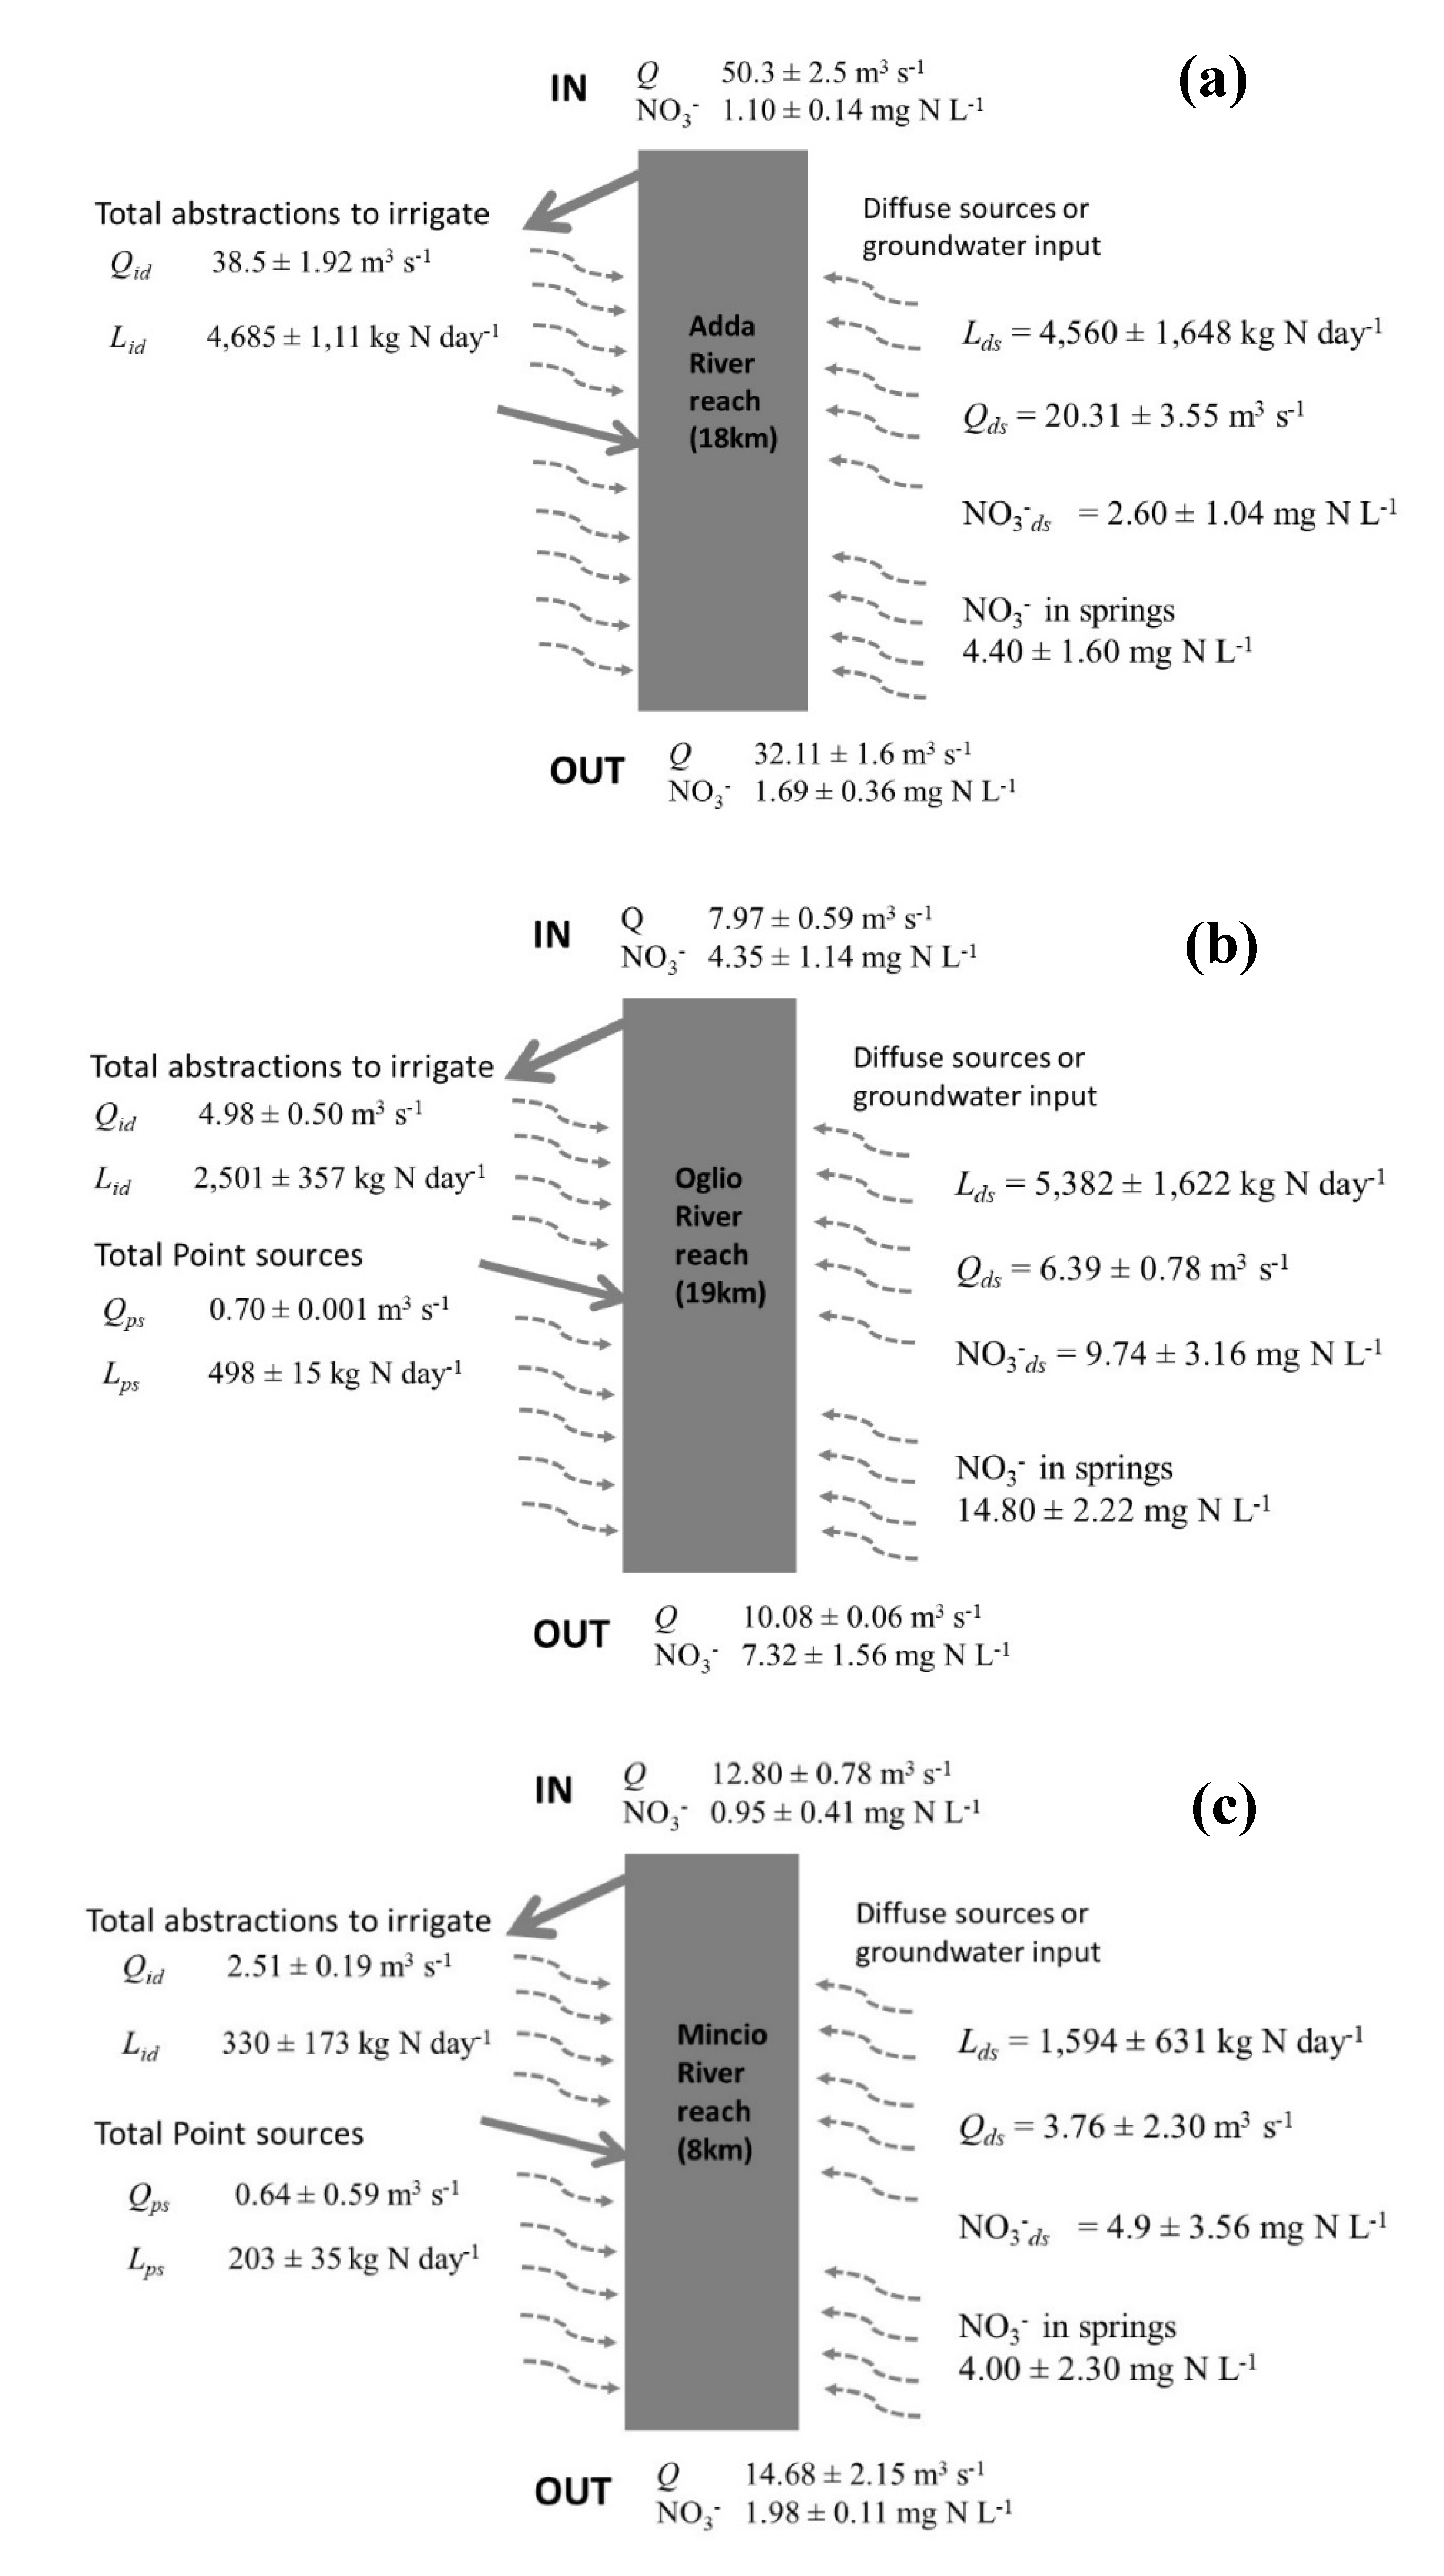
3.4. River-Groundwater Interactions: Water and N Mass Budgets and Estimated N Inputs from Groundwater

An evaluation of the nitrogen mass budget performed for the Adda River reach indicated a NO3 load from diffuse sources of 4560 ± 1648 kg N day−1 during the irrigation period (Figure 6a). The water budget reported a daily diffuse water input Qds of 20.31 ± 3.55 m3 s−1, compared to a river flow decrease of about 28 m3 s−1 in the river reach and a total daily water withdrawal for irrigation of 38.5 ± 1.93 m3 s−1. Considering the stretch length of 18 km, the normalized diffuse water input was 1.13 ± 0.20 m3 s−1 km−1. The resulting concentration of NO3 in diffuse water inputs (NO3ds) was 2.60 ± 1.04 mg N L−1. In summer, along 19 km of the Oglio River reach, the daily average river flow increased by ~3 m3 s−1. With a total daily water withdrawal of 4.98 ± 0.50 m3 s−1 and a total daily point input of only 0.70 m3 s−1, the water budget indicated a daily diffuse water input (Qds) of 6.39 ± 0.78 m3 s−1 or 0.33 ± 0.04 m3 s−1 km−1. The N mass budget showed a NO3 load input from diffuse sources (Lds) to the Oglio River reach of 5382 ± 1622 kg N day−1, and the NO3 concentration in diffuse water inputs (NO3ds) was 9.74 ± 3.16 mg N L−1 (Figure 6b). During the irrigation period in the Mincio River reach (8 km), the water discharge increased by about 1.9 m3 s−1. Considering an average 2.51 ± 0.19 m3 s−1 of daily water withdrawal and 0.64 ± 0.59 m3 s−1 of the input from point sources, the average daily diffuse water input (Qds) was 3.76 ± 2.30 m3 s−1 or 0.47 ± 0.29 m3 s−1 km−1. The daily NO3 load from diffuse inputs (Lds) was 1594 ± 631 kg N day−1, which determined a calculated NO3ds concentration of 4.90 ± 3.56 mg N L−1 (Figure 6c). For all river reaches, the estimated range of NO3 concentrations in diffuse water inputs overlapped the average NO3 concentration measured in spring waters adjacent to the river courses during the irrigation period (Figure 6).

4. Discussion

This study combines the results from monitoring activities of discharge and water chemistry, water and NO3 budgets at reach scale, soil N budgets, and water use for irrigation in sub-basins of the Adda, Oglio, and Mincio rivers. All these results provide strong evidences of a common mechanism, likely driven by flood irrigation with large water volumes over permeable surfaces, that transfers excess reactive N in soils to the groundwater and then into river waters. Reach-scale budget data suggest diffuse inputs of water with NO3 concentrations similar to those of groundwater for the three systems. The presented evidence should be supported by hydrological models quantitatively linking irrigation, river-groundwater interactions, and NO3 diffuse pollution. Understanding if and how irrigation alters hydrological processes, groundwater levels, and NO3 diffuse pollution is a priority in the context of climate change, future water availability, and the implementation of irrigation practices in new agricultural areas.

4.1. Irrigation as an Important Component of the Hydrological Cycle in the Adda, Oglio, and Mincio Rivers

The natural SW–GW interaction has been modified by the regulation of river flows and by the irrigation system that contributes, together with precipitations, to the recharge of aquifers. Precipitations are similar between non-irrigation (3.8 × 10⁸, 4.5 × 10⁸ and 2.0 × 10⁸ m3 year−1) and irrigation periods (3.2 × 10⁸, 3.8 × 10⁸ and 1.7 × 10⁸ m3 year−1 for the Adda, Oglio, and Mincio river watersheds, respectively). In all the studied systems, more than 85% of the water used for irrigation is diverted from rivers by the artificial irrigation network (1.4 × 10⁸, 2.3 × 10⁸, and 1.4 × 10⁸ m3 year−1 for the Adda, Oglio, and Mincio rivers, respectively). Such amounts are equivalent to the 51%, 72%, and 85% of the precipitation in the irrigation period for the Adda, Oglio, and Mincio basins. In other words, from May to September, the water volume used for irrigation may nearly double the water volume from precipitation.
In the Adda, Oglio, and Mincio watersheds the surface irrigated via the main and secondary canals network is equivalent to 57, 80, and 89% of the agricultural land, respectively. For the Adda and Oglio watersheds, the dominant irrigation system in the studied areas is the flooding, followed by sprinkler technique. For the Mincio watershed, the two techniques are used equally. Irrigation by flooding has a low water efficiency, with water losses of up to 60%, while irrigation by sprinkler has water losses of about 25% [78]. According to these percentages, the water volume lost during the irrigation period was estimated to be about 8.7 × 10⁷, 1.5 × 10⁸, and 6 × 10⁷ m3 year−1 for Adda, Oglio, and Mincio, respectively. Moreover, for the Oglio and Mincio watersheds, the water supply to maize and feed crops was in excess with respect to reference crop water needs of ~33 × 106 and 19 × 106 m3 year−1, respectively (~13% of the water volume used for irrigation for both basins). Therefore, the total irrigation water losses due to inefficient irrigation and excess water supply to crops is estimated to be 8.7 × 10⁷, 1.8 × 10⁸, and 7.9 × 10⁷ m3 year−1 for the Adda, Oglio, and Mincio basins, respectively.
Most of the irrigation water which is not used by crops recharges the aquifer, determines the groundwater vertical migration, feeds the springs, and drains back into the rivers via springs or river–groundwater interactions [40,47,79]. In the Oglio River, the groundwater heads in the shallow aquifer of the higher plain are lowest in spring, at the end of the non-irrigation period, and increase by about 4 m during the irrigation period [40]. Numerous springs located in the spring belt area have null discharge for most of the year, with the irrigation period being the exception [58,80,81]. Recent studies have demonstrated that the main source of recharge (>50%) to the Oglio River higher plain aquifer is irrigation water [40]. This figure was calculated with end-member mixing models using the Cl/Br ratio and δ2H with two end-members, i.e., rainfall and combined Lake Iseo-Oglio River water that feed the irrigation abstractions in the initial stretch of the river course.

4.2. Excess Manure Availability and Use of Synthetic Fertilizers Result in Diffuse N Pollution in the Three Basins

During the irrigation period, the NO3 concentrations of river water were similar to those in the spring along the Oglio and Mincio rivers, and similar to those reported in a previous study of spring water chemistry [82,83,84]. These data provide evidence that irrigation and SW–GW interactions may explain the observed NO3 trends. The diffuse input of NO3 to the Oglio River reach was demonstrated with a simulation of the Oglio River water quality by means of the QUAL2Kw model [85]. The modelling of ammonification and nitrification rates was, in fact, not able to explain the increase of NO3 concentration along the river reach crossing the spring belt during the irrigation period.
In all the studied watersheds, the risk of diffuse N pollution for surface and ground waters is indicated by the positive soil N budgets calculated in the three portions of the Adda, Oglio, and Mincio basins. Considering the soil N budget at the Po River watershed level, the agricultural areas with the highest N surpluses correspond to the studied watersheds [86]. Such excesses of N are among the highest reported in Europe and North America [87,88,89,90,91,92]. The average areal surplus peaked in the Oglio watershed portion (193 kg N ha−1 year−1), and was similar for Adda and Mincio (139 and 136 kg N ha−1 year−1, respectively). This difference was due to the almost double contribution of livestock manure input in the Oglio watershed, followed by synthetic fertilizer input. All analysed watersheds are characterized by high livestock density, resulting in manure being the main input term in the soil’s N budget (over 50% of the total N input). The large availability of organic N does not exclude the use of synthetic fertilizers, which represent the second N input utilized in agriculture (about 25% of the total N input). The average areal N surplus of the Oglio and Mincio portions was similar to that calculated on the whole watershed level [14,73]. Within these basins, the municipalities with the highest N surpluses are located in the high-medium plain included in the watershed portions under study, which are characterized by high livestock densities [14,73]. The soil N budgets of the sub-basins in the alpine sector of the Po River watershed underwent temporal and spatial variations related to changes in land use and farming practices [86]. Between the 1970s and 1980s, the shift from traditional farming practices to large scale industrial livestock farming led to an increase in soil N excess due to an increase in livestock density, mainly of pigs, that led to an overproduction of manure and slurry relative to the agricultural area available for spreading [86]. The livestock manure input to cropland exceeded the N crop uptake and removal by natural processes, such as denitrification [14,72]. In the Adda, Oglio, and Mincio watersheds, the crop uptake is the main output term, but the N assimilation efficiency is scarce (40%, 35%, and 44%, respectively), indicating a high level of vulnerability of aquatic ecosystems to diffuse N pollution [93,94]. The main crops (maize and feed crops) cultivated in the studied areas are necessary to sustain livestock farming; in particular, maize is considered to be an impacting crop due to its high N and water requirements [86]. The N requirement for maize to have a medium-high production is 280 kg ha−1, which is much lower than the N input of the agricultural land in the three considered watersheds, confirming the excess use of manure and synthetic fertilizers [95].
Taken together, these data confirm that irrigation water may horizontally and vertically displace a large N excess generated by agricultural activities. Vertical infiltration seems to be particularly well-suited to the specific soil features (high permeability).

4.3. Linking Irrigation and N Excess to Interpret N Mass Transfer

The significant body of evidence reported suggests that irrigation practices may drive the dynamic of N in regulated-agricultural watersheds. Irrigation water may solubilize NO3 excess, transfer it from surface to groundwaters, favoring groundwater table rise and its interaction with river water. An excess of N in permeable soils results in diffuse N pollution due to leaching and runoff processes to surface and ground waters [73,83].
Barakat et al. [4] have examined many studies to understand the relationships between irrigation techniques and N transformations in agricultural land. Flooding and by sprinkler appear to be the irrigation techniques with the strongest, most numerous, and least controlled effects on N transformations. In particular, irrigation by flooding favors NO3 leaching when it is associated with near-saturation soil water content and coarse soils [4,15,16,17,18,19,20]. The effect of irrigation on NO3 leaching is also amplified by an increase in N fertilization close to the timing of irrigation [21,22,96,97,98]. In summer, the proximity of sidedress fertilization and flooding irrigation results in high drainage rates (56% of annual drainage) and N leaching (46% of the entire annual losses) in the Po valley [22,99]. At the global scale, the increase of N fertilization in the last century has enhanced N leaching and the NO3 storage in vadose zones, in groundwater and in soil as organic N in root zones [99,100,101]. This N legacy at the watershed level could lead to a biogeochemical lag between the complete cessation of fertilizer application and the disappearance of its effects on groundwater and surface water quality [101].
In this study, it is evident that the sum of N surplus in agricultural soil, and NO3 loads from precipitation and irrigation, together with the high water volume used, may favor N leaching into groundwater [100,101]. The total NO3 loads from irrigation and precipitation are 0.49, 0.92, and 0.24 t N year−1 for the Adda, Oglio, and Mincio watershed portions. The contribution of irrigation water is 38%, 61%, 30% of the total loads, respectively. In the Oglio watershed portion, irrigation by wells constitutes only 16% of the water volume used for irrigation, but it drives the NO3 load from irrigation due to the NO3 contamination of groundwater. Also in the Adda and Mincio watershed portions, the contribution of groundwater to irrigation is about 13 and 4%, respectively, but it does not affect the NO3 load due to the lower NO3 concentrations in groundwater compared to that in the Oglio basin. The annual N surplus in agricultural soil increases by ~5% in the three watersheds, adding the NO3 loads from irrigation and precipitation. This total N load, in excess in agricultural soil, may be partially transferred to groundwater by irrigation water losses: the potential NO3 concentration of leaching water may be estimated to be around 20–30 mg N L−1. This value is a maximum estimation because it does not consider the denitrification process in aquatic environments [14] and the accumulation in the vadose zone and in the soil [100,101]. This range is, in fact, higher than the NO3 concentrations (from 2.3 to 11.3 mg N L−1 in the high-medium plain for the period 2001–2010) measured by ARPA Lombardy in the groundwater monitoring network into the Po River plain [41]. NO3 concentrations measured in the springs near the river courses under study (Figure 6) are in agreement with the latter range and with literature data (5.87 ± 0.64, 9.80 ± 3.50, and 3.4 ± 2 mg NO3–N L−1 for the Mincio, Oglio, and Adda springs, respectively) [82,83,84]. As hypothesized by Bartoli et al. [14], the spring belt zone in the Oglio River is a critical area for N contamination because, in this area, substantial recycling to the surface of the contaminated groundwater occurs, affecting the N content of the surface water. The outcomes of water and N mass budgets performed for the studied Adda, Oglio, and Mincio river reaches confirm that the NO3 diffuse concentration is due to groundwater inflow to the river course. The NO3 concentration of diffuse water inputs (NO3ds) is, in fact, comparable with that measured in springs located near the river course, an excellent proxy of groundwater chemical composition. The groundwater input to the river is higher in the Adda River reach compared that in the Oglio and Mincio river reaches. The groundwater input to the water flow at the downstream station is similar for the Adda and Oglio rivers (~63%), while it is lower for the Mincio River (~24%). The NO3 input from groundwater to river reaches affects the river water quality, representing about ~97%, ~84%, and ~68% of the downstream NO3 loads in the Adda, Oglio, and Mincio river reaches. It is also possible to highlight a geographical gradient, from east to west, which reflects the spring belt width. Although the groundwater input per km is lower for the Oglio than the Adda River, the NO3 loads input per km is highest in the Oglio River (283 kg N day−1 km−1). Instead, the Adda and Mincio river reaches receive about 254 kg N day−1 km−1 and 199 kg N day−1 km−1, respectively. This discrepancy is due to the higher water volume characterizing the Adda River watershed that likely imposes a dilution effect on NO3 concentrations, and to a different N surplus in the agricultural soil of the three studied portions.
Upscaling the groundwater input per km to the spring belt width of the three basins for the irrigation period, it is possible to estimate the role of water losses from irrigated soils in the context of diffuse groundwater input. In the Oglio and Mincio river portions, the ranges of groundwater input to rivers (139–171 and 52–221 × 106 m3 year−1, respectively) are comparable with the water losses due to excess water supply to crops and inefficient irrigation systems (180 and 79 × 106 m3 year−1, respectively). In the spring belt zone of the Adda River, the groundwater input to the river ranged between 430 and 615 × 106 m3 year−1, and exceeded by an order of magnitude the water losses due to excess water supply to crops and inefficient irrigation systems at the watershed level (87 × 106 m3 year−1). This outcome may be explained by the fact that the watershed area drained by the Adda River is double those of the areas drained by each of the Oglio and Mincio rivers. The same upscaling made for the N input from groundwater to river indicates an increase up to 1355, 1515, and 633 t N year−1. These loads represent about 10% of the N surplus in agricultural soil for all the studied watersheds.
Our results for the Oglio River basin confirm the findings of recent studies that estimated N loads from the aquifer to surface-spring to be about 1200 t year−1 (3280 kg day−1), and from the aquifer to river to be about 1500 t year−1 (4100 kg day−1) in the spring belt zone [14,72,83]. Taherisoudejani et al. [85] calculated a NO3 load in the range between 3800 and 6000 kg day−1 during the summers of 2009, 2010, and 2011, which would be similar to the N loads calculated in this study (Lds value). Delconte et al. [27] investigated the SW–GW interaction in the Oglio basin with a general mass balance approach and with end member mixing analysis, using also water and NO3 isotopes to estimate a total groundwater input of between 4 and 5 m3 s−1 (equivalent to 0.39 and 0.50 m3 s−1 km−1).
In this work, the integration of the open-channel technique with river and spring water samples allowed us to calculate the net increase of NO3 loads by means of a mass balance between the output and the input stations. This approach does not take into account processes such as primary producer uptake or microbial denitrification, which were measured, for example, in the Mincio River [73], but which were quantitatively small compared to the large NO3 increase due to SW–GW interactions. Furthermore, the calculated values of Lds, Qds, and NO3ds may be slightly underestimated, because the approach considers a homogeneous groundwater input along the river reaches, and because spring water is representative of groundwater chemistry. The method could be further improved by introducing conservative parameters such as chloride, sulfate, and isotopes, and of dissolved nitrates that make it possible to unequivocally characterize the origin of the water, and to recognize the main biological processes affecting nutrient concentrations (e.g., nitrification, denitrification, and assimilation) [27,40]. Experimental data on N exchange between ground and surface water are essential to improve numerical modelling that simulates, on different spatial and temporal scales, N processes and N input to rivers, and finally, to quantify how management actions will influence SW–GW interaction and river functioning [102,103,104]. In particular, the outcomes of the present work highlight a N legacy, due to a feedback loop between soil and water use, with irrigation acting as the driver of N transfer: N-poor water from rivers drains N-rich soil feeding groundwater, which, in turn, feeds the rivers downgradient, thereby increasing their N-loading. This is a key point for managing water and soils, because N legacy may make it impossible to achieve good water quality goals in the short-medium term, i.e., decades [101].

5. Conclusions

The three rivers examined in this study have common features: they are regulated, heavily exploited for irrigation, and cross and drain a very permeable area which is characterized by intensive agriculture, animal farming, and N excess. We provide a tentative interpretation of the water and N dynamics in these basins that are strongly dependent on the irrigation-driven alteration of the hydrological cycle and on inefficient N use. The presented data and evidence support the hypothesis that the steep NO3 increases in river water are due to the interaction of the rivers with NO3-polluted groundwater. In turn, NO3 accumulates in the groundwater due to organic and synthetic fertilizers in large excess to crop requirements, and the use of large amounts of water for traditional irrigation techniques such as flood irrigation. Such outcomes are specific for the three important sub-basins of the Po watershed, but may apply to an increasing number of watersheds in the world that will be devoted to intensive and irrigated agriculture and animal farming, resulting in diffuse N pollution. In the Adda, Oglio, and Mincio watersheds it seems urgent to find alternatives to the present practices, improving N optimization N and water use in agricultural areas. Altered water availability due to climate change will produce unpredictable effects on the presented N dynamics.

Author Contributions

Conceptualization, E.R., M.B.; methodology, E.R., M.B.; formal analysis, E.R., M.P., F.S. and S.Q.; investigation, E.R., M.P., F.S. and S.Q.; data curation, E.R., E.S. (Elisa Soana) and M.P.; writing—original draft preparation, E.R., M.B., M.P., E.S. (Elisa Soana), F.S. and S.Q.; writing—review and editing, E.S. (Elisa Sacchi), E.S. (Edoardo Severini), F.C., P.V. and M.B.; visualization, E.R.; supervision, M.B.; funding acquisition, M.B.

Funding

This research was funded by Oglio River Consortium. Erica Racchetti was supported from 2009 to 2015 by Oglio Consortium and from 2016 to 2019 by FONDAZIONE CARIPLO, grant number 2015-0263, project: “Squaring the cycle: the INTEgration of GROundwater processes in Nutrient budgets for a basin-oriented remediation strategy (INTEGRON)”.

Acknowledgments

We thank Massimo Buizza, director of the Oglio River Consortium, and Luigi Bertoli, director of Adda River Consortium, for gently providing discharge data.

Conflicts of Interest

The authors declare no conflict of interest. The funders had no role in the design of the study; in the collection, analyses, or interpretation of data; in the writing of the manuscript, or in the decision to publish the results.

References

  1. Galloway, J.N.; Townsend, A.R.; Erisman, J.W.; Bekunda, M.; Cai, Z.; Freney, J.R.; Martinelli, L.A.; Seizinger, S.P.; Sutton, M.A. Transformation of the Nitrogen cycle: Recent trends, questions and potential solutions. Science 2008, 320, 889–892. [Google Scholar] [CrossRef] [PubMed]
  2. Overeem, I.; Kettner, A.J.; Syvitski, J.P.M. 9.40 Impacts of Humans on River Fluxes and Morphology. In Treatise on Geomorphology; Shroder, J.F., Wohl, E., Eds.; Academic Press: Cambridge, MA, USA, 2013; pp. 828–842. [Google Scholar]
  3. Sutton, M.; Howard, C. The European Nitrogen Assessment; Cambridge University Press: Cambridge, UK, 2011. [Google Scholar]
  4. Barakata, M.; Cheviron, B.; Angulo-Jaramillo, R. Influence of the irrigation technique and strategies on the nitrogen cycle and budget: A review. Agric. Water Manag. 2016, 178, 225–238. [Google Scholar] [CrossRef]
  5. Van Grinsven, H.J.M.; Ward, M.H.; Benjamin, N.; De Kok, T.M. Does the evidence about health risks associated with nitrate ingestion warrant an increase of the nitrate standard for drinking water? Environ. Health 2006, 5, 26. [Google Scholar] [CrossRef] [PubMed]
  6. Rivett, M.O.; Buss, S.R.; Morgan, P.; Smith, J.W.N.; Bemment, C.D. Nitrate attenuation in groundwater: A review of biogeochemical controlling processes. Water Res. 2008, 42, 4215–4232. [Google Scholar] [CrossRef] [PubMed]
  7. Howarth, R.; Chan, F.; Conley, D.J.; Garnier, J.; Doney, S.C.; Marino, R.; Billen, G. Coupled biogeochemical cycles: Eutrophication and hypoxia in temperate estuaries and coastal marine ecosystems. Front. Ecol. Environ. 2011, 9, 18–26. [Google Scholar] [CrossRef]
  8. IPCC. Climate Change 2013: The Physical Science Basis. Contribution of Working Group I to the Fifth Assessment Report of the Intergovernmental Panel on Climate Change; Stocker, T.F., Qin, D., Plattner, G.-K., Tignor, M., Allen, S.K., Boschung, J., Nauels, A., Xia, Y., Bex, V., Midgley, P.M., Eds.; Cambridge University Press: Cambridge, UK; New York, NY, USA, 2013; p. 1535. [Google Scholar]
  9. Gómez, C.M.; Pérez-Blanco, C.D. Simple Myths and Basic Maths About Greening Irrigation. Water Resour. Manag. 2014, 28, 4035–4044. [Google Scholar] [CrossRef] [Green Version]
  10. Vörösmarty, C.J.; Sahagian, D. Anthropogenic disturbance of the terrestrial water cycle. Bioscience 2000, 50, 753–756. [Google Scholar] [CrossRef]
  11. European Commission. Directive 2000/60/EC of the European Parliament and of the Council of 23 October 2000 establishing a framework for Community action in the field of water policy. Off. J. Eur. Commun. 2000, 327, 22. [Google Scholar]
  12. European Commission. Directive 2006/118/EC of the European Parliament and of the Council of 12 December 2006 on the protection of groundwater against pollution and deterioration. Off. J. Eur. Commun. 2006, 372, 19. [Google Scholar]
  13. Lassaletta, L.; García-Gómez, H.; Gimeno, B.S.; Rovira, J.V. Agriculture-induced increase in nitrate concentrations in stream waters of a large Mediterranean catchment over 25 years (1981–2005). Sci. Total Environ. 2009, 407, 6034–6043. [Google Scholar] [CrossRef]
  14. Bartoli, M.; Racchetti, E.; Delconte, C.A.; Sacchi, E.; Soana, E.; Laini, A.; Longhi, D.; Viaroli, P. Nitrogen balance and fate in a heavily impacted watershed (Oglio River, Northern Italy): In quest of the missing sources and sinks. Biogeosciences 2012, 9, 361–373. [Google Scholar] [CrossRef]
  15. Mailhol, J.; Ruelle, P.; Nemeth, I. Impact of fertilisation practices on nitrogenleaching under irrigation. Irrig. Sci. 2001, 20, 139–147. [Google Scholar]
  16. Asadi, M.E.; Clemente, R.S.; Gupta, A.D.; Loof, R.; Hansen, G.K. Impacts of fertigation via sprinkler irrigation on nitrate leaching and corn yield in an acid—Sulphate soil in Thailand. Agric. Water Manag. 2002, 52, 197–213. [Google Scholar] [CrossRef]
  17. Darwish, T.; Atallah, T.; Hajhasan, S.; Chranek, A. Management of nitrogen by fertigation of potato in Lebanon. Nutr. Cycl. Agroecosyst. 2003, 67, 1–11. [Google Scholar] [CrossRef]
  18. Zotarelli, L.; Scholberg, J.M.; Dukes, M.D.; Muñoz-Carpena, R. Monitoring of nitrate leaching in Sandy soils. J. Environ. Qual. 2007, 36, 953–962. [Google Scholar] [CrossRef]
  19. Burguete, J.; Zapata, N.; García-Navarro, P.; Maïkaka, M.; Playán, E.; Murillo, J. Fertigation in furrows and level furrow systems. II: Field experiments, modelcalibration, and practical applications. J. Irrig. Drain. Eng. 2009, 135, 413–420. [Google Scholar] [CrossRef]
  20. Mubarak, I.; Mailhol, J.C.; Angulo-Jaramillo, R.; Bouarfa, S.; Ruelle, P. Effect oftemporal variability in soil hydraulic properties on simulated water transferunder high-frequency drip irrigation. Agric. Water Manag. 2009, 96, 1547–1559. [Google Scholar] [CrossRef]
  21. Zotarelli, L.; Dukes, M.D.; Muñoz-Carpena, R. Soil water distribution and nitrate leaching of drip irrigation controlled by soil moisture sensors. In Estudios en la Zona no Saturada del Suelo vol. IX; Silva, O., Carrera Ramírez, J., Eds.; Barcelona, 2009; Available online: https://abe.ufl.edu/faculty/carpena/zns/index_volumenes.shtml (accessed on 2 November 2019).
  22. Perego, A.; Basile, A.; Bonfante, A.; De Mascellis, R.; Terribile, F.; Brenna, S.; Acutis, M. Nitrate leaching undermaize cropping systems in Po Valley (Italy). Agric. Ecosyst. Environ. 2012, 147, 57–65. [Google Scholar] [CrossRef]
  23. Brunke, M.; Gonser, T. The ecological significance of exchange processes between rivers and groundwater. Freshwater Biol. 1997, 37, 1–33. [Google Scholar] [CrossRef] [Green Version]
  24. Sophocleous, M. Interactions between groundwater and surface water: The state of the science. Hydrogeol. J. 2002, 10, 52–67. [Google Scholar] [CrossRef]
  25. Negrela, P.; Petelet-Girauda, E.; Barbiera, J.; Gautier, E. Surface water–groundwater interactions in an alluvial plain: Chemical and isotopic systematics. J. Hydrol. 2003, 277, 248–267. [Google Scholar] [CrossRef]
  26. Fleckenstein, J.H.; Krause, S.; Hannah, D.M.; Boano, F. Groundwater-surface water interactions: New methods and models to improve understanding of processes and dynamics. Adv. Water Resour. 2010, 33, 1291–1295. [Google Scholar] [CrossRef]
  27. Delconte, C.A.; Sacchi, E.; Racchetti, E.; Bartoli, M.; Mas-Pla, J.; Re, V. Nitrogen inputs to a river course in a heavily impacted watershed: A combined hydrochemical and isotopic evaluation (Oglio River Basin, N Italy). Sci. Total Environ. 2014, 466, 924–938. [Google Scholar] [CrossRef]
  28. Menció, A.; Galan, M.; Boix, D.; Mas-Pla, J. Analysis of stream-aquifer relationships: A comparison between mass balance and Darcy’s law approaches. J. Hydrol. 2014, 517, 157–172. [Google Scholar] [CrossRef]
  29. Ravazzani, G.; Curti, D.; Gattinoni, P.; Della Valentina, S.; Fiorucci, A.; Rosso, R. Assessing Groundwater Contribution to Streamflow of a Large Alpine River with Heat Tracer Methods and Hydrological Modelling. River Res. Appl. 2016, 32, 871–884. [Google Scholar] [CrossRef]
  30. Ivkovic, K.M. A top–down approach to characterise aquifer–river interaction processes. J. Hydrol. 2009, 365, 145–155. [Google Scholar] [CrossRef]
  31. May, L.W. Groundwater Resources Sustainability: Past, Present, and Future. Water Resour. Manag. 2013, 27, 4409–4424. [Google Scholar]
  32. Pérez-Martín, M.A.; Estrela, T.; Andreu, J.; Ferrer, J. Modeling Water Resources and River-Aquifer Interaction in the Júcar River Basin, Spain. Water Resour. Manag. 2014, 28, 4337–4358. [Google Scholar] [CrossRef]
  33. Petitta, M.; Fracchiolla, D.; Aravena, R.; Barbieri, M. Application of isotopic and geochemical tools for the evaluation of nitrogen cycling in an agricultural basin, the Fucino Plain, Central Italy. J. Hydrol. 2009, 372, 124–135. [Google Scholar] [CrossRef]
  34. Reichard, J.S.; Brown, C.M. Detecting groundwater contamination of a river in Georgia, USA using baseflow sampling. Hydrogeol. J. 2009, 17, 735–747. [Google Scholar] [CrossRef]
  35. Ouyang, Y. Estimation of shallow groundwater discharge and nutrient load into a river. Ecol. Eng. 2012, 38, 101–104. [Google Scholar] [CrossRef]
  36. Caschetto, M.; Barbieri, M.; Galassi, D.M.P.; Mastrorillo, L.; Rusi, S.; Stoch, F.; Di Cioccio, A.; Petitta, M. Human alteration of groundwater-surface water interactions (Sagittario River, Central Italy): Implication for flow regime, contaminant fate and invertebrate response. Environ. Earth Sci. 2014, 71, 1791–1807. [Google Scholar] [CrossRef]
  37. Stellato, L.; Newman, B.D. Groundwater inputs to rivers: Hydrological, biogeochemical and ecological effects inferred by environmental isotopes. In Application of Isotope Techniques for Assessing Nutrient Dynamics in River Basins; IAEA-TECDOC-1695; International Atomic Energy Agency: Vienna, Austria, 2013; pp. 187–217. [Google Scholar]
  38. Nestler, A.; Berglund, M.; Accoe, F.; Duta, S.; Xue, D.; Boeckx, P.; Taylor, P. Isotopes for improved management of nitrate pollution in aqueous resources: Review of surface water field studies. Environ. Sci. Pollut. Res. 2011, 18, 519–533. [Google Scholar] [CrossRef] [PubMed]
  39. Saccon, P.; Leis, A.; Marca, A.; Kaiser, J.; Campisi, L.; Böttcher, M.E.; Savarino, J.; Escherd, P.; Eisenhauere, A.; Erblandc, J. Multi-isotope approach for the identification and characterisation of nitrate pollution sources in the Marano lagoon (Italy) and parts of its catchment area. Appl. Geochem. 2013, 34, 75–89. [Google Scholar] [CrossRef] [Green Version]
  40. Rotiroti, M.; Bonomi, T.; Sacchi, E.; McArthur, J.M.; Stefania, G.A.; Zanotti, C.; Taviani, S.; Patelli, M.; Nava, V.; Soler, V.; et al. The effects of irrigation on groundwater quality and quantity in a human-modified hydro-system: The Oglio River basin, Po Plain, northern Italy. Sci. Total Environ. 2019, 672, 342–356. [Google Scholar] [CrossRef] [PubMed]
  41. Sacchi, E.; Acutis, M.; Bartoli, M.; Brenna, S.; Delconte, C.A.; Laini, A.; Pennisi, M. Origin and fate of nitrates in groundwater from the central Po plain: Insights from isotopic investigations. Appl. Geochem. 2013, 34, 164–180. [Google Scholar] [CrossRef]
  42. Lombardy Region. Piano di Tutela Delle Acque 2016 (Water Protection Plan). Available online: https://www.regione.lombardia.it/wps/portal/istituzionale/HP/DettaglioRedazionale/servizi-e-informazioni/Enti-e-Operatori/territorio/governo-delle-acque/piano-tutela-acque-pta-2016/piano-tutela-acque-pta-2016 (accessed on 9 October 2019).
  43. European Commission. Commission Implementing Decision 2011/721/EU of 3 November 2011 on Granting a Derogation Requested by Italy with Regard to the Regions of Emilia Romagna, Lombardia, Piemonte and Veneto pursuant to Council Directive 91/676/EEC concerning the Protection of Waters Against Pollution Caused by Nitrates from Agricultural Sources. 2011, p. 36. Available online: https://eur-lex.europa.eu/legal-content/EN/TXT/?uri=CELEX%3A32011D0721 (accessed on 2 November 2019).
  44. European Commission. Commission Implementing Decision (EU) 2016/1040 of 24 June 2016 on Granting a Derogation Requested by Italian Republic with Regard to the Regions of Lombardia and Piemonte Pursuant to Council Directive 91/676/EEC concerning the Protection of Waters Against Pollution Caused by Nitrates from Agricultural Sources. 2016, p. 6. Available online: https://eur-lex.europa.eu/legal-content/EN/TXT/?uri=uriserv:OJ.L_.2016.169.01.0006.01.ENG&toc=OJ:L:2016:169:TOC (accessed on 2 November 2019).
  45. Facchi, A.; Ortuani, B.; Maggi, D.; Gandolfi, C. Coupled SVAT–groundwater model for water resources simulation in irrigated alluvial plains. Environ. Model. Softw. 2004, 19, 1053–1063. [Google Scholar] [CrossRef]
  46. Gandolfi, C.; Facchi, A.; Maggi, D. Comparison of 1D models of water flow in unsaturated soils. Environ. Model. Softw. 2006, 21, 1759–1764. [Google Scholar] [CrossRef]
  47. Vassena, C.; Rienzner, M.; Ponzini, G.; Giudici, M.; Gandolfi, C.; Durante, C.; Agostani, D. Modeling water resources of a highly irrigated alluvial plain (Italy): Calibrating soil and groundwater models. Hydrogeol. J. 2012, 20, 449–467. [Google Scholar] [CrossRef]
  48. Di, H.J.; Cameron, K.C. Nitrate leaching in temperate agroecosystems: Sources, factors and mitigating strategies. Nutr. Cycl. Agroecosyst. 2002, 64, 237–256. [Google Scholar] [CrossRef]
  49. Gandolfi, C. ACQUA E IRRIGAZIONE PER NUTRIRE IL PIANETA. LA REALTÀ DELLA PIANURA PADANA LOMBARDA. Ist. Lomb. Accad. Sci. E Lett. Incontr. Stud. 2017, 51–66. [Google Scholar] [CrossRef]
  50. IRSA-CNR. Indagine Sulle Falde Acquifere Profonde Della Pianura Padana; Quaderni IRSA-CNR 51/2; CNR: Roma, Italy, 1982; pp. 1–70. [Google Scholar]
  51. Carcano, C.; Piccin, A. Geologia Degli Acquiferi Padani della Regione Lombardia; Regione Lombardia and ENI Divisione AGIP: Firenze, Italy, 2002. [Google Scholar]
  52. Hijmans, R.J.; Cameron, S.E.; Parra, J.L.; Jones, P.G.; Jarvis, A. Very high resolution interpolated climate surfaces for global land areas. Int. J. Climatol. 2005, 25, 1965–1978. [Google Scholar] [CrossRef]
  53. Gardi, C.; Panagos, P.; Hiederer, R.; Montanarella, L.; Micale, F. Report on the Activities Realized Within the Service Level Agreement between JRC and EFSA, as a Support of the FATE and ECOREGION Working Groups of EFSA PPR (SLA/EFSA-JRC/2008/01): Final Report of 15th December 2010; JRC-IES scientific and technical report: EUR 24744 EN; European Union: Luxembourg, 2011; ISBN 978-92-79-19521-1. [Google Scholar] [CrossRef]
  54. ERSAL. Basi Ambientali Della Pianura—Servizio di Mappa (ArcIMS)—Rilevanze Naturalistiche e Paesaggistiche. Banca Dati Superficiale (Fontanili), ERSAL. 1998. Available online: http://www.cartografia.regione.lombardia.it/geoportale (accessed on 9 October 2019).
  55. Università degli Studi di Milano and U.R.B.I.M. Lombardia. Tutela e Valorizzazione Dei Fontanili Del Territorio Lombardo FonTe. Quaderno Della Ricerca n. 144; Università degli Studi di Milano and U.R.B.I.M: Milano, Italy, 2012; p. 98. [Google Scholar]
  56. Burrato, P.; Ciucci, F.; Valensise, G. An inventory of river anomalies in the Po Plain, Northern Italy: Evidence for active blind thrust faulting. Ann. Geophys. 2003, 46, 865–882. [Google Scholar]
  57. Pellegrini, L.; Vercesi, P.L. I geositi della Provincia di Pavia; Luigi Ponzio e Figli Editore: Pavia, Italy, 2005. [Google Scholar]
  58. De Luca, D.A.; Destefanis, E.; Forno, M.G.; Lasagna, M.; Masciocco, L. The genesis and the hydrogeological features of the Turin Po Plain fontanili, typical lowland springs in Northern Italy. Bull. Eng. Geol. Environ. 2014, 73, 409–427. [Google Scholar] [CrossRef]
  59. Eupolislombardia. Progetto di Accompagnamento a Supporto Del Processo di Revisione Del Piano di Tutela Delle Acque. Attività di Approfondimento Specialistico Relativo ai Corpi Idrici Sotterranei (Cod. Éupolis Lombardia Ter13016/001). Relazione di sintesi; Éupolis Lombardia: Milano, Italy, 2015; p. 24. [Google Scholar]
  60. Copernicus Europe’s Eyes on the Earth. Corine Land Cover. 2006. Available online: https://land.copernicus.eu/pan-european/corine-land-cover (accessed on 9 October 2019).
  61. Geoportale Regione Lombardia. Carta Geologica 250,000 del 1990, Mappa Digitale (Arcgis9.x). Available online: www.geoportale.regione.lombardia.it/metadati?p_p_id=PublishedMetadata_WAR_geoportalemetadataportlet&p_p_lifecycle=0&p_p_state=maximized&p_p_state=view&_PublishedMetadata_WAR_geoportalemetadataportlet_view=editPublishedMetadata&_PublishedMetadata_WAR_geoportalemetadataportlet_uuid=%7B018208BD-AD82-4D2A-B195-548D6F3432B4%7D&_PublishedMetadata_WAR_geoportalemetadataportlet_editType=view&_PublishedMetadata_WAR_geoportalemetadataportlet_fromAsset=true&rid=local (accessed on 9 October 2019).
  62. National Statistics Institution, 6th Agricultural Census. 2010. Available online: http://dati-censimentoagricoltura.istat.it (accessed on 9 October 2019).
  63. Enti Regolatori dei Grandi Laghi. Available online: http://www.laghi.net (accessed on 9 October 2019).
  64. Regione Lombardia. Sperimentazione del Deflusso Minimo Vitale (DMV). Available online: https://www.regione.lombardia.it/wps/portal/istituzionale/HP/DettaglioRedazionale/servizi-e-informazioni/Enti-e-Operatori/territorio/governo-delle-acque/deflusso-minimo-vitale/sperimentazione-deflusso-minimo-vitale (accessed on 9 October 2019).
  65. D.G.R. Emilia Romagna n. 1415/2016. Definizione Dei Fabbisogni Irrigui per Coltura, ai Sensi Del D.M. 31 Luglio 2015 “Approvazione Delle Linee Guida per la Regolamentazione da Parte Delle Regioni Delle Modalità di Quantificazione Dei Volumi Idrici ad Uso Irriguo. 2015. Available online: https://bur.regione.emilia-romagna.it/dettaglio-inserzione?i=05e6e223fb954aa4a44ca7fd30d4ec4e (accessed on 2 November 2019).
  66. Allen, R.G.; Pereira, L.S.; Raes, D.; Smith, M. Crop evapotranspiration-Guidelines for computing crop water requirements-FAO Irrigation and drainage paper 56. FAO Rome 1998, 300, D05109. [Google Scholar]
  67. Joint Research Centre. European Soil Data Centre (ESDAC). Available online: http://eusoils.jrc.ec.europa.eu/library/Data/EFSA/ (accessed on 9 October 2019).
  68. EMEP-Co-operative Programme for Monitoring and Evaluation of the Long-range Transmission of Air pollutants in Europe. Available online: http://www.emep.int (accessed on 9 October 2019).
  69. Oenema, O.; Kros, H.; De Vries, W. Approaches and Uncertainties in Nutrient Budgets: Implications for Nutrient Management and Environmental Policies. Eur. J. Agron. 2003, 20, 3–16. [Google Scholar] [CrossRef]
  70. De Vries, W.; Leip, A.; Reinds, G.J.; Kros, J.; Lesschen, J.P.; Bouwman, A.F. Comparison of land nitrogen budgets for European agriculture by various modeling approaches. Environ. Pollut. 2011, 159, 3254–3268. [Google Scholar] [CrossRef]
  71. Lassaletta, L.; Romero, E.; Billen, G.; Garnier, J.; García-Gómez, H.; Rovira, J.V. Spatialized N budgets in a large agricultural Mediterranean watershed: High loading and low transfer. Biogeosciences 2012, 9, 57–70. [Google Scholar] [CrossRef]
  72. Soana, E.; Racchetti, E.; Laini, A.; Bartoli, M.; Viaroli, P. Soil Budget, Net Export, and Potential Sinks of Nitrogen in the Lower Oglio River Watershed (Northern Italy). Clean Soil Air Water 2011, 39, 956–965. [Google Scholar] [CrossRef]
  73. Pinardi, M.; Soana, E.; Laini, A.; Bresciani, M.; Bartoli, M. Soil system budgets of N, Si and P in an agricultural irrigated watershed: Surplus, differential export and underlying mechanisms. Biogeochemistry 2018, 140, 175–197. [Google Scholar] [CrossRef]
  74. Izagirre, O.; Agirre, U.; Bermejo, M.; Pozo, J.; Elosegi, A. Environmental controls of whole-stream metabolism identified from continuous monitoring of Basque streams. J. N. Am. Benthol. Soc. 2008, 27, 252–268. [Google Scholar] [CrossRef]
  75. Rodier, J. L’analyse de L’eau; Dunod: Paris, France, 1978; p. 1136. [Google Scholar]
  76. American Public Health Association (APHA). Standard Methods for the Examination of Water and Wastewaters, 20th ed.; APHA: Washington, DC, USA, 1998. [Google Scholar]
  77. Millennium Ecosystem Assessment. Ecosystems and Human Well Being: Synthesis; Island Press: Washington, DC, USA, 2005; p. 160. [Google Scholar]
  78. D.d.s. Regione Lombardia n. 4346 del 27/03/2018. Approvazione Della «Metodologia di Stima Dei Volumi Idrici ad Uso Irriguo, in Attuazione Della d.g.r. n. 6035/2016. Available online: https://www.regione.lombardia.it/wps/wcm/connect/8f7c5df8-e897-47b7-b5fd-62c541b9bc67/decreto-4346-2018-metodologia-stima-volumi-idrici-uso-irriguo.pdf?MOD=AJPERES&CACHEID=8f7c5df8-e897-47b7-b5fd-62c541b9bc67 (accessed on 2 November 2019).
  79. Lasagna, M.; De Luca, D.A.; Franchino, E. Nitrate contamination of groundwater in the western Po Plain (Italy): The effects of groundwater and surface water interactions. Environ. Earth Sci. 2016, 75, 240. [Google Scholar] [CrossRef]
  80. Balderacchi, M.; Perego, A.; Lazzari, G.; Muñoz-Carpena, R.; Acutis, M.; Laini, A.; Giussani, A.; Sanna, M.; Kane, D.; Trevisan, M. Avoiding social traps in the ecosystem stewardship: The Italian Fontanile lowland spring. Sci. Total Environ. 2016, 539, 526–535. [Google Scholar] [CrossRef] [PubMed]
  81. Fumagalli, N.; Senes, G.; Ferrario, P.S.; Toccolini, A. A minimum indicator set for assessing fontanili (lowland springs) of the Lombardy Region in Italy. Eur. Ctry. 2017, 9, 1–16. [Google Scholar] [CrossRef] [Green Version]
  82. ISLC. Certificato di Analisi DELL’ACQUA Delle Sorgenti Bressanello e S. Antonio Dell’istituto Superiore Lattiero Caseario (Protocollo n°1766, Mantova 18/10/1996); Regione Lombardia: Mantova, Italy, 1996. [Google Scholar]
  83. Laini, A.; Bartoli, M.; Castaldi, S.; Viaroli, P.; Capri, E.; Trevisan, M. Greenhouse gases (CO2, CH4 and N2O) in lowland springs within an agricultural impacted watershed (Po River Plain, northern Italy). Chem. Ecol. 2011, 27, 177–187. [Google Scholar] [CrossRef]
  84. Arpa Lombardia. Dati e Indicatori. Available online: https://www.arpalombardia.it/Pages/Ricerca-Dati-ed-Indicatori.aspx (accessed on 7 October 2017).
  85. Taherisoudejani, H.; Racchetti, E.; Celico, F.; Bartoli, M. Application of QUAL2Kw to the Oglio River (Northern Italy) to assess diffuse N pollution via river-groundwater interaction. J. Limnol. 2018, 77, 452–465. [Google Scholar] [CrossRef]
  86. Viaroli, P.; Soana, E.; Pecora, S.; Laini, A.; Naldi, M.; Fano, E.A.; Nizzoli, D. Space and time variations of watershed N and P budgets and their relationships with reactive N and P loadings in a heavily impacted river basin (Po river, Northern Italy). Sci. Total Environ. 2018, 639, 1574–1587. [Google Scholar] [CrossRef]
  87. Hou, Y.; Ma, L.; Sárdi, K.; Sisák, I.; Ma, W. Nitrogen flows in the food production chain of Hungary over the period 1961–2010. Nutr. Cycl. Agroecosyst. 2015, 102, 335–346. [Google Scholar] [CrossRef]
  88. Sobota, D.J.; Harrison, J.A.; Dahlgren, R.A. Influences of climate, hydrology, and land use on input and export of nitrogen in California watersheds. Biogeochemistry 2009, 94, 43–62. [Google Scholar] [CrossRef]
  89. Poisvert, C.; Curie, F.; Moatar, F. Annual agricultural N surplus in France over a 70-year period. Nutr. Cycl. Agroecosyst. 2017, 107, 63–78. [Google Scholar] [CrossRef]
  90. Vagstad, N.; Stålnacke, P.; Andersen, H.-E.; Deelstra, J.; Jansons, V.; Kyllmar, K.; Loigu, E.; Rekolainen, S.; Tumas, R. Regional variations in diffuse nitrogen losses from agriculture in the Nordic and Baltic regions. Hydrol. Earth Syst. Sci. 2004, 8, 651–662. [Google Scholar] [CrossRef]
  91. Carmo, M.; García-Ruiz, R.; Ferreira, M.I.; Domingos, T. The NPK soil nutrient balance of Portuguese cropland in the 1950s: The transition from organic to chemical fertilization. Sci. Rep. 2017, 7, 8111. [Google Scholar] [CrossRef] [PubMed]
  92. Lassaletta, L.; Billen, G.; Garnier, J.; Bouwman, L.; Velazquez, E.; Mueller, N.D.; Gerber, J.S. Nitrogen use in the global food system: Past trends and future trajectories of agronomic performance, pollution, trade, and dietary demand. Environ. Res. Lett. 2016, 11, 095007. [Google Scholar] [CrossRef]
  93. Schröder, J.J.; Scholefield, D.; Cabral, F.; Hofman, G. The effects of nutrient losses from agriculture on ground and surface water quality: The position of science in developing indicators for regulation. Environ. Sci. Policy 2004, 7, 15–23. [Google Scholar] [CrossRef]
  94. Liu, C.; Watanabe, M.; Wang, Q. Changes in nitrogen budgets and nitrogen use efficiency in the agroecosystems of the Changjiang River basin between 1980 and 2000. Nutr. Cycl. Agroecosyst. 2008, 80, 19–37. [Google Scholar] [CrossRef]
  95. D.M. 19/04/1999. Codex of Good Agricultural Practice (GAP). 1999. Available online: https://www.gazzettaufficiale.it/eli/id/1999/05/04/099A3435/sg (accessed on 2 November 2019).
  96. Diez, J.A.; Roman, R.; Caballero, R.; Caballero, A. Nitrate leaching from soils under a maize-wheat-maize sequence, two irrigation schedules and three types of fertilisers. Agric. Ecosyst. Environ. 1997, 65, 189–199. [Google Scholar] [CrossRef] [Green Version]
  97. Gheysari, M.; Mirlatifi, S.M.; Homaee, M.; Asadi, M.E.; Hoogenboom, G. Nitrate leaching in a silage maize field under different irrigation and nitrogen fertilizer rates. Agric. Water Manag. 2009, 96, 946–954. [Google Scholar] [CrossRef]
  98. Kurunc, A.; Ersahinb, S.; Yetgin Uz, B.; Sonmez, N.K.; Uz, I.; Kamana, H.; Bacalana, G.E.; Emekli, Y. Identification of nitrate leaching hot spots in a large area with contrasting soil texture and management. Agric. Water Manag. 2011, 98, 1013–1019. [Google Scholar] [CrossRef]
  99. Martinelli, G.; Dadomo, A.; De Luca, D.A.; Mazzola, M.; Lasagna, M.; Pennisi, M.; Pilla, G.; Sacchi, E.; Saccon, P. Nitrate sources, accumulation and reduction in groundwater from Northern Italy: Insights provided by a nitrate and boron isotopic database. Appl. Geochem. 2018, 91, 23–35. [Google Scholar] [CrossRef]
  100. Ascott, M.J.; Gooddy, D.C.; Wang, L.; Stuart, M.E.; Lewis, M.A.; Ward, R.S.; Binley, A.M. Global patterns of nitrate storage in the vadose zone. Nat. Commun. 2017, 8, 1416. [Google Scholar] [CrossRef]
  101. Van Meter, J.K.; Basu, N.B.; Veenstra, J.J.; Burras, C.L. The nitrogen legacy: Emerging evidence of nitrogen accunulation in anthropogenic landscapes. Environ. Res. Lett. 2016, 11, 035014. [Google Scholar] [CrossRef]
  102. Mastrocicco, M.; Colombani, N.; Castaldelli, G.; Jovanovic, N. Monitoring and modeling nitrate persistence in a shallow aquifer. Water Air Soil Pollut. 2011, 217, 83–93. [Google Scholar] [CrossRef]
  103. Narula, K.K.; Gosain, A.K. Modeling hydrology, groundwater recharge and non-point nitrate loadings in the Himalayan Upper Yamuna basin. Sci. Total Environ. 2013, 468, S102–S116. [Google Scholar] [CrossRef] [PubMed]
  104. Kløve, B.; Ala-Aho, P.; Bertrand, G.; Gurdak, J.J.; Kupfersberger, H.; Kværner, J.; Muotka, T.; Mykrä, H.; Preda, E.; Rossi, P.; et al. Climate change impacts on groundwater and dependent ecosystems. J. Hydrol. 2014, 518, 250–266. [Google Scholar] [CrossRef]
Figure 1. Oglio and Mincio sub-basins of the Po watershed, northern Italy, with the spring belt area indicated in grey (a) Lower panels report the studied reaches, corresponding to the initial 70, 60, and 40 km of the three rivers, respectively (b) N mass budgets were performed with repeated flow measurements and water analyses at IN and OUT stations.
Water 11 02304 g001
Figure 2. Land use according to the Corine Land Cover 2006 (a) and geological map (b) of the Adda, Oglio, and Mincio basins. Data source: [60,61].
Water 11 02304 g002
Figure 3. Monthly precipitation in the Adda, Oglio, and Mincio watershed portions considered in the present study. Average values (± standard deviation) of the period 1960–1990 are reported. Data source: [52,53].
Water 11 02304 g003
Figure 4. Left panels indicate the theoretical discharge at Km 0 and along the river course for each river during the irrigation period, from the dam to the southernmost extreme of the spring belt area (a,c,e). Dashed black arrows are water inputs, while continuous black arrows are artificial canals with the permitted water abstraction (m3 s−1) indicated. Wavy dashed lines represent hypothesized diffuse water inputs to rivers, within the spring belt area (Figure 1). Right panels report flow data from experimental studies in the years 2006–2014 during the irrigation and non-irrigation period (b,d,f). The water abstractions in panels 4a,c,e are numbered as follows: for the Adda River 1A, 2A, and from 4A to 9A (Canale Pasinetti, Naviglio Martesana, Roggia Vailata, Roggia Cremasca, Roggia Pandina, Roggia Rivoltana, Canale Muzza, and Canale Vacchelli), the water inputs are 3A Brembo River and 10A Scolmatore Belgiardino; for the Oglio River from 1O to 19O (Roggia Fusia, Franciacorta, Media Pianura Bergamasca, Roggia Vetra, Roggia Castrina, Roggia Sale, Roggia Trenzana, Roggia Baiona, Roggia Vescovada, Roggia Castellana, Roggia Donna, Naviglio Civico, Roggia Antegnata, Roggia Molina, Roggia Calciana, Naviglio Grande Pallavicino, Roggia Molinara, Cavo di Suppeditazione, and Roggia Conte), and for the Mincio River from 1M to 6M (Seriola Prevaldesca, Canale Virgilio, Fossa di Pozzolo, Cavo Bertone, Cavo Isola, and Naviglio di Goito).
Water 11 02304 g004
Figure 5. The image on the left shows the three river reaches, from their origins to the southern portion of the spring belt area. From the top to the bottom the Adda, Oglio, and Mincio rivers are reported. The horizontal lines roughly indicate the width of the spring belt area which is crossed by the three rivers, while white dots indicate all counted springs. The graphs show the upstream–downstream variation of NO3 concentration and electrical conductivity along the considered stretches in the irrigation and non-irrigation periods. Data are reported as boxplots, as they include multiple observations in different years (2006–2014). Vertical lines in each graph represent, for a given study area, the average NO3 concentration and specific conductivity of Lakes Como, Iseo, and Garda (on the left) and of the river adjacent springs (on the right).
Water 11 02304 g005
Figure 6. Nitrate and water budgets for the three reaches of Adda, Oglio, and Mincio rivers crossing the spring belt. Summer N budget were performed for the 18 km long Adda River reach (a), the 19 km long Oglio River reach (b), and the 8 km long Mincio river reach (c). River discharge (Q) and the nitrate concentration (NO3–N) are reported for the reach extremes (IN and OUT), while the discharge (Q) and the N load (L) are indicated for irrigation abstractions (id), point sources (ps), and diffuse sources (ds). From the nitrate and the water budgets, it was possible to estimate the NO3 concentrations of the diffuse inputs (NO3ds), which were compared to the NO3 concentrations in spring water from the measured data.
Water 11 02304 g006
Table 1. Physical features of the Adda, Oglio, and Mincio watersheds and delimitation of the portion of the watersheds which are the object of this study.
FeaturesStudy Area
RiverAddaOglio Mincio
Alpine lake (river water origin)ComoIseoGarda
Dam regulating lake outflow (river origin km 0)OlginateSarnicoMonzambano
Watershed area (km2)34003840850
River length (km)13015675
Portion of watersheds studied: from lake dams, i.e., km 0, to the southernmost extreme of the spring belt area (km2)25532200650
Length of studied river stretch: from dam to southernmost extreme of spring belt area (from km up to km)0–700–600–40
Studied river stretch crossing the spring belt area (from km up to km)35–7025–6018–40
Studied river segment falling within the studied river stretch crossing the spring belt area (from km up to km)46–6431–5018–26
Table 2. Data on farming and irrigation practices in the studied portions of the three basins. Data source: [62].
Portion of WatershedsAddaOglioMincio
Inhabitants1,140,0001,000,000144,000
Utilized agricultural area (UAA, % of total basin area)324570
Number of cows 179,000360,000110,000
Number of pigs360,0001,100,000440,000
Main crops (% of UAA)
maize224030
wheat6610
feed crops212827
meadows421410
Table 3. Summary of irrigation practices in the portions of three basins (Adda, Oglio, and Mincio) object of this study. Data source: [62].
Irrigation DataAddaOglioMincio
Water volume used for irrigation (×106 m3 year−1) 161277149
Water volume provided by surface water (aqueduct, irrigation consortium) (%)878496
Water volume provided by groundwater (%)13164
Irrigated surface (km2)466785405
Area irrigated by flooding (%)878842
Area irrigated by sprinkler (%)121152
Area irrigated by other methods (%) 216
Table 4. Water supply to maize, feed crops, and meadows in the study area (Adda, Oglio, and Mincio watershed portion). Data source: [62].
Water Supply (m3 ha−1)MaizeFeed CropsMeadows
Adda 2419 ± 13112303 ± 13402453 ± 1308
Oglio 3390 ± 6773188 ± 5673290 ± 703
Mincio 3649 ± 8523376 ± 7103706 ± 973
Table 5. Nitrogen input, output, and surplus are reported in terms of total loads (t N year−1) and areal loads (kg N ha−1 UAA year−1) in the portions of the three basins (Adda, Oglio, and Mincio) object of this study. Data source: [62]. Total input, total output and surplus are reported in bold.
N BudgetAddaOglio Mincio
t N year−1t N year−1t N year−1
INPUT
Livestock manure14,42826,8269831
Synthetic fertilizers719411,3343211
Biological fixation580954383592
Atmospheric deposition668793388
Σ input28,09944,39117,022
OUTPUT
Crop uptake11,12315,7317551
NH3 volatilization337959131976
Denitrification in agricultural soils216238161304
Σ output16,66325,46010,832
Σinput − Σoutput11,43518,9316190
kg N ha−1 year−1kg N ha−1 year −1kg N ha−1 year −1
INPUT341454374
OUTPUT202260238
SURPLUS139193136

