Activated Carbon and the Principal Mineral Constituents of a Natural Soil in the Presence of Carbamazepine

BRGM, Water, Environment, Process Development and Analysis Division 3, Avenue C. Guillemin, 45060 Orleans, CEDEX 2, France
Water 2019, 11(11), 2290; https://doi.org/10.3390/w11112290
Submission received: 30 September 2019
/
Revised: 29 October 2019
/
Accepted: 29 October 2019
/
Published: 31 October 2019
(This article belongs to the Special Issue Advances in Water and Wastewater Monitoring and Treatment Technology)
Abstract
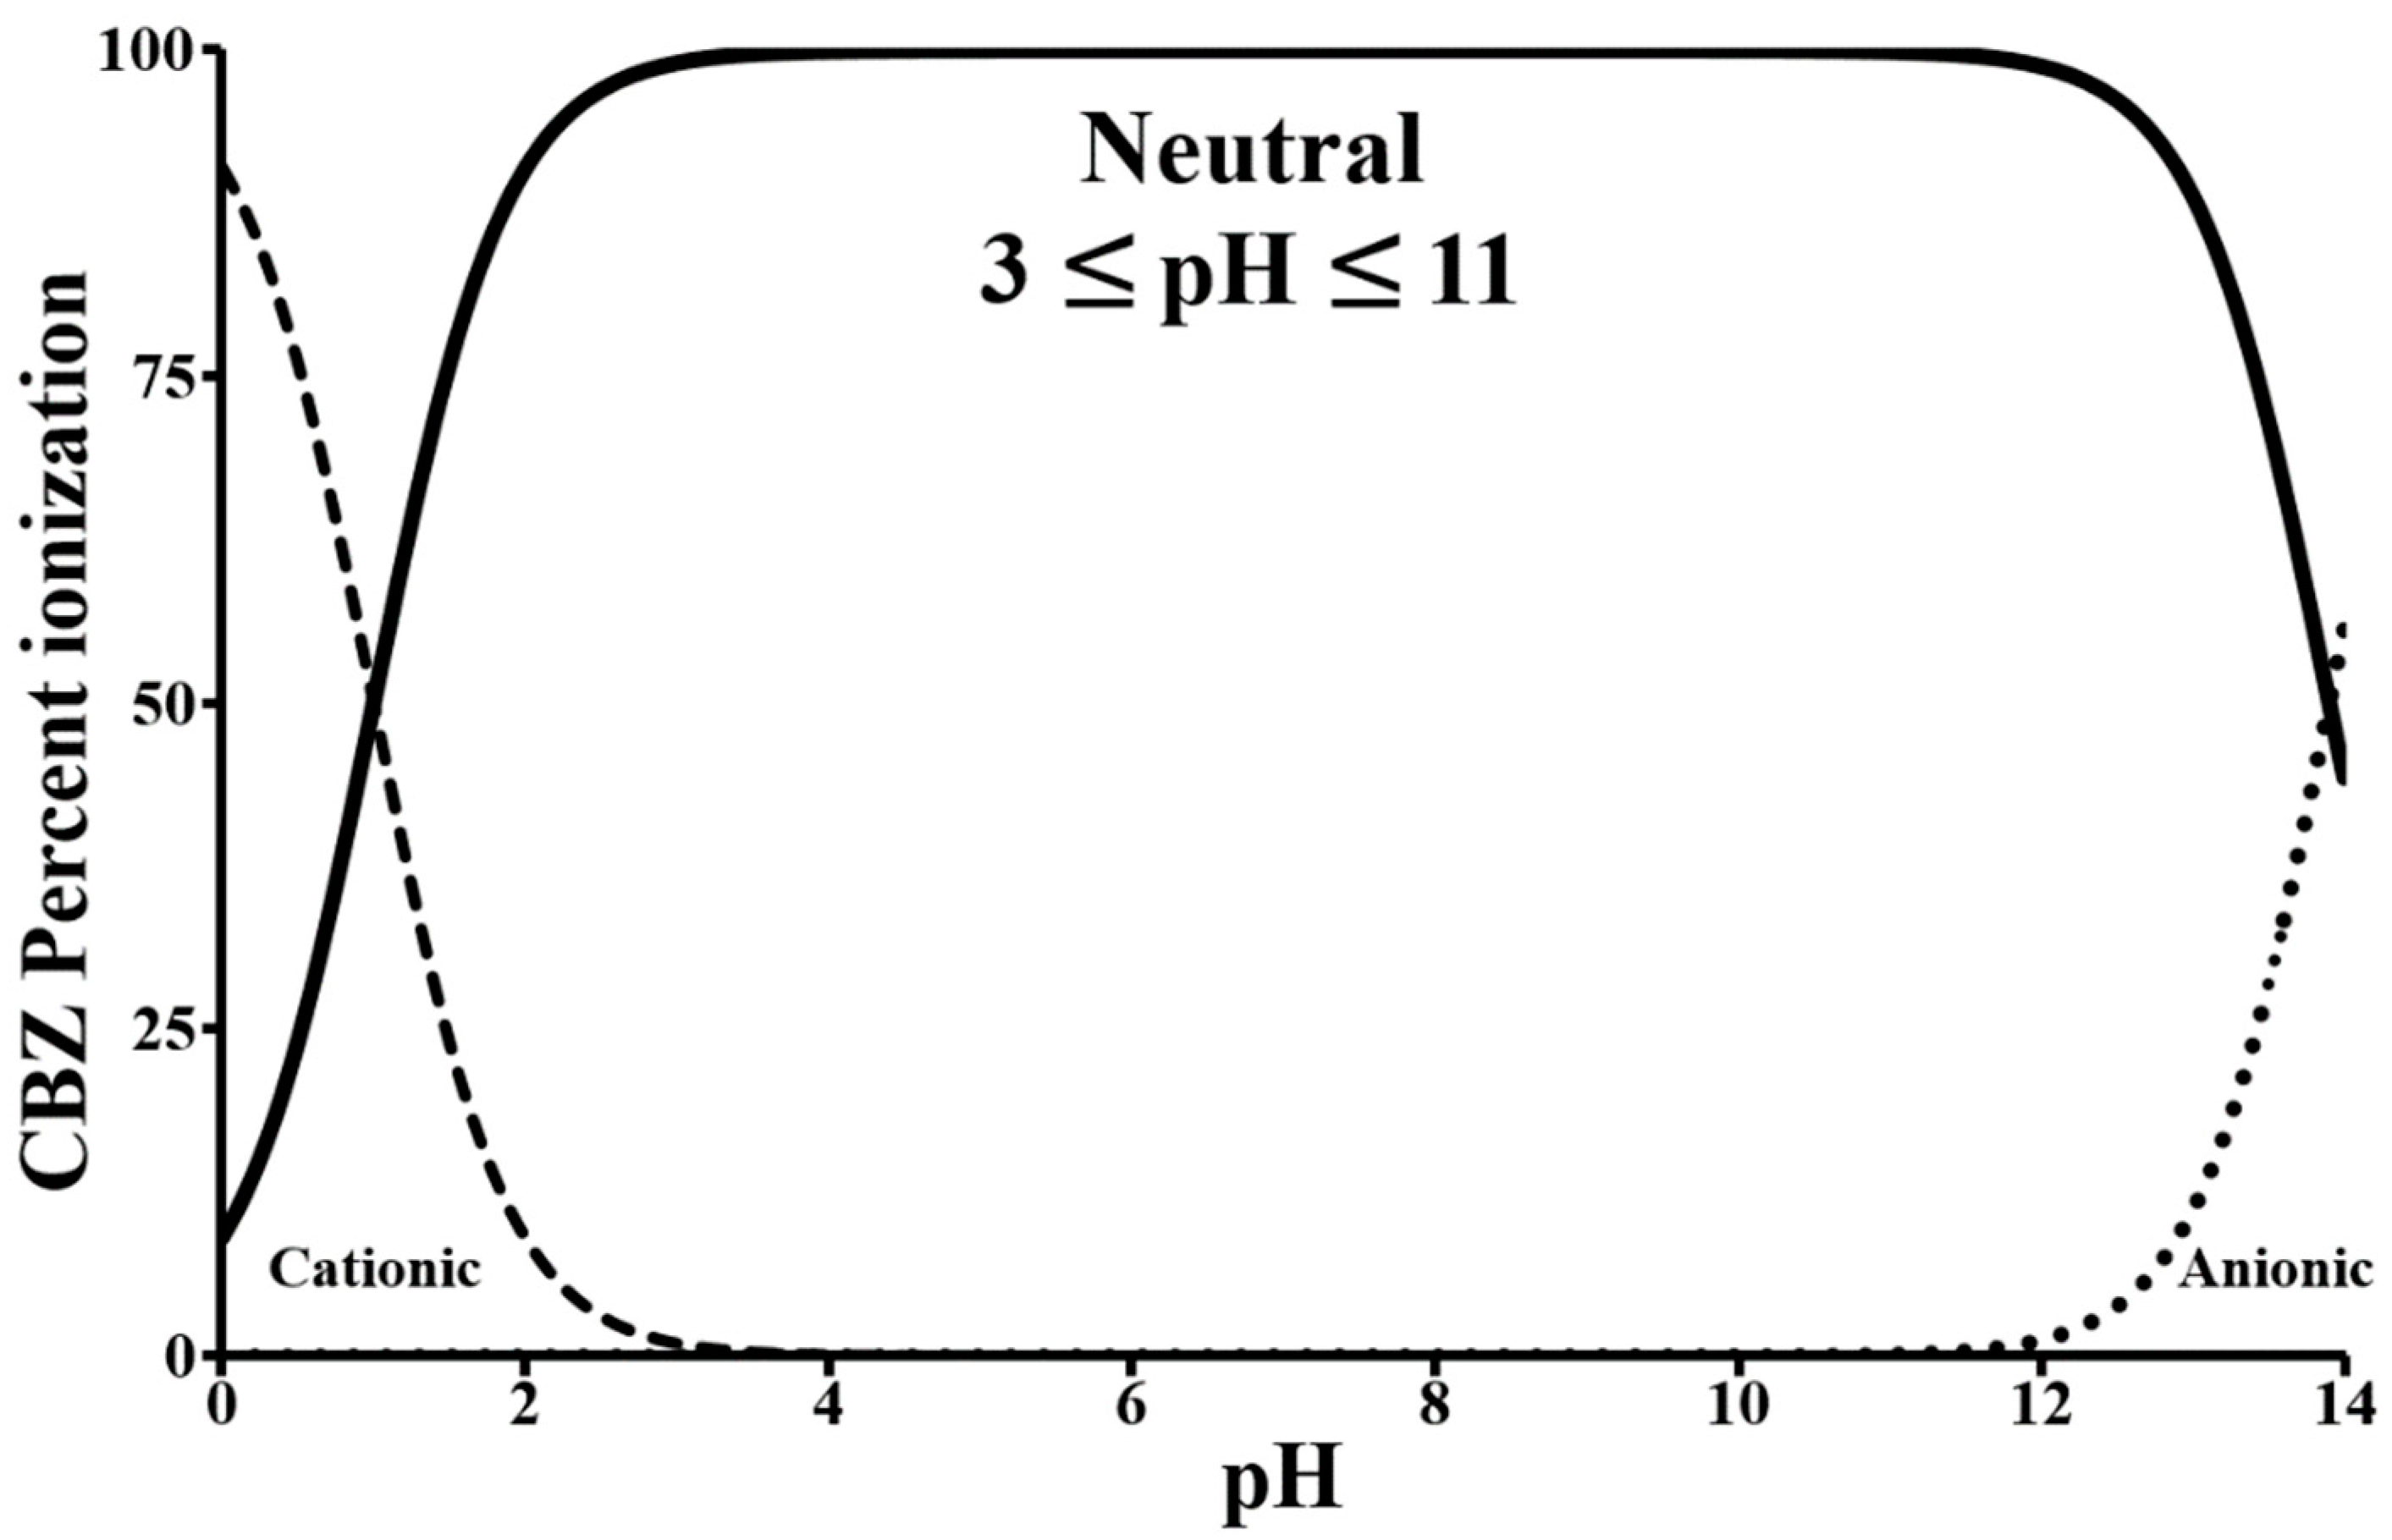
:The presence of pharmaceutical residues in the different aquatic compartments is a major environmental issue. Carbamazepine (CBZ), a heterocyclic antiepileptic, which is neutral between pH 3 and 11, is known to resist biodegradation. Its elimination in wastewater treatment plants is below 20% regardless of the primary and/or secondary treatments currently implemented. Its presence in groundwater raises questions about soil permeability in relation to this molecule. In order to provide meaningful answers, the CBZ adsorption performances of the principal mineral constituents of a natural soil (alumina, quartz, goethite, haematite, kaolinite, montmorillonite, and a saponin stevensite) and of an industrial activated carbon were assessed. Prior to the batch adsorption tests, the texture, mineralogy, and zero point of charge of these products were determined. X-ray diffraction (XRD) and UV-visible spectrometry were used to characterize the CBZ used. With the exception of stevensite, these minerals did not adsorb CBZ. However, stevensite’s affinity for CBZ remained very low compared to that of activated carbon (235 mg/g, tap water), which proved to be the most appropriate product for eliminating CBZ. The π−π, CH−π, and hydrogen bonds are the basis for the interactions established between CBZ and activated carbon, and their combination increases the overall adsorption efficiency.

1. Introduction
Today, environmental contamination by pharmaceutical micropollutants is a well-established fact. This contamination, which has been known about for several decades [1,2], is currently a major concern across the globe. It represents a real scientific challenge in terms of ecotoxicity, public health, soil pollution, as well as drinking water and wastewater management strategies. The presence of pharmaceutical products in the environment can be caused by their manufacture, formulation, distribution, use or disposal. When medication is consumed, it is metabolized in proportions ranging from 10% to 90%. A non-negligible quantity of active ingredient is therefore excreted, mainly in urine, and enters wastewater in urban areas, or is directly released into the environment in the case of livestock farms. Various studies have confirmed the presence of a large number of medicinal substances in all the environmental compartments: surface waters, soil, sediment, and groundwater [1,2,3,4]. According to the type of medicinal substance and the different water categories, the concentrations found will vary within a bracket ranging from one nanogram per liter in fresh or marine surface waters, groundwater and, water intended for human consumption, up to a microgram, or even several hundred micrograms per liter in effluents and residuary waters, with spatio-temporal variations depending on human activities [5,6]. Several authors have found pharmaceutical molecules in drinking water [1,7].
These residues from pharmaceutical products can therefore present a non-negligible environment risk, as can their metabolites or degradation by-products, which are sometimes more dangerous than the original product [1,8,9].
Wastewater treatment plants (WWTPs) have been identified as the main channel through which pharmaceutical residues are introduced into the natural environment. They were not designed to treat micropollutants [8]. The reduction rate is highly variable within a single plant and from one plant to another. WWTPs are however capable of eliminating a large share of the substances present in the inputs.
Carbamazepine however, a neutral, heterocyclic anticonvulsant, is a highly persistent substance [1,2,8]. It is neither degraded nor retained in wastewater treatment plants. It is considered as a marker of the presence of wastewater in the aquatic environment and represents a potential risk factor for drinking water supplies. This molecule shows a high bioconcentration capacity within living organisms [10]. The half-life of CBZ in surface waters is between 60 and 100 days [11]. Based on the EC50 (half maximal effective concentration) provided in the literature, this compound could be considered as being highly toxic for algae, bacteria, and invertebrates. A recent study conducted on the fate of CBZ in agricultural soils irrigated with wastewater from WWTPs showed that the sorption of this molecule is mainly governed by the level of organic matter in the soil [3]. Furthermore, CBZ can accumulate in certain plants (wheat, tomatoes, etc.) [12].
The reactive phases of soils and aquifers—composed of clay, sand, calcium carbonate, and metal oxides—play a crucial role in regulating the transfer of contaminants and in particular CBZ. The adsorption capacity and role of these reactive phases in the reduction of CBZ concentrations have rarely been studied.
The infiltration process is determined by various factors, the most important of which relate firstly to the soil itself, through its hydrodynamic characteristics, structure, texture, and profile uniformity, and, secondly, to the specific conditions in which the process occurs, i.e., the initial conditions and the input rate. The main parameters related to the properties of soil are its mineralogy, the particle size distribution, porosity, organic matter content, the type and degree of development of the structure, and the profile uniformity. The water infiltration speed depends, among other factors, on the hydraulic conductivity of the soil and its degree of saturation, whose dynamics are also related to the surface water content.
In terms of the elimination of organic pollutants, numerous physical and chemical techniques and methods—such as adsorption [13,14,15], photocatalytic degradation [16], Fenton oxidation [17], biodegradation [18], and membrane filtration [19]—have been assessed. In wastewater treatment plants, the treatment of these pollutants is mainly based on adsorption and biological treatment [20].
For health and environmental reasons, it is neither advisable nor conceivable to use nanoparticles (spheres, nanotubes, nanowires, etc.) to remove organic pollutants. The release of such materials into the environment could be detrimental to human health and to the ecological biosphere. Titanium oxide for instance, whether nanometric or micrometric, is classified as a possible carcinogen for humans and animals [21].
Based on this analysis, the aim of this study was to assess the CBZ adsorption capacity of the principal mineral constituents of a natural soil and then to compare the adsorption by these minerals with that of an industrial activated carbon. As smectites are frequent constituents of soil, we chose to determine the CBZ adsorption capacity of two smectites, one dioctahedral and the other trioctahedral. No examination of the latter of the two is available in the literature. It was chosen for its chemical, structural, and textural composition. The aim was also to determine the main mechanisms governing adsorbent-adsorbate interactions in pure water (Milli-Q) and in tap water. It is worth highlighting that the literature does not currently offer any data on CBZ treatment in tap water. It should also be recalled that water treatment is generally implemented at between pH 6.5 and 9.
2. Materials and Methods
2.1. Materials
The carbamazepine used in this study (C15H12N2O, Sigma–Aldrich, CAS No. 298-46-4, CE No. 206-062-7, ≥99.0 %) was a white powder with a molecular weight of 236.27 g/mol, a boiling point close to 191 °C [22], an octanol/water partition coefficient of 2.18 [23], a solubility in water at 25 °C of 112 mg/L [10], and two acid dissociation constants defined by pKa1 ≈ 1 and pKa2 ≈ 13.9 [24].
Kaolinite (Kaolin K7A, Ploemeur, Morbihan, France), α-quartz (C800, Sifraco France), α-alumina, goethite (SENSIENT Cosmetic Technologies, Saint Ouen L’aumone, France), hematite (SENSIENT Cosmetic Technologies, Saint Ouen L’aumone, France), and two bentonites, one composed mainly of dioctahedral smectite (SWy3, Crook County, WY, USA) and the other of trioctahedral smectite (Rassoul, Missour, Marocco), were chosen to identify the main minerals which actively contribute to CBZ adsorption in a simple model soil. These two bentonites pass through a 20 µm sieve (Rassoul < 20 and SWy3 < 20). These minerals are representative of mineral phases in natural environments. Their crystallographic structure is known and they are stable in an aqueous solution. Organic matter was deliberately eliminated from this choice in order to assess the adsorption capacities specific to minerals. To stay within the same particle size range, the fraction of NORIT SA SUPER activated carbon that passes through a 20 µm sieve was prepared. This powdered activated carbon (Norit < 20 µm) was obtained from JACOBI CARBONS (CABOT Norit, Amersfoort, Netherlands).
2.2. Methodes
2.2.1. Powder Characterization Techniques
The particle size distributions of the powders were obtained by helium-neon laser diffraction (632.8 nm), using the Malvern Mastersizer S particle size analyzer (Malvern Panalytical, Malvern, UK)by applying the Fraunhofer optical model.
The mineralogical compositions were determined by X-ray diffraction (XRD) from disoriented powders using the BRUKER D8 Advance Da Vinci diffractometer (Bruker France S.A.S, Champs-sur-Marne, France) equipped with a CuKα1 copper radiation anticathode (λ = 1.5418 Å). Diffractograms were obtained in the 2θ angular range between 2 and 76° with a sweep rate of 0.02° 2θ/s and a counting time of 710 s per step. The samples examined had been previously dried and degassed at 110 °C.
The zero point of charge (ZPC) was determined using the Mular-Roberts [25] method, known as the pH drift method. This corresponds to the pH at which the total particle charge (including the surface of the mineral and the solvation shell layer) is zero. It can be representative of a complete absence of charge or of an exact balance of positive and negative charges present in the double layer.
The specific surface areas, the pore volumes and the slit widths less than 50 nm were determined at 77 K from nitrogen adsorption/desorption isotherms using a Micromeritics ASAP 2050 discontinuous volumetry sorptometer (Micromeritics Instrument Corp., Norcross, GA, USA). Prior to analysis, the samples were dried and degassed at 110 °C until a residual vacuum of less than 0.02 mbar was obtained using the Micromeritics AccuPyc 1330 pycnometer (Micromeritics Instrument Corp., Norcross, GA, USA). The BET method was used to determine the specific surface areas using a molecular cross-sectional area of nitrogen of 0.1625 nm². The t-plot method was used to assess the microporosity of samples from the desorption isotherms.
2.2.2. Adsorption Isotherm Models
CBZ was measured by UV spectroscopy at 285 nm using a PerkinElmer Lamba 1050 spectrophotometer (PerkinElmer, Courtaboeuf, France). The calibration at this wavelength was based on the Beer–Lambert law with 10 concentrations between 0.01 and 16 mg/L. The correlation coefficient, R², of the linear regression was 0.999. The solutions were prepared by dilution in amber high density polyethylene bottles at ambient temperature. The adsorption isotherms were determined in the same types of bottles. The adsorbent concentration was set at 50 mg/L and the CBZ concentrations were at intervals ranging from 0.02 to 40 mg/L. Mixing, homogenization, and dispersion were performed using an overhead shaker at 60 rpm, for 4 h at ambient temperature. No stirrer was placed in the bottles (no magnetic stir bar). During this phase, a 40 mL sample from each bottle was centrifuged for 30 min at 9383 g, then the supernatant was filtered with a polyvinylidene fluoride (PVDF) filter with an average porosity of 0.1 μm. The CBZ concentration in the filtered solution was determined by UV spectroscopy at 285 nm. The adsorption isotherm was obtained by the graphic representation of the quantity of CBZ adsorbed by the mineral "Qe" according to the residual CBZ concentration in the equilibrium solution "Ce" [Qe=f(Ce)].
Given the texture and the energetic heterogeneity of the adsorbent surface, the adsorption isotherm models of Sips and Dubinin-Astakhov (D-A) were used to describe the adsorption equilibrium characteristics.
The Sips model [26] is a combination of the Langmuir and Freundlich isotherm models, as shown in Equation (1).
where Qe is the amount of pollutant adsorbed per gram of the adsorbent at equilibrium (mg/g), Qmax is the maximum monolayer saturation capacity (mg/g), Ce is the equilibrium concentration of adsorbate (mg/L), Ks is the affinity constant (L/mg), and ns is the surface heterogeneity index (−), which varies from 0 to 1. When ns equals unity, the Sips isotherm returns to the Langmuir isotherm and predicts homogeneous adsorption. On the other hand, deviation of the ns value from the unity indicates a heterogeneous surface. Also, when the denominator equals unity, the model resembles the Freundlich model.
The Dubinin-Astakhov model (Equation (2)) does not assume that the surface is homogeneous or that the adsorption potential is constant, as is the case for the Langmuir model. Its theory of volume filling of micropores is based on the fact that the adsorption potential is variable and the free enthalpy of adsorption is related to the degree of pore-filling. This isotherm assumes that the surface is heterogeneous and is expressed as follows [27]:
where Qe is the amount of pollutant adsorbed per gram of the adsorbent at equilibrium (mg/g), Qmax is the maximum monolayer saturation capacity (mg/g), Ce is the equilibrium concentration of adsorbate (g/g), ε is the Polanyi potential (kJ/mol), E is the mean free energy of sorption (kJ/mol), n is the surface heterogeneity index, R is the universal gas constant (8.314 J/ mol °K), and T is the absolute temperature (°K).
D-A parameters were determined by transforming the D-A equation (2) into a linear form:
The slope of the plot of ln(Qe) versus (ln(1+1/Ce))n gives the mean adsorption energy E (Equation (5)), and the intercept yields the adsorption capacity Qmax (mg/g).
The adsorption energy E was used for estimating the type of adsorption mechanism. For a magnitude of E between 8 and 16 kJ/mol, the adsorption process followed the chemical ion exchange, and values of E below 8 kJ/mol were charcteristic of a physical adsorption process. When E > 16 kJ/mol, the adsorption is dominated by intraparticle diffusion [28].
The value n characterizes the distribution of the adsorption energy in the micropores and, indirectly, the distribution of micropore size. The heterogeneity of these two parameters increased as n decreased from 2, and, conversely, their homogeneity increased for values above 2. The micropore size also decreased as n increased [29].
3. Results and Discussion
3.1. Characterization of Products Used
3.1.1. CBZ Characterization
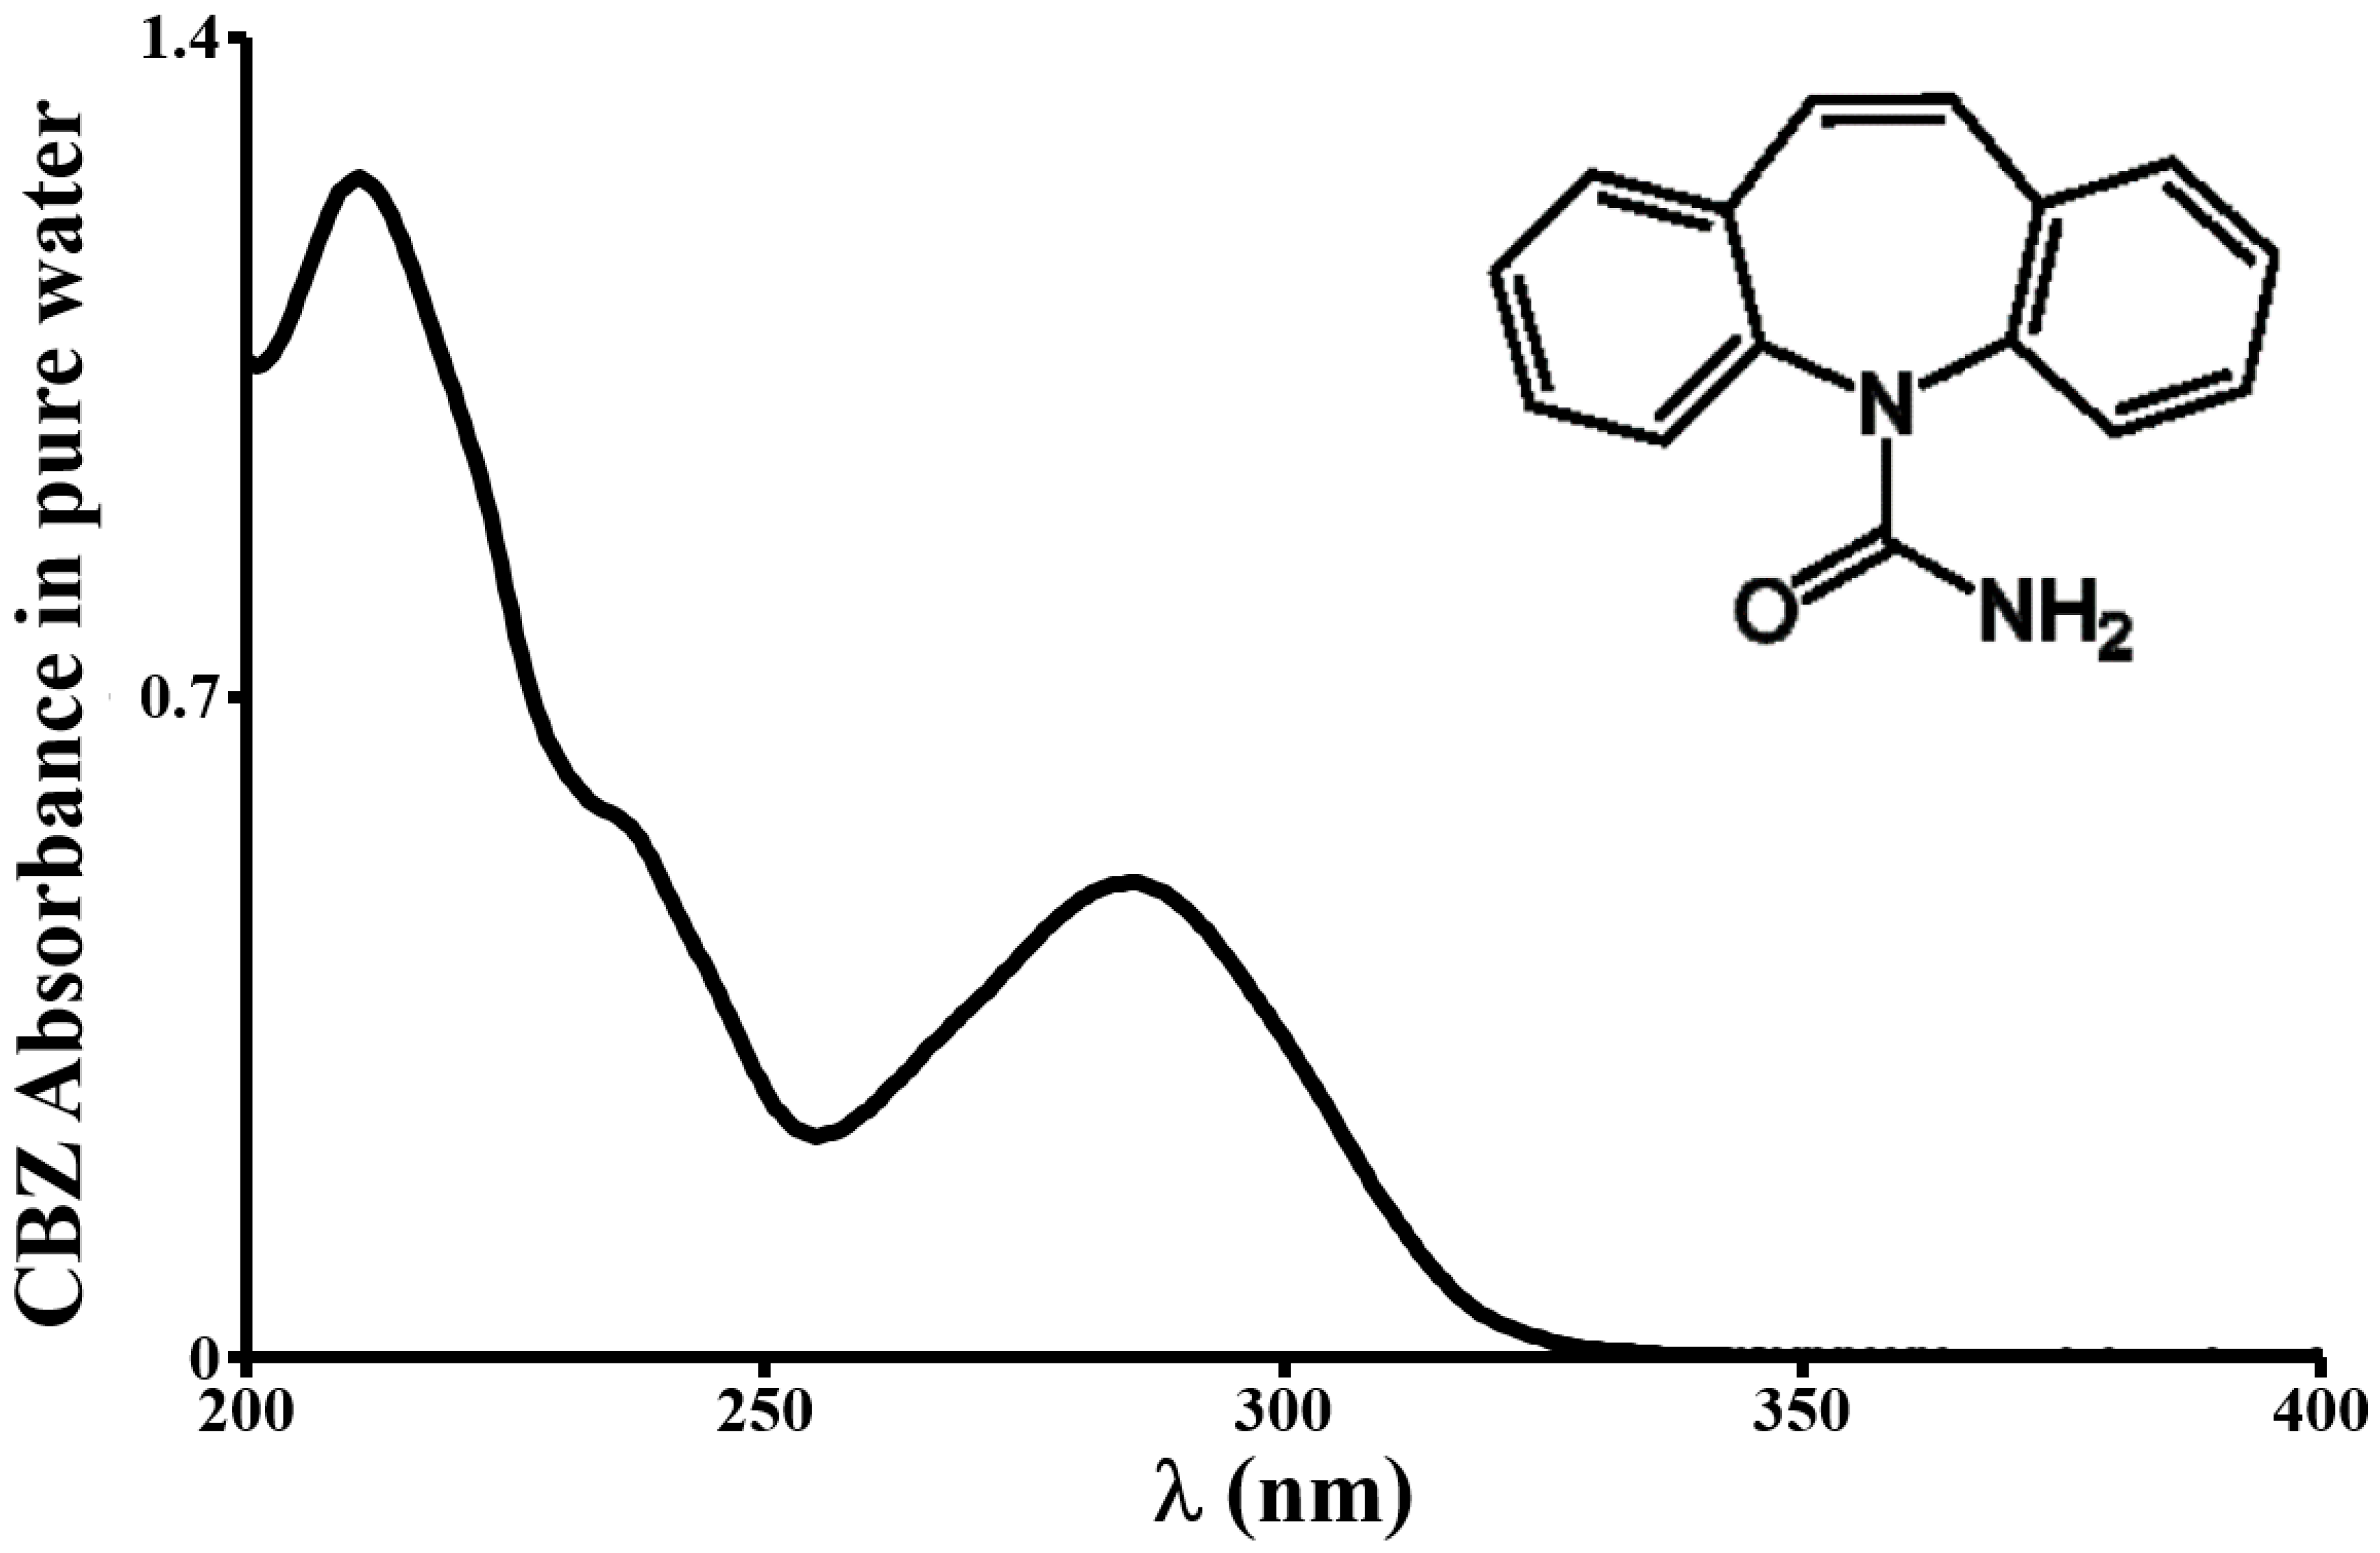
The diffractogram of the pharmaceutical product used in this study showed that this product is composed mainly (>98%) of anhydrous carbamazepine (Form III CBZ) and a fraction of hydrated carbamazepine (HCBZ, <2%). The crystal system of the main component is P-monoclinic; its mesh parameters are: a = 7.54 Å, b = 11.16 Å, and c = 13.91 Å, and its unit volume is 1.17 nm3. Its Stokes diameter is approximately 0.74 nm [30]. The CBZ speciation diagram (Figure 1) in pure water as a function of pH and its dissociation constants, established based on the Henderson-Hasselbalch method and equation (6), shows that this molecule is neutral between pH 3 and 11. Its UV-visible absorption spectrum shows three very distinct absorption bands situated at 210.5, 237.5, and 285.5 nm and attributed respectively to the transitions π→π*, n→σ* and n→π* (Figure 2). The spectrum characterizes the electronic transitions between an orbital bonding (n or π) to an antibonding orbital (σ* or π*). They are due to the presence of the chromophore group (C=C, C=O, C=N) and of the free electron doublet of the nitrogen atom (n →π*). Absorption at 285.5 nm was used to measure this molecule. These values were obtained by spectral decomposition by Gaussian fitting.
where x = −1 and pKa = pKa1 if an acid drug is used or x = 1 and pKa = pKa2 if a basic drug is used.
3.1.2. Mineralogy, Surface Properties and Texture of Adsorbents
XRD revealed that (1) the alumina, quartz, goethite, and hematite were pure (>99%); (2) the kaolin 7A contained 91% kaolinite and 9% impurities (Illite, Muscovite and Quartz); (3) the bentonite SWy3 < 20 µm was composed of 95% montmorillonite (dioctahedral smectite) and 5% mineral impurities (Quartz and Feldspars); and finally, (4) the Rassoul < 20 µm was composed of 97% stevensite (magnesian trioctahedral smectites) and 3% mineral impurities (Quartz and dolomite).
It is well established that the efficacy of adsorbents in eliminating pollutants is dependent on their physical characteristics (particle size, porosity, and specific surface area), their surface chemistry, and the physico-chemistry of the carrier medium. The surfaces of the chosen adsorbents also comprise reactive amphoteric functional groups which can protonate or deprotonate depending on the pH value, meaning that they can have a different surface charge according to the pH of the solution in which they are present. Protonation and deprotonation reactions can be represented by the following equilibria:
The term ≡SOH groups is used as a non-specific notation of amphoteric surface OH groups which carry a pH-dependent charge referred to as net proton surface charge.
For the kaolinite, montmorillonite, and stevensite, protonation and deprotonation only concerned the edge sites (silanols and aluminols). The interlayer charges of these clays are independent of pH and are higher for the two smectites. Whatever the pH, the charge density of montmorillonite and stevensite is negative. Their lateral charge only represents 4% to 8% of the total charge, and is therefore considered insignificant.
The zero point of charge for each adsorbent is indicated in Table 1. Below this pH, solids (only the lateral faces in the case of clays) have a positive overall charge, and above it, their charge is negative. Nevertheless, as concerns CBZ, which is neutral, this charge has no effect and electrostatic interactions between CBZ and the adsorbents therefore cannot occur.
The textural properties of an adsorbent affect the adsorption equilibria. Knowledge of these properties is essential to more accurately interpret the adsorption mechanisms of all molecules, whether organic or otherwise. A detailed textural analysis of the two bentonites and the powdered activated carbon (PAC) was therefore implemented.
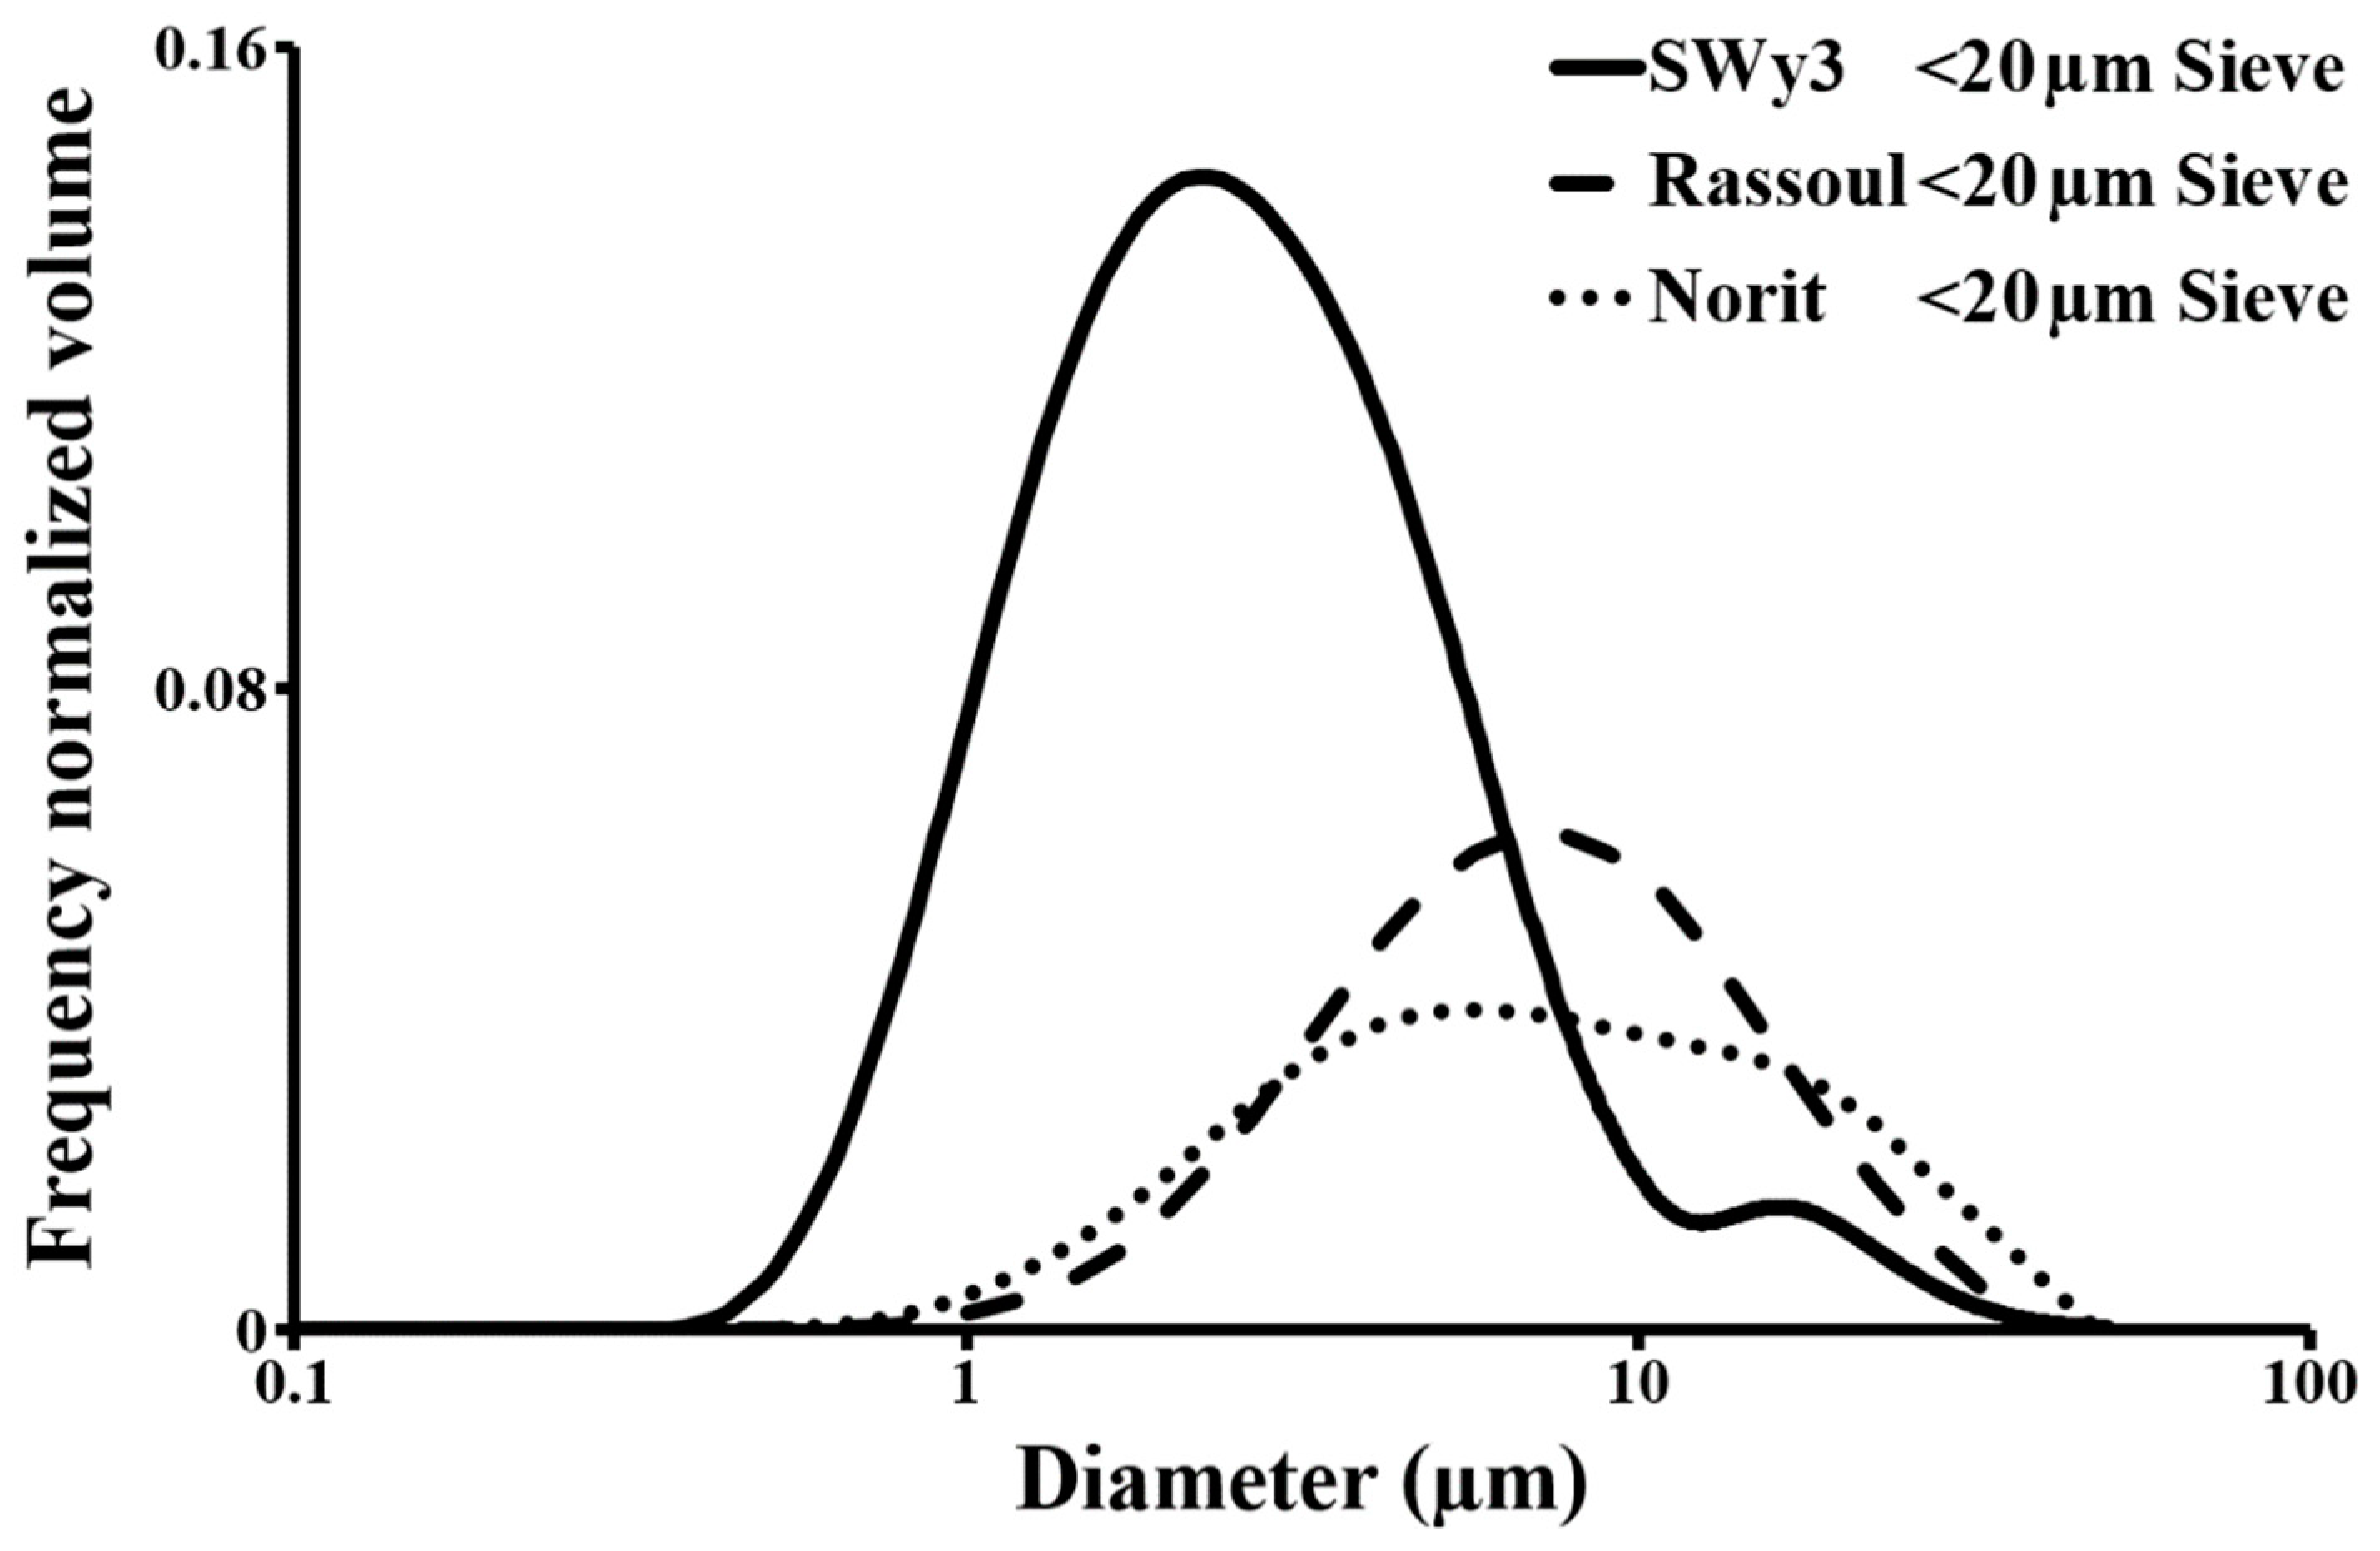
The main size and texture parameters are provided in Table 1. Only the volume-based particle size distributions for the two bentonites and the Norit < 20 are shown in Figure 3. They are situated between 0.35 and 35 µm. The particle size of SWy3 < 20 is more wide-ranging and finer than that of the two other products. It is mainly composed of a very fine population, centered at around 2 µm, representing 73% of the mass of the overall product. This population should automatically trigger a decrease in the overall porosity of this mineral. The finest population in the Rassoul < 20 was 6 µm (60%) and in the Norit < 20 was 5 µm (51%). These two products showed relatively similar particle size ranges.
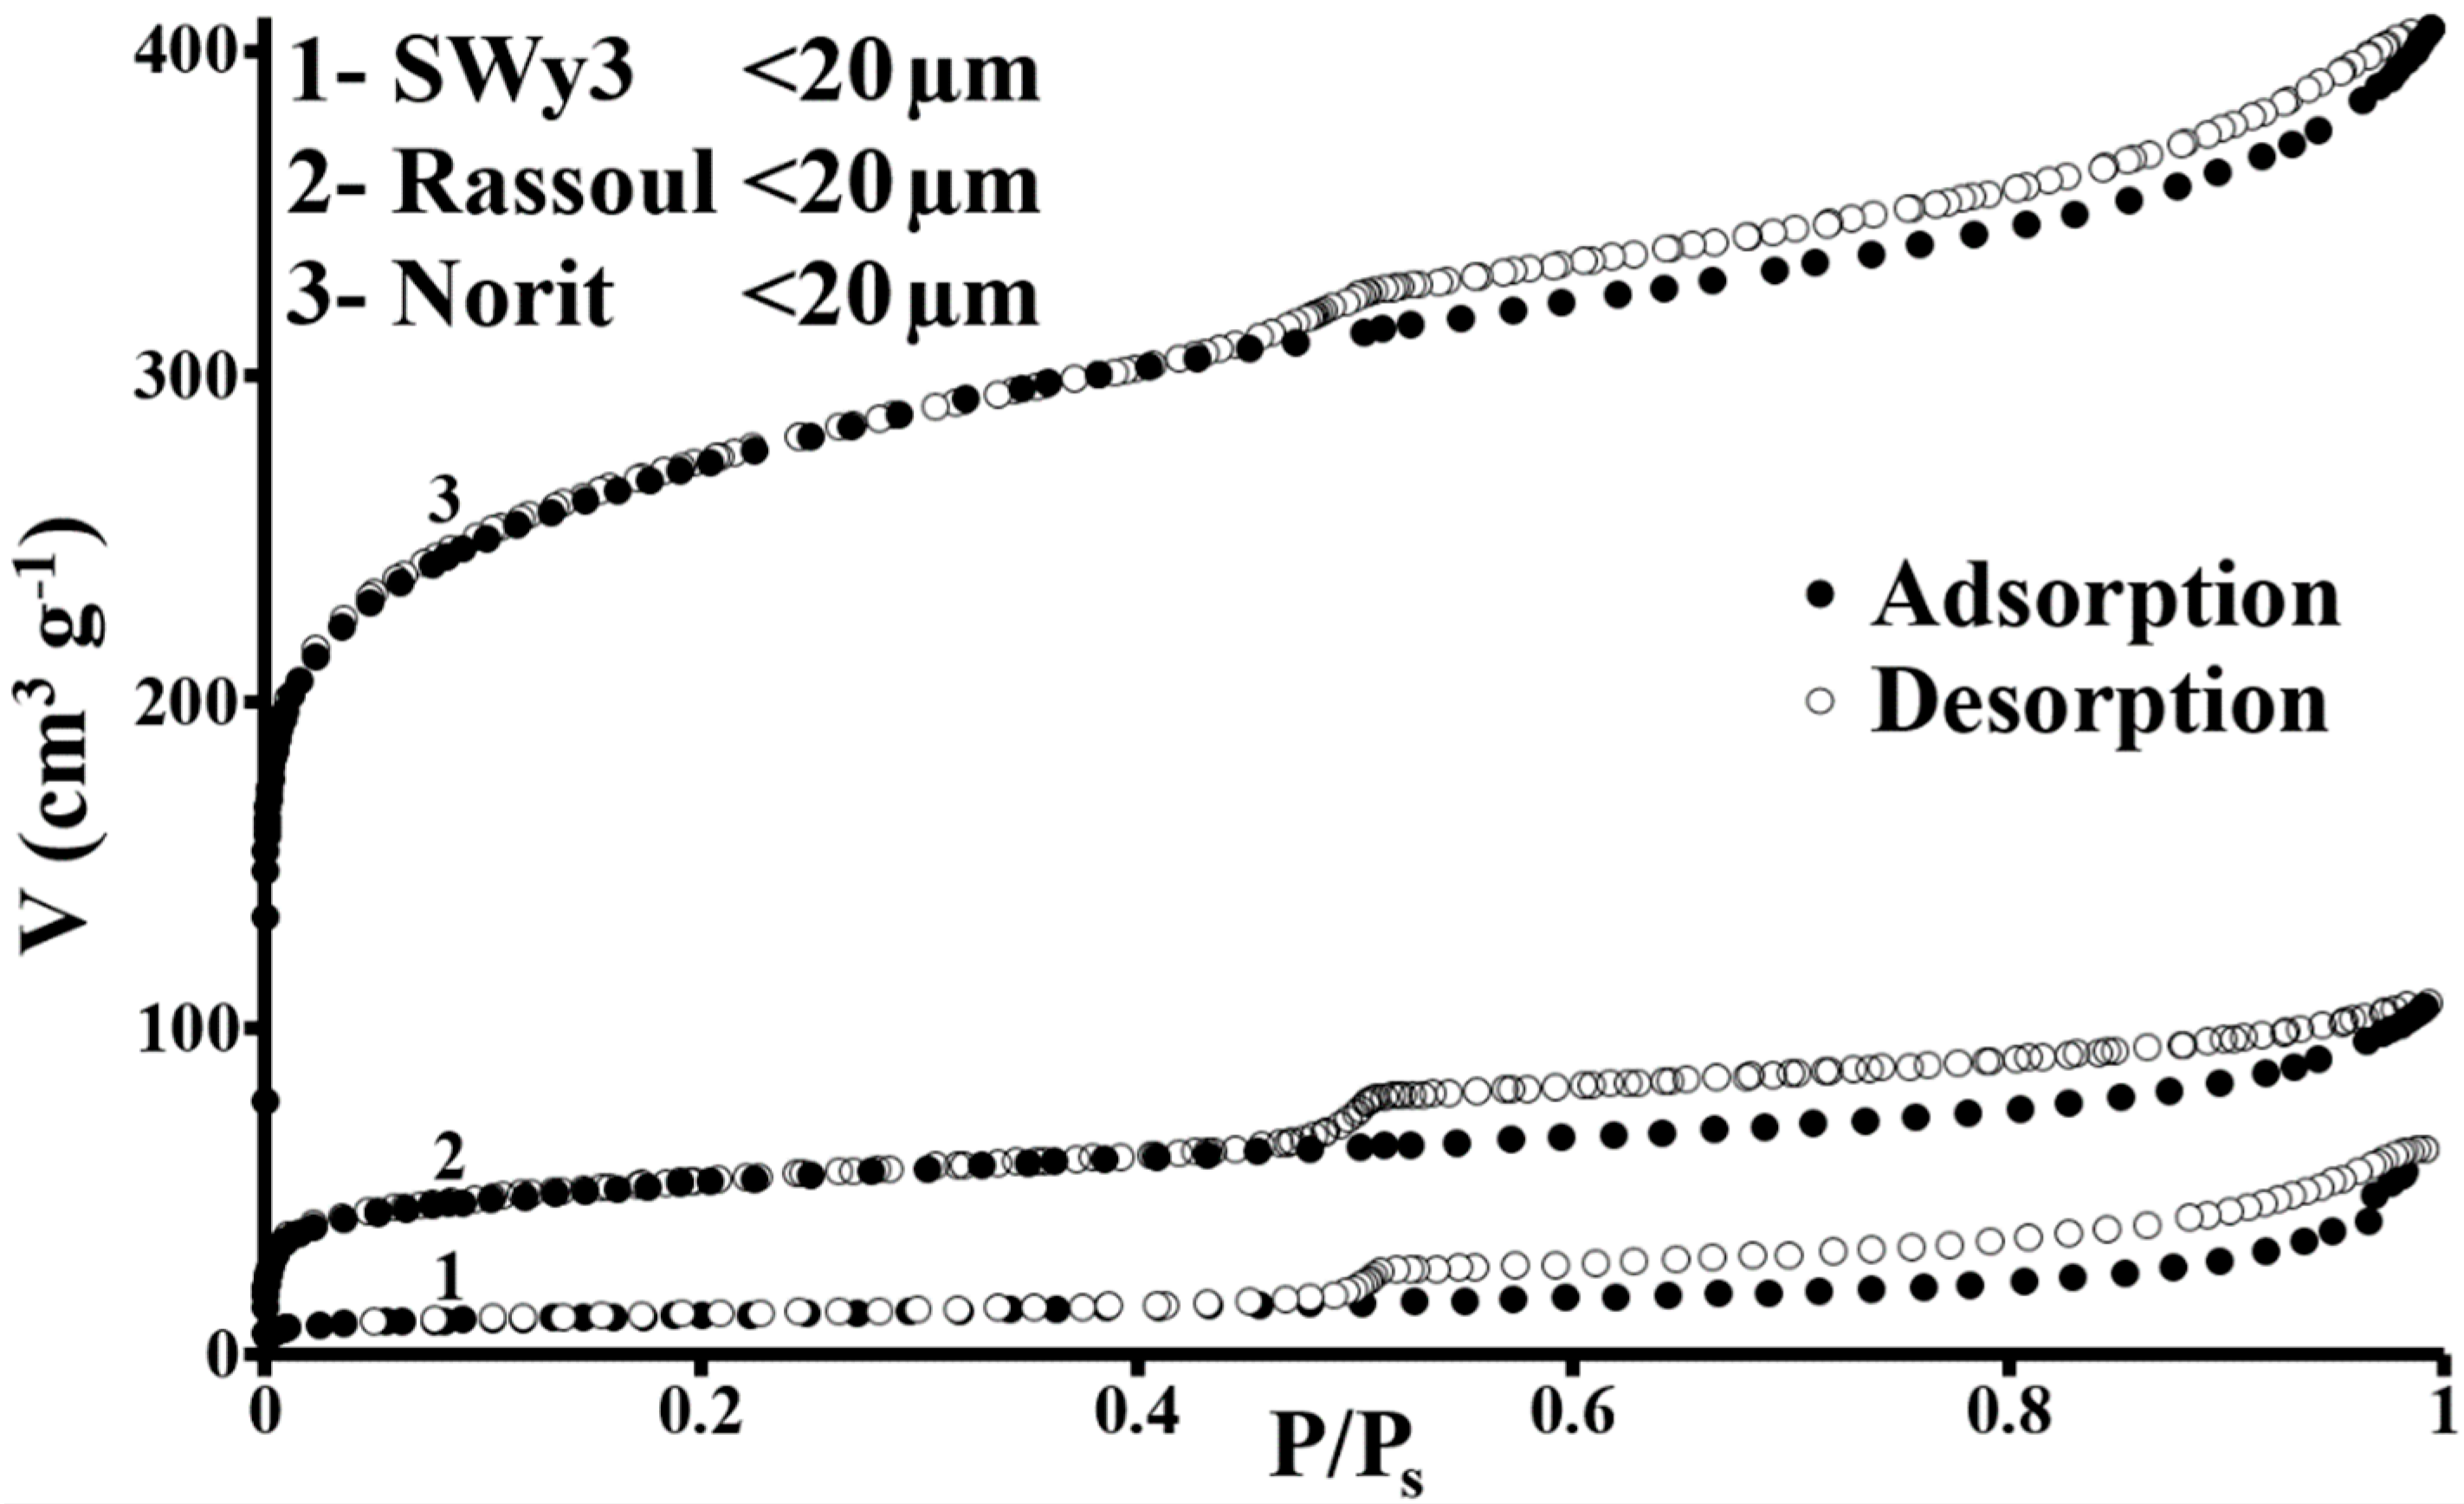
The nitrogen adsorption-desorption isotherms and the porosity distributions of the two bentonites and the Norit < 20 are presented in Figure 4, Figure 5 and Figure 6. The porosity distributions were determined from the desorption branch based on the Barrett, Joyner and Halenda method (BJH). In this model, the geometric forms of the pores were assimilated with slits. The 3 isotherms show hysteresis due to different equilibrium pressures during adsorption and desorption (Figure 4).
According to the IUPAC classification (International Union of Pure and Application Chemistry, [31]), adsorption isotherms are type IV for SWy3 < 20 and formed of a combination of types I and II for Rassoul < 20 and Norit < 20. Types II and IV represent multilayer adsorption on mesoporous adsorbents.
The isotherm form for Rassoul < 20 and Norit < 20, at low relative equilibrium pressures (P/Ps < 0.01), can be considered to be type I, which is characteristic of microporous adsorbents. In this relative pressure range, these isotherms are characterized by a sharp rise in the quantity adsorbed. The proportion of micropores is greater in Norit < 20 than in Rassoul < 20. Bentonite SWy3 < 20 is largely unconcerned by this phenomenon. The micropore volumes, determined by the t-plot method, corroborate this observation (Table 1).
In the case of these two bentonites, the microporosity is due in part to defective edges in the stacking of sheets which form the tactoid (turbostratic stacking) and to a small share of intertactoid porosity. This irregular assemblage of clay sheets gives rise to slit-shaped pores and to mesoporosity resulting from the intertactoid organization.
The structure of the activated carbon is rather similar to that of graphite, with a lamellar organization (graphite planes) [32].
The isotherms show hysteresis loops, closed at a relative pressure close to 0.42. Again according to the IUPAC classification, the hysteresis loops are type H3 for SWy3 < 20 and type H4 for Rassoul < 20 and Norit < 20. The shape of these loops is generally created by lamellar particles with slit-shaped pores. In relation to H3, H4 is associated with micropores.
Type H3 hysteresis loops mainly characterize lamellar particles with slit-shaped pores. Type H4 hysteresis loops also result from slit-shaped pores, but are also associated with micropores in general.
It is important to note that the quantity of nitrogen adsorbed at relative pressures in excess of 0.42 is greater for Norit < 20 than for the two smectites (6 times higher). This result indicates the presence of very large mesopores and probably a non-negligible proportion of macropores in the Norit < 20.
The BET specific surface area of the Norit<20 was 5 times greater than that of the Rassoul and 24 times greater than that of the SWy3 < 20. Similarly, the specific surface area of the micropores of Norit < 20 was 4 times greater than that of the Rassoul < 20 and 10 times greater than that of the SWy3 < 20.
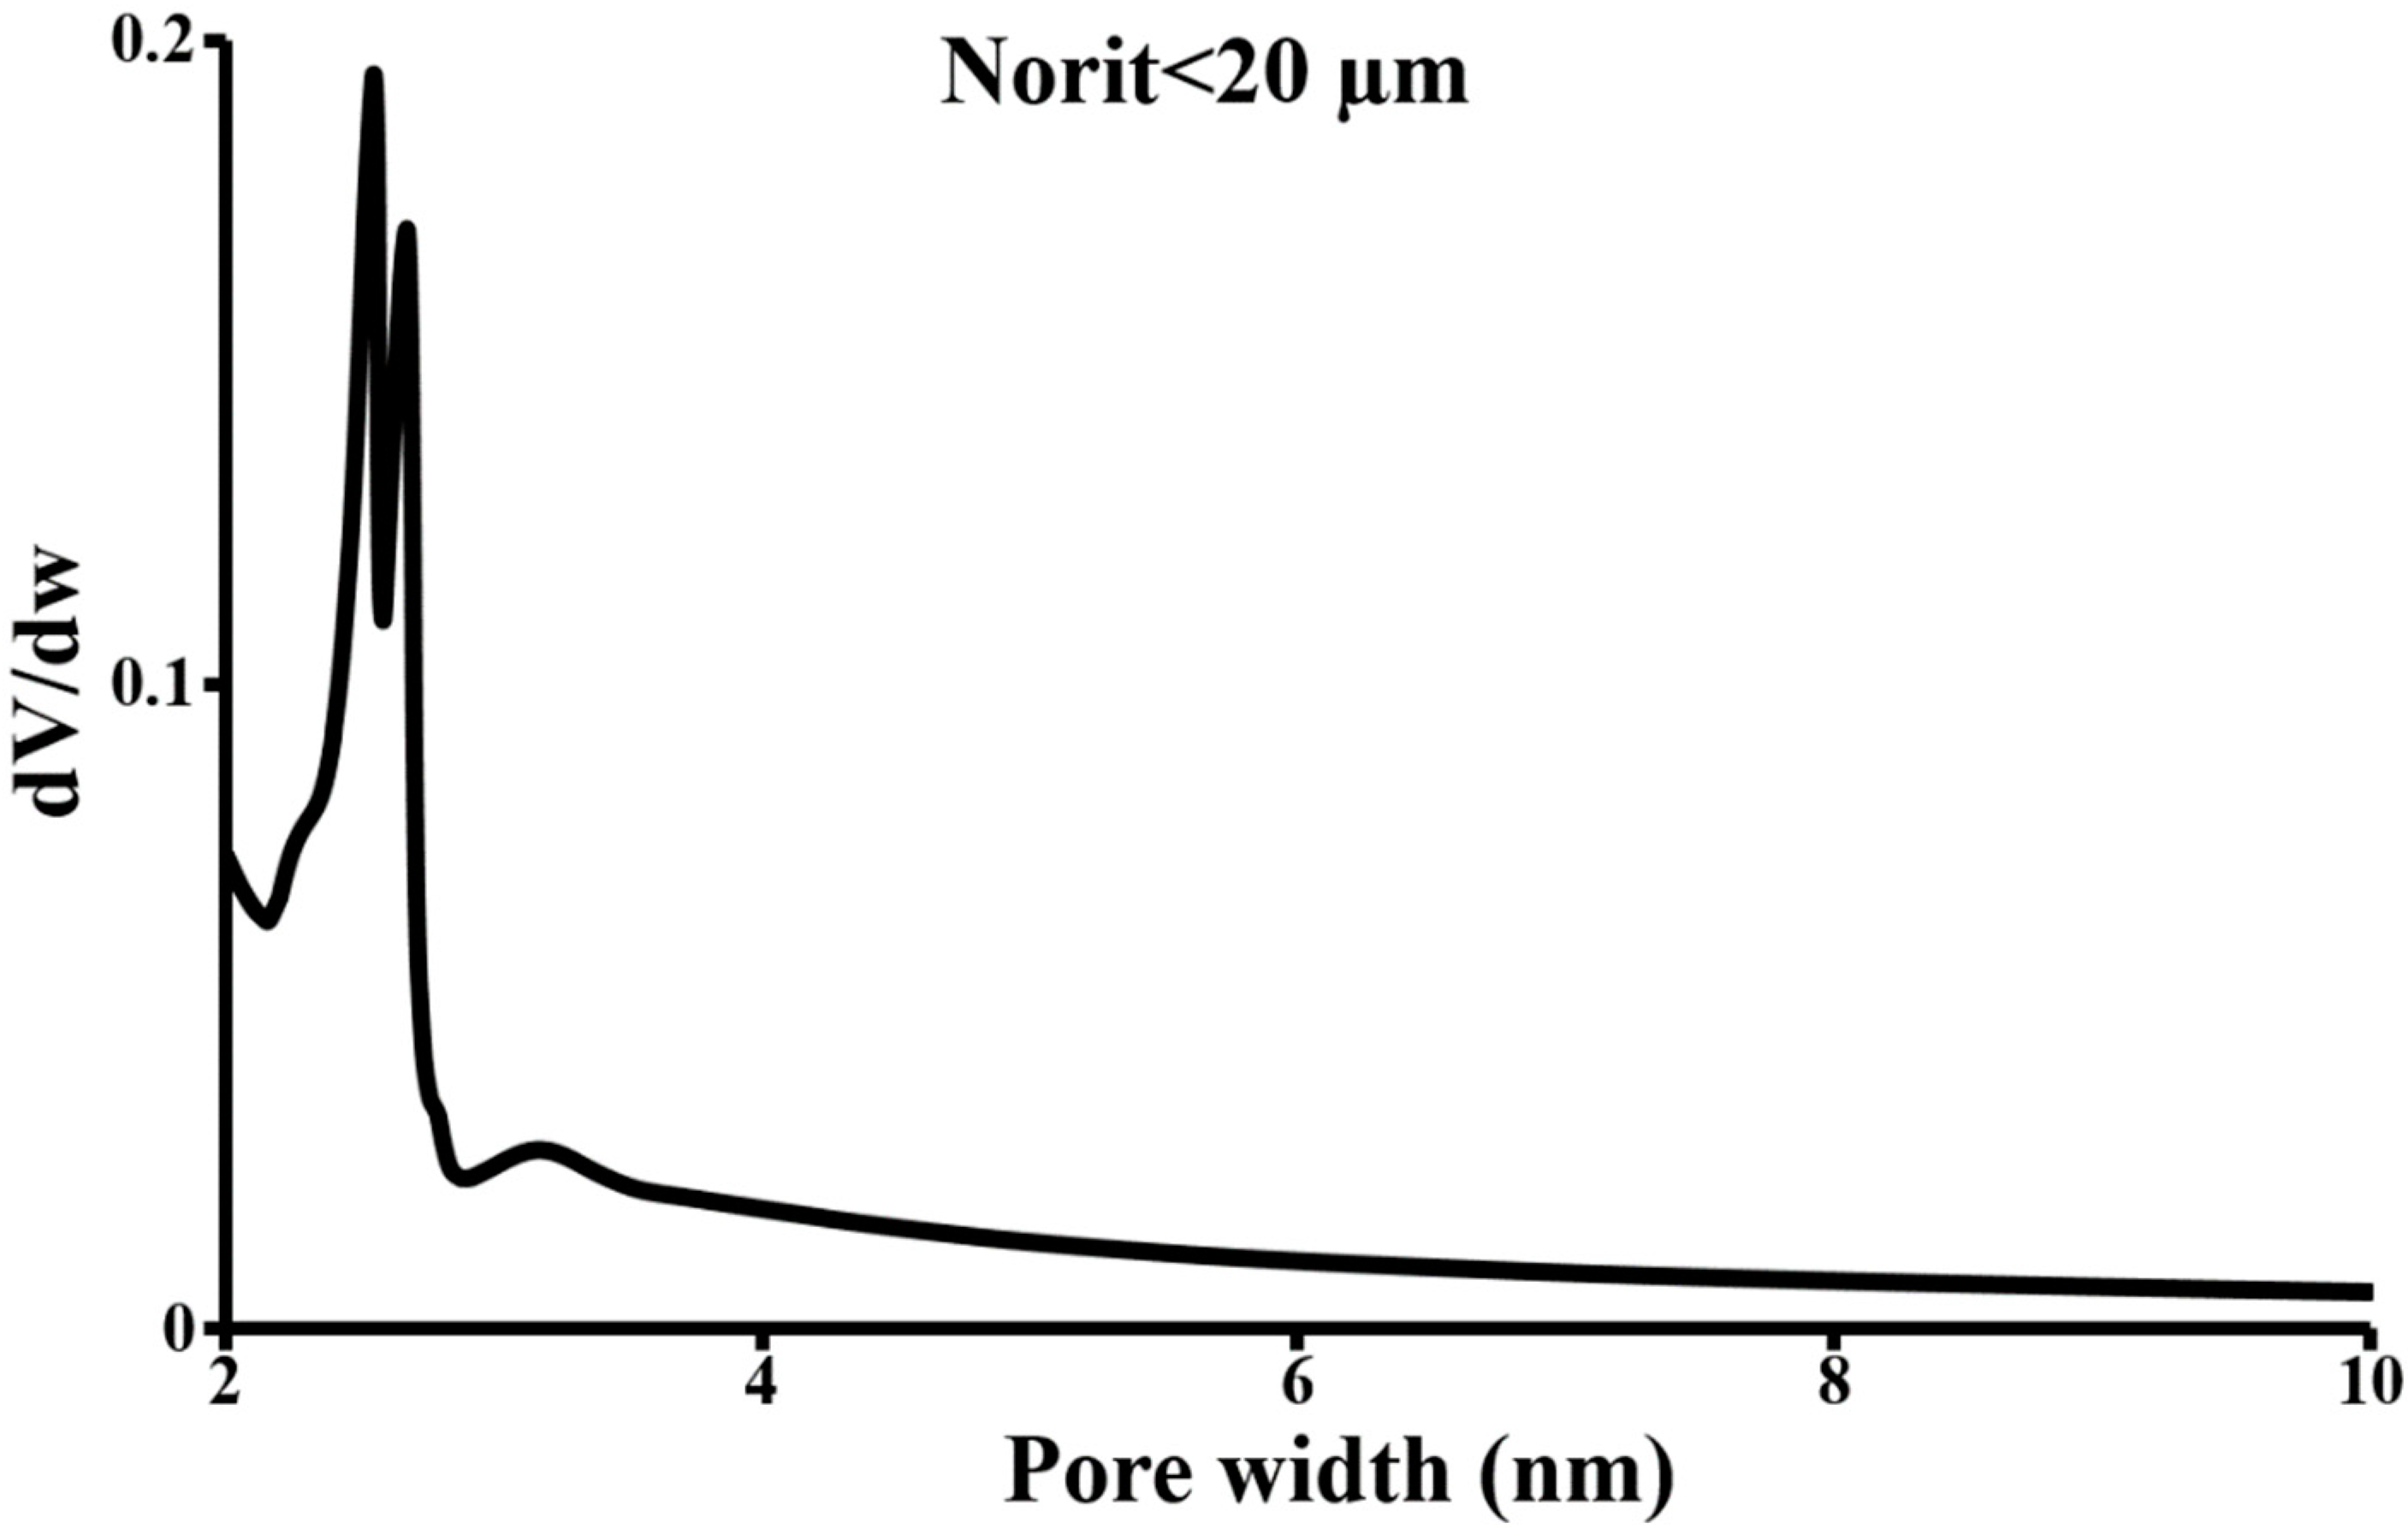
This activated carbon is characterized by a large specific surface area, as well as by a wide pore size distribution (Figure 6) and the micropore size is far greater than that of the CBZ to be eliminated. The specific surface area of its micropores represents 73% of the total specific surface area according to the t-plot model, and is 45 times greater than that of SWy3 < 20 and 6.4 times greater than that of Rassoul < 20. Furthermore, the micropore volumes for SWy3 < 20, Rassoul < 20 and Norit < 20 represent around 7%, 30% and 49% of their respective total specific pore volume (Table 1).
The micropore structure of Norit < 20 (784 m²/g, 0.30 cm3/g, 20% < 2 nm) should therefore promote CBZ adsorption, given that micropores have a very high potential to confine organic molecules.
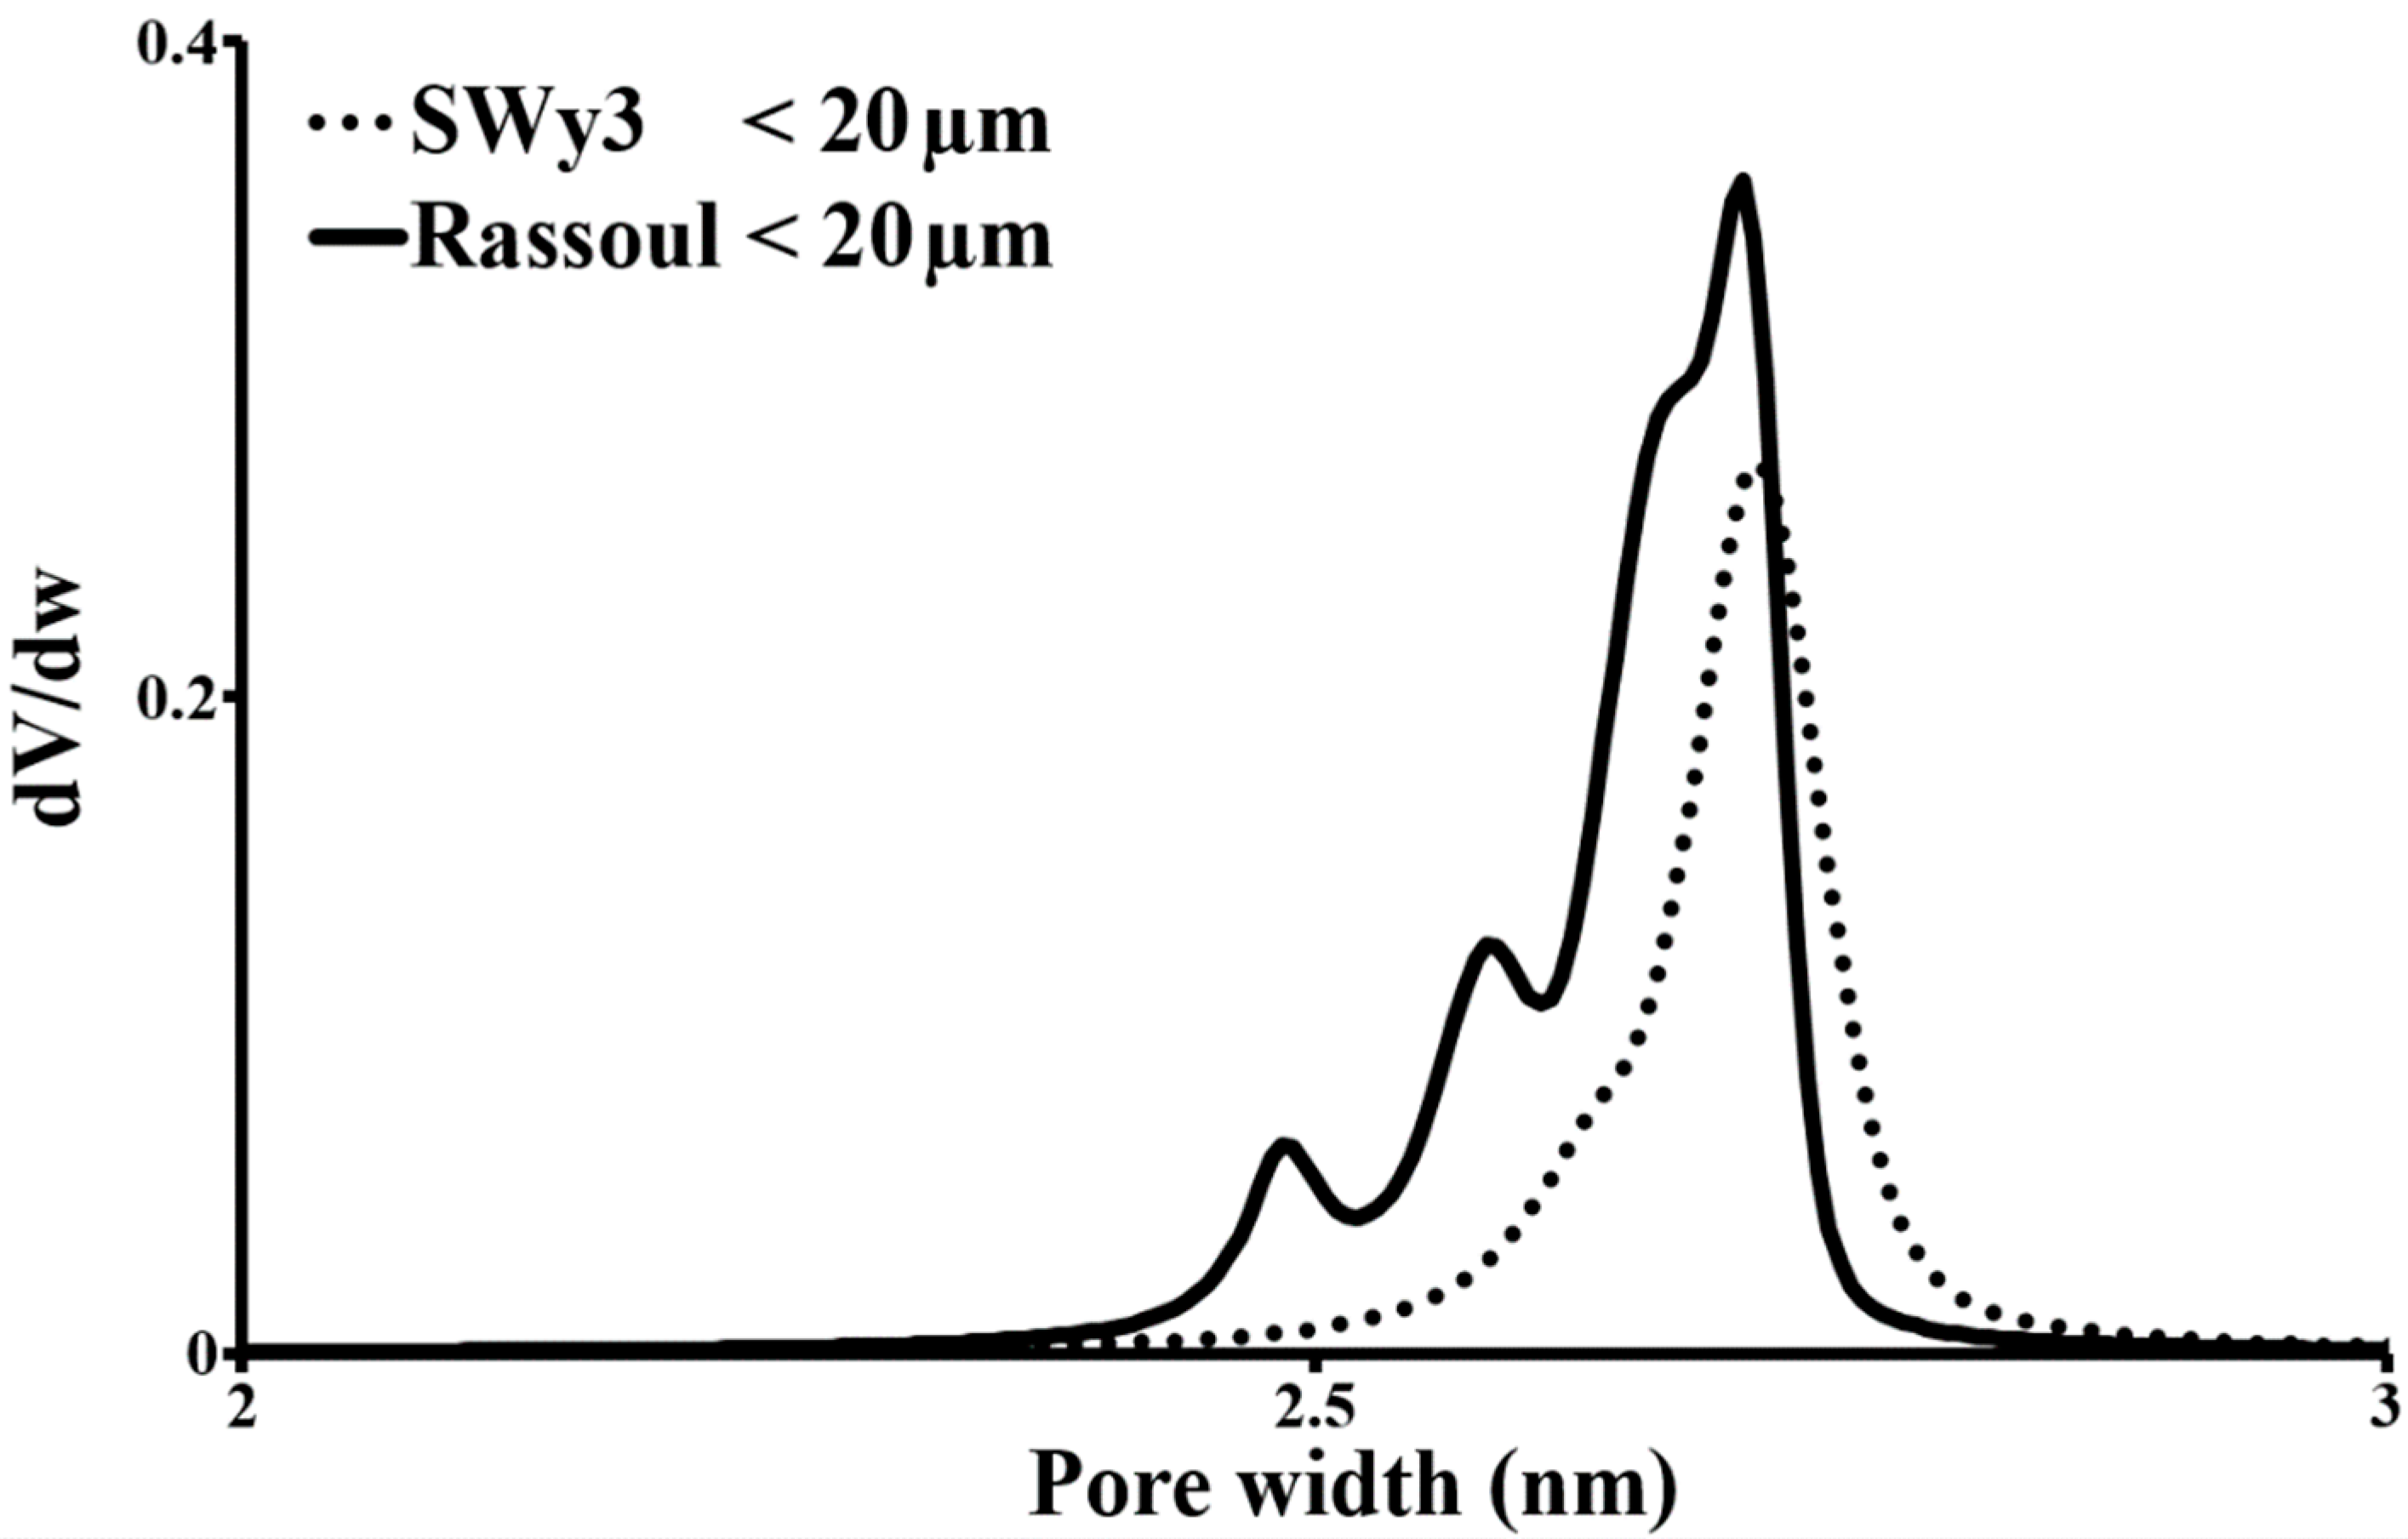
The average pore size distribution, determined by the BJH method using parallel-sides slits-shaped, was narrow in the case of the two bentonites with the majority of pores between 2 and 3 nm, and wider in the case of Norit < 20; between 0.7 and 10 nm, as shown in Figure 5 and Figure 6.
By comparison with particle size distributions (Figure 3), the size and specific surface area are inversely correlated. The finer product, SWy3 < 20, has the smallest specific surface area. The porosity of Rassoul < 20 and Norit < 20—which equates to large internal surface areas—moderates the influence of the particle size of these two products on their specific surface area values.
3.2. Retention of Carbamazepine
3.2.1. The Principal Mineral Constituents of a Naturel Soil in the Presence of Carbamazepine
In terms of CBZ adsorption, it is important to remember that this molecule (C15H12N2O) (Figure 2) is characterized by a tricyclic nucleus composed of two benzene rings coupled with a nitrogen atom and a side chain (CONH2) linked by the nitrogen atom of the central nucleus [33].
The tap water used for the following adsorptions had a pH of 8.1 ± 0.1, a conductivity of 352 µS/cm at 25 °C, an ionic force of 0.0054 ± 0.0004 mol/L, and a chemical composition with a dissolved salt concentration of 259 ± 3 mg/L with 3.35 meq/L for cations and 3.51 meq/L for anions.
When this molecule was placed in contact with the main minerals alumina, quartz, kaolinite, bentonite SWy3 < 20 µm, goethite, and hematite, they showed no CBZ adsorption either in pure water or in tap water at CBZ concentrations ranging from 0.02 to 40 mg/L. The lack of adsorption on alumina, quartz, and bentonite SWy3 in the experimental pH range indicates that CBZ (a neutral molecule) has no affinity for ferrol, silanol, and aluminol surface sites. Furthermore, no measurable effect of the ionic strength of tap water was found. The results indicate that these minerals do not play any role in CBZ treatment.
Inversely, Rassoul < 20, a clay composed mainly of magnesian trioctahedral smectite covered with natural foaming saponin, showed a slight affinity for CBZ (Figure 7 and Figure 8). The cation exchange capacity, organic carbon, specific surface area, and pore volume of this mineral are respectively 64 meq/100 g, 0.3%, 188 m2/g and 0.10 cm3/g. Its zero point of charge (pH of edge sites) is equal to the pH of the tap water (Table 1). Based on the observations made for the other minerals, i.e., that silanols and aluminols do not contribute to CBZ adsorption, we deduce that the adsorption capacity of this product is mainly due to the presence of saponin and to its microporosity which reinforces CBZ confinement. The exact structure of this saponin currently remains unclear. Nevertheless, according to the literature [34,35], saponins are generally composed of functional groups -COOH, –OH, C=O, C-H, which, in favorable conditions, can lead to the creation of hydrogen bonds with an organic adsorbate and, in particular for CBZ, composed of the carboxamide group (R-C(=O)NH2) [36].
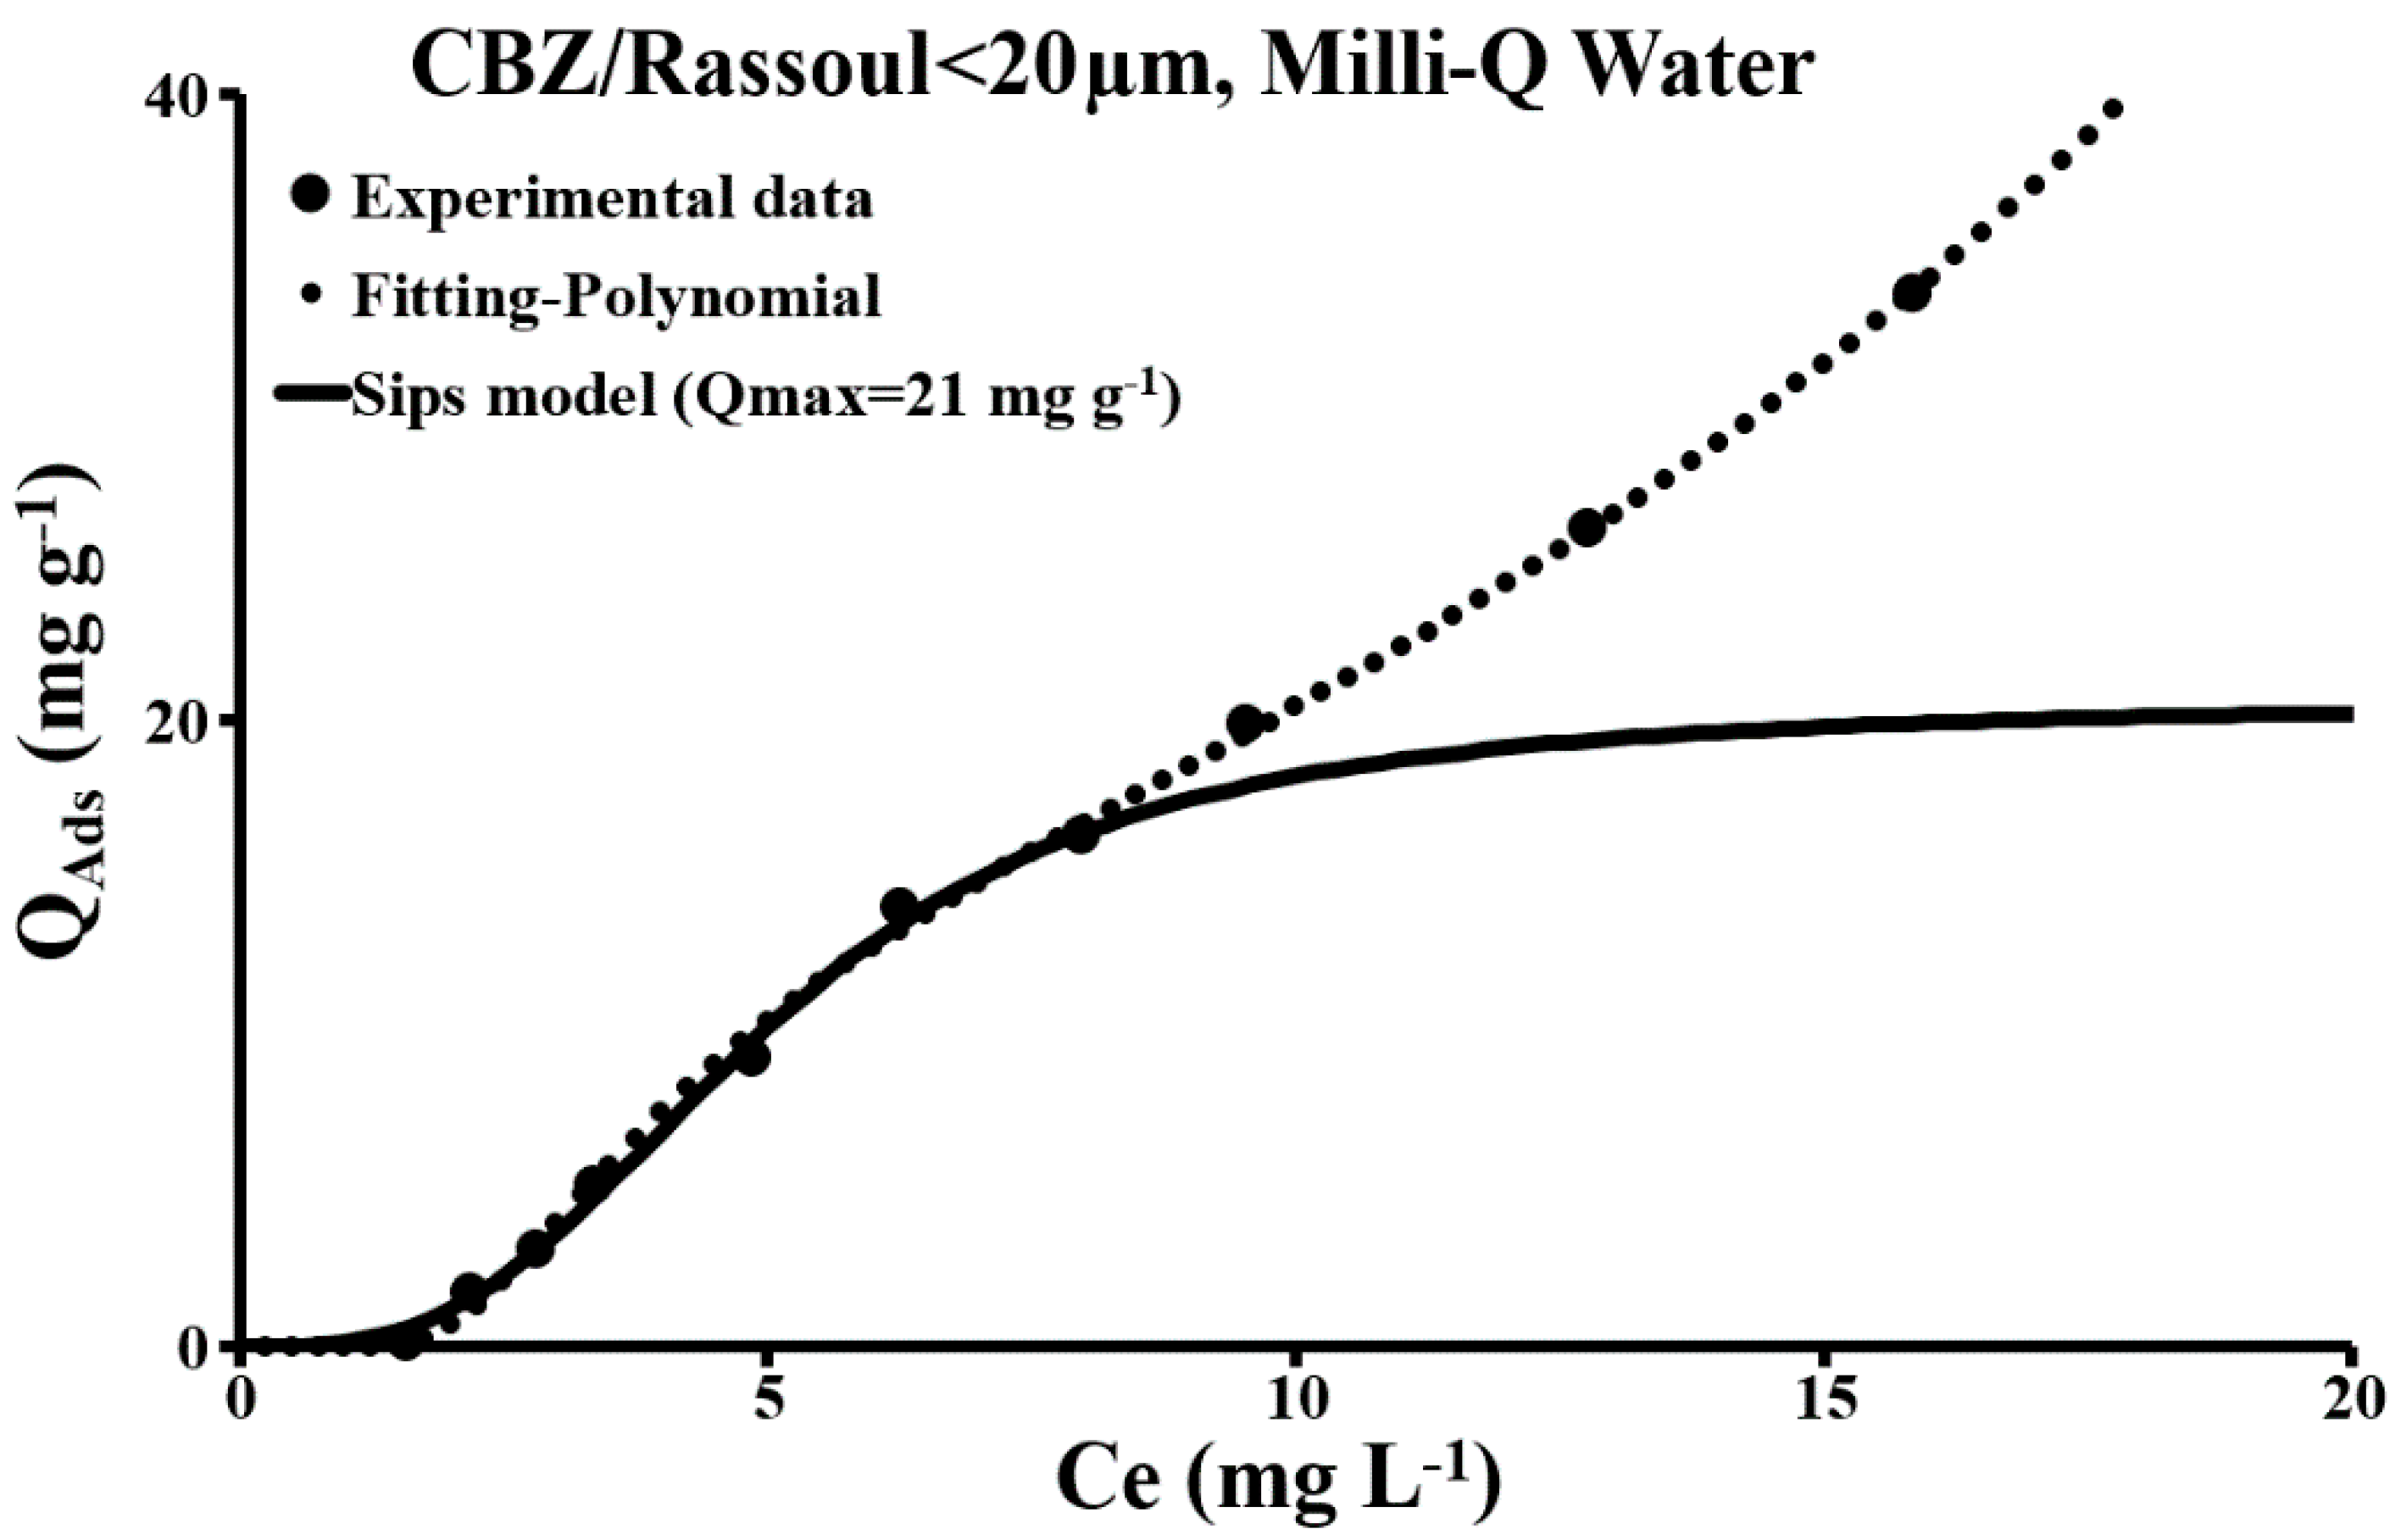
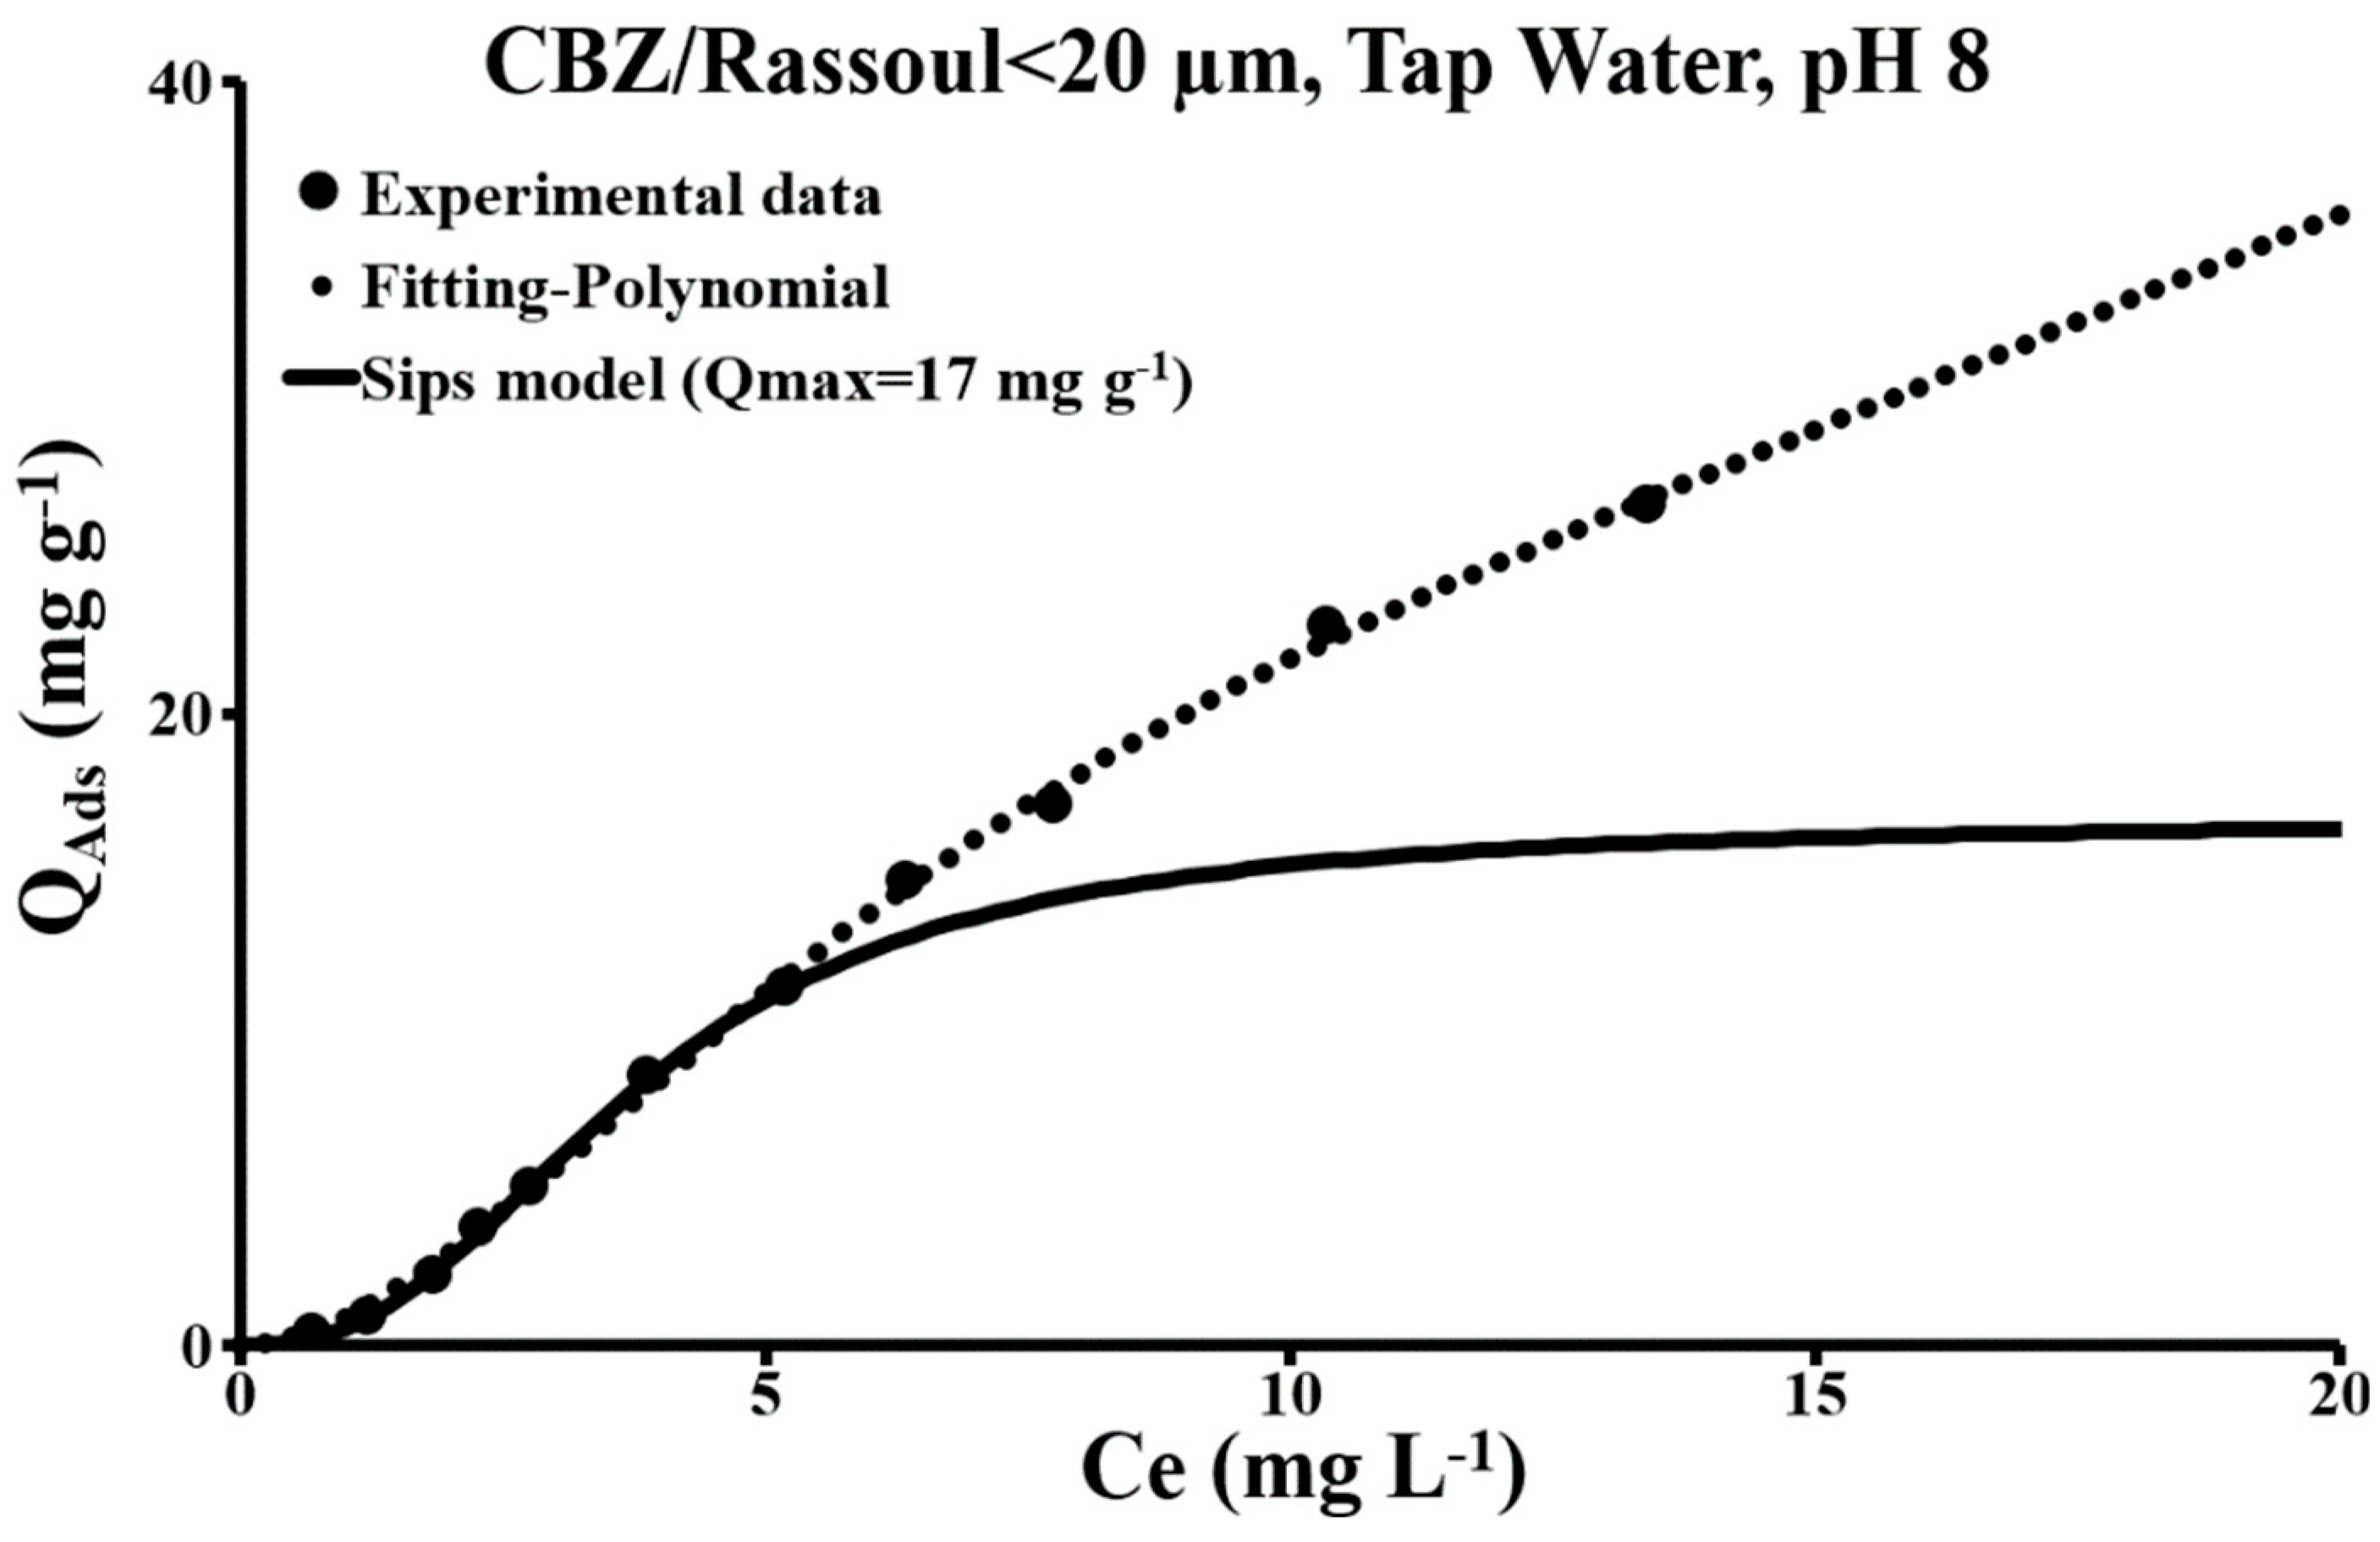
The experimental isotherms for Rassoul <20 / CBZ are spread across a very wide range of CBZ concentrations (Figure 7 and Figure 8). They are characterized by a slope which increases with the CBZ concentration. Below the equilibrium concentration of 1 mg/L, CBZ adsorption is close to zero. The energy input is not sufficient to take up the solute. At this concentration, and for the type of bond that can be formed by saponin clay, the CBZ molecules are relatively distant. In pure water, like in tap water, each isotherm has two inflection points. At each inflection point, the adsorption mechanism changes. Below the second inflection point located at around 8 mg/L in pure water and 5 mg/L in tap water, the two isotherms are type S. Up to the first inflection point at an equilibrium concentration of between 2 and 3.6 mg/L according to the type of water, coverage is high, and only adsorbate/adsorbent interactions are considered. Given the structure and chemical composition of CBZ and clay, adsorption at this level should mainly result from hydrogen bonds. The energy involved is of course low and should not exceed 13 kJ/mol [37]. The quantities adsorbed in a monolayer are around 5.5 mg/g in pure water and 3.2 mg/g in tap water. Above the first inflection point, lateral interactions (adsorbate/adsorbent) occur at higher coverages (Figure 9).
Below the second inflection point, the two isotherms (type S) are modeled with the Sips model (Equation (1)). The Dubinin-Astakhov model is not suited to this situation. In pure water: nS = 3.0 ± 0.3, KS = 0.2 ± 0.1 L/mg, Qmax = 21 ± 2 mg/g, R² = 0.99, and in tap water: nS = 2.5 ± 0.1, KS = 0.26 ± 0.02 L/mg, Qmax = 17 ± 2 mg/g, R² = 0.99. The position of the heterogeneity index at around 1 provides an indication of the energy heterogeneity of the adsorbent surface as well as of the type of interaction in the adsorbent/adsorbate system. For the nS values obtained (nS > 1), the adsorption mechanism is largely dominated by lateral interactions between CBZ molecules [38]. The low values for affinity constants KS indicate that Rassoul < 20 has a very low affinity for CBZ. Above the second inflection point, multilayer adsorption continues (condensation) and the overall isotherm is modeled with a fourth-order polynomial (R² = 0.99).
3.2.2. Activated Carbon in Contact with Carbamazepine
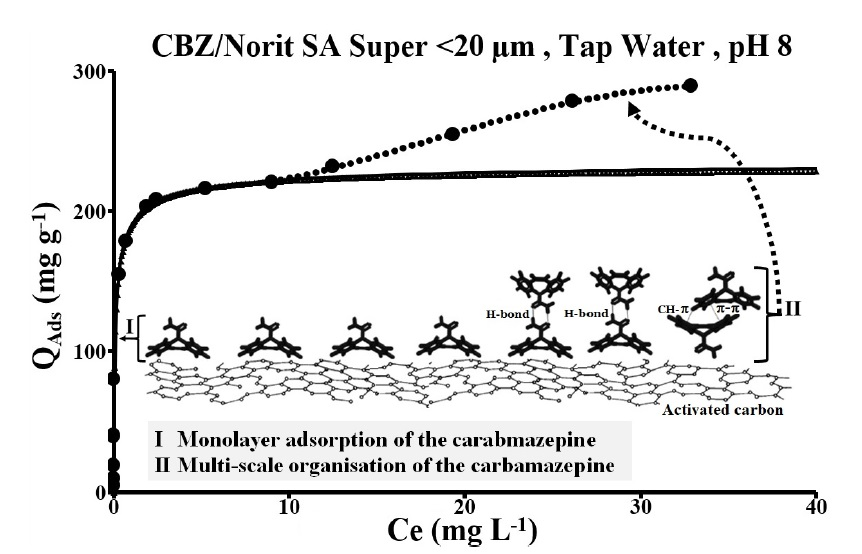
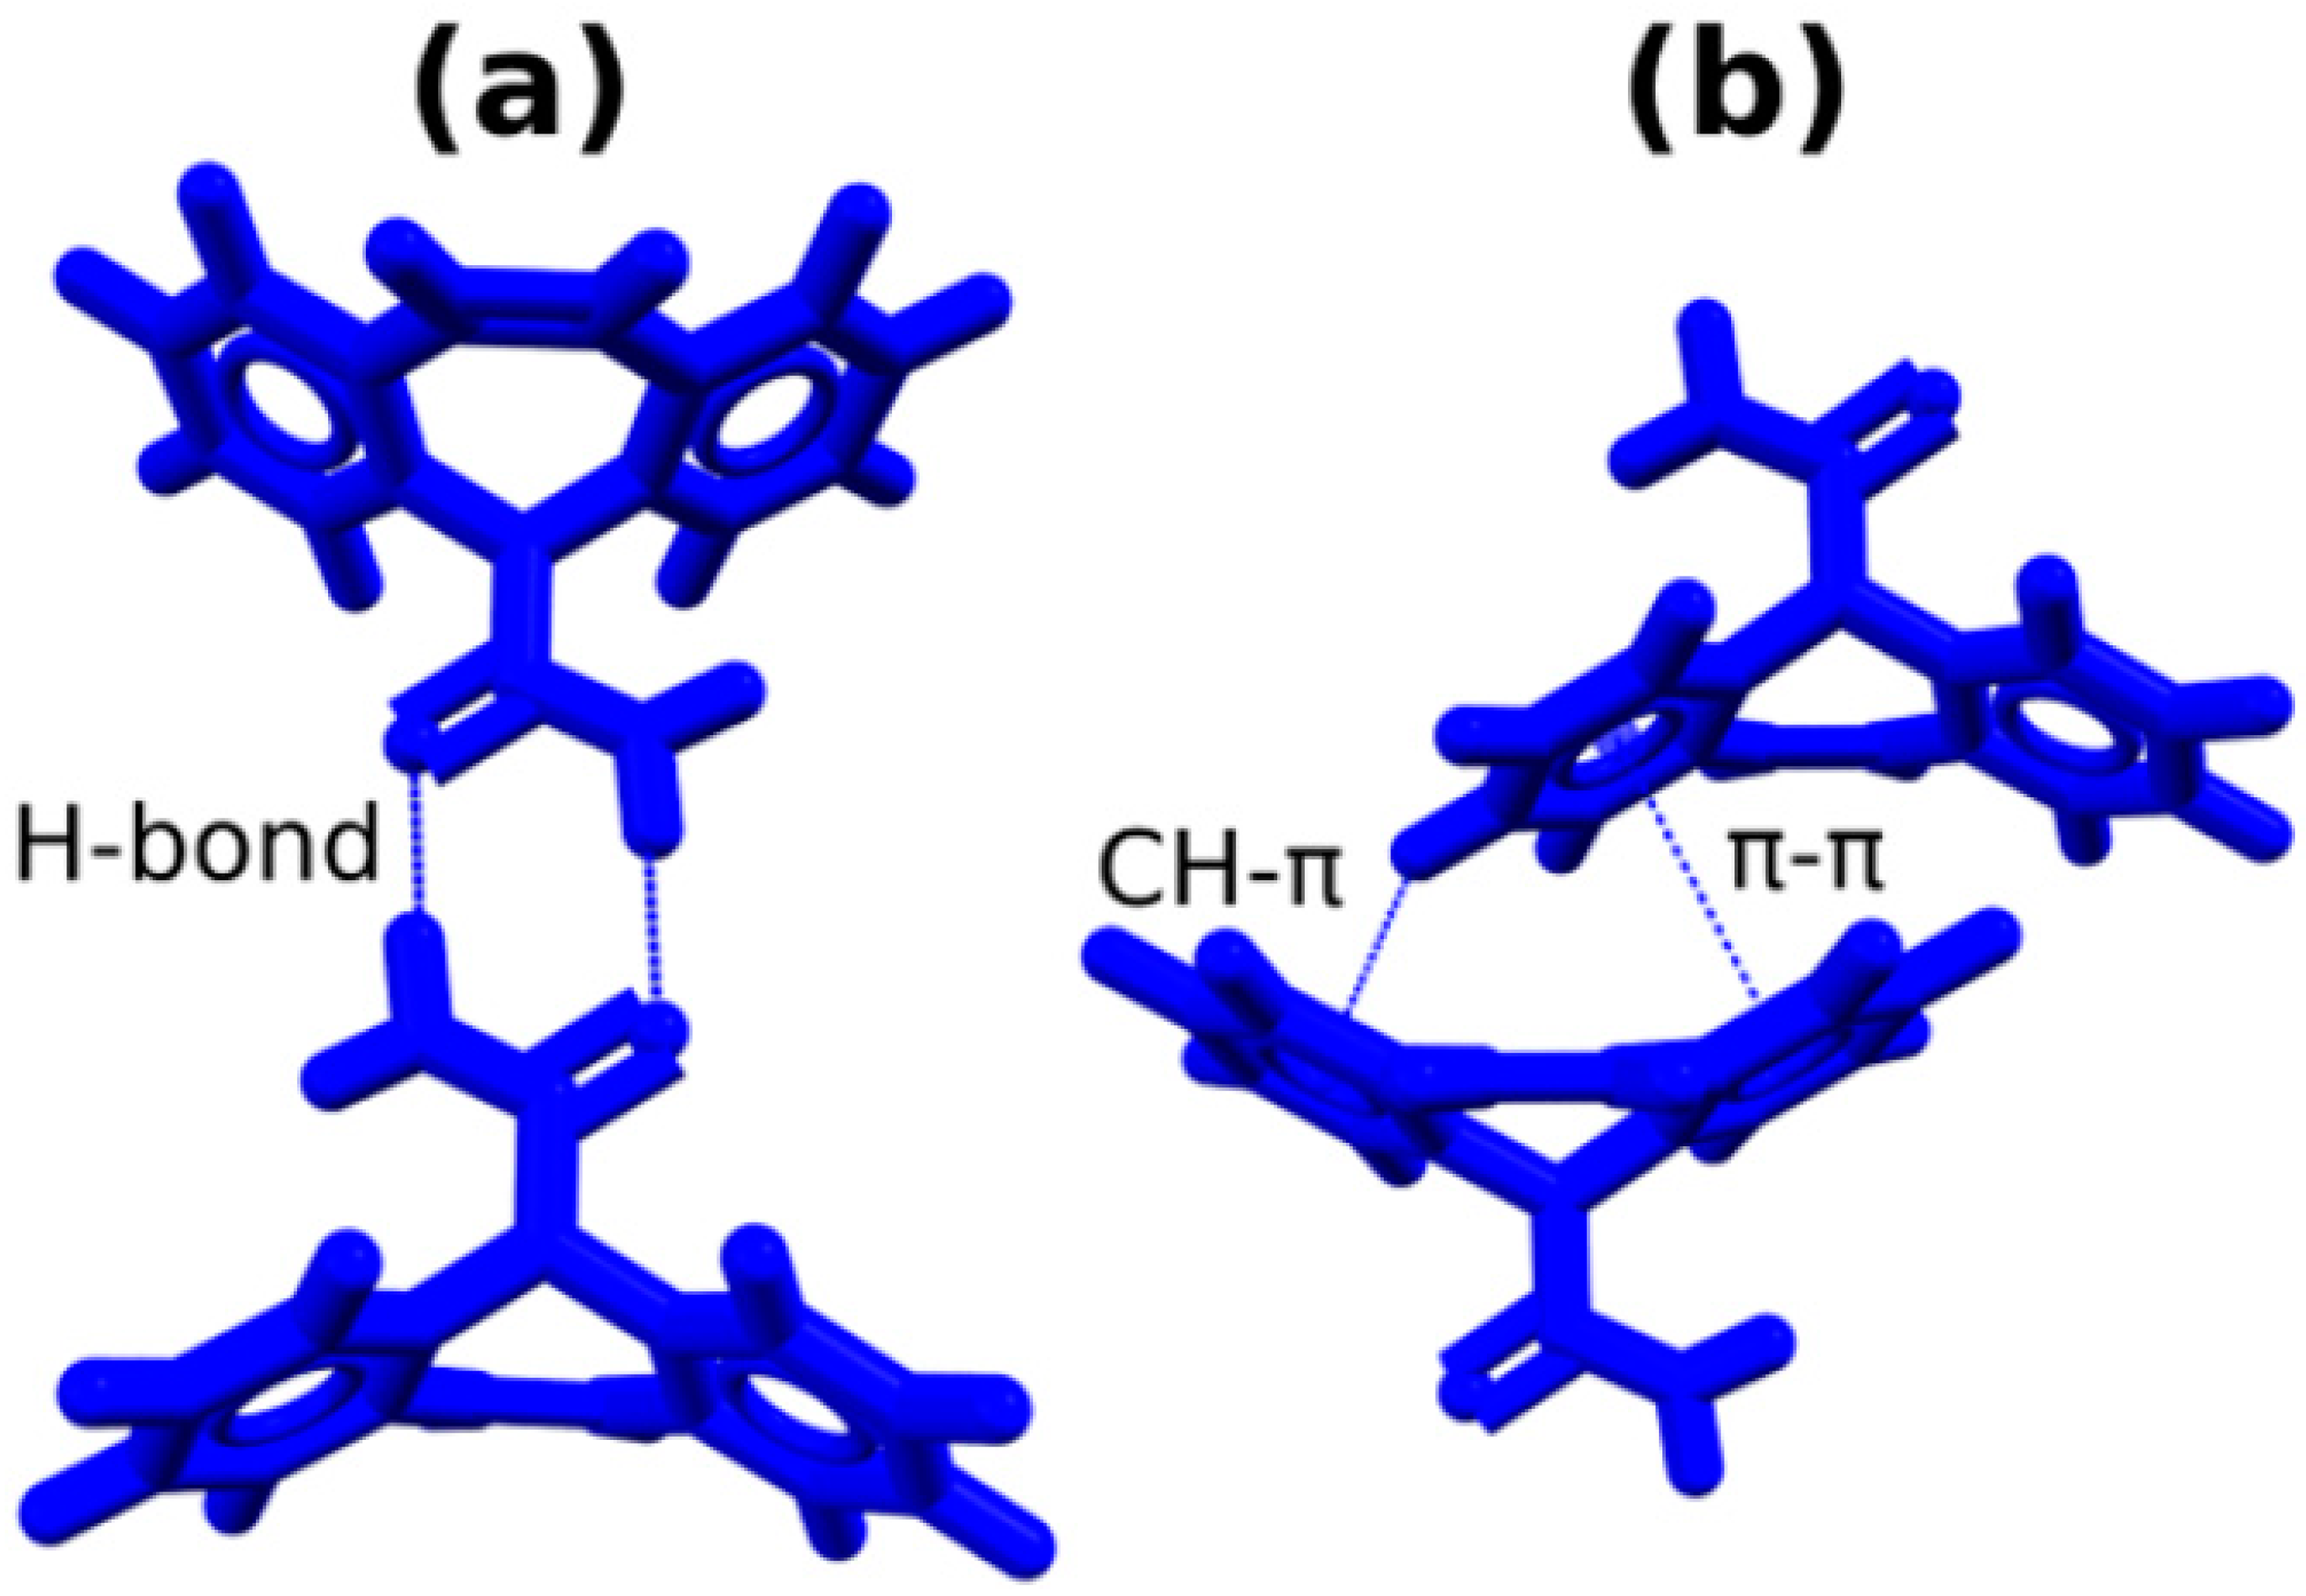
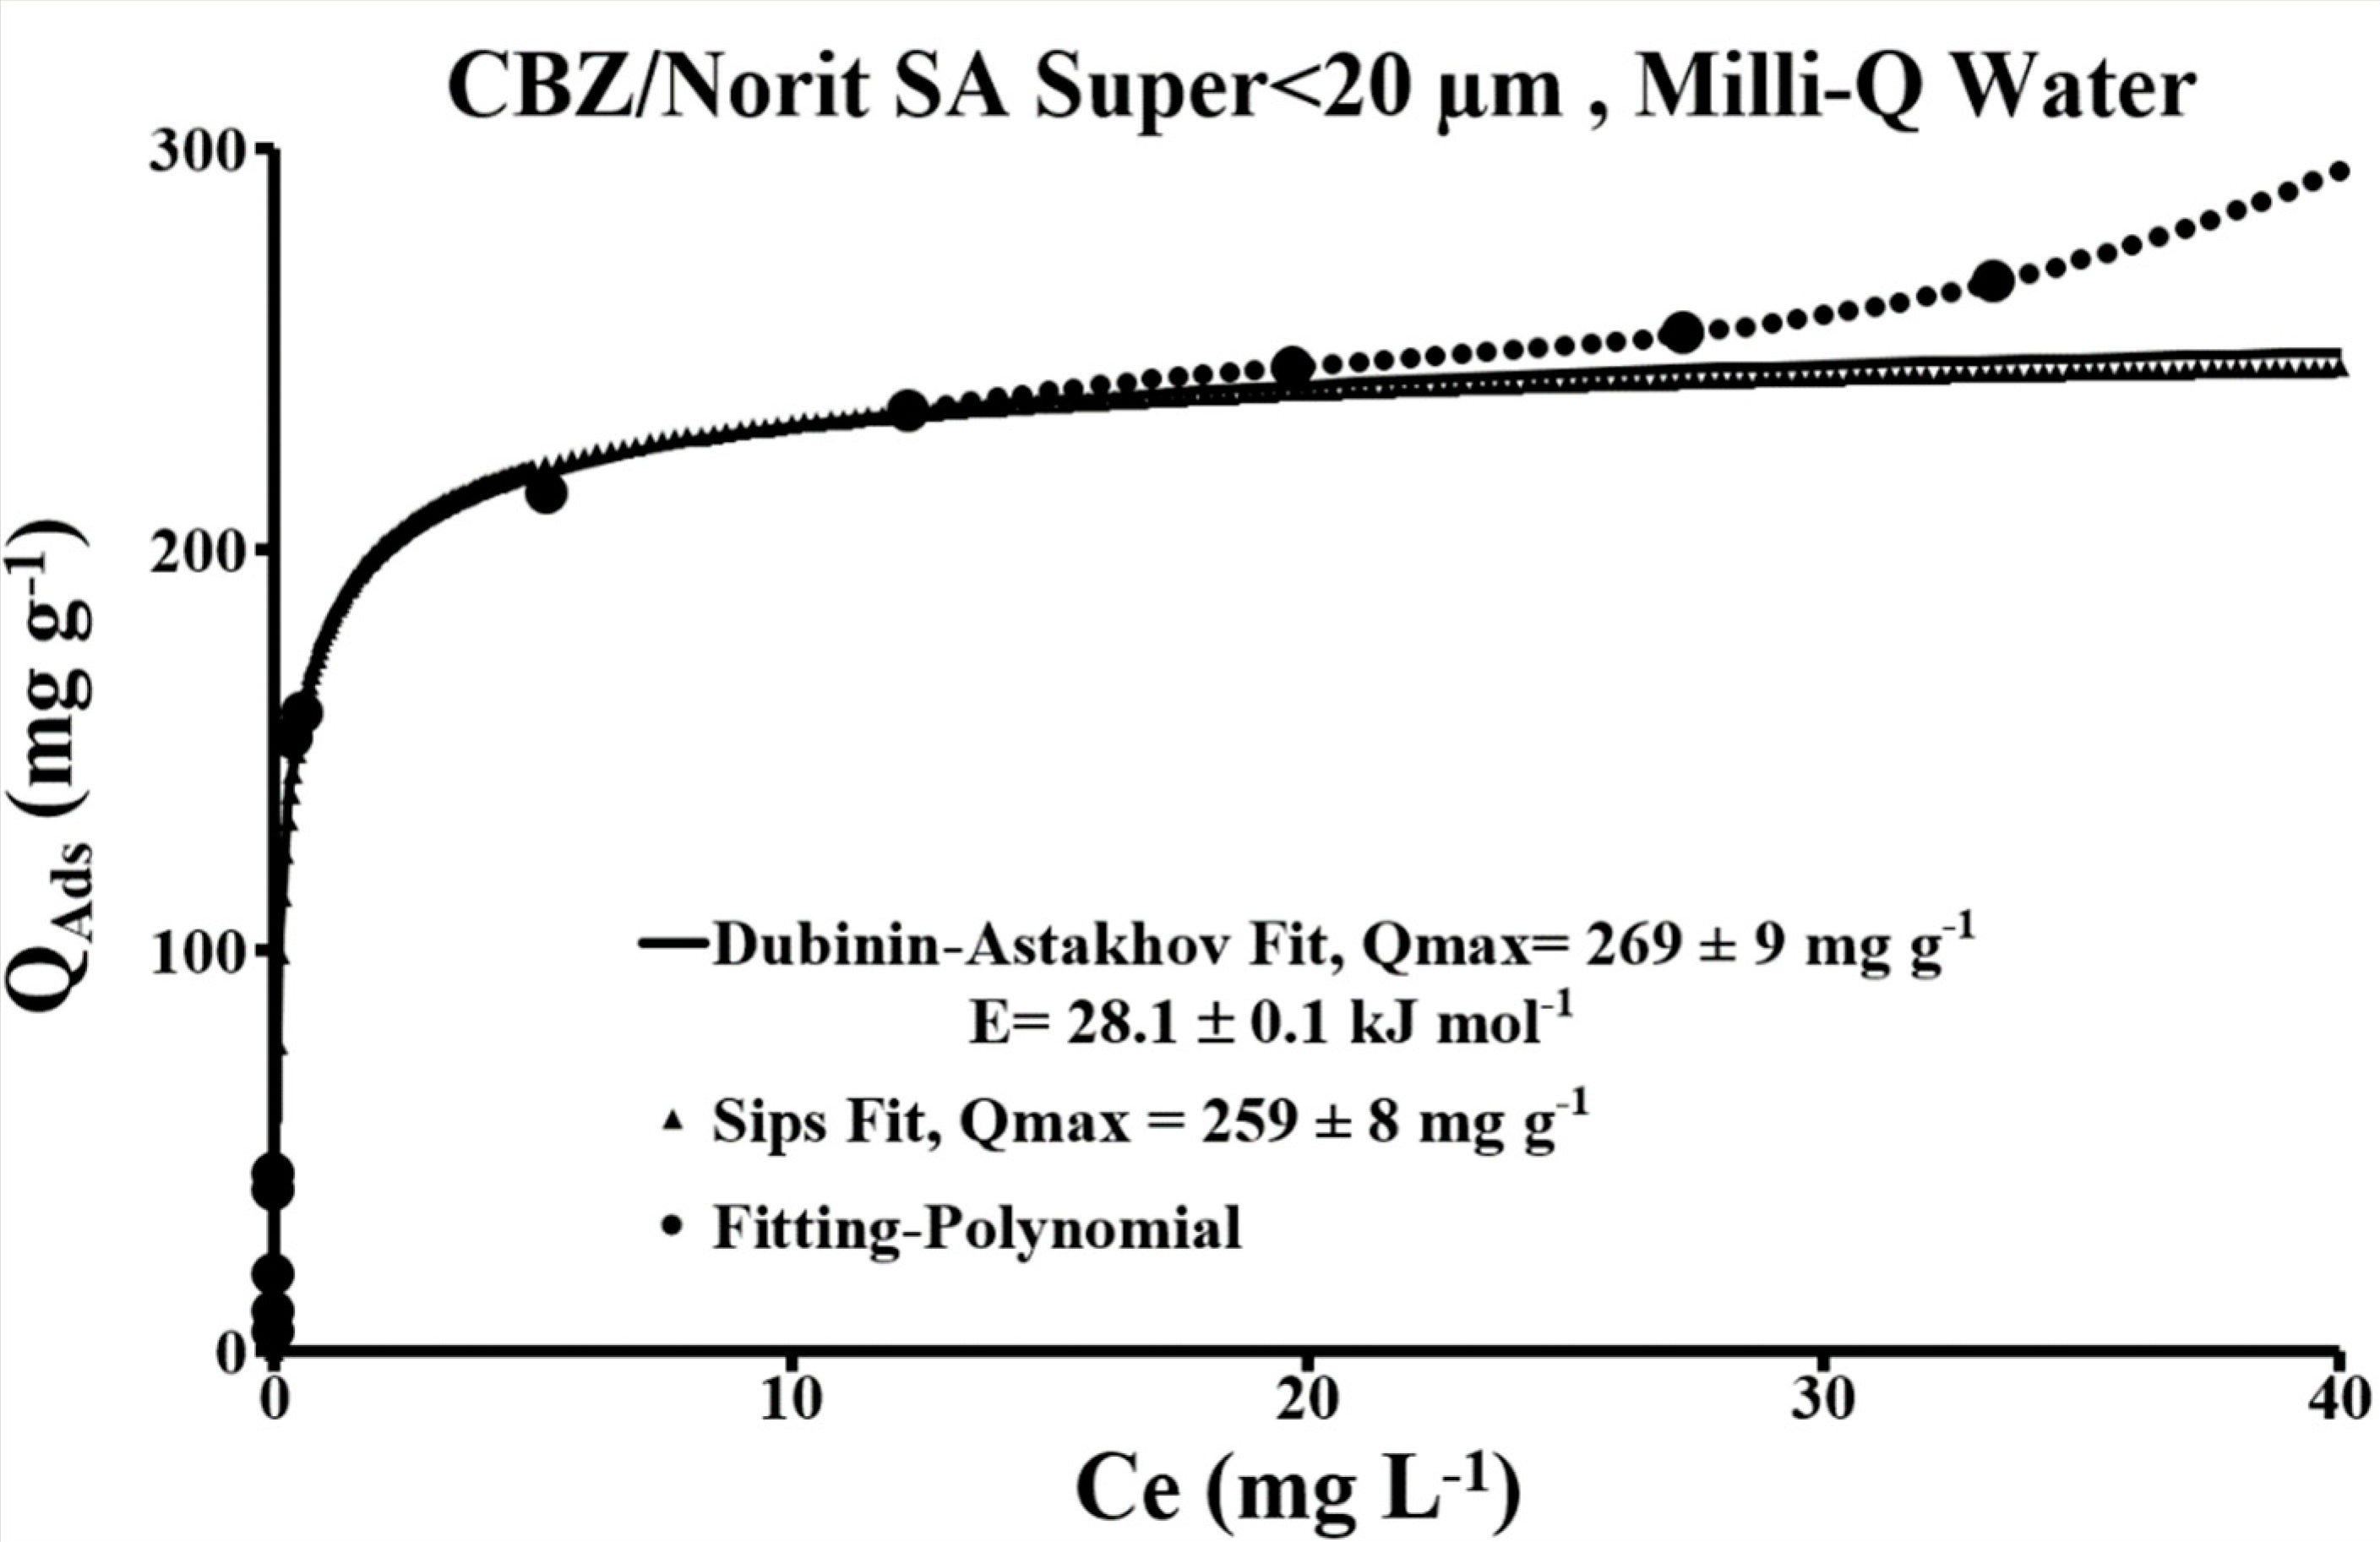
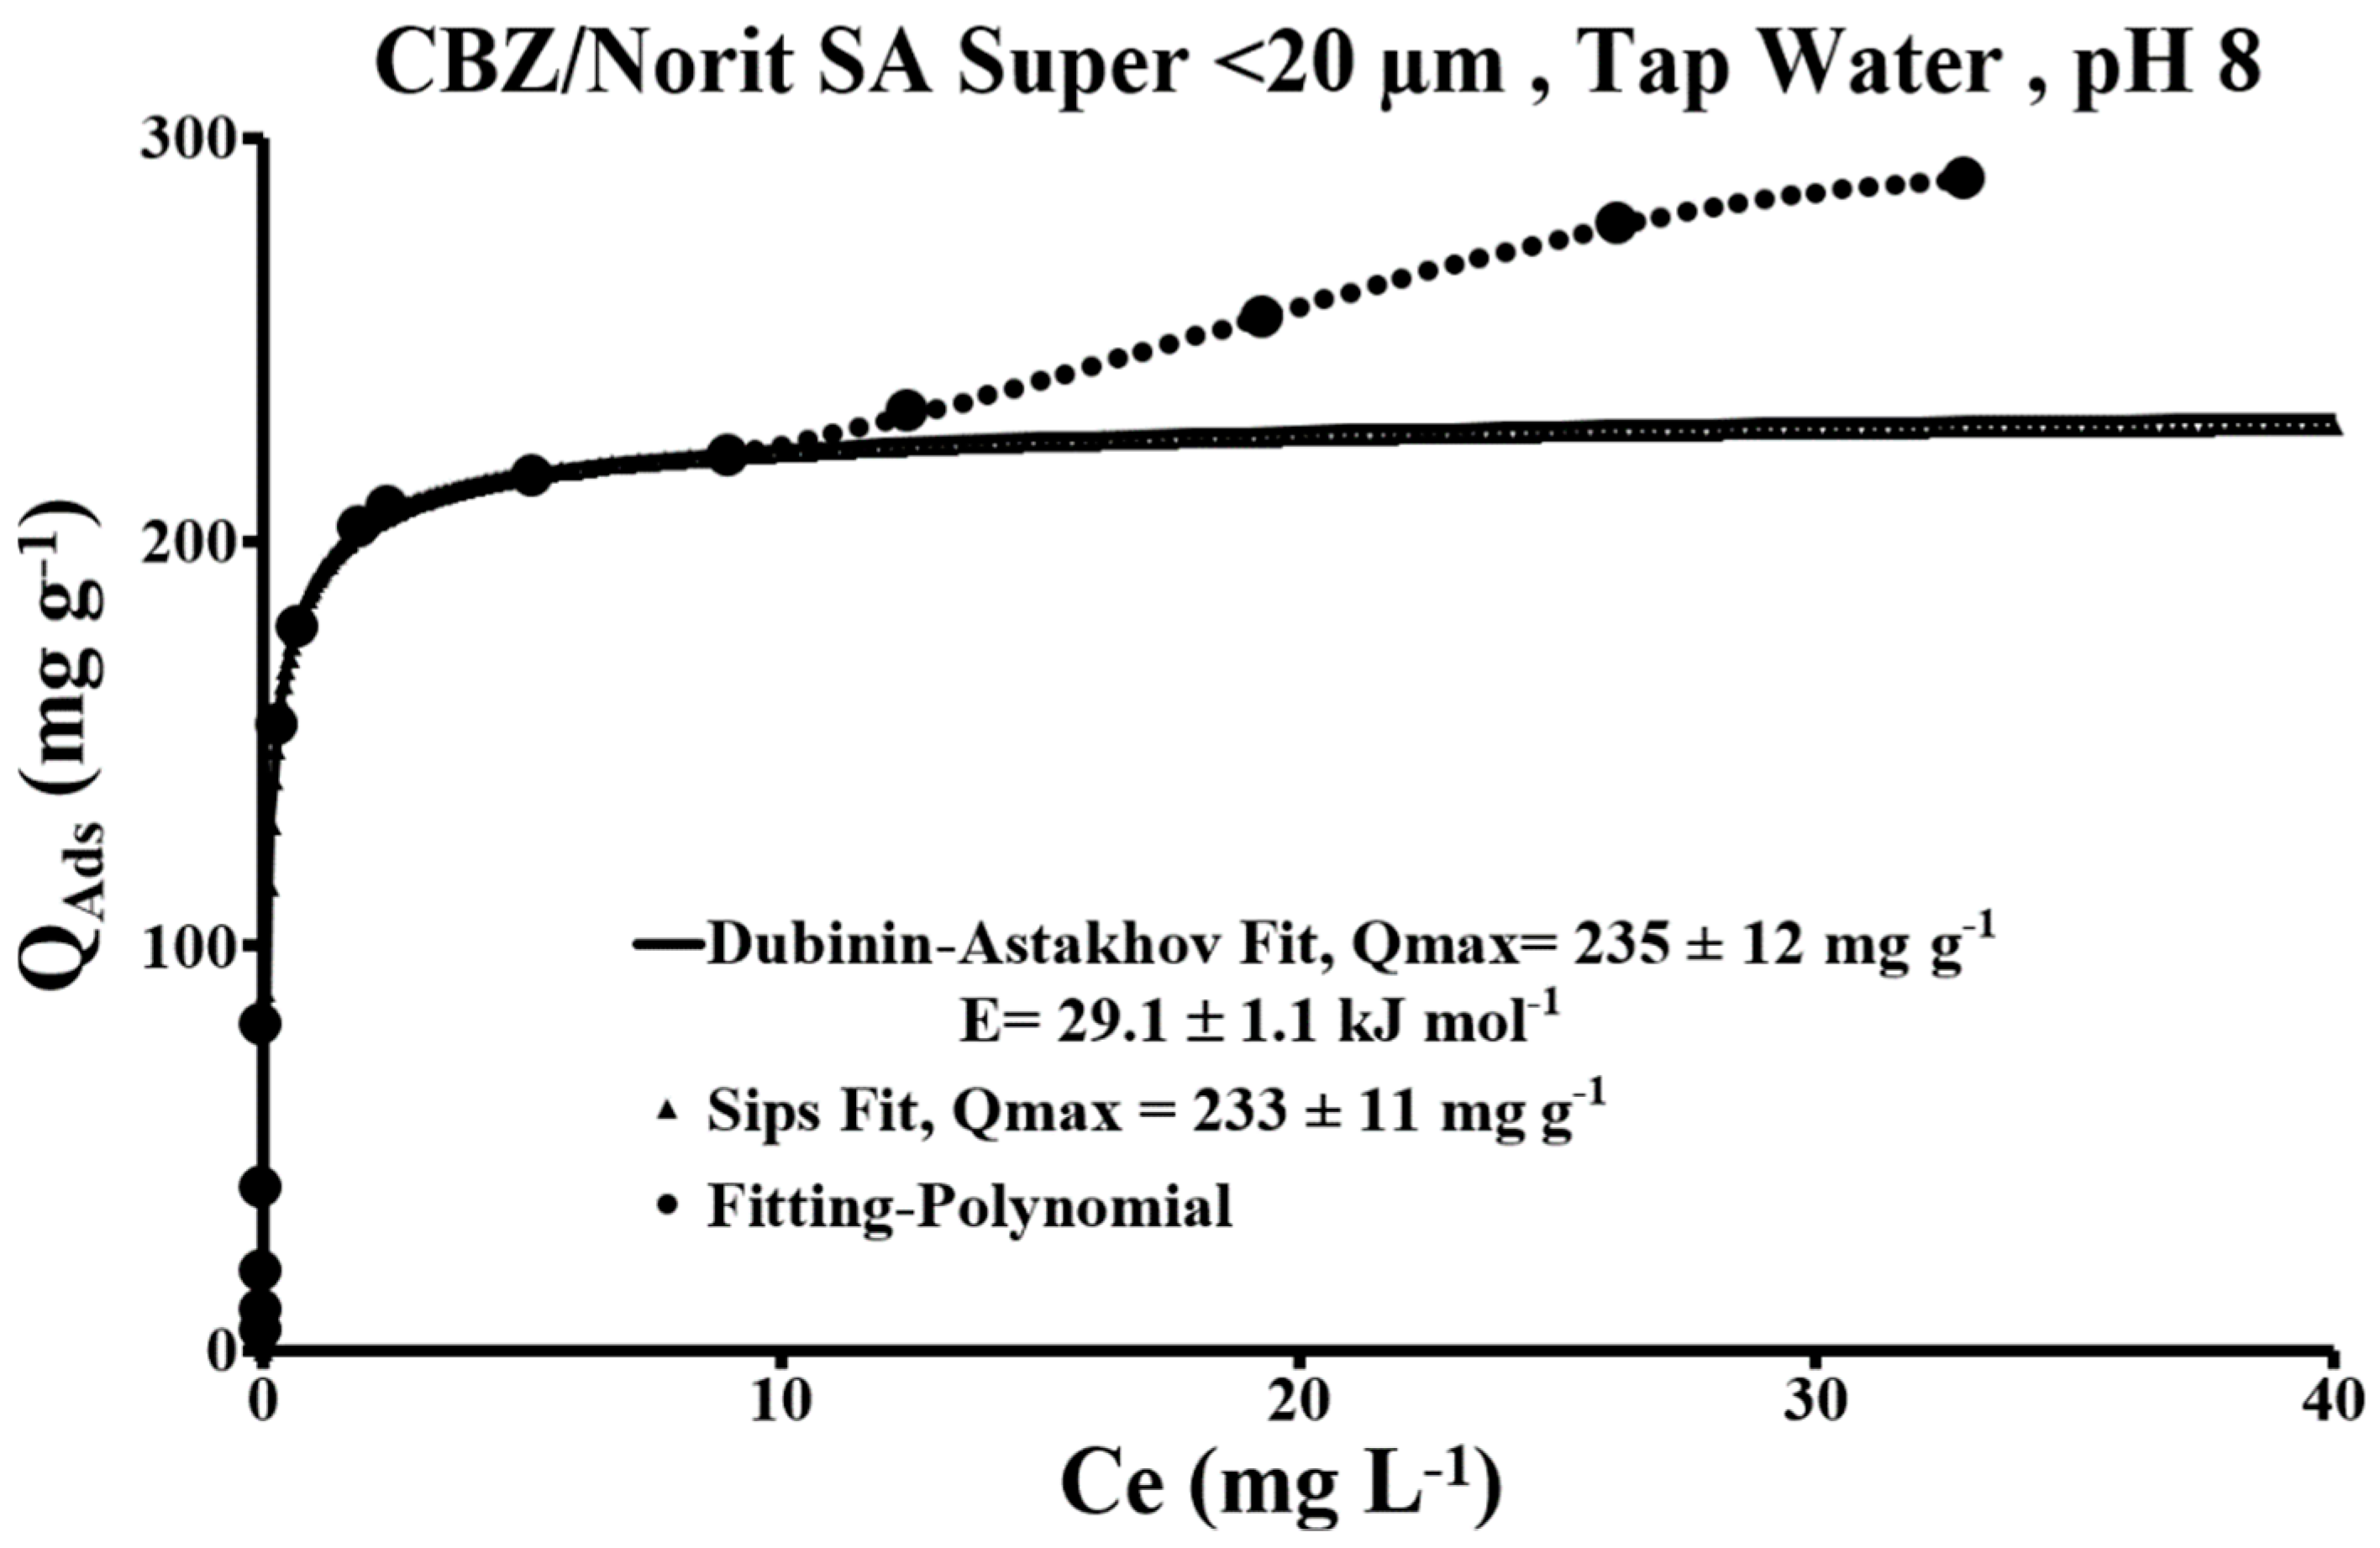
The shape of the activated carbon adsorption isotherms clearly shows that this carbon has a strong affinity for CBZ (Figure 10 and Figure 11). These isotherms can be split into three distinct regions: (1) an adsorption region with high relative energy represented by a vertical rise in the isotherm; (2) an increasing adsorption region represented by a curved isotherm. The isotherm shape in this location characterizes the presence of zones with heterogeneous surface energies, the most important rupture of which is located at an equilibrium concentration “Ce” of 12.5 mg/L for pure water and 9 mg/L for tap water; (3) an adsorption region marked by a slope change followed by an increasing adsorption step function. This shape characterizes the presence of a multi-scale organization of the CBZ layers. It is can be ascribed to the two-dimensional condensation of CBZ between the first layer of CBZ adsorbed by the activated carbon and a second layer of CBZ (adsorbent-adsorbate-adsorbate). This condensation may be linked to the formation—between the two CBZ layers—of hydrogen bonds, π − π bonds of parallel aromatic rings and CH- π bonds between aromatic rings and the CH branches opposite [39]. Below the rupture points (region 1 + region 2), the isotherms are type H2 according to Giles’ adsorption isotherm classification [40]. Monolayer adsorption with micropore filling (Ce < 13 mg/L) is perfectly modeled with the Sips model (Equation (1)) and the D-A model (Equation (2)). The relationship with experimental data is represented by a correlation coefficient R² of 0.99. In both types of water, at least 40 µg/g are totally adsorbed by this activated carbon (100% elimination).
In pure water, nD = 5.4 ± 0.1, E = 28 ± 1 kJ mol−1, nS = 0.57 ± 0.04, KS = 4.3 ± 0.8 L/mg, R² = 0.99, and in tap water, nD = 7.6 ± 0.1, E = 29 ± 1 kJ/mol, nS = 0.65 ± 0.17, KS = 9.5 ± 2 L/mg, R² = 0.99. These indicators clearly demonstrate that the electrolytes in tap water are a positive factor for CBZ adsorption in the micropores of activated carbon as they are larger in the presence of tap water.
In both types of water, the nD values are far greater than 2. They thus indicate that the internal surfaces of activated carbon micropores have a mildly heterogenous adsorption potential [22]. These values are corroborated by the nS values which are close to 1. The energy heterogeneity of these internal surfaces is even lower in the presence of tap water.
The average adsorption energy values obtained clearly show that (i) adsorption is dominated by intraparticle diffusion and that (ii) the adsorption mechanism developed between CBZ and activated carbon is built with stronger bonds than the hydrogen bonds (E > 13 kJ/mol).
The high adsorption activity of activated carbon is ascribed to its surface chemistry and functional groups, its texture, and the intrinsic properties of CBZ. On the basal surfaces of activated carbon, clouds of delocalized π electrons on the aromatic rings give activated carbon an excellent adsorption capacity for organic molecules [41]. Through its composition and structure, CBZ is able to form π-π stacking interactions between aromatic rings and the graphite plane of the activated carbon [42,43,44], and in particular the hydrogen bonds. CBZ’s amine group also reacts with the activated carbon’s other functional groups which contain oxygen, such as Carbonyl, quinone, and phenol (NH. . . O or NH. . . N). Furthermore, the addition of CH-π bonds (CBZ-PAC) can prove non-negligible [45]. Given these different possibilities, CBZ can be oriented in different directions around the sheets of activated carbon and inside the porous cavities.
In terms of adsorption, the isotherms were obtained at pH values close to the zero point of charge of the activated carbon (ZPC = 6.9 ± 0.1). Adsorption in pure water and in tap water show insignificant differences below the equilibrium concentration of 5.5 mg/L. Above this value, the gap widens. In the monolayer, at the pH of pure water (pH < ZPC), Norit < 20 adsorbs more CBZ (Qmax = 269 ± 9 mg/g) as these basic sites are rich in delocalized π electrons from the graphene layer [46]. The extension of the monolayer to pH 6 shifts the condensation range towards equilibrium concentrations higher than 12.5 mg/L. The difference due to condensation between pH 6 and 8 may simply be due to the transposition of the phenomenon to higher equilibrium concentrations.
4. Conclusions
This study is set against a backdrop of integrated environmental management of pharmaceutical products. It consisted mainly in (i) evaluating the CBZ adsorption performances for the principal mineral constituents of a natural soil, (ii) finding an efficient adsorbate to eliminate this organic molecule, and (iii) identifying the main mechanisms which produce adsorbent/adsorbate interactions. In addition to standard characterization methods, the optical properties of CBZ were identified in the range of interest. In the physico-chemical conditions applied, CBZ showed no affinity for the functional groups aluminol, silanol, or ferrol. Without organic matter, and in the pH range from 6 to 8.5, alumina, goethite, haematite, kaolinite, montmorillonite, and quartz did not adsorb this molecule. Rhassoul, a magnesian trioctahedral smectite containing saponin, adsorbed some CBZ, although not in an optimal or industrially applicable (i.e. for water treatment) manner. Based on data extracted from the literature, CBZ retention by soils has been shown to be mainly governed by the level of organic matter in the soil and by the soil’s closed micropores where this is the case. The Dubinin-Astakhov and Sips models designed for heterogeneous mineral surfaces faithfully reproduced the experimental results of CBZ adsorption isotherms with a correlation coefficient R² of 0.99. Adsorption in tap water, which is also a pioneering element of this study, showed that Norit SA Super activated carbon had an average CBZ adsorption rate of 235 ± 12 mg/g with 100% adsorption of at least 40 µg/g. Given the structure and chemistry of the surface of activated carbon and CBZ, the main adsorption mechanisms of this neutral molecule by activated carbon are π−π, CH−π, and hydrogen bonds.
Funding
This research received no external funding.
Acknowledgments
This study was done within the framework of the POLPHARMA Project ANR-15-CE04-0007. The author gratefully acknowledges the French National Research Agency and the BRGM for financial support. He also wishes to thank all those who contributed indirectly to the realization of this work. The author thank Miss Amina Kirri for performing the experimental batch adsorption (CBZ/Activated Carbon) tests during her Master II internship at BRGM.
Conflicts of Interest
The author declare that there are no conflicts of interest regarding the publication of this paper.
References
- Hai, F.I.; Yang, S.; Asif, M.B.; Sencadas, V.; Shawkat, S.; Sanderson-Smith, M.; Gorman, J.; Xu, Z.Q.; Yamamoto, K. Carbamazepine as a possible anthropogenic marker in water: Occurrences, toxicological effects, regulations and removal by wastewater treatment technologies. Water 2014, 10, 107. [Google Scholar] [CrossRef]
- Björlenius, B.; Ripszám, M.; Haglund, P.; Lindberg, R.H.; Tysklind, M.; Fick, J. Pharmaceutical residues arewidespread in Baltic Sea coastal and offshore waters—Screening for pharmaceuticals and modeling of environmental concentrations of carbamazepine. Sci. Total Environ. 2018, 633, 1496–1509. [Google Scholar] [CrossRef] [PubMed]
- Paz, A.; Tadmor, G.; Malchi, T.; Blotevogel, J.; Borch, T.; Polubesova, T.; Chefetz, B. Fate of carbamazepine, its metabolites, and lamotrigine in soils irrigated with reclaimed wastewater: Sorption, leaching and plant uptake. Chemosphere 2016, 160, 22–29. [Google Scholar] [CrossRef] [PubMed]
- Paíga, P.; Correia, M.; Fernandes, M.J.; Silva, A.; Carvalho, M.; Vieira, J.; Jorge, S.; Silva, J.G.; Freire, C.; Delerue-Matos, C. Assessment of 83 pharmaceuticals in WWTP influent and effluent samples by UHPLC-MS/MS: Hourly variation. Sci. Total Environ. 2019, 648, 582–600. [Google Scholar] [CrossRef] [PubMed]
- Kostich, M.S.; Batt, A.L.; Lazorchak, J.M. Concentrations of prioritized pharmaceuticals in effluents from 50 large wastewater treatment plants in the US and implications for risk estimation. Environ. Pollut. 2014, 184, 354–359. [Google Scholar] [CrossRef] [PubMed]
- Simazaki, D.; Kubota, R.; Suzuki, T.; Akiba, M.; Nishimura, T.; Kunikane, S. Occurrence of selected pharmaceuticals at drinking water purification plants in Japan and implications for human health. Water Res. 2015, 76, 187–200. [Google Scholar] [CrossRef] [PubMed]
- Tauxe Würsch, A. Wastewaters: Occurrence of Pharmaceutical Substances and Genotoxicity. Ph.D. Thesis, Federal Polytechnic School of Lausanne, Lausanne, Switzerland, 2005. [Google Scholar]
- Verlicchi, P.; Al Aukidy, M.; Zambello, E. Occurrence of pharmaceutical compounds in urban wastewater: Removal, mass load and environmental risk after a secondary treatment–A review. Sci. Total Environ. 2012, 429, 123–155. [Google Scholar] [CrossRef]
- Freitas, R.; Almeida, Â.; Calisto, V.; Velez, C.; Moreira, A.; Schneider, R.J.; Esteves, V.I.; Wrona, F.J.; Figueira, E.; Soares, A.M.V.M. The impacts of pharmaceutical drugs under ocean acidification: Newdata on single and combined long-term effects of carbamazepine on Scrobicularia plana. Sci. Total Environ. 2016, 541, 977–985. [Google Scholar] [CrossRef]
- Ferrari, B.; Paxéus, N.; Lo, G.R.; Pollio, A.; Garric, J. Ecotoxicological impact of pharmaceuticals found in treated wastewaters: Study of carbamazepine, clofibric acid, and diclofenac. Ecotoxicol. Environ. Saf. 2003, 55, 359–370. [Google Scholar] [CrossRef]
- Andreozzi, R.; Marotta, R.; Pinto, G.; Pollio, A. Carbamazepine in water: Persistence in the environment, ozonation treatment and preliminary assessment on algal toxicity. Water Res. 2002, 36, 2869–2877. [Google Scholar] [CrossRef]
- Riemenschneider, C.; Seiwert, B.; Moeder, M.; Schwarz, D.; Reemtsma, T. Extensive transformation of the pharmaceutical carbamazepine following uptake into intact tomato plants. Environ. Sci. Technol. 2017, 51, 6100–6109. [Google Scholar] [CrossRef] [PubMed]
- Pei, Z.; Li, L.; Sun, L.; Zhang, S.; Shan, X.Q.; Yang, S.; Wen, B. Adsorption characteristics of 1,2,4-trichlorobenzene, 2,4,6-trichlorophenol, 2-naphthol and naphthalene on graphene and graphene oxide. Carbon 2013, 51, 156–163. [Google Scholar] [CrossRef]
- Al-Khateeb, L.A.; Almotiry, S.; Abdel Salam, M. Adsorption of pharmaceutical pollutants onto graphene nanoplatelets. Chem. Eng. J. 2014, 248, 191–199. [Google Scholar] [CrossRef]
- Yu, Z.; Peldszus, S.; Huck, P.M. Adsorption characteristics of selected pharmaceuticals and an endocrine disrupting compound-naproxen, carbamazepine and nonylphenol-on activated carbon. Water Res. 2008, 42, 2873–2882. [Google Scholar] [CrossRef] [PubMed]
- Dong, H.; Zeng, G.; Tang, L.; Fan, C.; Zhang, C.; He, X.; He, Y. An overview on limitations of TiO2-based particles for photocatalytic degradation of organic pollutants and the corresponding countermeasures. Water Res. 2015, 79, 128–146. [Google Scholar] [CrossRef]
- Oturan, M.A.; Aaron, J.J. Advanced oxidation processes in water/wastewater treatment: Principles and applications—A review. Crit. Rev. Environ. Sci. Technol. 2014, 44, 2577–2641. [Google Scholar] [CrossRef]
- Takagi, K.; Kataoka, R.; Kamei, I.; Kiyota, H.; Sato, Y. Biodegradation of dieldrin by a soil fungus isolated from a soil with annual endosulfan applications. Environ. Sci. Technol. 2010, 44, 6343–6349. [Google Scholar]
- Wanga, J.; Bi, Y.; Pfister, G.; Henkelmann, B.; Zhu, K.; Schramm, K.W. Determination of PAH, PCB, and OCP in water from the three gorges reservoir accumulated by semipermeable membrane devices (SPMD). Chemosphere 2009, 75, 1119–1127. [Google Scholar] [CrossRef]
- Cox, M.; Négré, P.; Yurramendi, L. A Guide Book on the Treatment of Effluents from the Mining/Metallurgy, Paper, Plating and Textile Industries; Inasment-Tecnalia on behalf of the European Commission; INASMENT-Tecnalia: San Sebastian, Spain, 2006. [Google Scholar]
- Laurent, A.; Ettrup, K.; Kounina, A.; Hansen, S.F.; Meesters, J.A.J.; Vea, E.B. Development of comparative toxicity potentials of TiO2 nanoparticles for use in life cycle assessment. Environ. Sci. Technol. 2017, 51, 4027–4037. [Google Scholar]
- Ambrozini, B.; Pinto, M.A.L.; Ferreira, A.P.G.; Cavalheiro, É.T.G. Thermoanalytical studies of carbamazepine: Hydration/dehydration, thermal decomposition, and solid phase transitions. Braz. J. Pharm. Sci. 2014, 50, 877–884. [Google Scholar]
- A-Razzak, M.; Glen, R.C. Application of rule-induction in the derivation of quantitative structure-activity relationships. J. Comput. Aided Mol. Des. 1992, 6, 349–383. [Google Scholar] [CrossRef] [PubMed]
- Oppel, J.; Broll, G.; Löffler, D.; Meller, M.; Römbke, J.; Ternes, T. Leaching behaviour of pharmaceuticals in soil-testing-systems: A part of an environmental risk assessment for groundwater protection. Sci. Total Environ. 2005, 336, 285. [Google Scholar] [CrossRef]
- Mular, A.L.; Roberts, R.B. A simplified method to determine isoelectric points of oxides. Trans. Can. Inst. Min. Metall. 1966, 69, 438–439. [Google Scholar]
- Sips, R. On the structure of a catalyst surface. J. Chem. Phys. 1948, 16, 490–495. [Google Scholar] [CrossRef]
- Inglezakis, V.L. Solubility-normalized dubinin–astakhov adsorption isotherm for ion-exchange systems. Micropor. Mesopor. Mater. 2007, 103, 72–81. [Google Scholar] [CrossRef]
- Ouadjenia, F.; Marouf, R.; Schott, J.; Yahiaoui, A. Removal of Cu(II), Cd(II) and Cr(III) ions from aqueous solution by dam silt. Arab. J. Chem. 2013, 6, 401–406. [Google Scholar] [CrossRef] [Green Version]
- Moreno-Castilla, C. Micropore structure of activated carbons prepared from a Spanish subbituminous coal studied by CO2, benzene, and cyclohexane adsorption. Langmuir 1995, 11, 247–252. [Google Scholar] [CrossRef]
- Nghiem, L.; Schäfer, A.L.; Elimelech, M. Pharmaceutical retention mechanisms by nanofiltration membranes. Environ. Sci. Technol. 2005, 39, 7698–7705. [Google Scholar] [CrossRef]
- Sing, K.S.W.; Everett, D.H.; Haul, R.A.W.; Moscou, L.; Pierotti, R.A.; Rouquérol, J.; Siemieniewska, T. Reporting physisorption data for gas/solid systems with special refrence to the determination of surface area and porosity. Pure Appl. Chem. 1985, 57, 603–619. [Google Scholar] [CrossRef]
- Stoeckli, H.F. Microporous carbons and their characterization: The present state of the art. Carbon 1990, 28, 1–6. [Google Scholar] [CrossRef]
- Himes, V.L.; Mighell, A.D.; De Camp, W.H. Structure of carbamazepine: 5H-Dibenz[b,f]azepine-5-carboxamide. Acta Cryst. 1981, B37, 2242–2245. [Google Scholar] [CrossRef]
- Kareru, P.G.; Keriko, J.M.; Gachanja, A.N.; Kenji, G.M. Direct detection of triterpenoid saponins in medicinal plants. Afr. J. Trad. Complement. Altern. Med. 2008, 5, 56–60. [Google Scholar] [CrossRef] [PubMed]
- Dinda, B.; Debnath, S.; Mohanta, B.C.; Harigaya, Y. Naturally occurring triterpenoid saponins. Chem. Biodivers. 2010, 7, 2327–2580. [Google Scholar] [CrossRef] [PubMed]
- Czernicki, W.; Baranska, M. Carbamazepine polymorphs: Theoretical and experimental vibrational spectroscopy studies. Vib. Spectrosc. 2013, 65, 12–23. [Google Scholar] [CrossRef]
- Berg, J.M.; Tymoczko, J.L.; Stryer, L. Biochemistry, 5th ed.; W H Freeman: New York, NY, USA, 2002. [Google Scholar]
- Koopal, L.K.; Van Riemsdijk, W.H.; De Wit, J.C.M.; Benedetti, M.F. Analytical isotherm equations for multicomponent adsorption to heterogeneous surfaces. J. Colloid Interface Sci. 1994, 166, 51–60. [Google Scholar] [CrossRef]
- Brandenburg, J.G.; Potticary, J.; Sparkes, H.A.; Price, S.L.; Hall, S.R. Thermal expansion of carbamazepine: Systematic crystallographic measurements challenge quantum chemical calculations. J. Phys. Chem. Lett. 2017, 8, 4319–4324. [Google Scholar] [CrossRef]
- Giles, C.H.; Smith, D.; Huitson, A. A general treatment and classification of the solute adsorption isotherm. I. Theoretical. J. Colloid Interface Sci. 1974, 47, 755–765. [Google Scholar] [CrossRef]
- Moreno-Castilla, C. Adsorption of organic molecules from aqueous solutions on carbon materials. Carbon 2004, 42, 83–94. [Google Scholar] [CrossRef] [Green Version]
- Coughlin, R.W.; Ezra, F.S. Role of surface acidity in the adsorption of organic pollutants on the surface of carbon. Environ. Sci. Technol. 1968, 2, 291–297. [Google Scholar] [CrossRef]
- Hunter, C.A.; Singh, J.; Thornton, J.M. π-π interactions: The geometry and energetics of phenylalanine-phenylalanine interactions in proteins. J. Mol. Biol. 1991, 218, 837–846. [Google Scholar] [CrossRef]
- Haydar, S.; Ferro-García, M.A.; Rivera-Utrilla, J.; Joly, J.P. Adsorption of p-nitrophenol on an activated carbon with different oxidations. Carbon 2003, 41, 387–395. [Google Scholar] [CrossRef]
- Nishio, M.; Hirota, M.; Umezawa, Y. The CH/π Interaction: Evidence, Nature, and Consequences; Wiley-VCH: New York, NY, USA, 1998. [Google Scholar]
- Shafeeyan, M.S.; Daud, W.M.A.W.; Houshmand, A.; Shamiri, A. A review on surface modification of activated carbon for carbon dioxide adsorption. J. Anal. Appl. Pyrol. 2010, 89, 143–151. [Google Scholar] [CrossRef]
Figure 1.
Carbamazepine speciation as a function of pH calculated based on pKa1 = 1 and pKa2 = 13.9.
Figure 1.
Carbamazepine speciation as a function of pH calculated based on pKa1 = 1 and pKa2 = 13.9.

Figure 2.
Chemical structure and absorption spectra pf Carbamazepine (CBZ) from pH 3 to 11.

Figure 3.
Size distributions of SWy3 < 20, Rassoul < 20 and Norit < 20.

Figure 4.
N2 adsorption-desorption isotherm.

Figure 5.
The pore volume distribution according to Barrett, Joyner and Halenda method (BJH) applied to the desorption branch for SWy3 < 20 and Rassoul < 20.
Figure 5.
The pore volume distribution according to Barrett, Joyner and Halenda method (BJH) applied to the desorption branch for SWy3 < 20 and Rassoul < 20.

Figure 6.
The pore volume distribution according to BJH model applied to the desorption branch for Norit < 20.
Figure 6.
The pore volume distribution according to BJH model applied to the desorption branch for Norit < 20.

Figure 7.
CBZ adsorption isotherm on Rassoul < 20 at pH 6 in Milli-Q water solution.

Figure 8.
CBZ adsorption isotherm on Rassoul < 20 at pH 8 in tap water solution.

Figure 9.
CBZ/CBZ: (a) hydrogen bond (N···O distance), (b) π-stacking motifs (defined by the centroid of the π to C distance) [39].
Figure 9.
CBZ/CBZ: (a) hydrogen bond (N···O distance), (b) π-stacking motifs (defined by the centroid of the π to C distance) [39].

Figure 10.
CBZ adsorption isotherm on activate carbon NORIT SA SUPER<20 µm at pH 6 in Milli-Q water solution.
Figure 10.
CBZ adsorption isotherm on activate carbon NORIT SA SUPER<20 µm at pH 6 in Milli-Q water solution.

Figure 11.
CBZ adsorption isotherm on activate carbon NORIT SA SUPER<20 µm at pH 8 in tap water solution.
Figure 11.
CBZ adsorption isotherm on activate carbon NORIT SA SUPER<20 µm at pH 8 in tap water solution.


Table 1.
Main characteristics of the adsorbents used.
| Adsorbent | da µm | ZPC | SSBET m²/g | SSµP m²/g | Lµ-t-plot nm | VµP cm3/g | VmP cm3/g |
|---|---|---|---|---|---|---|---|
| Alumine-a | 0.3 | 8.2 | 6.7 | 0.0 | n.c | 0.00 | 0.01 |
| Quartz-a | 1.5 | 2.0 | 5.4 | 0.0 | n.c | 0.00 | 0.01 |
| Goethite | 1.2 | 7.9 | 14.2 | 0.0 | n.c | 0.00 | 0.03 |
| Hematite | 0.8 | 8.2 | 9.9 | 0.0 | n.c | 0.00 | 0.02 |
| K7A | 1.4 | 4.0 | 14.5 | 5.5 | 0.93 | 0.00 | 0.07 |
| SWy3 <20 µm | 3.4 | 7.0 | 41.9 | 12.5 | 0.98 | 0.01 | 0.08 |
| Rassoul <20 µm | 8.0 | 8.3 | 188.2 | 107.0 | 0.90 | 0.05 | 0.05 |
| Norit <20 µm | 9.0 | 6.9 | 989.3 | 693.5 | 1.74 | 0.30 | 0.32 |
da: average diameter. ZPC: zero point of charge. SSBET: BET Specific surface area. SSµP: Equivalent specific surface area of micropores obtained by application of t-plot method. Lµ-t-plot: Mean equivalent pore width (t-Plot). VµP: Specific micropore volume (t-Plot). VmP: Specific mesopore volume (BJH with parallel-sides slits-shaped). n.c: not concerned.
© 2019 by the author. Licensee MDPI, Basel, Switzerland. This article is an open access article distributed under the terms and conditions of the Creative Commons Attribution (CC BY) license (http://creativecommons.org/licenses/by/4.0/).
Share and Cite
MDPI and ACS Style
BIZI, M. Activated Carbon and the Principal Mineral Constituents of a Natural Soil in the Presence of Carbamazepine. Water 2019, 11, 2290. https://doi.org/10.3390/w11112290
AMA Style
BIZI M. Activated Carbon and the Principal Mineral Constituents of a Natural Soil in the Presence of Carbamazepine. Water. 2019; 11(11):2290. https://doi.org/10.3390/w11112290
Chicago/Turabian StyleBIZI, Mohamed. 2019. "Activated Carbon and the Principal Mineral Constituents of a Natural Soil in the Presence of Carbamazepine" Water 11, no. 11: 2290. https://doi.org/10.3390/w11112290
Note that from the first issue of 2016, this journal uses article numbers instead of page numbers. See further details here.