Multifractal Analysis of River Networks in an Urban Catchment on the Taihu Plain, China


1
School of Geography and Ocean Science, Nanjing University, Nanjing 210023, China
2
School of Economics, Zhejiang University of Finance & Economics, Hangzhou 310018, China
*
Author to whom correspondence should be addressed.
Water 2019, 11(11), 2283; https://doi.org/10.3390/w11112283
Submission received: 24 September 2019
/
Revised: 28 October 2019
/
Accepted: 30 October 2019
/
Published: 31 October 2019
(This article belongs to the Section Hydrology)
Abstract
:Multifractal analysis was successfully used to investigate the structure of river networks. In this paper, we performed a multifractal analysis of river networks in an urban catchment that is located on the Taihu Plain in the lower part of the Yangtze River Delta, China. Spatial and temporal variations in the river networks during the period 1960–2010 were investigated. The generalized multifractal dimensions (Dq) and the multifractal spectrum (f(α)) were calculated using a box-counting method. The results indicate that: (i) the river networks in Wuchengxiyu (WXCY), Yangchengdianmao (YCDM), and Hangjiahu (HJH) had obvious multifractal features with capacity dimensions between 1.90 and 1.91 during the period 1960–2010. The multifractal spectrums are asymmetrical inverted-hook-shaped curves with a dominant left arm. The variation in the singularity component (∆α) changed the most in WCXY (an increase of 7.9%), and the height variation in the multifractal spectrum (∆f) increased by 17.5% in HJH; (ii) the changes in ∆α and ∆f of the tributaries in the three areas during the period 1960–2010 were consistent with those of the overall river network, demonstrating the decisive role that the tributaries play in the complexity of the river networks; (iii) compared to the natural factors, the influences of urbanization on the river networks significantly changed with a higher urbanization level; and (iv) there were no border effects. Further applications of multifractal theory in analyses of the relationship between a flood-forming regime and the multifractal structures of river networks will attract more attention. Generally, this approach, when successfully applied to studies of changes in river networks, is of theoretical significance for better describing and quantifying the evolution of river networks’ structures.
1. Introduction
Mandelbrot (1967) first proposed the concept of a fractal when describing the characteristics of irregular coastlines in Britain [1]. Parisi and Frisch (1985) further developed the application of multifractal analysis [2]. Since then, multifractal analysis has been used to describe and distinguish many complex patterns, systems, and processes in nature. Compared to other research methods, multifractal analysis provides a more in-depth study of a material, as using the multifractal spectrum can reveal the properties of a singular distribution of quantities or states of a system [3].
Some earlier studies have found that multifractal analysis can be applied to river networks [4,5,6]. Large-scale river networks themselves are a kind of multifractal, and the sub-basins of river networks are also fractal with a partial range of fractal dimensions [7]. Subsequently, hydrologists and geomorphologists sought to discover fractal features in hydrological and geomorphological processes [8,9]. With the successful application of geometric fractal theory to explain the development of river networks at the end of the 20th century [10,11], studies on the evolution of river network patterns have been universally emphasized and carried out. Li et al. (2003) studied the fractal and multifractal characteristics of the landform hatching lines of different tectonic types in the Tianshan area of Xinjiang through the method of projection coverage [12]. Shen et al. (2009) used a multifractal spectrum to analyze the geomorphologic features of a watershed. The results showed that multifractals can provide new ideas for the quantitative study of geomorphological factors in the simulation of watershed hydrological processes and the prediction of regional soil erosion [13]. Zhang et al. (2011) accurately obtained information on the geomorphology of the Himalayas through a multifractal spectrum. Over time, research methods have gradually shifted from traditional paper maps to 3S technology [14]. In particular, the development of the digital elevation model (DEM) has had a profound impact on the extraction and analysis of spatial patterns of river networks [15,16,17,18]. The influences of DEM resolution and basin geometry are potential sources of error in a multifractal analysis [19]. Furthermore, beyond the description of the structural features of river networks, multifractal analysis performs well in the simulation of drainage networks [20].
Studying the structure of river networks is the foundation for understanding a watershed’s topography and hydrologic characteristics [21]. Accurately describing and estimating the changes in a drainage network’s structure is vital to measuring streamflow, sediment processes [22,23], processes of biodiversity dispersion [24], nutrient load, hydrological connectivity [25,26], and hydrological extremes [27,28] in a watershed. Although the evolution of a river network is a natural process, human activities dramatically affect the river network’s structure through urbanization and hydraulic engineering [29]. Urbanization has the most significant impact on river networks, with changes in 60% of the morphological parameters of river networks worldwide [30,31,32]. Therefore, it is necessary to study the structural dynamics of river networks from multiple perspectives under urbanization.
Multifractal analysis methods have typically been applied to the spatial patterns of the structure of river networks, particularly those of some small- and medium-scale natural basins [4,33] other than on large-scale plains with dense rivers. From the perspective of river geomorphology, the spatial patterns of the structure of large-scale river networks can be more comprehensively assessed by multifractal analysis than by fractal analysis. Taihu Lake Basin, which is located in the lower reaches of the Yangtze River Delta, has become one of the regions with the fastest-growing and highest level of urbanization in China. Drastic changes in the river network’s structure, flood disasters, and other water-associated environmental problems caused by rapid urbanization have attracted widespread concern both domestically and overseas [27,34,35,36,37,38,39,40,41]. The aims of this study are to interpret the morphological characteristics of the river network’s structure under a multifractal lens, to analyze the spatial and temporal dynamics of the river network’s structure over the past 50 years, and finally to reveal the relationship between the changes in the river network’s structure and the urbanization process.
2. Materials and Methods
2.1. Study Area
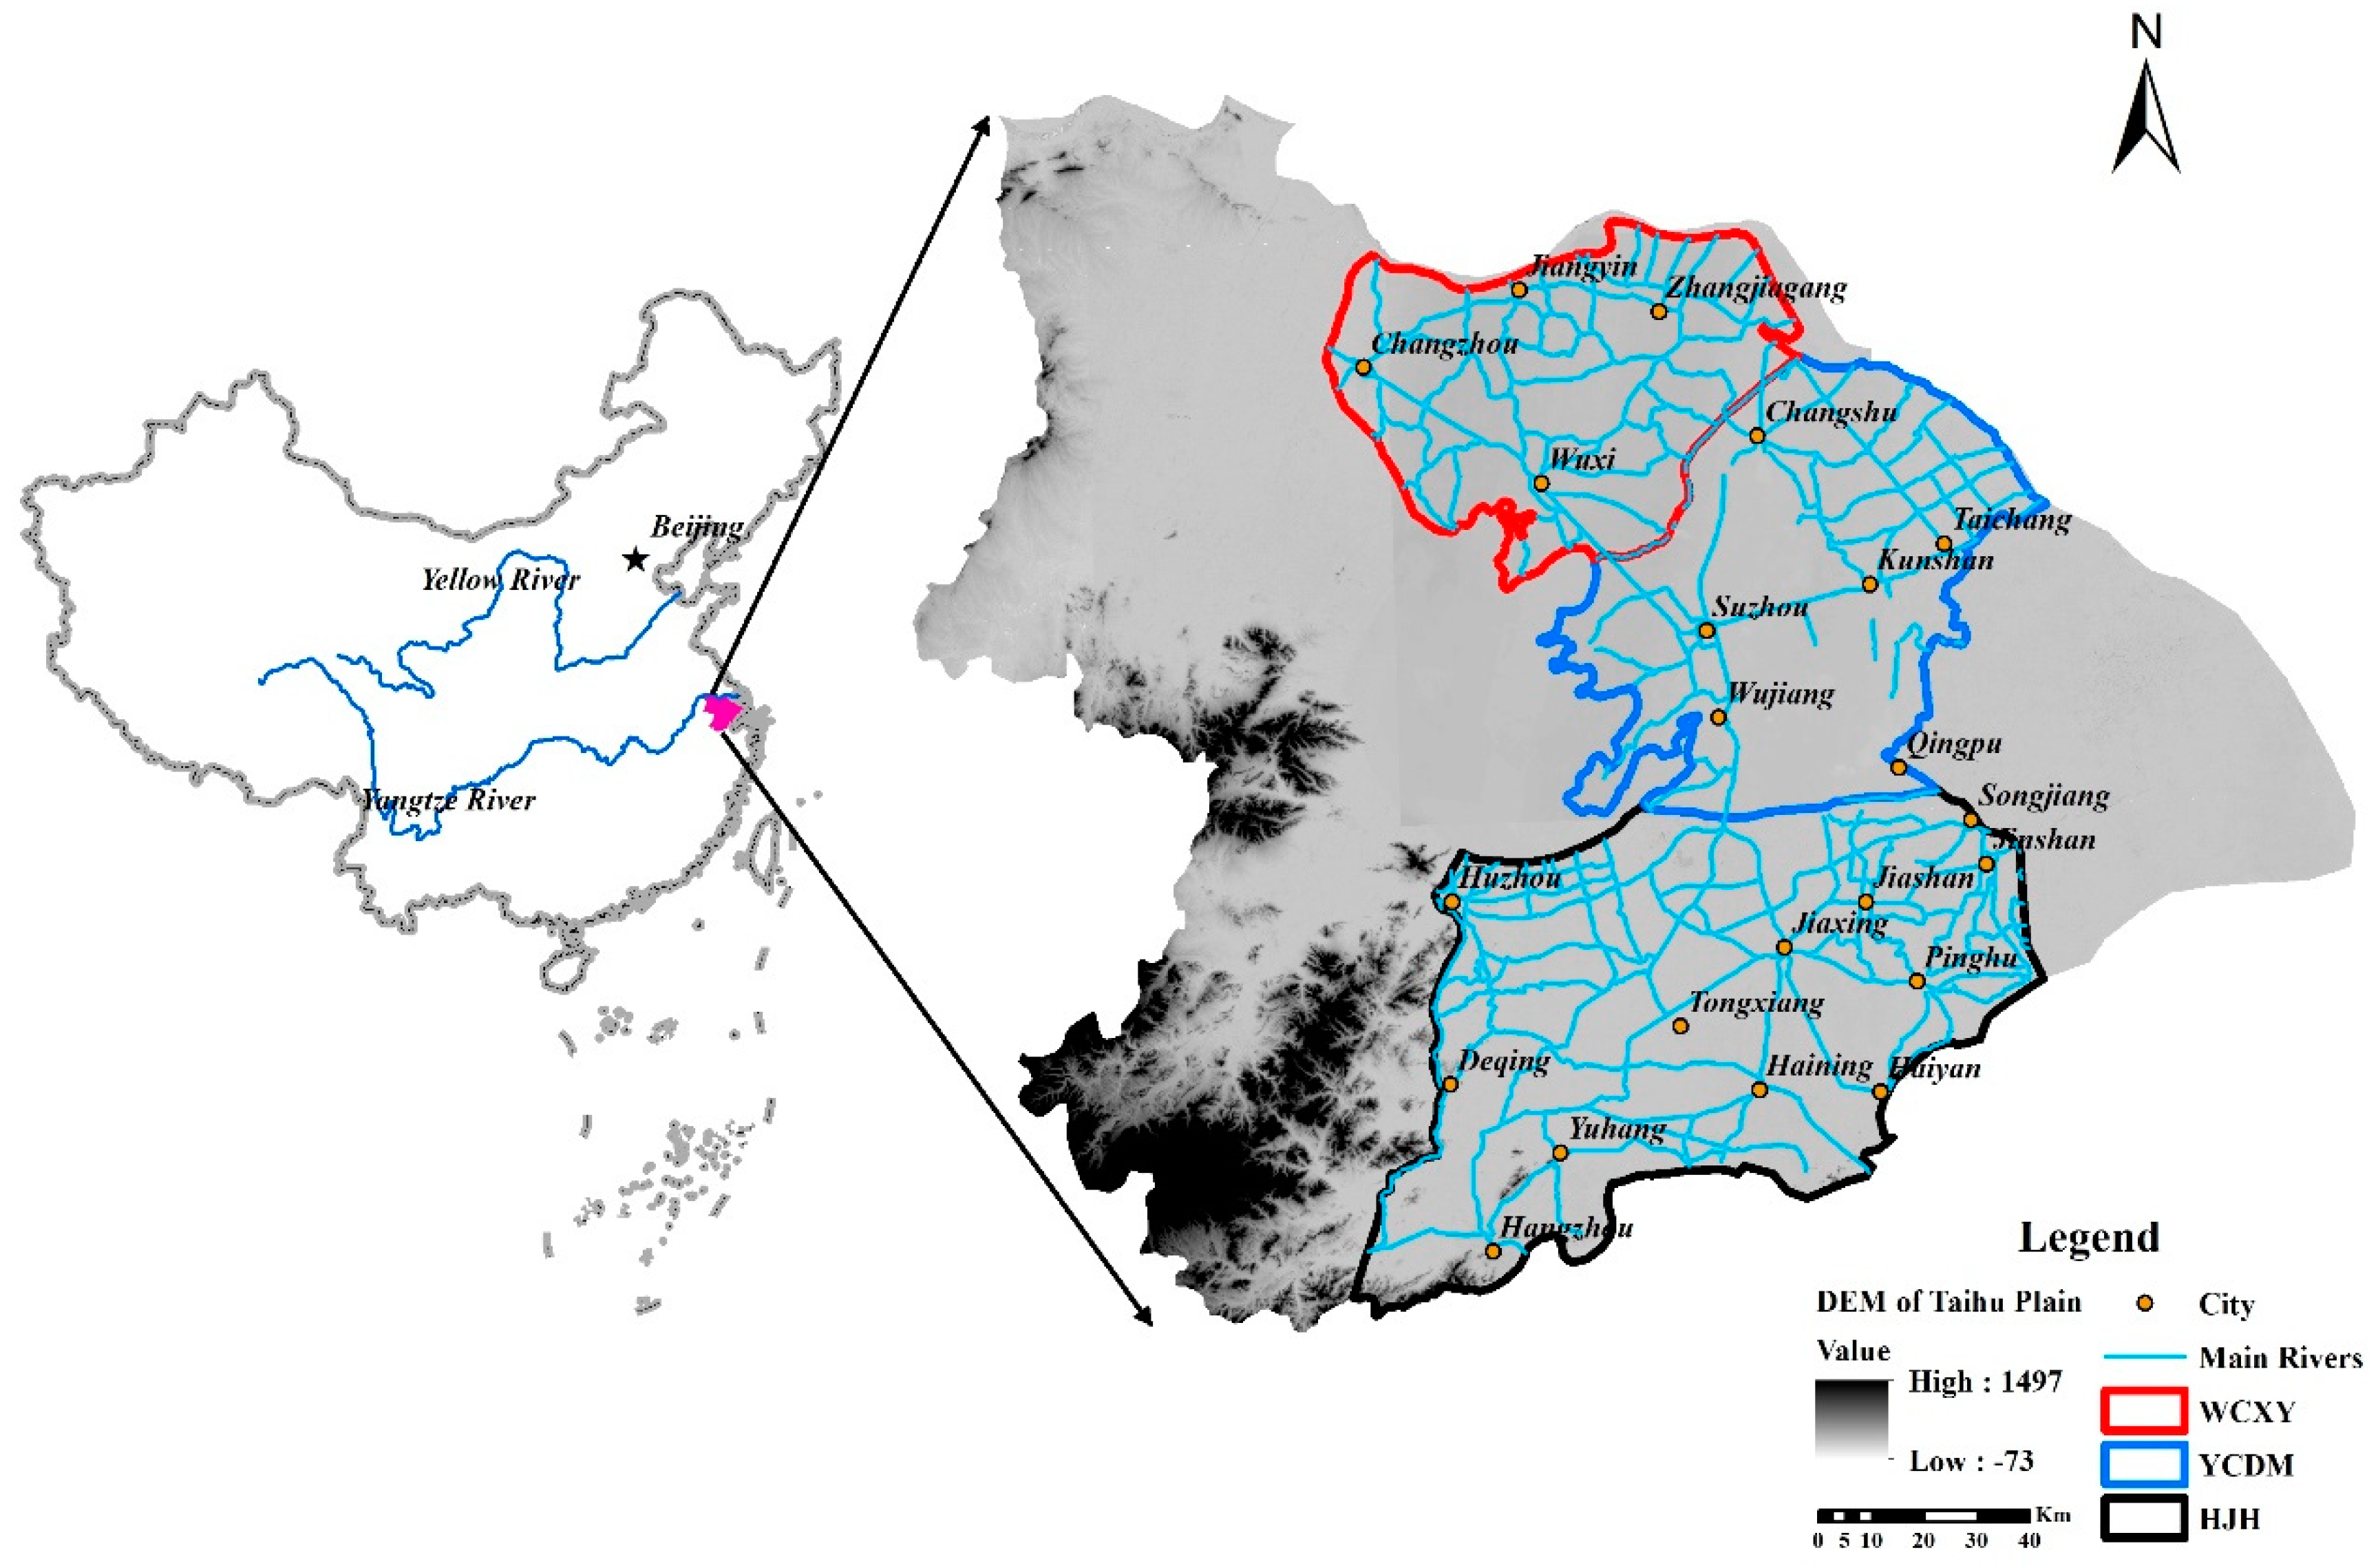
The Taihu Lake Basin is located in the core area of the Yangtze River Delta in eastern China, which includes the southern Jiangsu province, the northern Zhejiang province, most of Shanghai city, and a part of Anhui province. It has a total area of 3.69 × 10⁴ km2. The overall topography of the river basin has a saucer shape, and a low plateau depression is centered on Taihu Lake. Hills and plains are the two landform types of this area. The vast plain area in the central and eastern regions covers 29,556 km2, accounting for 80% of the total area. The Taihu Lake Basin boasts superior natural conditions, an abundance of products, and convenient transportation, and has been China’s major economic and cultural center since ancient times. However, the underlying surface of this region has undergone dramatic changes on account of rapid urbanization over the past 50 years, particularly the river networks of the plain area in the centre of Taihu Lake Basin. The rivers and lakes have experienced a significant reduction in volume in this area [25,35,36,37]. Therefore, we selected the Taihu Lake Plain, which is located in the core area of the Taihu Lake basin, as the study area (Figure 1). Its total area is 15,757 km2. It includes the three water conservancy divisions of Wuchengxiyu (WCXY), Yangchengdianmao (YCDM), and Hangjiahu (HJH), whose areas are 3928 km2, 4393 km2, and 7436 km2, respectively. Meteorologically, the Taihu Plain is a subtropical monsoon climate zone. It has an average temperature of 15–17 °C, and the temperature distribution is high in the south and low in the north. The spatial distribution of precipitation gradually decreases from southwest to northeast. The average annual amount of precipitation is 1115 mm. Affected by changes in monsoon intensity, the interannual variation in precipitation is obvious and the distribution of rainfall during the year is uneven.
Due to the acceleration of urbanization and the construction of hydraulic engineering facilities, a large number of natural river networks have been destroyed, which has significantly reduced the flood control capacity of the river networks, accelerating the transfer of flood risks from cities to regions and basins. Flood disasters have intensified due to the frequent extreme weather events in the part of the Taihu Plain area that is affected by the subtropical monsoon climate, seriously threatening the living environment of human beings and restricting the urbanization process and regional sustainable development. Therefore, there is an urgent need to investigate the changes in the river networks in the Taihu Plain area under urbanization.
2.2. Data Description
In order to investigate the multifractal behavior of river networks in the study area during different periods, the extraction of river networks was the first and basic step. Digital data on the river networks in the three areas during the 1960s and 1980s were derived from digitalized paper geographical maps at a scale of 1:50,000, and the data from the 2010s were obtained by digitizing 1:50,000 digital line graphics (DLGs). We first scanned and identified the river data from the paper geographical maps and the digital line graphics, and then digitalized or extracted them into different width lines to represent different river network orderings through ArcGIS 10.3. Finally, we used the results of a national water conservancy survey of China and the latest Google Earth remote sensing image in combination with a field investigation in typical areas for verification to ensure the correctness of the river network representations.
Referring to the river classification method named the Horton–Strahler principle [42], and combined with rivers’ natural and social features, we conducted a river network ordering for the study area. Rivers were divided into four hierarchies in WCXY, YCDM, and HJH. As shown in Table 1, main rivers include 1st-order and 2nd-order rivers, of which rivers wider than 40 m are identified as 1st-order, and 2nd-order rivers have widths that range from 20 m to 40 m. Those rivers with a width between 10 m and 20 m served as 3rd-order rivers. Rivers narrower than 10 m were classified as 4th-order rivers. 3rd- and 4th-order rivers were considered to be tributaries in this paper [36,37].
2.3. Methods
Mandelbrot (1972,1974) first proposed the multifractal theory [43,44], which was further developed by Frisch and Parisi (1985) to study turbulent dissipative phenomena [2]. Halsey et al. (1986) then applied the theory to the study of dynamic systems for analyzing strange attractors [45]. A single fractal has strict self-similarity and symmetry across different scales with a unique fractal dimension. In fact, dimensions are not the same at different scales, and it is insufficient to describe their characteristics. It is often necessary to describe them with multifractal dimensions [46]. In other words, a multifractal can be regarded as a cluster of single fractal sets with different dimensions [47,48,49]. These sets can be considered to be an infinite number of generalized dimensions, Dq, as well as through the formalism of the multifractal spectrum, f(α) [45].
We used the generalized fractal dimension (Dq) and the singularity spectrum (f(α)) of certain singularity exponents to measure the multifractal features. We adopted the box-counting method of fixed-size algorithms (FSA) [4,50] to analyze natural river networks in the Taihu Plain river network area. The steps for computing multifractal measures of the river networks of WCXY, YCDM, and HJH in different periods are as follows [5,46]:
(a) The determination of a multifractal spectrum should first calculate the river distribution probability Qi(ε) of statistical features on the corresponding fractal structure. A box of size ε × ε is used to cover the whole river network. Mi(ε) is the overall length of the rivers in box i, and the total length of the studied river network is denoted M. The distribution probability of Qi(ε) (1) within each box is obtained.
(b) Define the partition function Xq(ε) (2), which is the weighted sum of the distribution probability Qi(ε) of river networks to the q power.
N(ε) is the number of non-empty boxes in the whole river network under ε scale, and q∈(−∞, +∞) is the weight factor. A different q represents the important role that different river network distribution probability subsets play in the partition function. When Qi(ε) is subjected to multifractal natures, the partition function has a simple power law relationship (3) with the box size ε at different scales. τ(q) is the mass exponent of the q power, and it can be computed through the slope of the fitting straight line of ln(Xq(ε))~ln(ε).
(c) The multifractal dimension Dq is defined as Equation (4), where q is the moment order, and Dq varies with the variation in q. D0 is called the “capacity dimension” when q = 0. Dq = 1 is the “information entropy”, and τ(q) is differentiable when q = 1. The limit dimensions D−∞ and D+∞ describe the scaling behavior of the regions where the measures are most concentrated or rarefied, respectively.
(d) Establish the multifractal spectrum f(α) (5). f(α) can be obtained by means of the “Legendre transform” through expression (4), as defined by the relations:
where α is the Lipschitz–Hölder exponent. Each point on the f(α)~α curve represents the fractal dimension of the subset of the same singular exponent α [46].
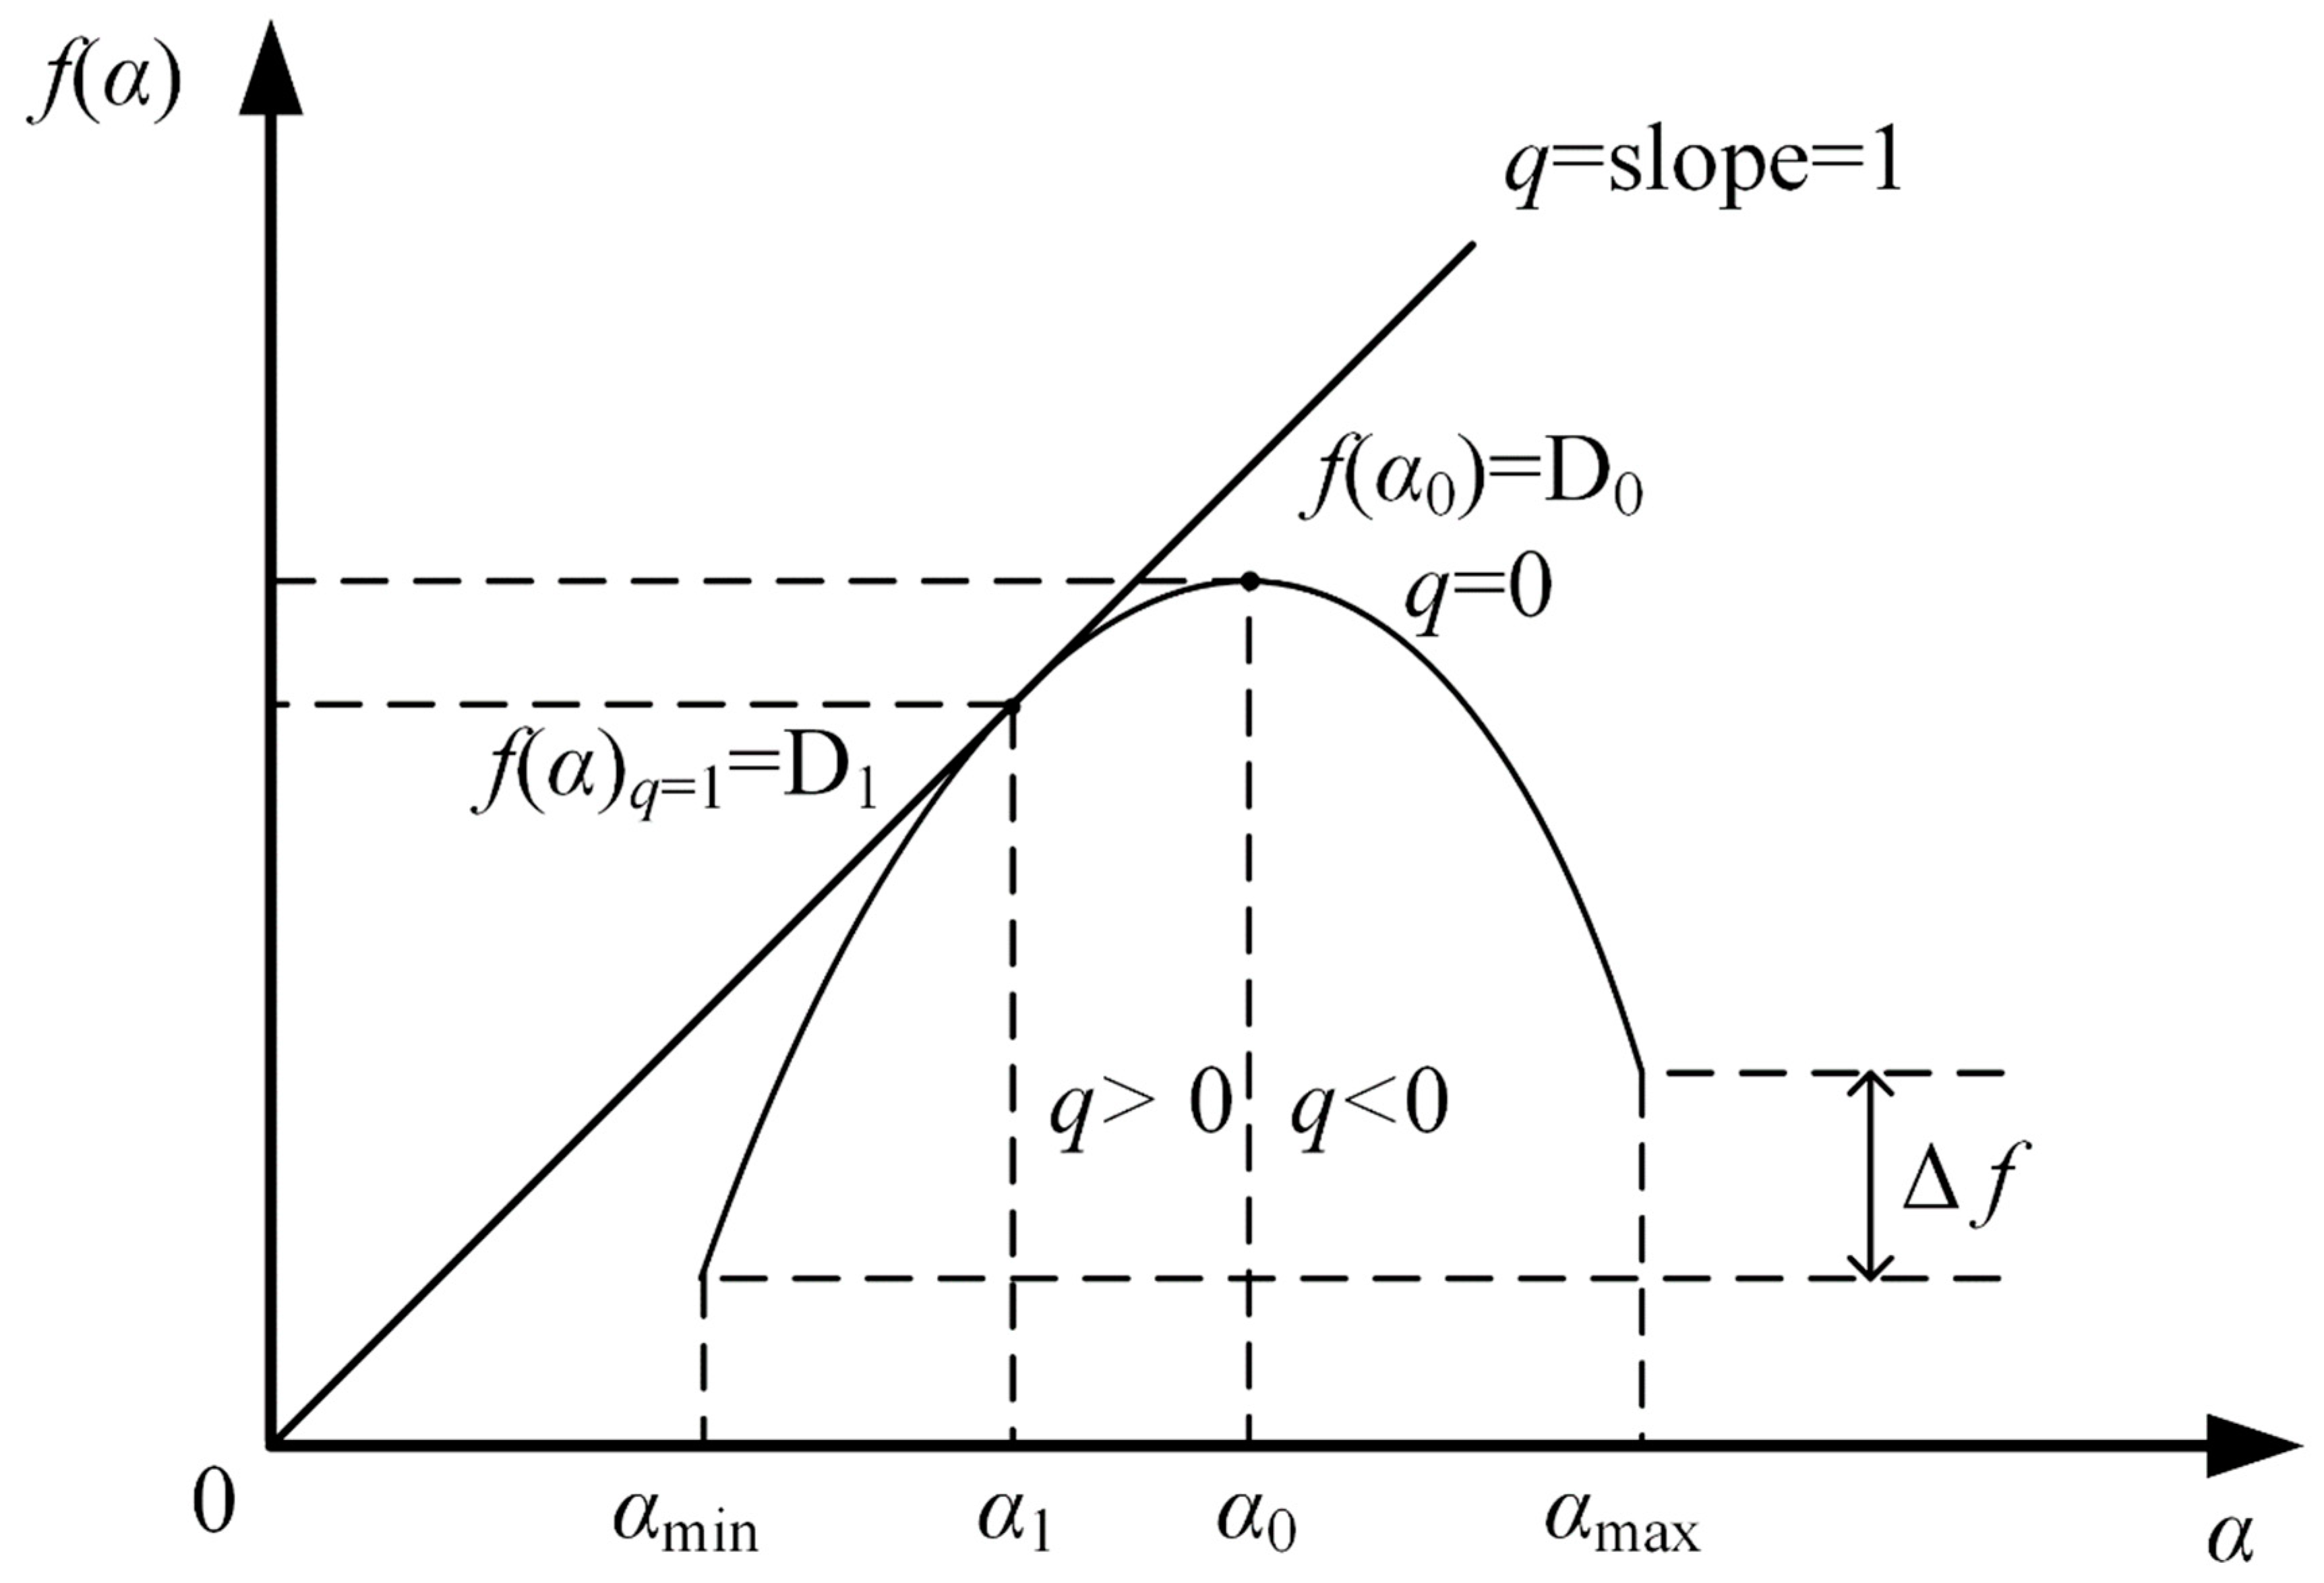
A typical multifractal spectrum is usually a unimodal function with smooth curves, either bell-shaped or hooked, which provides more structural information (Figure 2). The multifractal spectrum measures the complexity, irregularity, and unevenness of the fractal structure, while a different singularity exponent α reflects the natures of different probability measure subsets. The width of the multifractal spectrum quantitatively describes the degree and the range of variation within the fractal structure, and it can be defined as Δα (6). The larger Δα is, the more obvious the polarization trend is. In contrast, as the internal difference in the fractal structure decreases, the distribution area of each subset becomes more concentrated and uniform. The variation in height of the multifractal spectrum (Δf) (7) mainly reflects the general subsets of all series. The high-probability subsets dominate the trend when Δf > 0, and vice versa. If Δf = 0, the quantities of both subsets are equal.
3. Results
3.1. Determination of Multifractal Features
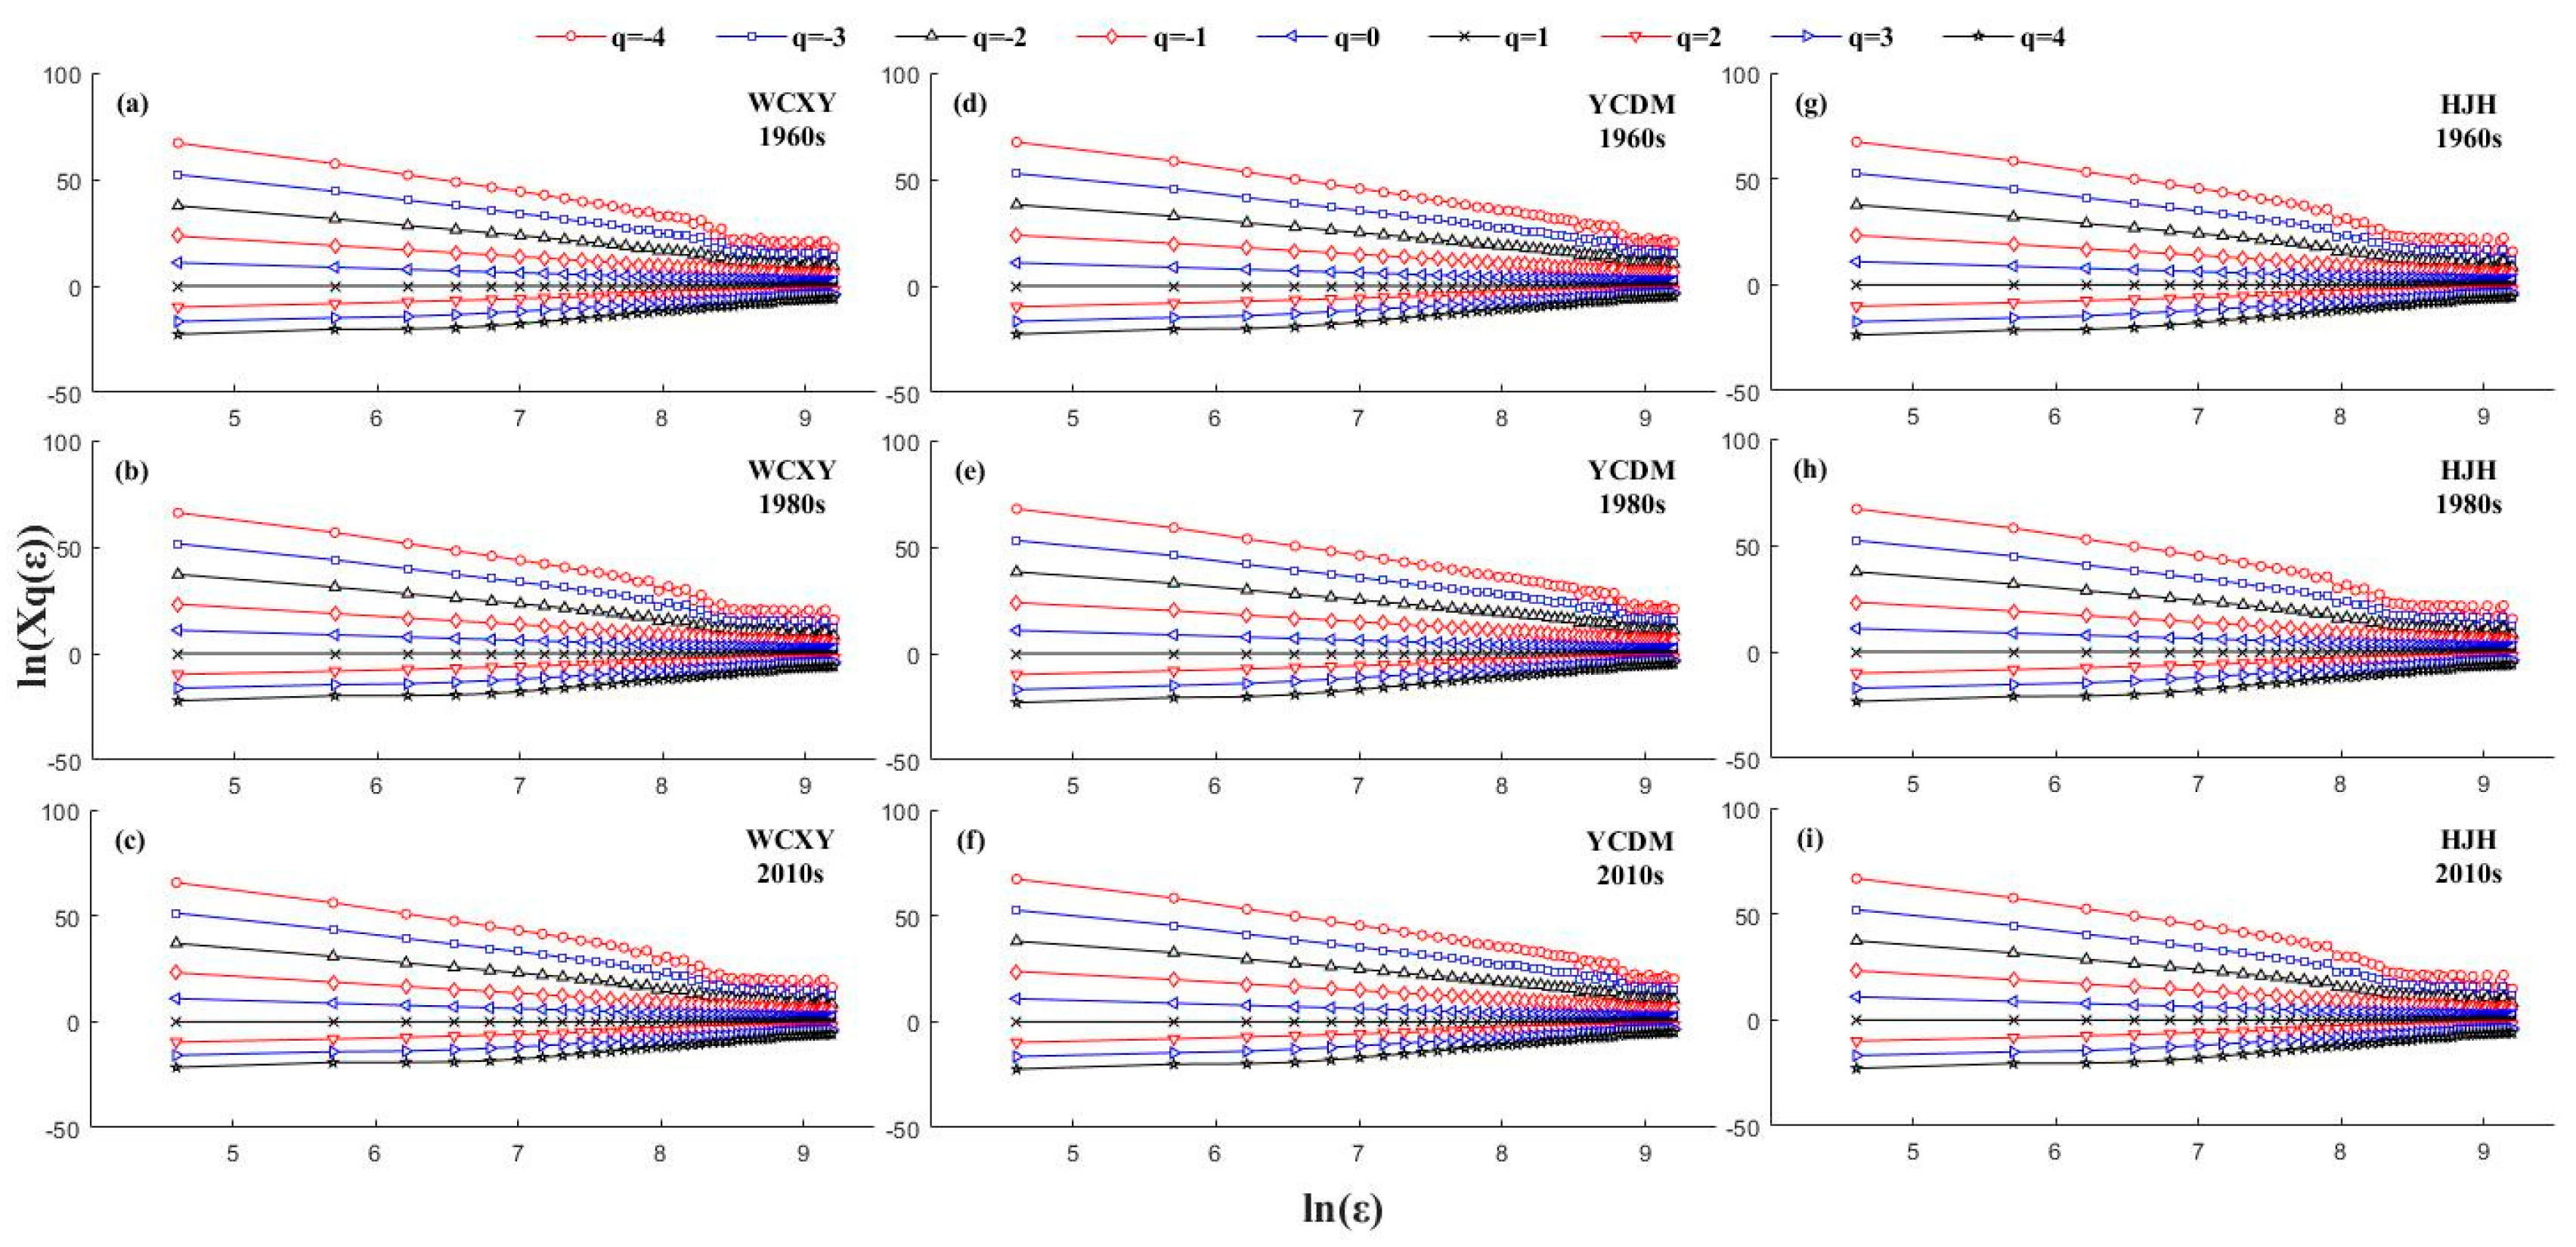
An assessment of the multifractal characteristics of a river network is the basic step in a multifractal analysis. We calculated the double logarithmic curves of the partition function Xq(ε) and the cell size ε (the size of the box ranged from 100 to 10,000 with an increment of 200) of the studied river networks during different periods for a moment order q from –4 to 4 with an increment of 0.5. In order to simply and clearly show the results, we exhibit only nine values. As shown in Figure 3, the curve cluster fluctuates slightly when q < 0. In contrast, when q > 0, the trend becomes closer to a straight line and the whole curve cluster has a good linear relationship with obvious scale invariance. Therefore, Xq(ε) and ε satisfy the exponential law, which means that the distribution of river networks is scale-free within the scope of the specified scale. This result reflects the obvious multifractal characteristics of our studied river networks.
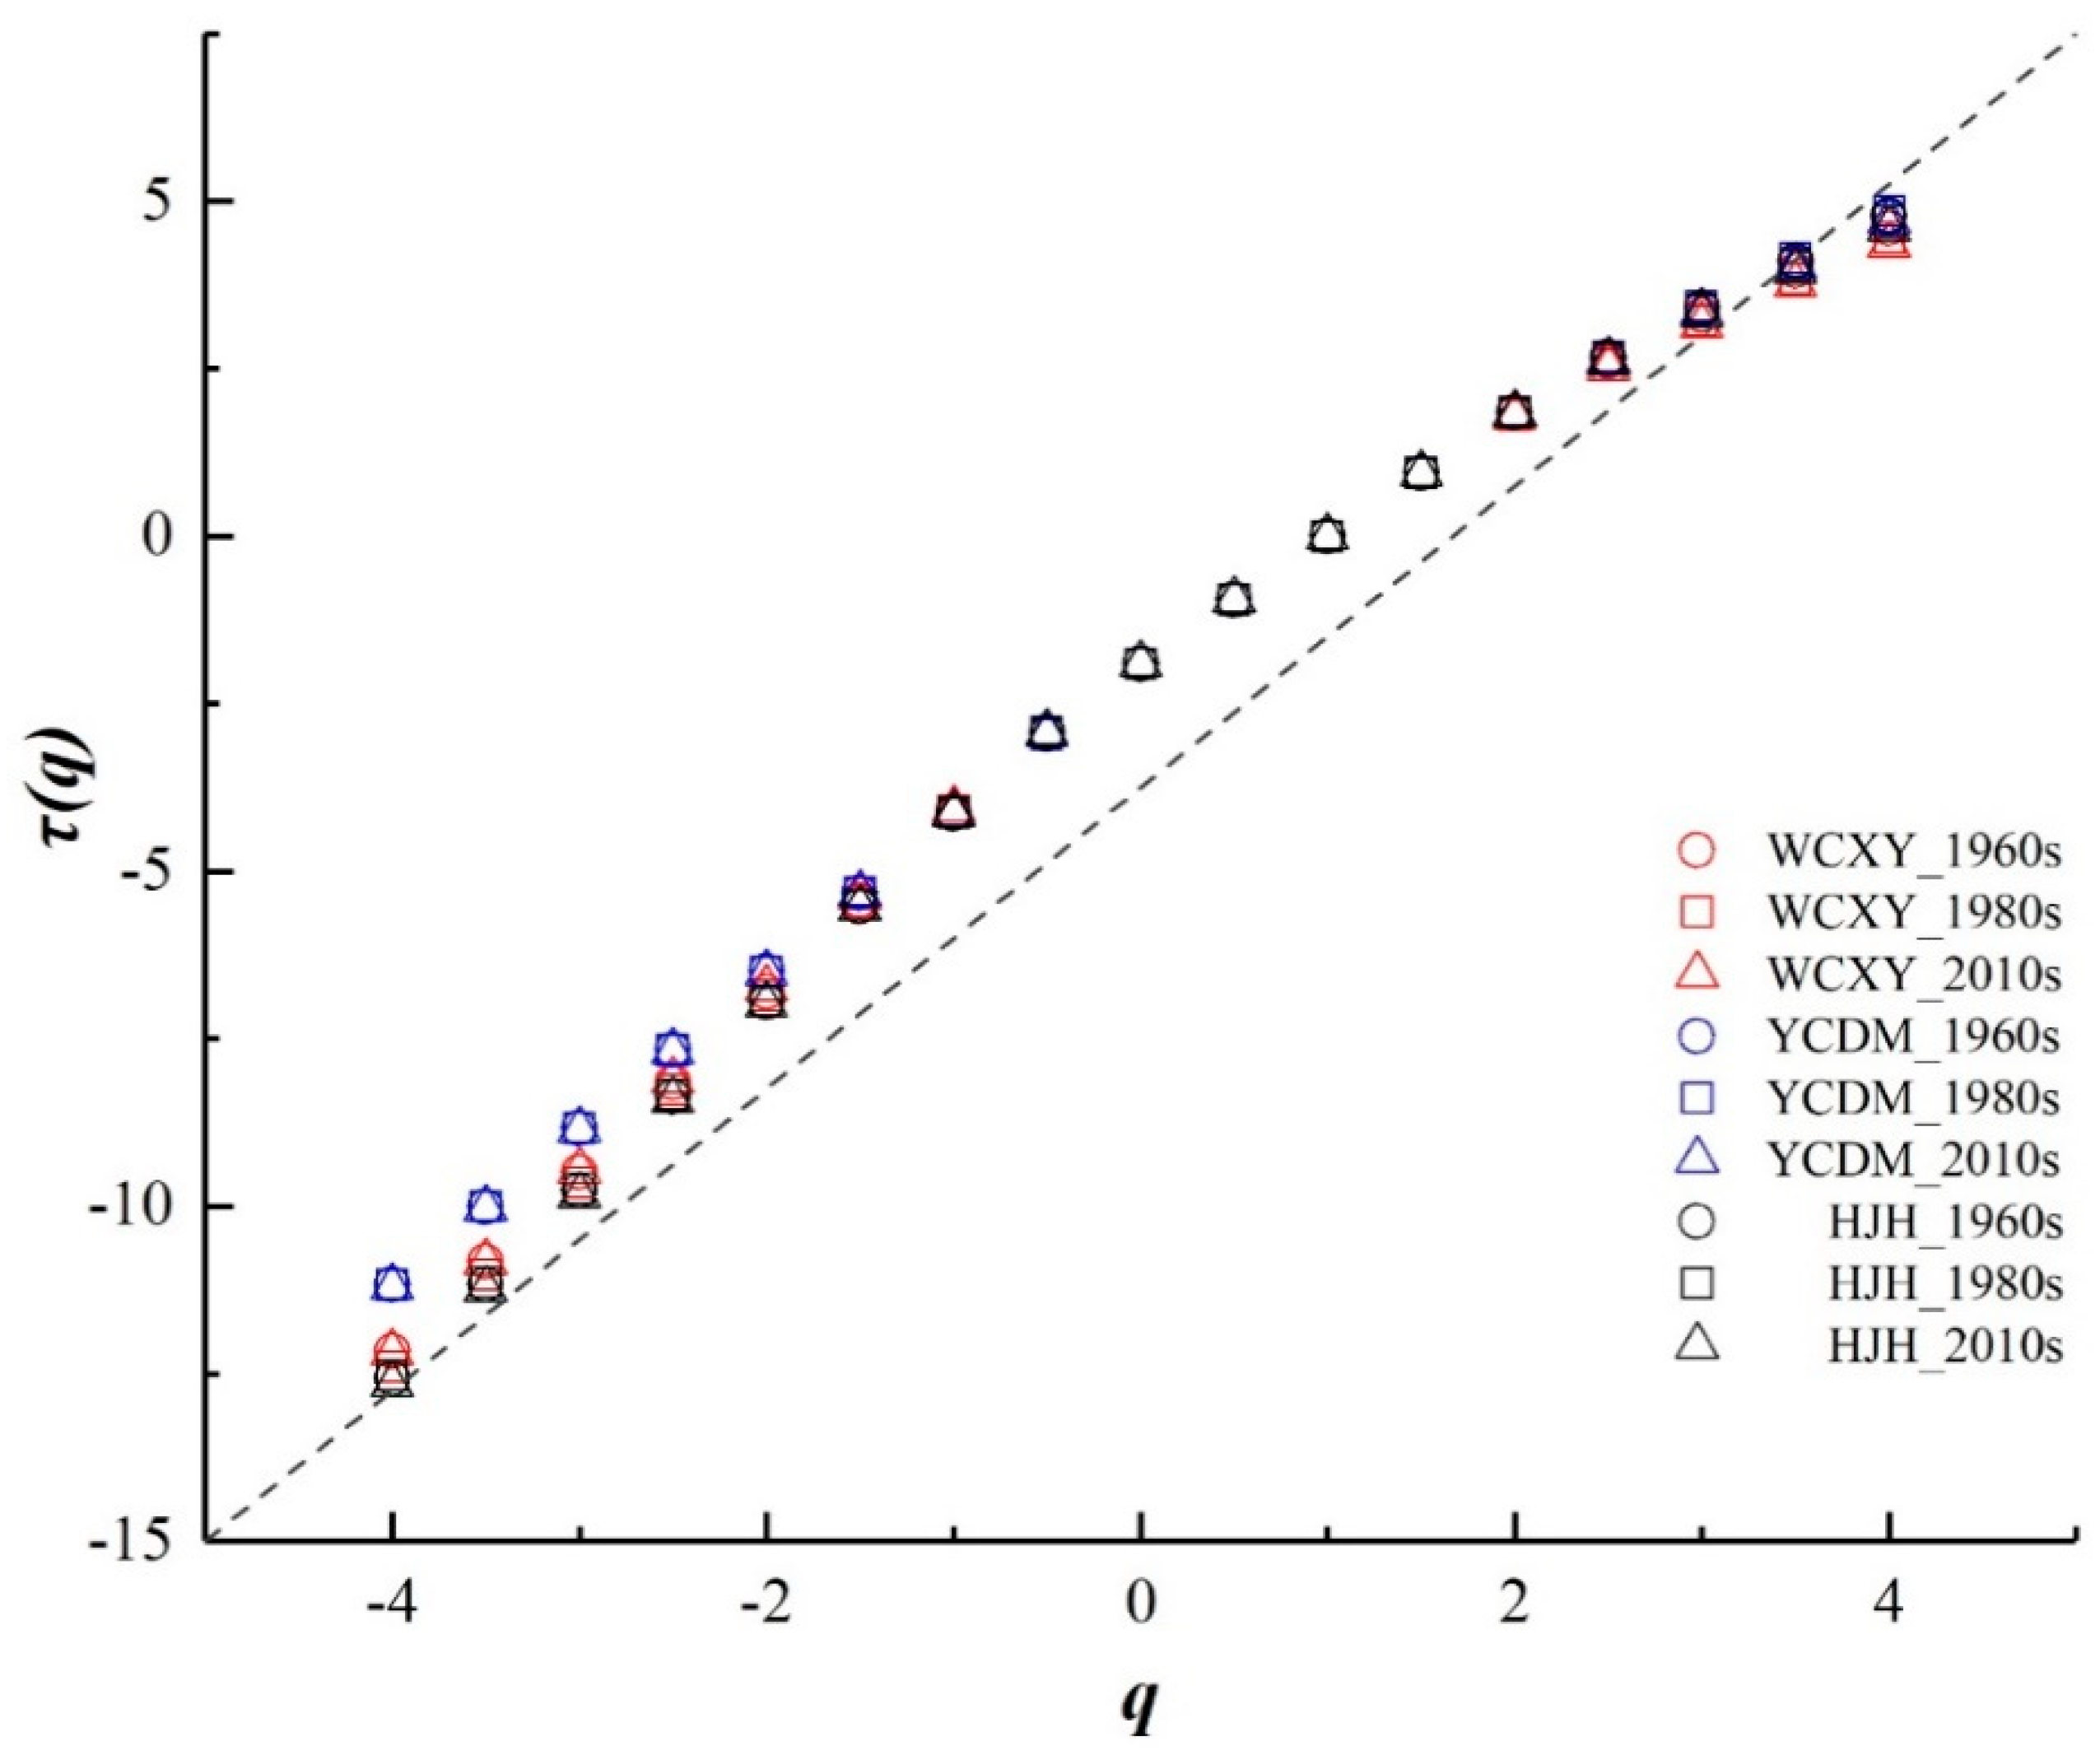
The relationship between the mass exponents τ(q) and the moment order q is shown in Figure 4. The value of τ(q) increases with the value of q, the trend lines are upper convex curves during the study periods, and the slope of the curves approaches 1. The moment order q of WCXY and HJH has a lower and the lowest τ(q) when q is smaller than 0 in the 1960s, 1980s, and 2010s. The three curves almost coincide when –1 ≤ q ≤ 2. However, when q is larger than 2, the τ(q) of YCDM is the largest, the τ(q) of HJH is the second largest, and the τ(q) of WCXY is the smallest. In other words, the time differences are not obvious in all three areas over the whole time period. The upper convex curves also prove that the river networks have a multifractal nature.
3.2. Multifractal Analysis
3.2.1. Multifractal Dimension Analysis
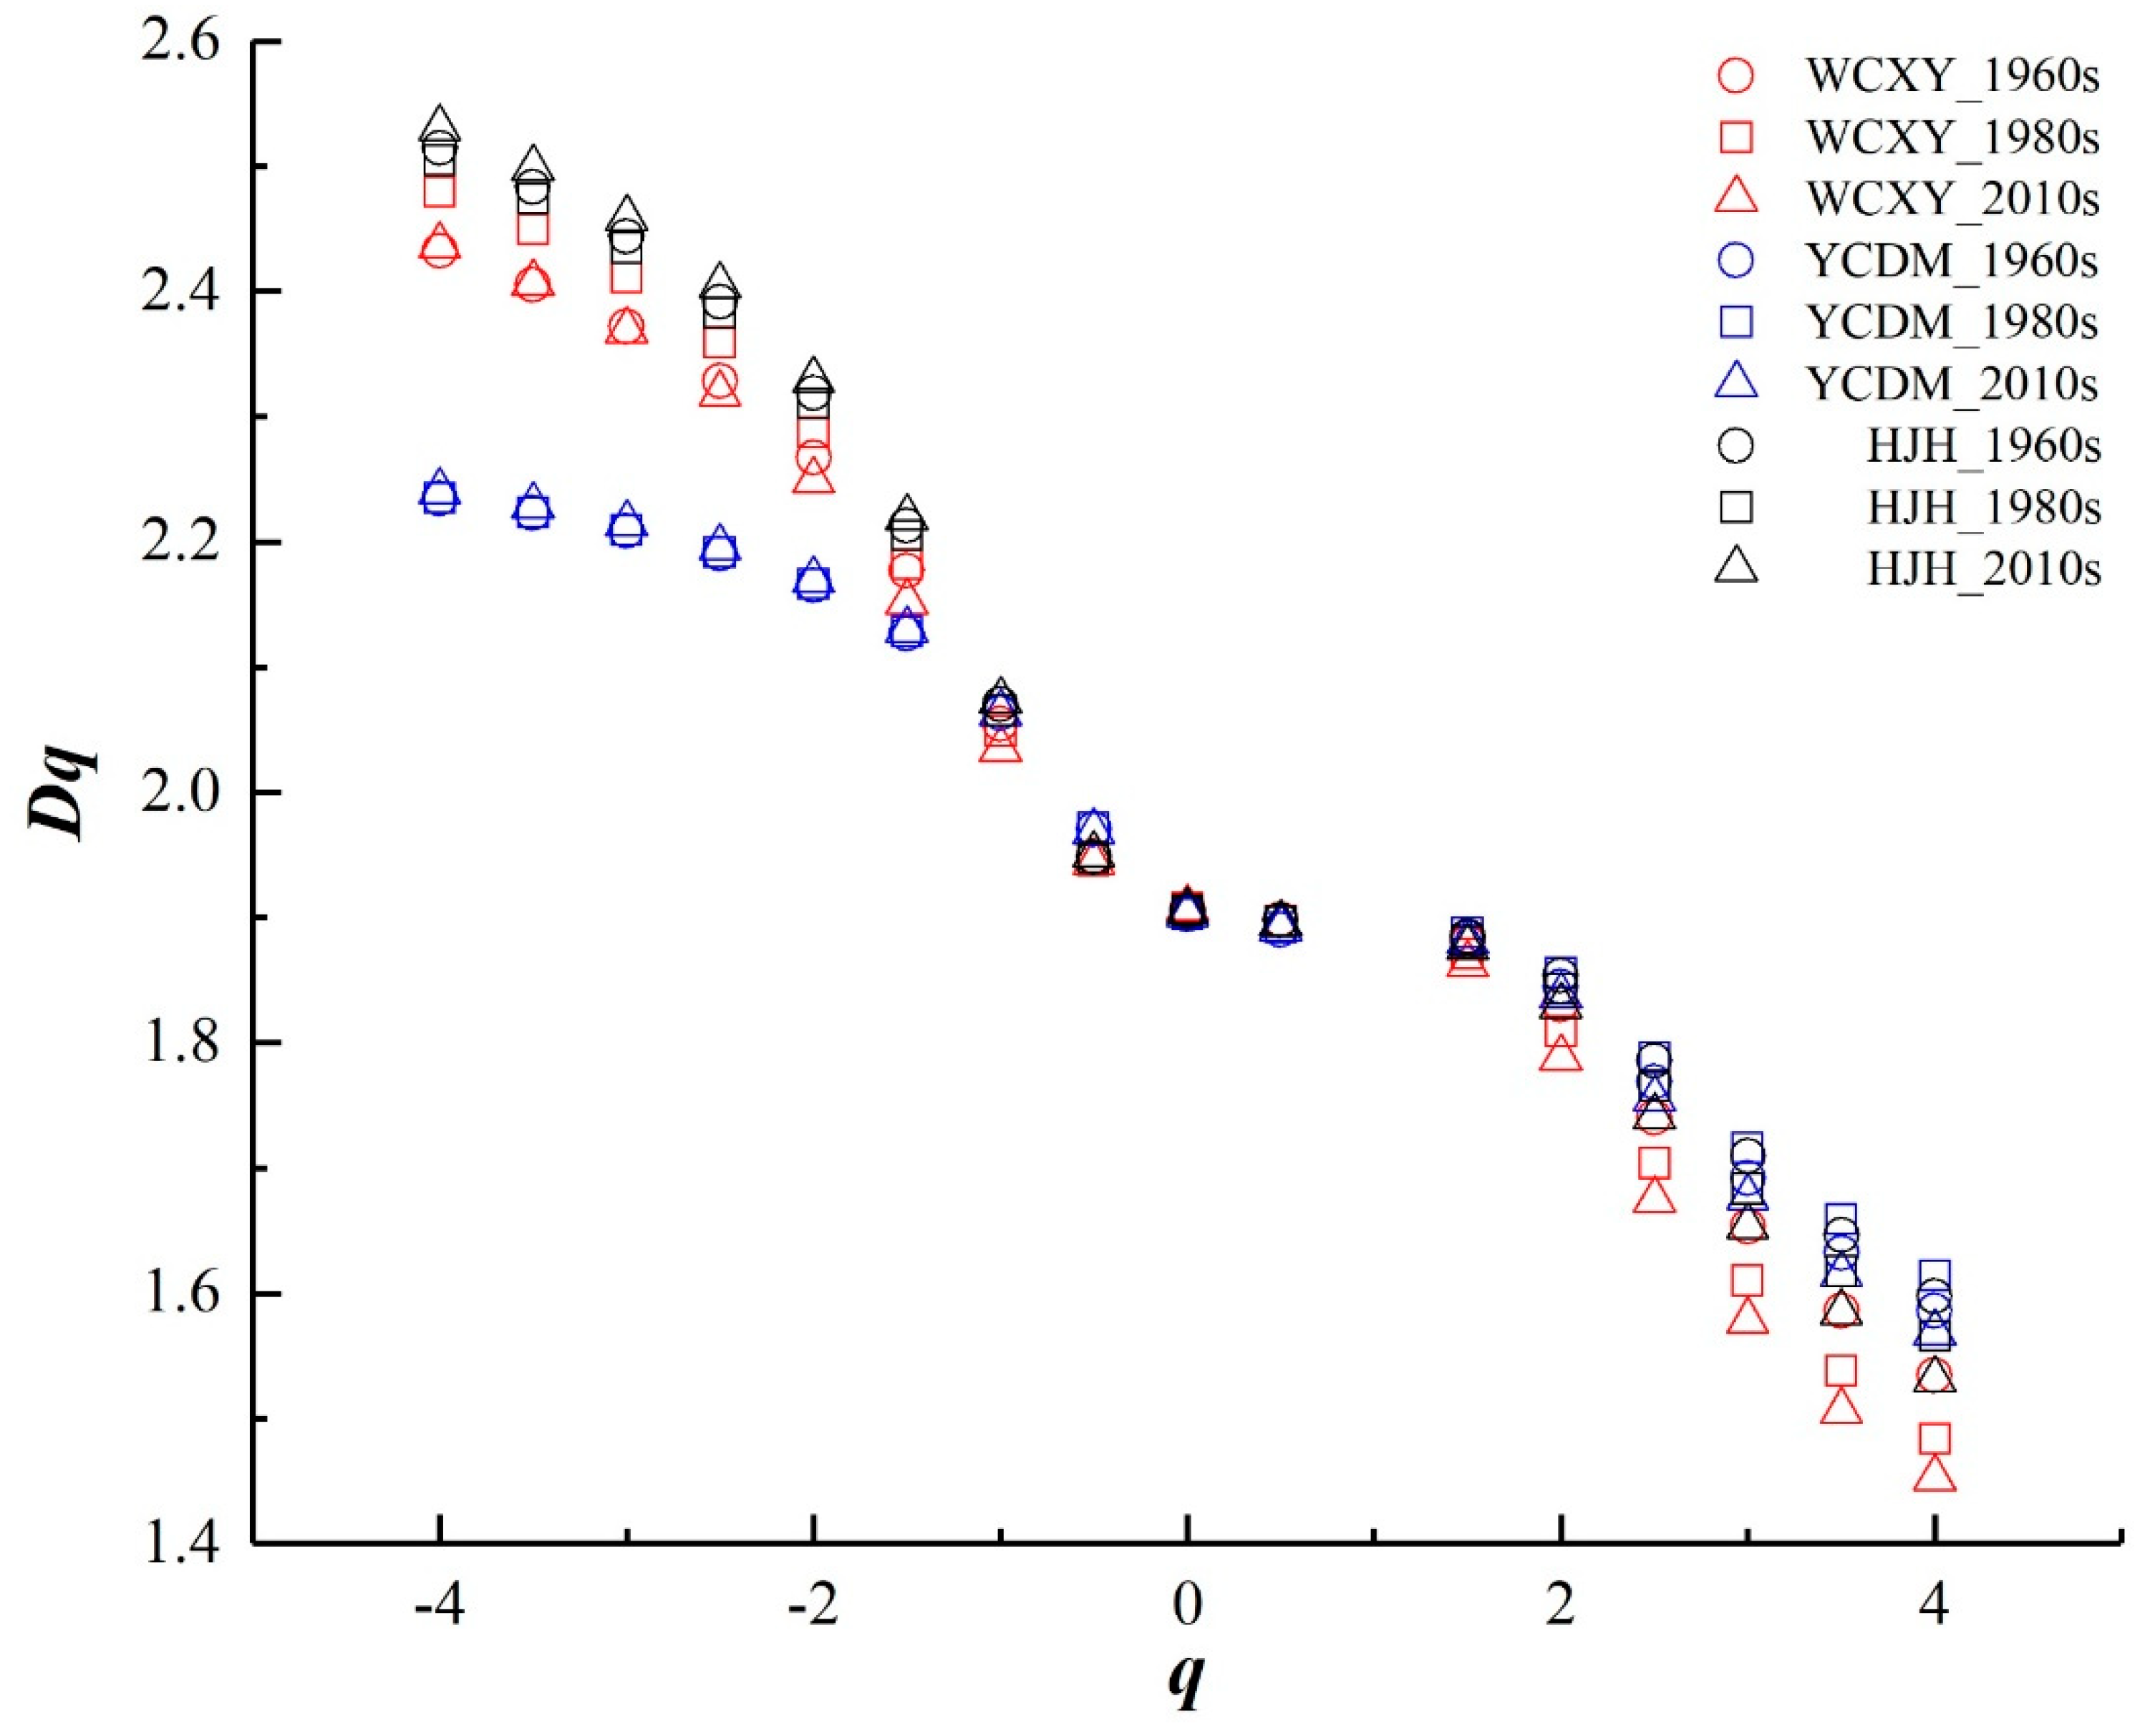
The spectrum of the generalized multifractal dimensions, Dq, was obtained through the least squares linear regressions that were applied each one of the 17 fractal curves of parameter q = −4 to 4. Comparisons of different areas and times are shown in Figure 5. The patterns of Dq and q changed little during the 1960s, 1980s, and 2010s in all three areas. As shown in Figure 5, the multifractal dimension Dq decreases with the increase in the moment order q. We can find that the curves of HJH decrease most sharply in the 1960s and 2010s when q < –1, in contrast to the stationary curves of YCDM. When q > 1, the curves of WCXY decrease most sharply and the curves of HJH and YCDM remain almost the same. In particular, when q = 0, the capacity dimension D0 changed slightly during the 1960s, 1980s, and 2010s in the three areas. This may be due to the fact that the plain’s river networks are so dense that they produce a certain error in the results.
3.2.2. Multifractal Spectrum Analysis
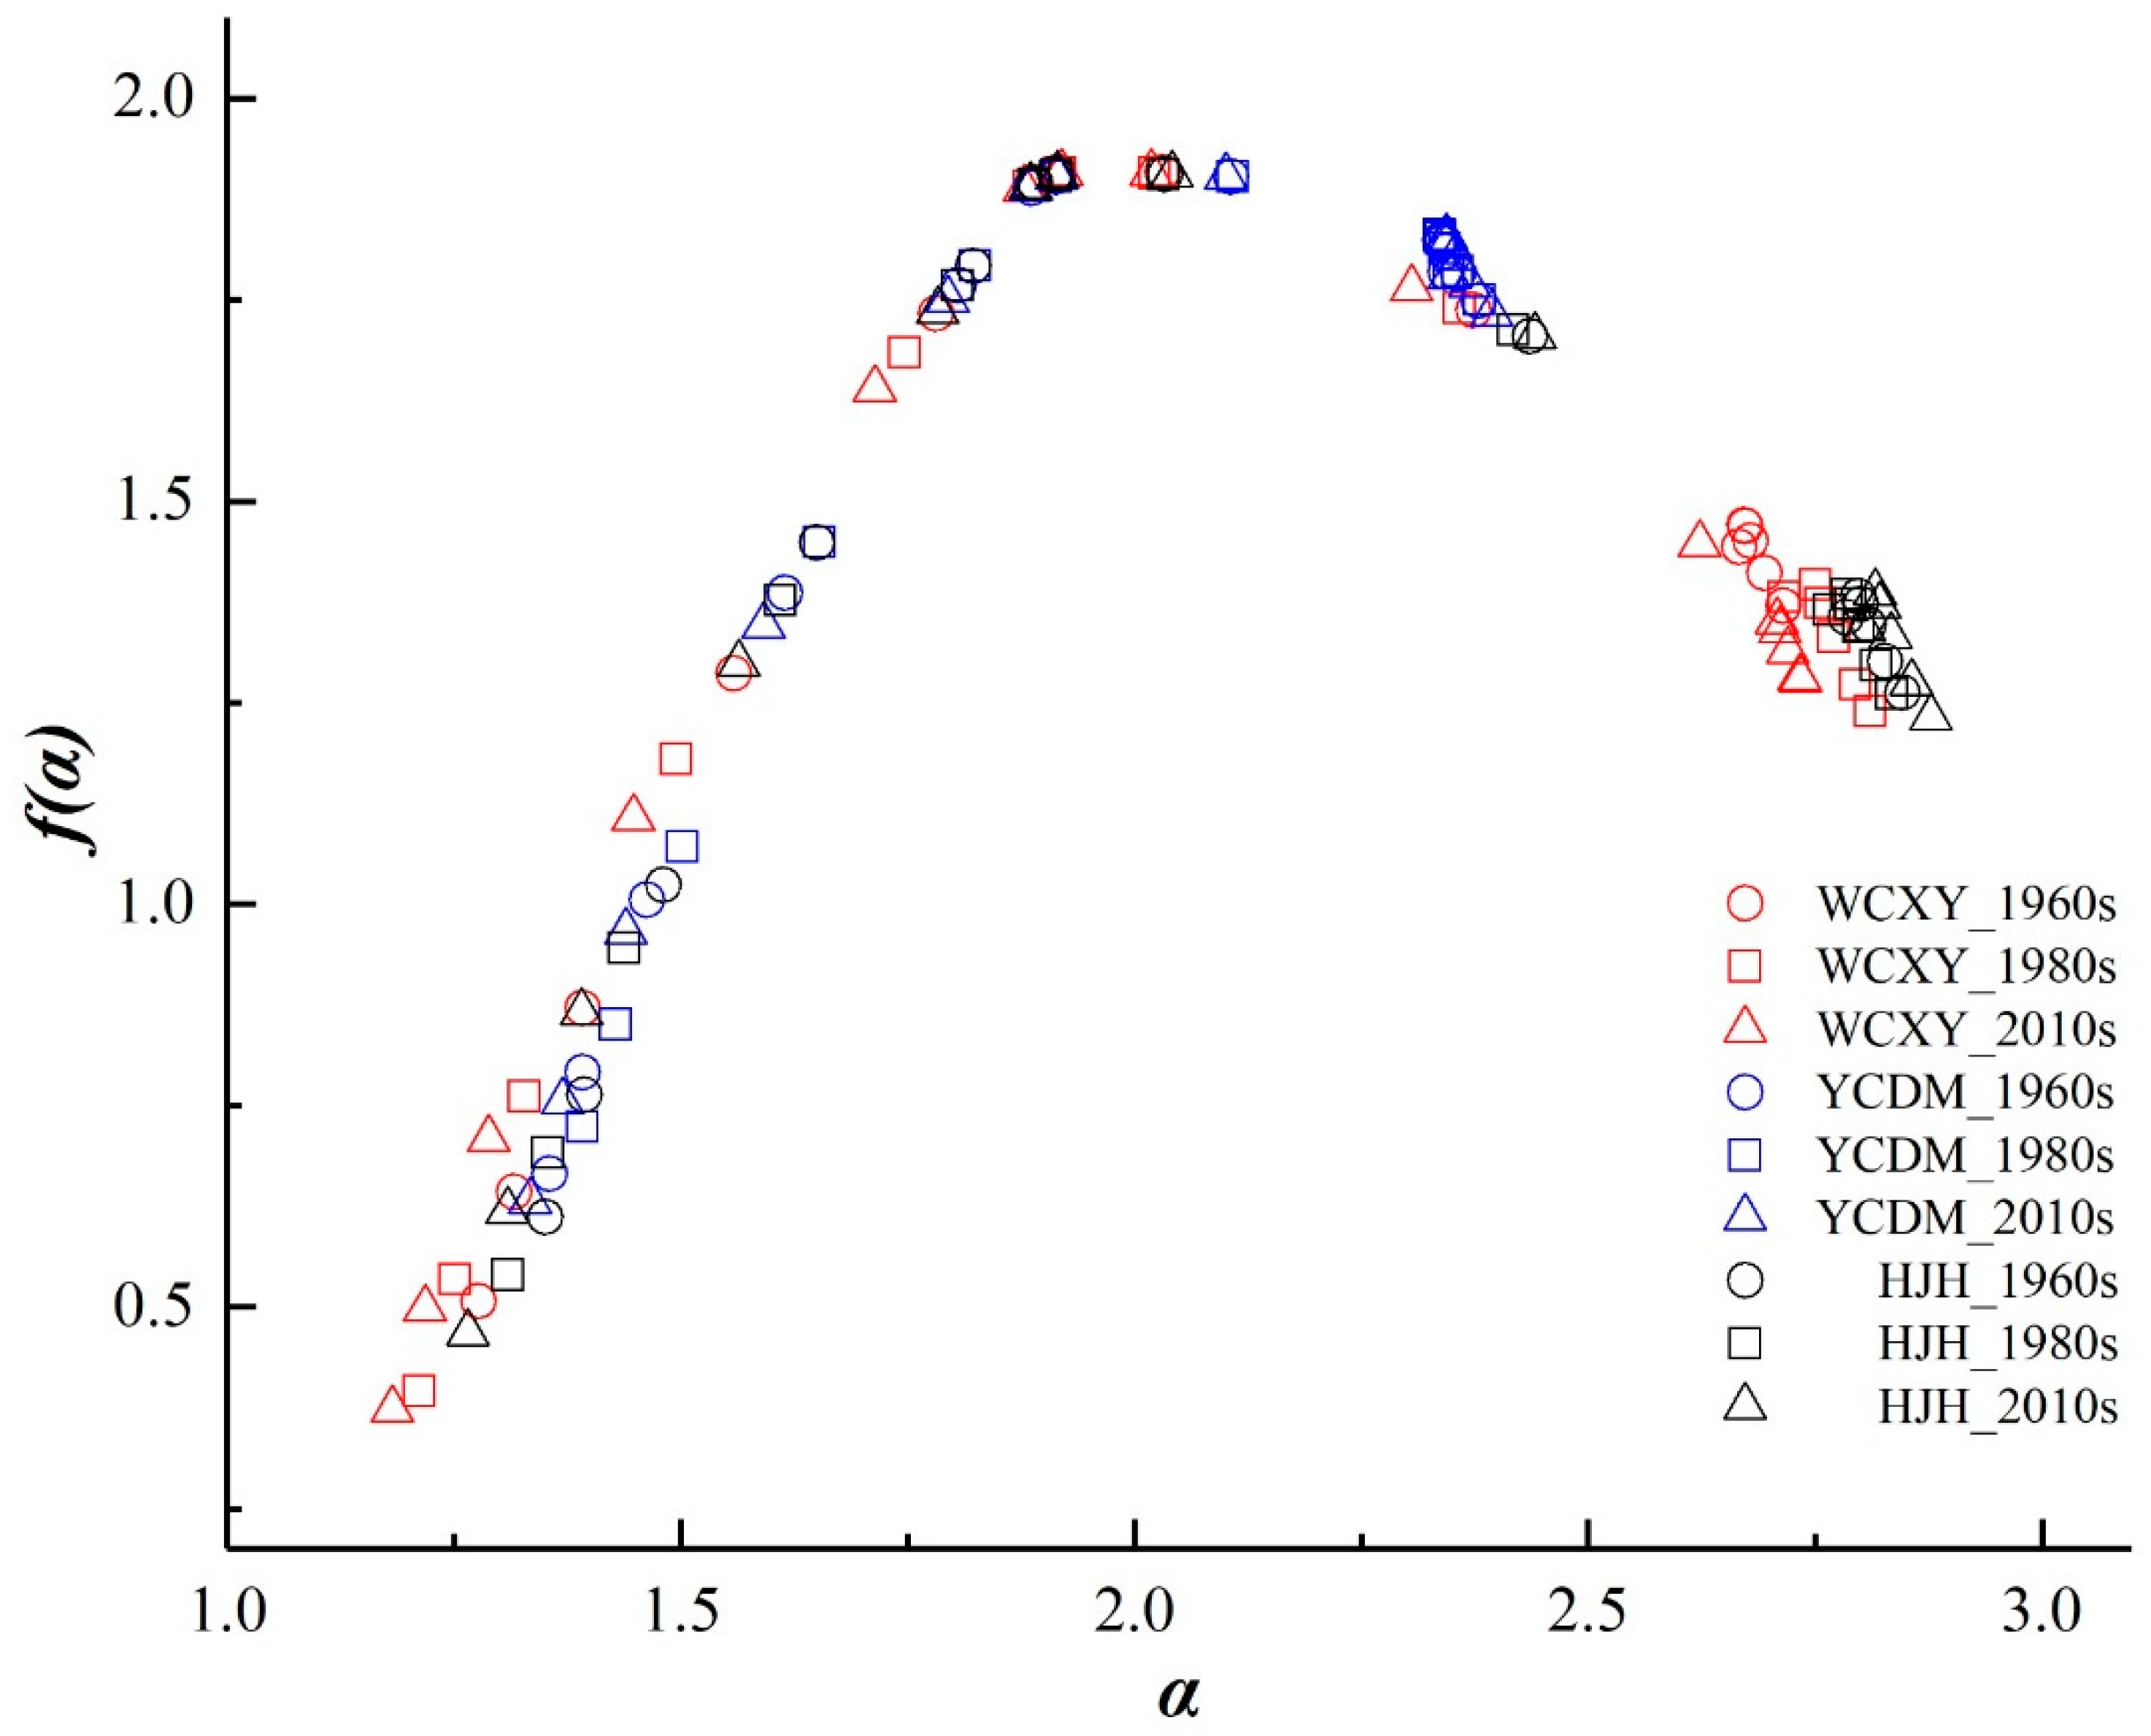
The quantitative indicators (singularity, heterogeneity, and self-similarity) of the river networks can be analyzed by the multifractal spectrum. All nine spectrums are asymmetrical inverted-hook-shaped curves with a dominant length on the left parts. The variation in the singularity component, ∆α, indicates the heterogeneity of the river network’s spatial distribution, and the larger ∆α represents a more uneven spatial distribution pattern. As shown in Table 2, the ∆α of WCXY increased from 1.438 in the 1960s to 1.599 in the 1980s, and then declined to 1.552 in the 2010s. The ∆α of YCDM declined from 1.023 in the 1960s to 0.988 in the 1980s, and then increased to 1.060 in the 2010s. The ∆α of HJH increased from 1.496 in the 1960s to 1.525 in the 1980s, and then to 1.612 in the 2010s. The larger α side, corresponding to the q < 0 part, describes the behavior of the higher distribution probability subsets, which are the densely distributed rivers. In contrast, the smaller α that corresponds to the q > 0 part is associated with the variation in the rivers with lower density. According to Figure 6, the geometric complexity was more dependent on the sparse river networks in this catchment, which is consistent with the above analysis.
∆f describes the influence-dominated intensity of the dense and sparse river networks. The ∆f of WCXY changed from 0.862 to 0.843 and then to 0.906 in the 1960s, 1980s, and 2010s, respectively. The ∆f of HJH changed from 0.650 to 0.720 and then to 0.764 in the 1960s, 1980s, and 2010s, respectively. The ∆f of YCDM declined from 1.082 in the 1960s to 1.026 in the 1980s, and then increased to 1.102 in the 2010s (Table 2). Temporally, the river network’s structure in the 1980s was most influenced by the densely distributed rivers. Note that the values of shown in Table 2 are all greater than 0.99 and very close to 1. Furthermore, the values of , which are not shown in the table, are also approximately 1.
4. Discussion
The multifractal analysis that was affected through the fixed-size algorithms reflected the multifractal characteristics of the three river networks on the Taihu Plain in the 1960s, 1980s, and 2010s. In this study, we investigated the physical nature of the catchments through multifractal spectra to reveal the properties of the spatial–temporal variations in the three river networks over different periods. The Taihu Plain is located on a high-elevation plain along the bank of the river and the river network plain that is centered in the Taihu Lake region [35]. Therefore, we can temporarily remove the impact of geological structures on changes in river networks. We revealed the multifractal dynamics of the study areas by comparing the characteristics in different periods, and assumed that the river networks underwent drastic changes due mainly to urbanization over the past half century in the study areas.
4.1. Multifractal Analysis of the Main Rivers and Tributaries
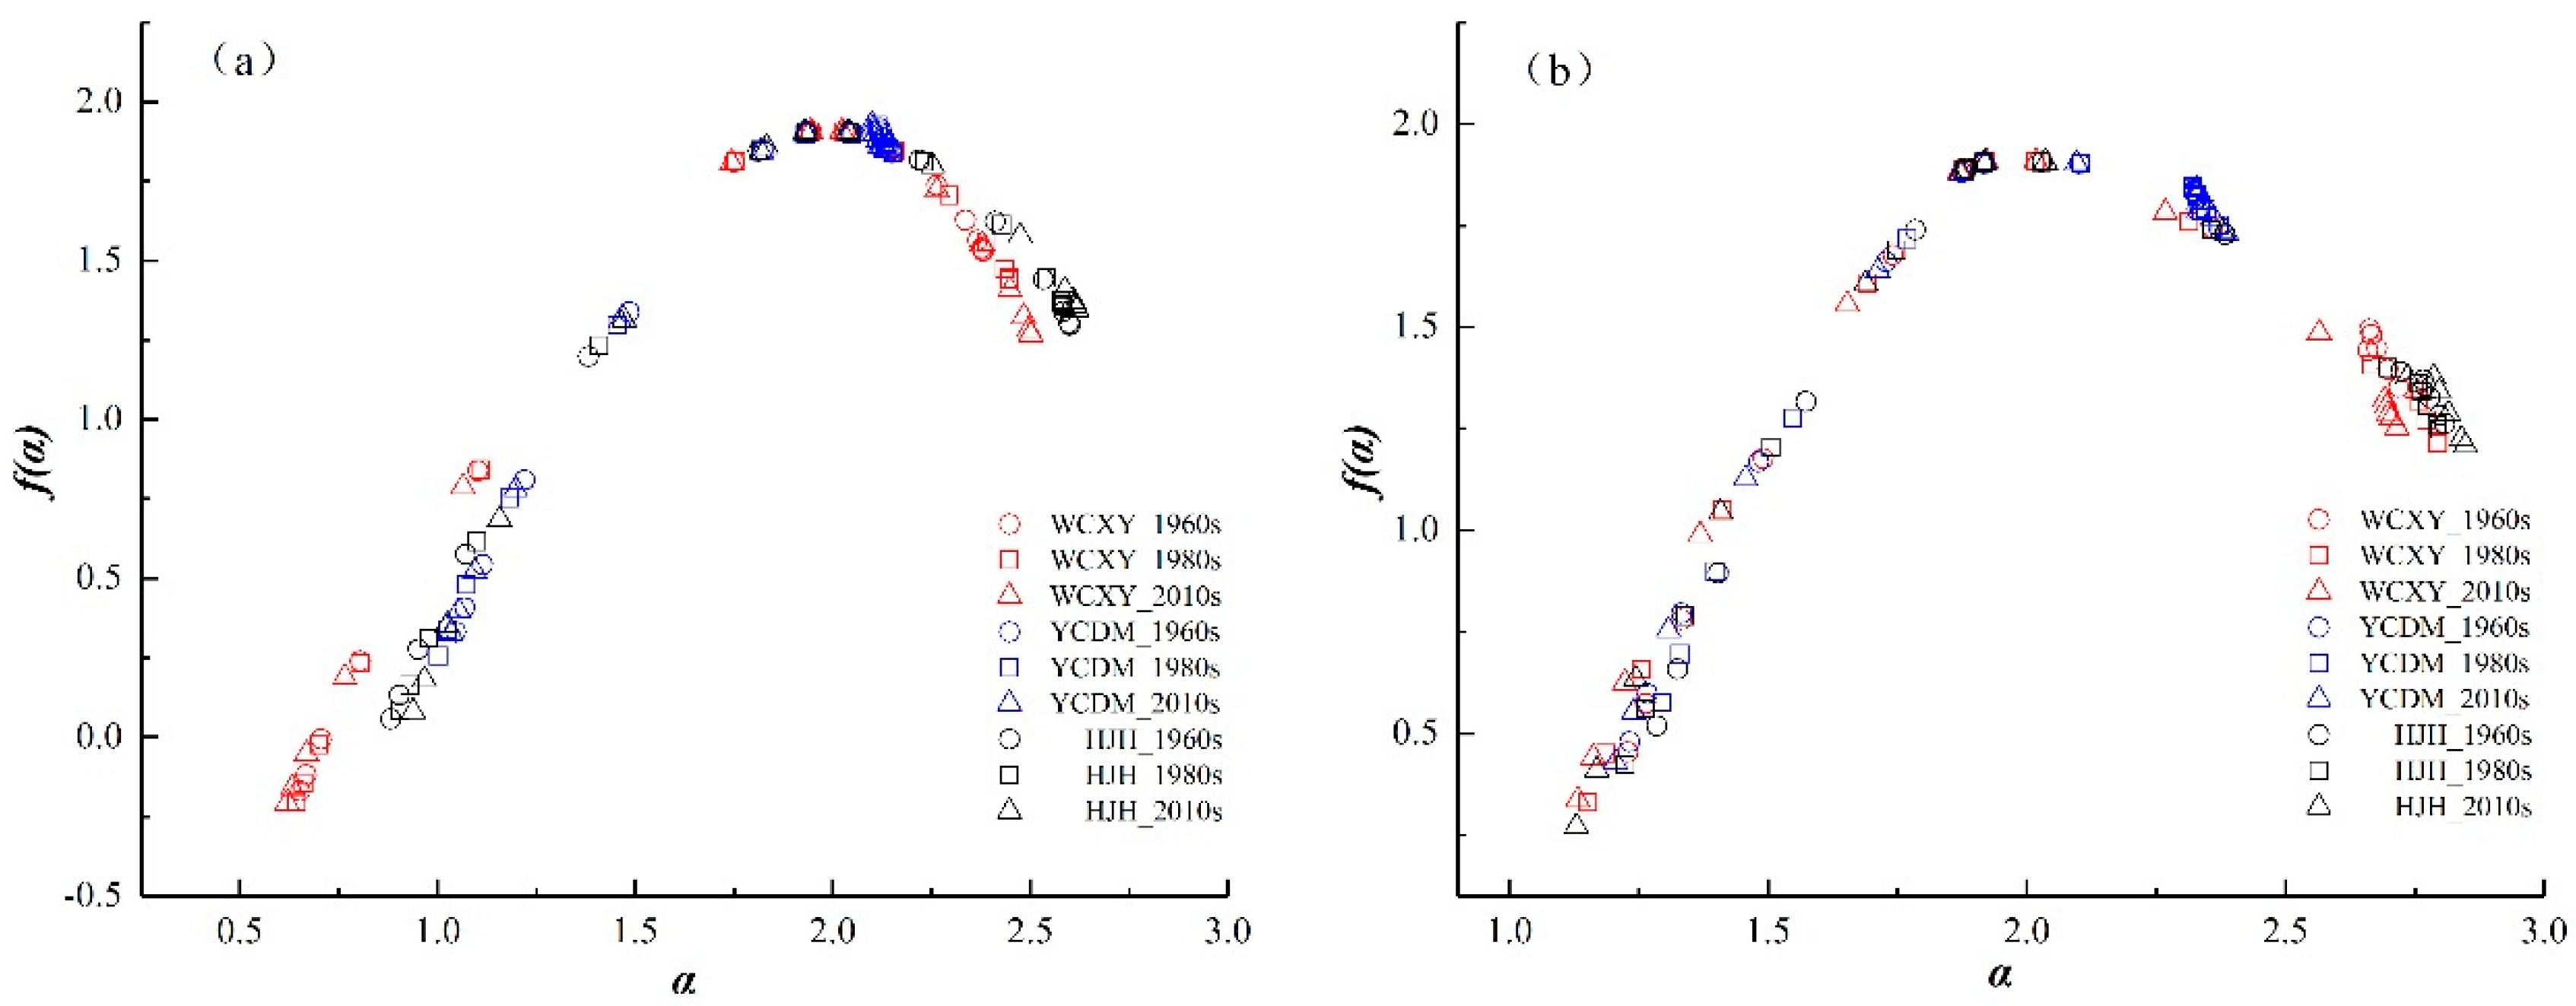
Compared to traditional statistical methods, a multifractal spectrum can provide us with more information about a river network’s features. To better reveal and understand the causes of changes in the river networks over the last 50 years, we also calculated the multifractal spectrum of the main rivers and tributaries by reference to the classification method for river networks [36,37]. As shown in Figure 7a,b, similar to the spectrum of the whole area (Figure 6), the shapes of the spectra of the main rivers and tributaries are all asymmetric, inverted-hook-shaped curves that are dominated by left parts. Remarkably, the multifractal spectra of the main rivers are much smoother and the curves of the tributaries seem to be consistent with the shape of the spectrum of the whole river network. Therefore, we speculate that the changes in tributaries that were caused by urbanization may influence the changes in the overall river network.
∆α can quantitatively describe the level of inhomogeneity in the distribution probability of the river networks. As shown in Table 3, we can see that the ∆α of the main rivers in WCXY increased from 1.727 in the 1960s to 1.804 in the 1980s, and then to 1.881 in the 2010s; the ∆α of the tributaries increased from 1.489 in the 1960s to 1.643 in the 1980s, and then declined to 1.582 in the 2010s. During the period 1960–1980, the ∆α of the tributaries increased by 10.3% and that of the main rivers increased by 4.5%, which is a magnitude of change that is greater than –3.7% and 4.3% during the period 1980–2010, respectively. In YCDM, the ∆α of the main rivers increased from 1.105 in the 1960s to 1.149 in the 1980s, and then declined to 1.100 in the 2010s, corresponding to change magnitude of 4.0%, –4.3%, and –0.5% during the three periods; the ∆α of the tributaries declined from 1.138 in the 1960s to 1.076 in the 1980s, and then increased to 1.180 in the 2010s, corresponding to change magnitude of –5.4%, 9.7%, and 3.7%. In HJH, the ∆α of the main rivers declined from 1.719 in the 1960s to 1.677 in the 1980s, and then to 1.680 in the 2010s; and the ∆α of the tributaries increased from 1.522 in the 1960s to 1.575 in the 1980s, and then to 1.719 in the 2010s. The ∆α of the main rivers in HJH shows a trend of decreasing first and then increasing; however, the overall trend is a decreasing one, while the ∆α of the tributaries increased by 12.9% over the past 50 years. The calculated ∆α is relatively large, indicating that the distribution patterns of the three river networks are more discrete and irregular. This is because the plain’s river networks are very complicated. The river networks have higher spatial variation because the tributaries became more complex regardless of whether the main rivers developed into a more homogenized pattern (YCDM and HJH) or a heterogeneous pattern (WCXY). Besides this, the main rivers and tributaries of WCXY changed faster during the period 1960–1980 than during the period 1980–2010. However, the change magnitude of the period 1980–2010 is larger than that of the period 1960–1980 for the main rivers and tributaries in YCDM and HJH.
In WCXY, the trend of variation in ∆f for the main rivers and tributaries is 1.700 to 1.642 and then to 1.475 and 0.898 to 0.884 and then 0.915 in the 1960s, 1980s, and 2010s, respectively. The change magnitude of the main rivers and tributaries was −3.4% and −10.2% and −1.6% and 3.5% during the periods 1960–1980 and 1980–2010, respectively. The ∆f of the main rivers in HJH changed from 1.240 to 1.271 and then to 1.266 in the 1960s, 1980s, and 2010s, corresponding to a change magnitude of 2.5% and −0.4%. The ∆f of the tributaries in HJH changed from 0.744 to 0.825 and then to 0.938. The ∆f of the main rivers in YCDM increased from 1.509 in the 1960s to 1.583 in the 1980s (a magnitude of 4.9%), and then declined to 1.519 in the 2010s (a magnitude of −4.0%); the ∆f of the tributaries in YCDM declined from 1.269 in the 1960s to 1.175 in the 1980s (a magnitude of −7.4%), and then increased to 1.303 in the 2010s (a magnitude of 10.9%). When ∆f > 0, the number of subsets with maximum probabilities is less than the number of subsets with minimum probabilities. Therefore, the distribution of river networks depends on the distribution of high-probability river networks to a large extent, which indicates that the river networks in the study areas are densely distributed in most areas. The river networks are more fully developed, complex, and uneven, and the density of the river networks is high. More remarkably, the trends of change in ∆α and ∆f of the tributaries are consistent with the changes in the entire river network, indicating that the tributaries of all three areas play an important role in the complexity of the river networks.
Besides this, according to the shapes of the multifractal spectrums with poor symmetry, the geomorphic morphology of the river networks under and above the average distribution density is quite different, which is consistent with the findings of Wang et al. (2013) [46]. Furthermore, there was a significant change in the curvatures of the right branch of the multifractal spectrums (Figure 6 and Figure 7b), indicating that the river networks within the distribution range may have undergone a sudden change due to some factors such as human activities [46].
4.2. Multifractal Analysis of River Networks from Other Areas
Most of the existing studies quantitatively describe the fractal characteristics of changes in the structure of river networks in different regions, particularly in urban areas such as the lower reaches of river basins and the Yangtze River Delta [36,37,39,51]. However, a simple fractal analysis can only reflect the complexity and stage of development of a river network’s structure as a whole, rather than the structural changes in river networks at different spatial scales. For large river networks that consist of many sub-basins, the geology, lithology, and vegetation types of the sub-basins are different and complex, and it is insufficient to conduct a fractal analysis [7]. A multifractal is calculated by the probability distribution function of river networks with a probability moment, which constitutes a continuum function of fractal dimensions. It has been widely used to comprehensively describe the complexity, singularity, and irregularity of structural changes in river networks in complete and partial detail. Therefore, we used a multifractal analysis to quantitatively illustrate the structural changes in river networks on the Taihu Plain.
Recent studies have applied multifractal analysis to natural river networks through various techniques. De Bartolo et al. (2000) compared five sub-basins from the Calabrian river in Italy based on a box-counting method and found the capacity dimensions to range between 1.76 and 1.89 [4]. In addition, within the same area, De Bartolo et al. (2004) applied two types of FSA algorithms, including the box-counting method and the sandbox method. The results showed that the multifractal and non-plane filling structures of the studied river networks through the sandbox method and the f(α) spectrum were affected by the lithological features of the source rocks [5]. Lashermes and Foufoula-Georgiou (2007) suggested that the patterns, areas, and widths of river networks in three basins in the United States all have multifractal features [52]. Similar works revealed that both the drainage structure and the resolution of digital elevation maps (DEM) could potentially affect the results of a multifractal analysis [19]. A typical multifractal spectrum of an ideal natural river network is an inverted U-shaped curve. Nevertheless, river networks are affected by the lithological conditions of source rocks and anthropogenic factors [4,5,6,53,54], which produce asymmetric, inverted-hook-shaped curves. Based on the previous literature, we found that the capacity dimensions of river networks ranged from 1.83 to 1.93 in mountainous areas [4,5,53,54], while in low mountainous areas the capacity dimensions of river networks ranged from 1.49 to 1.81 [19,20,54]. Besides this, the capacity dimensions of river networks in the Lower Yellow River were found to range from 1.10 to 1.18 [55], and then weakened dramatically to 1.05–1.35, due to the influence of the Xiaolangdi Reservoir [56].
Compared to other basins, our analyzed river networks are in the Taihu Plain area, where the complex drainage networks have been affected by urbanization and water conservancy projects, resulting in capacity dimensions that range from 1.90 to 1.91. The basin’s geomorphology is at an older stage of geomorphological erosion when the capacity dimensions are between 1.89 and 2.0. The river erodes and accumulates on both sides, and the downward erosion of the river is relatively weak. At this stage, the topography of the basin is slightly undulating, based mainly on plain landforms [7]. Since our study area is in the plain’s river networks area, the results are consistent with the actual situation. However, the geological features of the Taihu Lake Basin have not changed much over the past 50 years. The influences of human activities, including rapid urbanization processes and the construction of water engineering facilities, play a significant role in the river networks’ evolution. Therefore, it is necessary to understand the relationship between changes in river networks and urbanization.
4.3. Changes in River Networks and Urbanization
Changes in river networks are the result of a combination of geological features, topography, climate, and human activities in the basin. They are affected mainly by human activities over a short period of time, especially urbanization processes and the carrying out of water conservancy projects [51]. Since there are many uncertain factors that influence changes in river networks, it is difficult to construct an accurate mathematical model to quantify the mapping relationship. Additionally, changes in river networks have obvious continuity, and the data that are available for analysis in this study are very limited and do not meet the requirements of large sample sizes. In order to overcome the above limitations, we adopted a grey correlation analysis to preliminarily quantify the relationship between changes in river networks and urbanization level, in which the resolution of the grey correlation analysis is 0.5 [36]. We selected TM remote sensing images of the study areas in 2014 for interpretation, and combined the population and socioeconomic statistics of the same period to calculate the population, economy, and spatial urbanization rate (denoted Up, Ue, and Us, respectively). Based on this, combined with the rate of change of the river network index (including △α, △f, and Rd) in the period 1960–2010, the grey correlation degree between the changes in river networks and the urbanization level was calculated (Table 4).
As shown in Table 4, all values of the grey correlation are positive and greater than the resolution coefficient of the grey correlation analysis (0.5), indicating that changes in river networks are significantly affected by urbanization, and the river networks change violently with a higher urbanization level. Specifically, WCXY has the highest urbanization level of the three areas, and its river networks’ changes are the most significantly affected by urbanization. Generally, in order of the average grey correlation degree of various changes in the river networks’ features, it goes: △α > △f > Rd in WCXY, △α > Rd > △f in YCDM, and Rd > △f > △α in HJH. This result shows that urbanization leads to an increase in the impervious area and a significant impact on the changes in river networks. Combined with a field investigation, we found that, in the YCDM and HJH areas, a large number of branch channels were excavated in the 1980s due to agricultural water conservancy activities and the needs of agricultural irrigation, causing dramatic changes in the structure of the tributaries. The △α and △f of the tributaries increased by 9.7% and 10.9% and 9.1% and 13.7% in YCDM and HJH, respectively (Table 3), which is a result that is similar to those of Han et al. (2015) [39]. The river system is constantly evolving due to human activities, including a large number of urban construction projects and landfill in the branch channels, thus destroying the natural ecosystem of the rivers. The disappearance of the rivers has also aggravated the urban flooding problem. In order to solve the waterlogging problem inside urban areas, humans continue to dredge and broaden the main river, as well as change some tributaries to main streams. Therefore, the river system and human activities feedback into and restrict each other, and they adapt to each other and reach a certain balance [39]. This is consistent with Chin’s (2006) conclusion that fluvial morphology adapts to urbanization [30]. However, the changes in river networks are still dramatic in the Taihu Plain river networks area, and the relationship between human activities and the river system remains far from equilibrium. We need to further understand the relationship between human activities and changes in river networks.
4.4. Limitations and Outlook
In regard to the border effects, the multifractal analysis of our studied river networks led to capacity dimensions Dq=0 or D0 that were all close to 1.91 < 2. These results are seemingly in conflict with the findings of some previous studies, which discovered D0 = 2 and considered the river networks to be “empty space” [57,58]. Ijjasz-Vasquez et al. (1992) revealed that the border effects possibly resulted from boxes overlying the edges of the basins, as the application of the box-counting method biased the results [58]. This case is similar to the findings of De Bartolo et al. (2000) [4]. Our work seems to be consistent with previously published work on the hypothesis of non-plane-filling structures of natural river networks [59] and confirms the opinion that values of f(α0) less than 2, which were obtained by De Bartolo et al. (2004) through the sandbox method [5], avoid the border effects that are produced by the box-counting algorithms. Additionally, the capacity dimension D0 was found to change slightly in the three areas in different periods. These slight variations can be attributed to the fact that the plain’s river networks are too dense to obtain good results. In this study, we only used the box-counting method of a fixed-size algorithm to calculate the multifractal spectrum, and we did not use other methods, including the Barycentric fixed-mass method [60] and the sandbox method, to conduct a comparative analysis. We will consider adopting the fixed-mass method and the sandbox method for further research in future studies.
Recent studies suggest that multifractal dimensions may affect the hydrologic response, and the Multifractal Instantaneous Unit Hydrograph (MIUH) was proposed [33,53]. Gaudio et al. (2006) believe that the flood peaks would increase with the increase in both the generalized fractal dimensions and the Lipschitz–Hölder exponents [53]. Similarly, Zhang et al. (2015) built a mathematical model to reflect the relationship between flood frequency and fractal dimension, which showed that the number of flood events increased with the decrease in the fractal dimension of the river networks [27]. Wang et al. (2016) also established a relationship between the Hurst index of the water level and the fractal dimension, revealing that changes in a river network under urbanization have an influence on a river network’s storage capacity [61]. Besides this, Gires et al. (2017) applied fractal analysis to quantify how well the spatial structures of imperviousness of urban catchments performed in hydrological models [62]. All the directions of the abovementioned studies will be given more attention in future work, particularly the relationship between a flood-forming regime and the multifractal structures of the river networks in the plain’s river networks area.
5. Conclusions
In this study, we carried out a multifractal analysis of river networks in the context of urban catchments located on the Taihu Plain, China. Based on the river networks that were derived from digitalized paper geographical maps at a scale of 1:50,000 in the 1960s and 1980s and 1:50,000 digital line graphics in the 2010s, we investigated the generalized multifractal dimensions (Dq) and the multifractal spectrum (f(α)) through the box-counting method of a fixed-size algorithm. Both positive and negative values of a moment order q were used to determine the multifractal features. The multifractal features of river networks and the characteristics of their spatial and temporal variation in WCXY, YCDM, and HJH in different periods were then explored. Finally, the driving factors of structural changes in the river networks were discussed. The following conclusions were obtained:
(1) The river networks we studied have obvious multifractal characteristics with values of fractal capacity dimensions between 1.90 and 1.91 in the three areas in the period 1960–2010. The multifractal spectrum was left-part dominant for WCXY, YCDM, and HJH in the different periods, indicating that the river networks were influenced by the densely distributed rivers. From the 1960s to the 2010s, the ∆α in WCXY showed the tendency to first increase and then decrease, whereas the trend of YCDM was the opposite, and the ∆α increased steadily in HJH. Generally, the rate of change of ∆α increased by approximately 7.9%, 3.6%, and 7.8% in WCXY, YCDM, and HJH over the last 50 years, respectively. The ∆f in WCXY and YCDM had the same varying tendency. The ∆f in HJH continued to increase by approximately 17.5%. The increases in ∆α and ∆f changed the density and spatial heterogeneity of the river network’s distribution under urbanization.
(2) To better evaluate the changes in the studied river networks, we also calculated the multifractal spectra of the main rivers and tributaries. The results show that the ∆α of the main rivers increased by 8.9% in WCXY and decreased by approximately 0.5% and 2.3% in YCDM and HJH, respectively. The ∆α and ∆f of the tributaries in the three areas all increased as a whole, in which HJH changed the most, with an increase of 12.9% and 26.1%, respectively. The trends of change in the ∆α and ∆f of the tributaries in the three areas were consistent with that of the entire river network, indicating that the tributaries play a significant role in the complexity of the river networks.
(3) The changes in river networks were significantly affected by urbanization, and the river networks changed dramatically with a higher urbanization level. All of the average grey correlation values between the changes in river networks and the urbanization level were greater than 0.6 and greater than the resolution coefficient of the grey correlation analysis (0.5), and their order was △α > △f > Rd in WCXY, △α > Rd > △f in YCDM, and Rd > △f > △α in HJH. Compared to the natural factors, human activities have a more significant influence on changes in the river networks.
(4) There were no border effects in our multifractal analysis. Besides this, we did not dig deeper into which factors would influence the results. Therefore, a comparative analysis through the fixed-mass method and the sandbox method will be considered in further research. Similarly, applications of multifractal analysis to quantify changes in river networks under urban hydrology conditions based on hydrological models or mathematical models will be paid more attention in our future works, particularly with respect to investigating the linkage between the flood-forming regime and the multifractal structures of the river networks.
In general, multifractal analysis can be used as an efficient means for evaluating changes in river networks. It provides a new method and idea for further studying the influences of changes in river networks. It is of theoretical significance for understanding, describing, and quantifying the evolution of river network structures.
Author Contributions
Conceptualization, J.X.; Formal analysis, J.X. and J.Y.; Funding acquisition, Y.X.; Methodology, J.X.; Project administration, Y.X.; Resources, Y.X.; Supervision, Y.X.; Visualization, J.W.; Writing—original draft, J.X.; Writing—review & editing, J.Y., Q.W. and X.D.
Funding
This study was funded in part by the Foundation items: the National Key Research and Development Program of China (Grant No. 2018YFC1508201, 2016YFC0401502), National Natural Science Foundation of China (Grant No. 41771032, 41601039), and Water Conservancy Science and Technology Foundation of Jiangsu Province (Grant No. 2015003).
Acknowledgments
We would like to thank the anonymous reviewers and the editors for their profound comments, which help us improved the quality of this paper.
Conflicts of Interest
The authors declare no conflict of interest.
Symbols and Abbreviations
| WCXY | the water conservancy region of Wuchengxiyu |
| YCDM | the water conservancy region of Yangchengdianmao |
| HJH | the water conservancy region of Hangjiahu |
| 3S | Remote sensing (RS), Geography information systems (GIS) and Global positioning systems (GPS) |
| DEM | the digital elevation model |
| DLG | the Digital Line Graphic |
| FSA | fixed size algorithms |
| E | the box size of the overlay network |
| Qi(ε) | the river distribution probability in box i of ε × ε grid |
| Mi(ε) | the overall length of the rivers in box i |
| M | the total length of the studied river networks |
| Xq(ε) | the partition function |
| N(ε) | the number of non-empty boxes covered the overall river networks of ε × ε grid |
| q∈(−∞, +∞) | the weight factor or probability moment |
| τ(q) | the mass exponent of the q power |
| Dq: | the multifractal dimension or generalized fractal dimension |
| A | singularity exponent |
| f(α) | the multifractal spectrum |
| ∆α | the variation of singularity component or the width of the multifractal spectrum |
| Δf | the heights variation of multifractal spectrum |
| determination coefficient of q = 0 | |
| TM | Landsat Thematic Mapper |
| Up | the ratio of non-agricultural population to total regional population |
| Ue | the ratio of non-agricultural GRDP (Gross Regional Domestic Product) to regional GRDP |
| AVG | the average of Up, Ue and Us |
| Rd (km/km2) | the river density |
| MIUH | the Multifractal Instantaneous Unit Hydrograph |
References
- Mandelbrot, B.B. How long is the coast of Britain? Statistical self-similarity and fractional dimension. Science 1967, 156, 636–638. [Google Scholar] [CrossRef]
- Parisi, G.; Frisch, U. On the singularity structure of fully developed turbulence. In Turbulence and Predictability in Geophysical Fluid Dynamics; Proceedings of the International School of Physic Enrico Fermi: Amsterdam, The Netherlands, 1985; pp. 84–87. [Google Scholar]
- Liu, Y.Y.; Luo, X.S.; Chen, Q.B.; Wu, L. Application of multifractal spectrum in leaf images processing. Comput. Eng. Appl. 2008, 44, 190–192. [Google Scholar] [CrossRef]
- De Bartolo, S.G.; Gabriele, S.; Gaudio, R. Multifractal behaviour of river networks. Hydrol. Earth Syst. Sci. Discuss. 2000, 4, 105–112. [Google Scholar] [CrossRef] [Green Version]
- De Bartolo, S.G.; Gaudio, R.; Gabriele, S. Multifractal analysis of river networks: Sandbox approach. Water Resour. Res. 2004, 40, W02201. [Google Scholar] [CrossRef]
- De Bartolo, S.G.; Veltri, M.; Primavera, L. Estimated generalized dimensions of river networks. J. Hydrol. 2006, 322, 181–191. [Google Scholar] [CrossRef]
- He, L.H.; Zhao, H. The fractal dimension of river networks and its interpretation. Sci. Geogr. Sin. 1996, 16, 124–128. [Google Scholar] [CrossRef]
- La Barbera, P.; Rosso, R. On the fractal dimension of stream networks. Water Resour. Res. 1989, 25, 735–741. [Google Scholar] [CrossRef]
- Rosso, R.; Bacchi, B.; La Barbera, P. Fractal relation of mainstream length to catchment area in river networks. Water Resour. Res. 1991, 27, 381–387. [Google Scholar] [CrossRef]
- Nikora, V.I.; Sapozhnikov, V.B. River network fractal geometry and its computer simulation. Water Resour. Res. 1993, 29, 3569–3575. [Google Scholar] [CrossRef]
- Tarboton, D.G. Fractal river networks, Horton’s laws and Tokunaga cyclicity. J. Hydrol. 1996, 187, 105–117. [Google Scholar] [CrossRef]
- Li, M.; Zhu, L.R.; Long, H.Y. On fractal and multifractal properties for different types of landforms. Acta Geosci. Sin. 2003, 24, 237–242. [Google Scholar] [CrossRef]
- Shen, Z.Y.; Li, Z.B.; Li, P.; Lu, K.X. Multifractal arithmethic for watershed topographic feature. Adv. Water Sci. 2009, 20, 385–391. [Google Scholar] [CrossRef]
- Zhang, Y.C.; Zheng, T.T.; Wan, T.; Cheng, H.H.; Zhang, C. Analysis of Himalayas Mountains based on multifractal characteristics. J. Chongqing Technol. Bus. Univ. 2011, 28, 86–89. [Google Scholar] [CrossRef]
- Junior, O.C.; Guimaraes, R.; Freitas, L.; Gomes-Loebmann, D.; Gomes, R.A.; Martins, E.; RMontgomery, D. Urbanization impacts upon catchment hydrology and gully development using mutli-temporal digital elevation data analysis. Earth Surf. Process. Landf. 2010, 35, 611–617. [Google Scholar] [CrossRef]
- Wang, L.; Wang, K. Impacts of Dem Uncertainty on Estimated Surface Solar Radiation and Extracted River Network. Bull. Am. Meteorol. Soc. 2015, 96, 197–210. [Google Scholar] [CrossRef]
- Parmar, K.S.; Bhardwaj, R. Statistical, time series, and fractal analysis of full stretch of river Yamuna (India) for water quality management. Environ. Sci. Pollut. Res. 2015, 22, 397–414. [Google Scholar] [CrossRef]
- Donadio, C.; Magdaleno, F.; Mazzarella, A.; Kondolf, G.M. Fractal Dimension of the Hydrographic Pattern of Three Large Rivers in the Mediterranean Morphoclimatic System: Geomorphologic Interpretation of Russian (USA), Ebro (Spain) and Volturno (Italy) Fluvial Geometry. Pure Appl. Geophys. 2015, 172, 1975–1984. [Google Scholar] [CrossRef]
- Ariza-Villaverde, A.B.; Jiménez-Hornero, F.J.; Gutiérrez de Ravé, E. Influence of DEM resolution on drainage network extraction: A multifractal analysis. Geomorphology 2015, 241, 243–254. [Google Scholar] [CrossRef]
- Ariza-Villaverde, A.B.; Jiménez-Hornero, F.J.; Gutiérrez de, R. Multifractal analysis applied to the study of the accuracy of DEM-based stream derivation. Geomorphology 2013, 197, 85–95. [Google Scholar] [CrossRef]
- Fotherby, L.M. Valley confinement as a factor of braided river pattern for the Platte River. Geomorphology 2009, 103, 562–576. [Google Scholar] [CrossRef]
- Bergstrom, A.; McGlynn, B.; Mallard, J.; Covino, T. Watershed structural influences on the distributions of stream network water and solute travel times under baseflow conditions. Hydrol. Process 2016, 30, 2671–2685. [Google Scholar] [CrossRef]
- Rinaldo, A.; Rigon, R.; Banavar, J.R.; Maritan, A.; Rodriguez-Iturbe, I. Evolution and selection of river networks: Statics, dynamics, and complexity. Proc. Natl. Acad. Sci. USA 2014, 111, 2417–2424. [Google Scholar] [CrossRef] [PubMed] [Green Version]
- Tonkin, J.D.; Altermatt, F.; Finn, D.S.; Heino, J.; Olden, J.D.; Pauls, S.U.; Lytle, D.A. The role of dispersal in river network metacommunities: Patterns, processes, and pathways. Freshw. Biol. 2018, 63, 141–163. [Google Scholar] [CrossRef]
- Deng, X.J.; Xu, Y.P.; Han, L.F. Impacts of human activities on the structural and functional connectivity of a river network in the taihu plain. Land Degrad. Dev. 2018, 29, 2575–2588. [Google Scholar] [CrossRef]
- López-Vicente, M.; Nadal-Romero, E.; Cammeraat, E.L.H. Hydrological connectivity does change over 70 years of abandonment and afforestation in the Spanish Pyrenees. Land Degrad. Dev. 2017, 28, 1298–1310. [Google Scholar] [CrossRef]
- Zhang, S.; Guo, Y.; Wang, Z. Correlation between flood frequency and geomorphologic complexity of rivers network–A case study of Hangzhou China. J. Hydrol. 2015, 527, 113–118. [Google Scholar] [CrossRef]
- Men, K.P.; Zhu, S.D. The Ordered Network Structure and its Prediction for the Big Floods of the Changjiang River Basins. Z. Für Nat. A 2014, 68, 766–772. [Google Scholar] [CrossRef]
- Gregory, K.J. The human role in changing river channels. Geomorphology 2006, 79, 172–191. [Google Scholar] [CrossRef]
- Chin, A. Urban transformation of river landscapes in a global context. Geomorphology 2006, 79, 460–487. [Google Scholar] [CrossRef]
- Hooke, J.M. Human impacts on fluvial systems in the Mediterranean region. Geomorphology 2006, 79, 311–335. [Google Scholar] [CrossRef]
- Sear, D.A.; Newson, M.D. Environmental change in river channels: A neglected element. Towards geomorphological typologies, standards and monitoring. Sci. Total Environ. 2003, 310, 17–23. [Google Scholar] [CrossRef]
- Gaudio, R.; De Bartolo, S.G.; Primavera, L.; Veltri, M.; Gabriele, S. Procedures in multifractal analysis of river networks: A state of the art review. In the Basis of Civilization—Water Science Proceedings of the UNESCO/IAHS/IWHA symposium, Rome, Italy, 3–6 December 2003; IAHS Publication: Wallingford, UK, 2004; Volume 286, pp. 228–237. [Google Scholar]
- Kalantari, Z.; Ferreira, C.S.S.; Walsh, R.P.D.; Destouni, G. Urbanization development under climate change: Hydrological responses in a peri-urban Mediterranean catchment. Land Degrad. Dev. 2017, 28, 2207–2221. [Google Scholar] [CrossRef]
- Deng, X.J.; Xu, Y.P.; Han, L.F.; Song, S.; Yang, L.; Li, G.; Wang, Y.F. Impacts of Urbanization on River Systems in the Taihu Region, China. Water 2015, 7, 1340–1358. [Google Scholar] [CrossRef]
- Deng, X.J.; Xu, Y.P.; Han, L.F.; Li, G.; Wang, Y.F.; Xiang, J.; Xu, G.L. Spatial-temporal changes of river systems in Jiaxing under the background of urbanization. Acta Geogr. Sin. 2016, 71, 75–85. [Google Scholar] [CrossRef]
- Deng, X.J.; Xu, Y.P.; Han, L.F.; Yang, M.N.; Yang, L.; Song, S.; Li, G.; Wang, Y.F. Spatial-temporal evolution of the distribution pattern of river systems in the plain river network region of the Taihu Basin, China. Quat. Int. 2016, 392, 178–186. [Google Scholar] [CrossRef]
- Julian, J.P.; Wilgruber, N.A.; de Beurs, K.M.; Mayer, P.M.; Jawarneh, R.N. Long-term impacts of land cover changes on stream channel loss. Sci. Total Environ. 2015, 537, 399–410. [Google Scholar] [CrossRef]
- Han, L.F.; Xu, Y.P.; Yang, L.; Deng, X.J.; Hu, C.S.; Xu, G.L. Temporal and spatial change of stream structure in Yangtze River Delta and its driving forces during 1960s–2010s. Acta Geogr. Sin. 2015, 70, 819–827. [Google Scholar] [CrossRef]
- Elmore, A.J.; Kaushal, S.S. Disappearing headwaters: Patterns of stream burial due to urbanization. Front. Ecol. Environ. 2008, 6, 308–312. [Google Scholar] [CrossRef]
- Han, C.L.; Mao, Y. The structure characteristics and the functional variation of the river systems in Taihu Lake Catchment. J. Lake Sci. 1997, 9, 300–306. [Google Scholar] [CrossRef]
- Strahler, A.N. Quantitative analysis of watershed geomorphology. Eos Trans. Am. Geophys. Union 1957, 38, 913–920. [Google Scholar] [CrossRef]
- Mandelbrot, B.B. Possible refinement of the lognormal hypothesis concerning the distribution of energy dissipation in intermittent turbulence. In Statistical Models and Turbulence; Rosenblatt, M., Van Atta Lect, C., Eds.; Springer: Berlin/Heidelberg, Germany, 1972; Volume 12, pp. 333–351. [Google Scholar] [CrossRef]
- Mandelbrot, B.B. Intermittent turbulence in self-similar cascades: Divergence of high moments and dimension of the carrier. J. Fluid Mech. 1974, 62, 331–358. [Google Scholar] [CrossRef]
- Halsey, T.C.; Jensen, M.H.; Kadanoff, L.P.; Procaccia, I.; Shraiman, B.I. Fractal measures and their singularities: The characterization of strange sets. Phys. Rev. A 1986, 33, 1141–1151. [Google Scholar] [CrossRef] [PubMed]
- Wang, J.Y.; Peng, N.; Liu, Y.S.; Nie, B.F. The Multifractal Research of River Watershed Geomorphology in Volcanic Region of Changbai Mountains. J. Cap. Norm. Univ. Nat. Sci. Ed. 2013, 34, 77–81. [Google Scholar] [CrossRef]
- Feder, J. Fractals; Plenum Press: New York, NY, USA, 1988. [Google Scholar]
- Aharony, A. Measuring multifractals. Phys. Nonlinear Phenom. 1989, 38, 1–4. [Google Scholar] [CrossRef]
- Falconer, K.J. Fractal Geometry: Mathematical Foundations and Applications; John Wiley: Hoboken, NJ, USA, 1990. [Google Scholar]
- Mach, J.; Mas, F.; Sague´s, F. Two representations in multifractal analysis. J. Phys. A Math. Gen. 1995, 28, 5607–5622. [Google Scholar] [CrossRef]
- Halsey, T.C.; Jensen, M.H.; Kadanoff, L.P.; Procaccia, I.; Shraiman, B.I. Stream construction characteristics in rapid urbanization area. Geogr. Res. 2008, 27, 1212–1220. [Google Scholar] [CrossRef]
- Lashermes, B.; Foufoula-Georgiou, E. Area and width functions of river networks: New results on multifractal properties. Water Resour. Res. 2007, 43, W09405. [Google Scholar] [CrossRef]
- Gaudio, R.; De Bartolo, S.G.; Primavera, L.; Gabriele, S.; Veltri, M. Lithologic control on the multifractal spectrum of river networks. J. Hydrol. 2006, 327, 365–375. [Google Scholar] [CrossRef]
- Dombrádi, E.; Timár, G.; Bada, G.; Cloetingh, S.; Horváth, F. Fractal dimension estimations of drainage network in the Carpathian–Pannonian system. Glob. Planet. Chang. 2007, 58, 197–213. [Google Scholar] [CrossRef]
- Shen, X.H.; Zou, L.J.; Zhang, G.F.; Su, N.; Wu, W.Y.; Yang, S.F. Fractal characteristics of the main channel of Yellow River and its relation to regional tectonic evolution. Geomorphology 2011, 127, 64–70. [Google Scholar] [CrossRef]
- Tian, S.M.; Su, X.H.; Wang, W.H.; Lai, R.X. Application of Fractal Theory in the River Regime in the Lower Yellow River. Appl. Mech. Mater 2012, 190–191, 1238–1243. [Google Scholar] [CrossRef]
- Tarboton, D.G.; Bras, R.L.; Rodriguez-Iturbe, I. The fractal nature of river networks. Water Resour. Res. 1988, 24, 1317–1322. [Google Scholar] [CrossRef]
- Ijjasz-Vasquez, E.J.; Rodriguez-Iturbe, I.; Bras, R.L. On the multifractal characterization of river basins. Geomorphology 1992, 5, 297–310. [Google Scholar] [CrossRef]
- Claps, P.; Oliveto, G. Reexamining the determination of the fractal dimension of river networks. Water Resour. Res. 1996, 32, 3123–3135. [Google Scholar] [CrossRef]
- Kamer, Y.; Ouillon, G.; Sornette, D. Barycentric fixed-mass method for multifractal analysis. Phys. Rev. E 2013, 88, 022922. [Google Scholar] [CrossRef] [PubMed] [Green Version]
- Wang, Y.F.; Xu, Y.P.; Zhang, Q.Y.; Li, G.; Lei, C.G.; Yang, L.; Han, L.F.; Deng, X.J. Influence of stream structure change on regulation capacity of river networks in Taihu Lake Basin. Acta Geogr. Sin. 2016, 71, 449–458. [Google Scholar] [CrossRef]
- Gires, A.; Tchiguirinskaia, I.; Schertzer, D.; Ochoa Rodriguez, S.; Willems, P.; Ichiba, A.; Wang, L.; Pina, R.; Van Assel, J.; Bruni, G.; et al. Fractal analysis of urban catchments and their representation in semi-distributed models: Imperviousness and sewer system. Hydrol. Earth Syst. Sci. 2017, 21, 2361–2375. [Google Scholar] [CrossRef]
Figure 1.
The location of the study area.

Figure 2.
Typical multifractal spectrum diagram.

Figure 3.
The ln(Xq(ε))~ln(ε) relationships of Wuchengxiyu (WCXY), Yangchengdianmao (YCDM), and Hanhjiahu (HJH) in 1960s–2010s under q from –4 to 4.
Figure 3.
The ln(Xq(ε))~ln(ε) relationships of Wuchengxiyu (WCXY), Yangchengdianmao (YCDM), and Hanhjiahu (HJH) in 1960s–2010s under q from –4 to 4.

Figure 4.
The relationship between mass exponent τ(q) and moment orders q of Hangjiahu (HJH), Wuchengxiyu (WCXY), and Yangchengdianmao (YCDM) in the 1960s, 1980s, and 2010s.
Figure 4.
The relationship between mass exponent τ(q) and moment orders q of Hangjiahu (HJH), Wuchengxiyu (WCXY), and Yangchengdianmao (YCDM) in the 1960s, 1980s, and 2010s.

Figure 5.
The relationship between multifractal dimension Dq and moment order q of three different areas: Hangjiahu (HJH), Wuchengxiyu (WCXY), and Yangchengdianmao (YCDM) in the 1960s, 1980s, and 2010s.
Figure 5.
The relationship between multifractal dimension Dq and moment order q of three different areas: Hangjiahu (HJH), Wuchengxiyu (WCXY), and Yangchengdianmao (YCDM) in the 1960s, 1980s, and 2010s.

Figure 6.
The multifractal spectrum of the studied river networks in 1960s, 1980s, and 2010s.

Figure 7.
The multifractal spectrum of the Main Rivers (1st and 2nd order, (a)) and Tributaries (3rd and 4th order, (b)) in the 1960s, 1980s, and 2010s.
Figure 7.
The multifractal spectrum of the Main Rivers (1st and 2nd order, (a)) and Tributaries (3rd and 4th order, (b)) in the 1960s, 1980s, and 2010s.


Table 1.
Rivers classification in study areas.
| Types | Orders | Widths | Graphical Representation | Main Functions | |
|---|---|---|---|---|---|
| Paper Topographic Map | Digital Line Graphics | ||||
| Main Rivers | 1st | >40 m | Double line rivers (>0.8 mm) | Planar canal, surface rivers and main channel | Discharge |
| 2nd | 20–40 m | Double line rivers (0.4–0.8 mm) | Planar canal, surface rivers and main channel | ||
| Tributaries | 3rd | 10–20 m | Wide single line rivers (0.3mm) | Linear surface rivers and main channel | Storage |
| 4th | <10 m | Narrow single line rivers (0.15mm) | Linear branch channel | ||
Table 2.
Multifractal characteristics of study areas in different periods.
| Areas | Periods | D0 = f(α0) | α0 | αmin | αmax | f(αmin) | f(αmax) | △α | △f | |
|---|---|---|---|---|---|---|---|---|---|---|
| Wuchengxiyu (WCXY) | 1960s | 1.908 | 0.9976 | 2.031 | 1.278 | 2.716 | 0.508 | 1.370 | 1.438 | 0.862 |
| 1980s | 1.907 | 0.9976 | 2.022 | 1.212 | 2.811 | 0.396 | 1.239 | 1.599 | 0.843 | |
| 2010s | 1.908 | 0.9976 | 2.017 | 1.182 | 2.734 | 0.373 | 1.279 | 1.552 | 0.906 | |
| Yangchengdianmao (YCDM) | 1960s | 1.901 | 0.9977 | 2.049 | 1.356 | 2.379 | 0.666 | 1.748 | 1.023 | 1.082 |
| 1980s | 1.903 | 0.9977 | 2.048 | 1.392 | 2.380 | 0.724 | 1.750 | 0.988 | 1.026 | |
| 2010s | 1.903 | 0.9977 | 2.044 | 1.334 | 2.394 | 0.631 | 1.733 | 1.060 | 1.102 | |
| Hangjiahu (HJH) | 1960s | 1.905 | 0.9977 | 2.034 | 1.351 | 2.847 | 0.612 | 1.262 | 1.496 | 0.650 |
| 1980s | 1.905 | 0.9977 | 2.032 | 1.310 | 2.835 | 0.540 | 1.260 | 1.525 | 0.720 | |
| 2010s | 1.905 | 0.9976 | 2.041 | 1.266 | 2.878 | 0.468 | 1.232 | 1.612 | 0.764 |
Table 3.
Multifractal features of the Main Rivers (1st and 2nd order) and Tributaries (3rd and 4th order) in studied periods.
Table 3.
Multifractal features of the Main Rivers (1st and 2nd order) and Tributaries (3rd and 4th order) in studied periods.
| Areas | Periods | Entire Rivers | Main Rivers | Tributaries | Change Periods | Entire Rivers | Main Rivers | Tributaries | ||||||
|---|---|---|---|---|---|---|---|---|---|---|---|---|---|---|
| △α | △f | △α | △f | △α | △f | Change of △α/% | Change of △f /% | Change of △α /% | Change of △f /% | Change of △α/% | Change of △f /% | |||
| WCXY | 1960s | 1.438 | 0.862 | 1.727 | 1.700 | 1.489 | 0.898 | 1960s–1980s | 11.2 | −2.2 | 4.5 | −3.4 | 10.3 | −1.6 |
| 1980s | 1.599 | 0.843 | 1.804 | 1.642 | 1.643 | 0.884 | 1980s–2010s | −2.9 | 7.5 | 4.3 | −10.2 | −3.7 | 3.5 | |
| 2010s | 1.552 | 0.906 | 1.881 | 1.475 | 1.582 | 0.915 | 1960s–2010s | 7.9 | 5.1 | 8.9 | −13.2 | 6.2 | 1.9 | |
| YCDM | 1960s | 1.023 | 1.082 | 1.105 | 1.509 | 1.138 | 1.269 | 1960s–1980s | −3.4 | −5.2 | 4.0 | 4.9 | −5.4 | −7.4 |
| 1980s | 0.988 | 1.026 | 1.149 | 1.583 | 1.076 | 1.175 | 1980s–2010s | 7.3 | 7.4 | −4.3 | −4.0 | 9.7 | 10.9 | |
| 2010s | 1.060 | 1.102 | 1.100 | 1.519 | 1.180 | 1.303 | 1960s–2010s | 3.6 | 1.8 | −0.5 | 0.7 | 3.7 | 2.7 | |
| HJH | 1960s | 1.496 | 0.650 | 1.719 | 1.240 | 1.522 | 0.744 | 1960s–1980s | 1.9 | 10.8 | −2.4 | 2.5 | 3.5 | 10.9 |
| 1980s | 1.525 | 0.720 | 1.677 | 1.271 | 1.575 | 0.825 | 1980s–2010s | 5.7 | 6.1 | 0.2 | −0.4 | 9.1 | 13.7 | |
| 2010s | 1.612 | 0.764 | 1.680 | 1.266 | 1.719 | 0.938 | 1960s–2010s | 7.8 | 17.5 | −2.3 | 2.1 | 12.9 | 26.1 | |
Table 4.
Grey Correlation between the river networks changes and urbanization level in Wuchengxiyu (WCXY), Yangchengdianmao (YCDM) and Hangjiahu (HJH) in the 1960s, 1980s, and 2010s.
Table 4.
Grey Correlation between the river networks changes and urbanization level in Wuchengxiyu (WCXY), Yangchengdianmao (YCDM) and Hangjiahu (HJH) in the 1960s, 1980s, and 2010s.
| Urbanization Rate | Wuchengxiyu (WCXY) | Yangchengdianmao (YCDM) | Hangjiahu (HJH) | ||||||
|---|---|---|---|---|---|---|---|---|---|
| △α | △f | Rd | △α | △f | Rd | △α | △f | Rd | |
| Up | 0.770 | 0.773 | 0.684 | 0.690 | 0.607 | 0.645 | 0.561 | 0.615 | 0.661 |
| Ue | 0.736 | 0.727 | 0.706 | 0.661 | 0.594 | 0.633 | 0.650 | 0.618 | 0.676 |
| Us | 0.809 | 0.749 | 0.834 | 0.680 | 0.605 | 0.642 | 0.690 | 0.817 | 0.865 |
| AVG | 0.772 | 0.750 | 0.741 | 0.677 | 0.602 | 0.640 | 0.634 | 0.683 | 0.734 |
Note: Rd (km/km2) represents river density which is the total length of river per unit area in a catchment, which is an important characteristic of river networks evolution and has a significant impact on the storage and discharge capacity of the watershed. The expression of river density is: Rd = L/A, where L represents the total length of river (km), and A is the area of basin (km2) [35,36,39]. Rd of WCXY declined from 3.80 in 1960s to 3.27 in 1980s, and then to 2.93 in 2010s; In YCDM, Rd increased from 3.54 in 1960s to 3.87 in 1980s, and then decreased to 3.41 in 2010s; and Rd in HJH decreased from 3.75 in 1960s to 3.24 in 1980s, then to 2.93 in 2010s. Up is the ratio of non-agricultural population to total regional population; Ue is the ratio of non-agricultural GRDP (Gross Regional Domestic Product) to regional GRDP; Us is the ratio of urban construction land area to total area; and AVG is the average of Up, Ue and Us.
© 2019 by the authors. Licensee MDPI, Basel, Switzerland. This article is an open access article distributed under the terms and conditions of the Creative Commons Attribution (CC BY) license (http://creativecommons.org/licenses/by/4.0/).
Share and Cite
MDPI and ACS Style
Xiang, J.; Xu, Y.; Yuan, J.; Wang, Q.; Wang, J.; Deng, X. Multifractal Analysis of River Networks in an Urban Catchment on the Taihu Plain, China. Water 2019, 11, 2283. https://doi.org/10.3390/w11112283
AMA Style
Xiang J, Xu Y, Yuan J, Wang Q, Wang J, Deng X. Multifractal Analysis of River Networks in an Urban Catchment on the Taihu Plain, China. Water. 2019; 11(11):2283. https://doi.org/10.3390/w11112283
Chicago/Turabian StyleXiang, Jie, Youpeng Xu, Jia Yuan, Qiang Wang, Jie Wang, and Xiaojun Deng. 2019. "Multifractal Analysis of River Networks in an Urban Catchment on the Taihu Plain, China" Water 11, no. 11: 2283. https://doi.org/10.3390/w11112283
Note that from the first issue of 2016, this journal uses article numbers instead of page numbers. See further details here.