Article

The Evapotranspiration of Tamarix and Its Response to Environmental Factors in Coastal Saline Land of China

1
Key Laboratory of Agricultural Water Resources, Center for Agricultural Resources Research, Institute of Genetics and Developmental Biology, Chinese Academy of Sciences, Shijiazhuang 050021, China
2
University of Chinese Academy of Sciences, Beijing 100049, China
3
Tobacco Research Institute, Chinese Academy of Agricultural Sciences, Qingdao 266101, China
4
College of Agronomy, Qingdao Agricultural University, Qingdao 266109, China
*
Authors to whom correspondence should be addressed.
Water 2019, 11(11), 2273; https://doi.org/10.3390/w11112273
Submission received: 27 September 2019 / Revised: 25 October 2019 / Accepted: 26 October 2019 / Published: 30 October 2019
(This article belongs to the Section Hydrology)

Abstract

:
(1) Background: As a halophytic species, Tamarix (Tamarix chinensis) can be used for saline soil rehabilitation in China. The reclamation and rehabilitation of saline soil depend on the water consumption of plants. However, whether water resources in saline soil can support the construction of Tamarix vegetation is still unknown. (2) Methods: In this study, we measured the transpiration (T) of Tamarix for 3 years using sap flow and the evaporation (E) for 1 year using a micro-lysimeter in Tamarix land. The evaporation values in 2016 and 2017 were estimated with the soil crop coefficients obtained in 2018. (3) Results: The evapotranspiration (ET) ranged from 514.2 to 573.8 mm and was greatly affected by the wind speed, VPD and groundwater table. Transpiration was the main form of water consumption in this region, accounting for 60.2% of the total evapotranspiration. Compared with bare land, vegetation construction increased soil moisture dissipation by 377.6 mm in 2018. According to on-site measurements and estimates, the water shortage in the dry year was 107.2 mm, and the residual water values in the normal year and wet year were 77.8 mm and 187.5 mm, respectively. May and September were months of widespread water shortages in different precipitation years. Although the cultivation of this plant increased water consumption, the groundwater table remained at approximately 0.5 m during the study year. (4) Conclusions: These results indicated that planting Tamarix in coastal saline soil was feasible for the reclamation and rehabilitation of saline soil. In the dry year (2017), the consumption of evapotranspiration exceeded the precipitation. The inverse occurred in the normal year (2016) and wet year (2018). Taken together, our findings showed that the water resources in the coastal saline soil of China could tolerate vegetation construction and laid a strong foundation for saline soil rehabilitation.

1. Introduction

Soil salinization is a global ecological problem. In China, saline soil covers approximately 3.6 × 10⁵ km2 and is mainly distributed in the northwest, north, northeast, and coastal areas regions [1]. The soil in these regions is challenged by freshwater resource shortages, high salinization, poor physical and chemical properties, and the high salinization of groundwater, which seriously affect crop production and environment rehabilitation [2]. Therefore, to better utilize land resources, meet food supply needs and improve environmental stewardship, the rehabilitation and utilization of saline soil is particularly important.
Tamarix is one of the most widely distributed halophytes in saline soil areas in China. With properties of strong salt tolerance and drought resistance, this plant is often used for saline soil rehabilitation [3,4]. Previous studies have shown that Tamarix can absorb and utilize groundwater to reduce the groundwater table [5,6,7]. Meanwhile, this vegetation can directly absorb salt ions in the soil to reduce salinity [8]. In addition, planting Tamarix can reduce the spatial variation of the soil salt content and facilitate the homogenization of saline soil [9]. Therefore, it is widely used in saline soils of China for rehabilitation. Tamarix possesses a high leaf area index (3.5 m2/m2) and can consume a lot of water through transpiration [10]. Previous studies showed that its evapotranspiration ranged from 700 to 1200 mm per year in the southwestern United States [11], however, lower rates of 520 mm were measured in the Hetao Irrigation District of China [12]. This high evapotranspiration may cause water circulation imbalances and regional water resource depletion. Therefore, determining whether regional water resources can support using Tamarix as a restoration plant in saline soil rehabilitation is an urgent problem to be solved.
Evapotranspiration (ET) is the sum of plant transpiration (T) and soil evaporation (E). The ratio of plant transpiration to total terrestrial evapotranspiration (T/ET) reflects the role of vegetation in land–atmosphere interactions [13]. The higher the T/ET ratio, the greater the role of plant transpiration in land–atmosphere interactions. Previous studies largely focused on measuring or estimating total ET for Tamarix [14,15,16]. Few studies separated ET into E and T. The dual crop coefficient method is usually used to estimate ET combined with the reference grass evapotranspiration (ET0). The dual crop coefficient (Kc) method separately estimates both T and E by partitioning Kc into two coefficients: (1) the basal crop coefficient (Kcb), which is crop-specific and represents the ratio of T to ET0; and (2) the soil evaporation coefficient (Kce), which represents the daily ratio of E to ET0 [17]. This method provides a rough estimate of evaporation or transpiration. Thus, the evapotranspiration (ET) partition of Tamarix provides an important guiding significance for water resource management in saline soil rehabilitation.
The ET value is affected by many environmental factors [18,19,20,21]. Han et al. [22] found the chief meteorological factors affecting ET were net radiation (Rn) and vapor pressure deficit (VPD). In northern China, the meteorological factor that most affected ET was relative humidity, followed by wind speed [23]. Thus, the influence of environmental factors varies by different regions and plants. The relationship between environmental factors and ET were investigated with respect to water dissipation during Tamarix vegetation establishment.
In the rehabilitation of saline soil, Tamarix inevitably consumes the water resources present in saline soil. Whether the available water resources can meet its needs is an important ecological question. The objectives of this study were (1) quantify the evapotranspiration, evaporation and transpiration of Tamarix in coastal saline soil and (2) assess the effects of environmental factors on Tamarix ET.

2. Materials and Methods

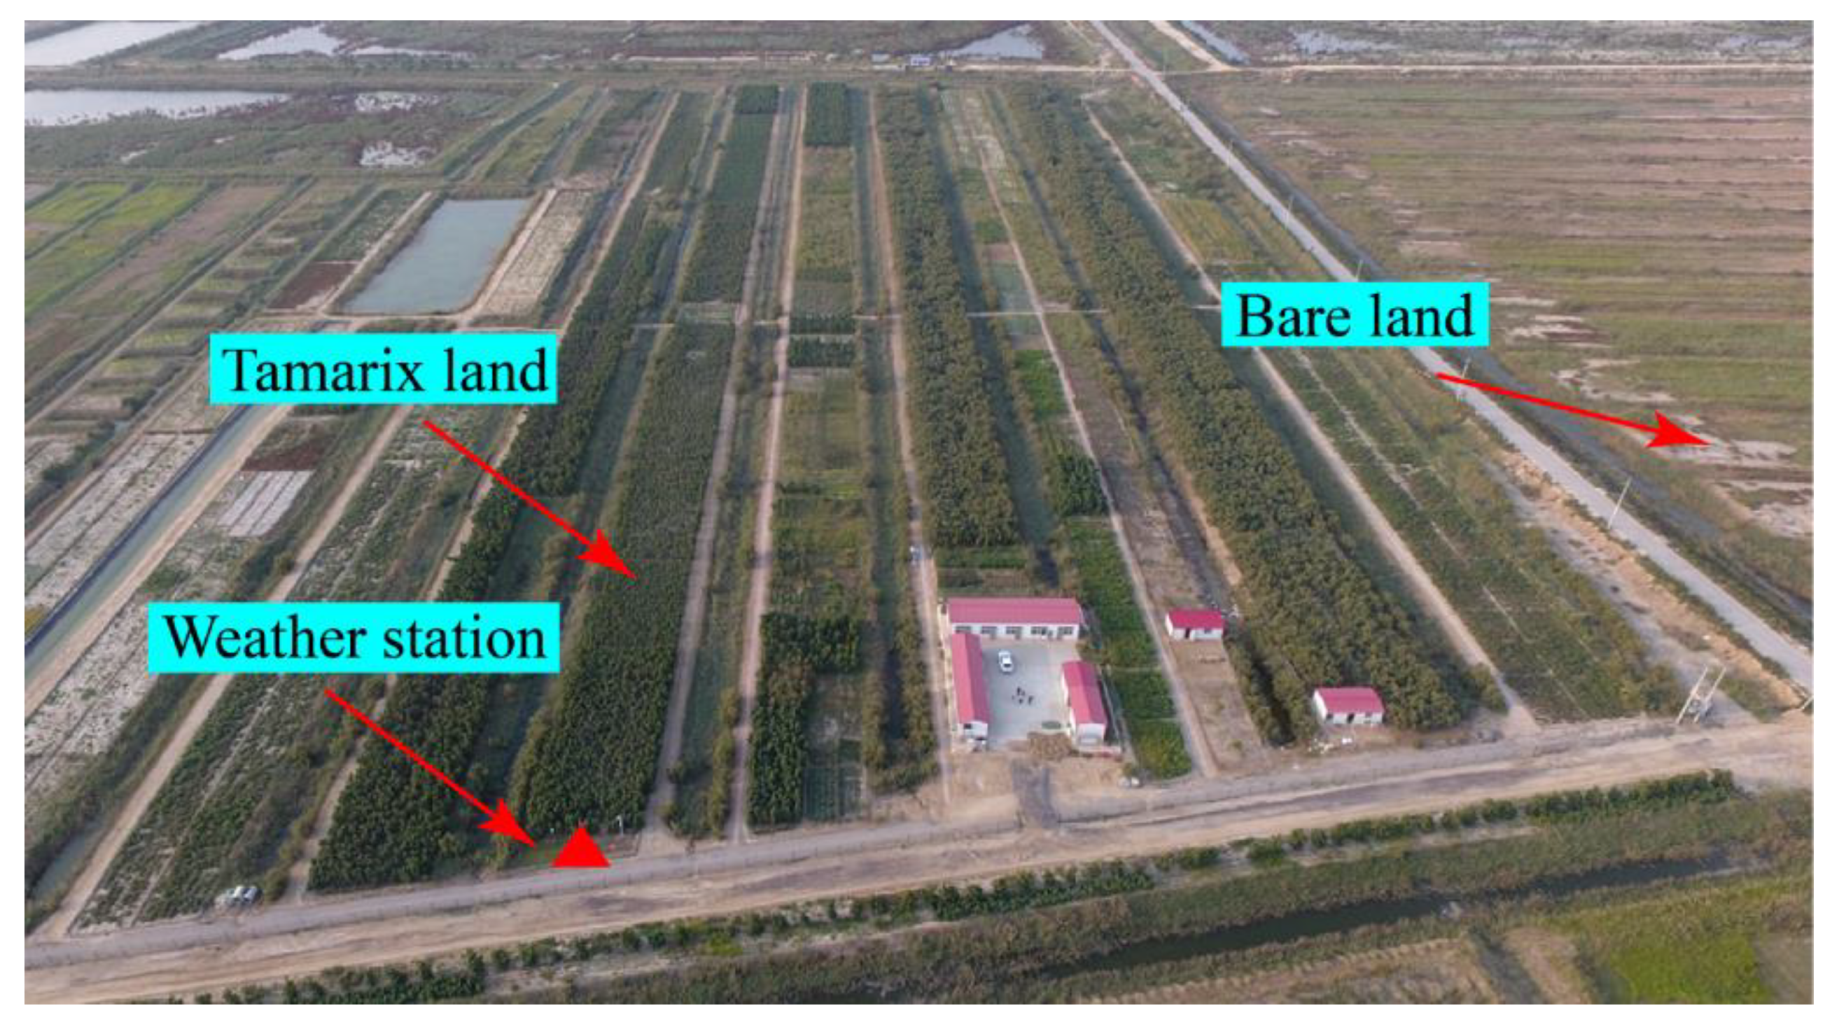
2.1. Study Site and Plant Species

This study was conducted at the Haixing Experimental Base of the Chinese Academy of Sciences (38°09′ N, 117°33′ E, elevation approximately 5 m), which is located in the highly coastal saline soil around the Bohai Sea. The study area is a typical semi-humid continental climate. The annual mean precipitation is 569 mm and was mainly concentrated in July and August (Figure 1). The mean annual temperature was 12.9 °C. Soil salinities are strong in this region, ranging from 4 to 30 g/kg [9]. Soil bulk densities range from 1.37 to 1.60 g/cm3, saturated mass water content ranges from 29.5 to 32.3%, and the high salinity range was from 15 to 25 g/kg. The average groundwater table was close to 0.5 m. Soil physical characteristics from 0 to 80 cm at the beginning of study are presented in Table 1.
The plant community was dominated by Tamarix, planted in 2012, at a density of 36 plants per 100 m2, height average of 226 cm, and diameter at breast height (DBH) of 54.5 mm. In the growing season of 2018, canopy leaf area index (LAI) of Tamarix was 2.49 ± 0.33 m2/m2 ground, measured by a plant canopy analyzer (LAI-2200, LI-COR Biosciences, Inc., Lincoln, NE, USA). Additionally, Tamarix land was covered by approximately 1 cm of fallen leaves. The understory plants were composed of shallow-root grasses, including Suaeda salsa, Ixeris chinensis and Aeluropus sinensis.

2.2. Evaporation and Transpiration Measurements

The daily soil evaporation was measured using the daily weighing method from May 1 to October 31 in 2018. Micro-lysimeters were placed on Tamarix land and bare land. The soil in the micro-lysimeter was taken from the undisturbed natural soil of the measured area. Two groups of micro-lysimeters covered by Tamarix fallen leaves (Et) and without leaves (Etb) were installed on the Tamarix land. Micro-lysimeters were also installed in bare land (Eb). Three replications were performed in each group. The micro-lysimeters contained 20 cm of undisturbed soils and were mounted on a flat or slightly higher surface of the ground soil [24]. Each micro-lysimeter was weighed at 8 a.m. each day using an electric balance with a precision of 0.01 g. The micro-lysimeter was made from two PVC tubes. The inner tube was 10 cm diameter and 20 cm high. Around it was an outer tube of the same height with a diameter of 12 cm. The outer tube was to protect the inner tube, including preventing soil adhering to it. To keep the soil moisture in the micro-lysimeter similar to that of the external environment, the undisturbed natural soil in the micro-lysimeter was replaced every 3 days, and there were no grasses in the soil. The E was calculated as follows:
E = 10 n i = 1 n Δ M S ,
where E is the soil evaporation from the micro-lysimeter (mm); S is the cross-sectional area of the micro-lysimeter (cm2), that is, 78.5 cm2 in this study; △M represents the difference in mass between the current day and the previous day; and n is the number of replications (n = 3).
The heat balance method was used [25] to measure the Tamarix xylem sap flow; this method relies on (i) the addition of a given thermal energy at a point of the stem and (ii) that energy dissipation was measured by the sap flow convection. Sap flow was closely related to transpiration, which accounted for as much as 99% of the soil water uptake [26]. Therefore, the sap flow value can be regarded as equivalent to the plant transpiration. Sap flow was measured using a Dynagage Flow32-1K system (Dynamax, Houston, TX, USA) on three trees. The instrument output was read every 60 s, and the average value of 30 min was recorded on a CR1000 data logger. The three trees were randomly chosen, and sap flow was monitored from 1 June to 31 October in 2016, from 1 May to 31 October in 2017, and from 1 May to 31 October in 2018. The probe was installed at a height of >0.5 m above the ground surface. Three trees with diameter at breast height (DBH) of 35.9 mm, 43.2 mm and 56.0 mm were selected as measuring objects.

2.3. Environmental Monitoring

Sunshine duration (h), atmospheric pressure (Pa), solar radiation (Rs), relative humidity (RH), air temperature (Ta), sunshine hours, wind speed (U), and precipitation (P) were measured daily at a nearby weather station (Figure 2). According to the precipitation frequency analysis [27], precipitation was 655.8 mm, 474.9 mm and 767.1 mm in 2016, 2017 and 2018, representing a normal year, a dry year and a wet year, respectively.
Natural soil electrical conductivity (EC) was measured by four 5TE sensors (METER Group, Inc., Washington, USA) at liang’wei, and values were recorded every 30 min on an Em50 data-logger (METER Group, Inc., Washington, USA) on the Tamarix land. EC average values for four depths were used to evaluate the relationship between EC and ET and its components (i.e., E and T).
The groundwater table (GW) was measured below the surface at 30-min intervals using an automated pressure groundwater-level logger (Levelogger Gold, Solinst Ltd., Georgetown, Canada). The groundwater level was corrected by the pressure measured by a nearby weather station. These data were calibrated in situ by manual measurement of the GW.

2.4. ET0 and VPD Estimates

The reference evapotranspiration (ET0) was calculated using Rs, Ta, RH, and U according to the Food and Agriculture Organization(FAO)Penman–Monteith equation [28]. The FAO Penman–Monteith equation is recommended as the sole standard method for calculating ET0.
E T 0 = 0.408 Δ ( R n G ) + γ 900 T + 273 u 2 ( e S e a ) Δ + γ ( 1 + 0.34 u 2 ) ,
where ET0 is reference evapotranspiration (mm/d), Rn is the net radiation at the crop surface (MJ/m/day), G is the soil heat flux density (MJ/m2/day), T is the mean daily air temperature at a height of 2 m (°C), u2 is the wind speed at a height of 2 m (m/s), es is the saturation vapor pressure (kPa), ea is the actual vapor pressure (kPa), es-ea is the saturation vapor pressure deficit (kPa), ∆ is the slope of the vapor pressure curve (kPa/°C), and γ is the psychrometric constant (kPa/°C).
V P D = e s × ( 1 R H 100 ) ,

2.5. Crop Coefficient

The crop coefficients were estimated by the ratio of measured ET values of Tamarix and ET0 (estimated by Fao56 Penman–Monteith equation).
K c = E T a E T 0
The estimated evaporation can be calculated as [28]:
K c = K c e + K c b
E = K c e × E T 0
where E T a is the measured ET values of Tamarix in 2018, Kcb is crop-specific and represents the ratio of T to ET0, and Kce is the daily ratio of E to ET0.

2.6. Gray Relational Analysis

Gray relational analysis [29] was utilized as an evaluation system to evaluate the effects of various environmental factors on evapotranspiration and its components.
Set X0 = (x0(1), x0(2), ..., x0(n)) as the sequence of system behaviour characteristics.
X1 = (x1(1), x1(2), ..., x1(n)),
X2 = (x2(1), x2(2), ..., x2(n)),
…,
Xi = (xi(1), xi(2), ..., xi(n))
set as the system sequence of associated factors.
The normalization of values is defined as follows:
x ( k ) = x ( k ) x i s i ,
The correlation coefficient is defined as follows:
ξ i ( k ) = m i n i m i n k | X 0 ( k ) X i ( k ) | + ρ m a x i m a x k | X 0 ( k ) X i ( k ) | | X 0 ( k ) X i ( k ) | + ρ m a x i m a x k | X 0 ( k ) X i ( k ) | ,
The correlation coefficient is formulated as follows:
r i = 1 n k = 1 n ξ ( x 0 ( k ) , x i ( k ) ) ,
x ( k ) is the original data; x i is the average value; s i is the standard deviation; ξ i ( k ) is the correlation coefficient; ρ is the distinctive coefficient (0–1), which is generally set as 0.5; r i is the correlation coefficient between the comparison sequence X 0 and the reference sequence X i ; and n is the number of samples (n = 109).
The higher the value of r i is, the closer the sequence of environmental factors is related to the ET and its components (i.e., E and T).

2.7. Data Analysis

The three sap flow outputs per hour were averaged, and the mean was used as the hourly sap flow value for each individual. There were 184 days with sap flow data in 2016, 2017 and 2018. Raw data processing and charting were carried out using Excel 2016 (Microsoft Corp., Redmond, Washington, USA) and Origin 2016 (Origin Lab, Hampton, MA, USA) software. Correlation analyses and ANOVA were performed using SAS 9.4 (SAS Institute Inc., Cary, North Carolina, USA).

3. Results

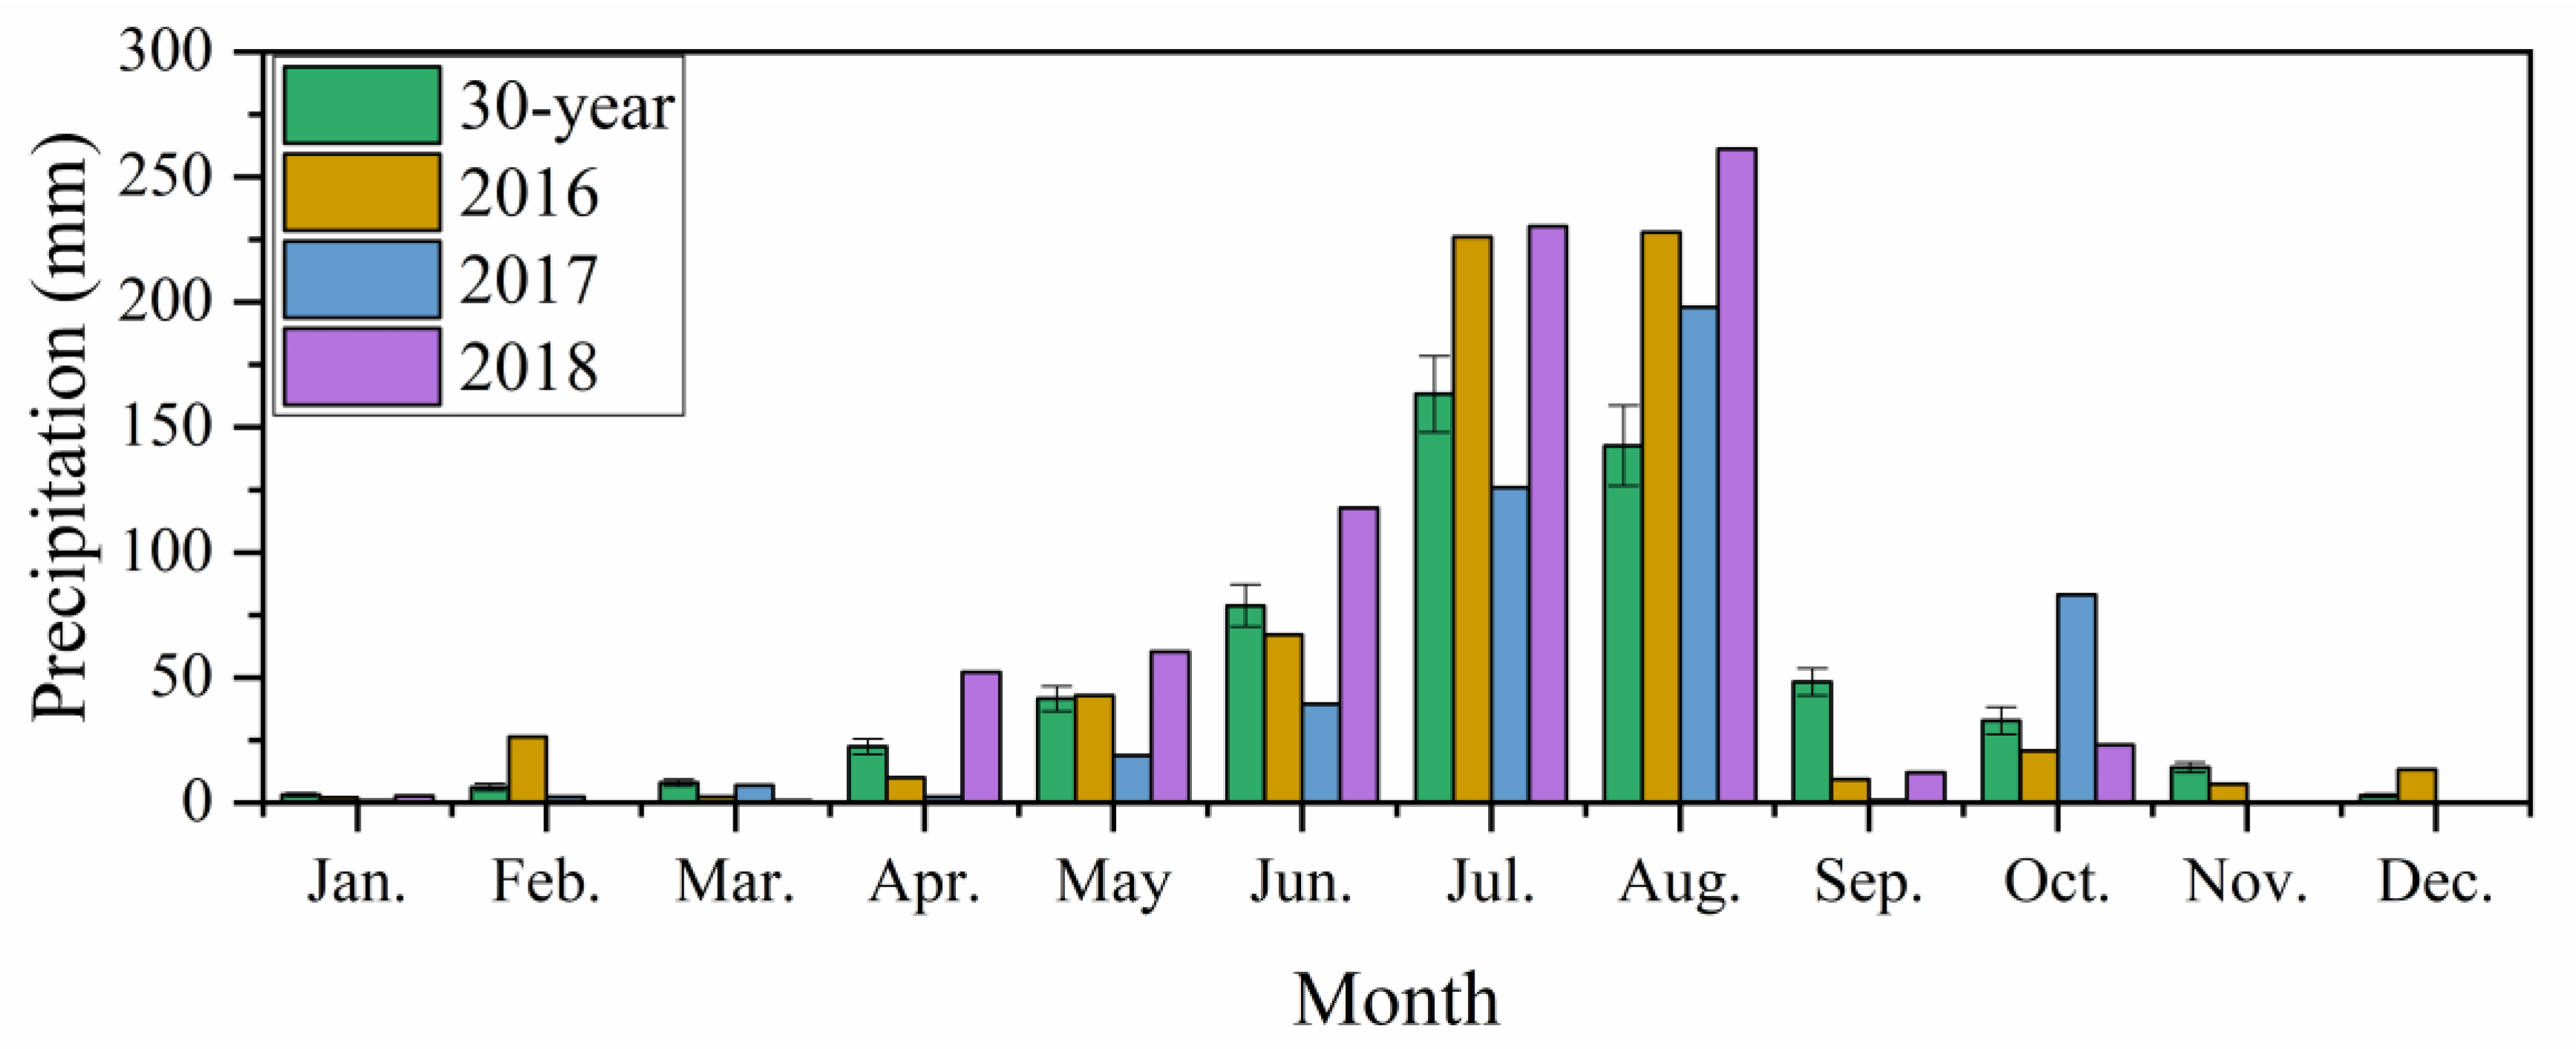
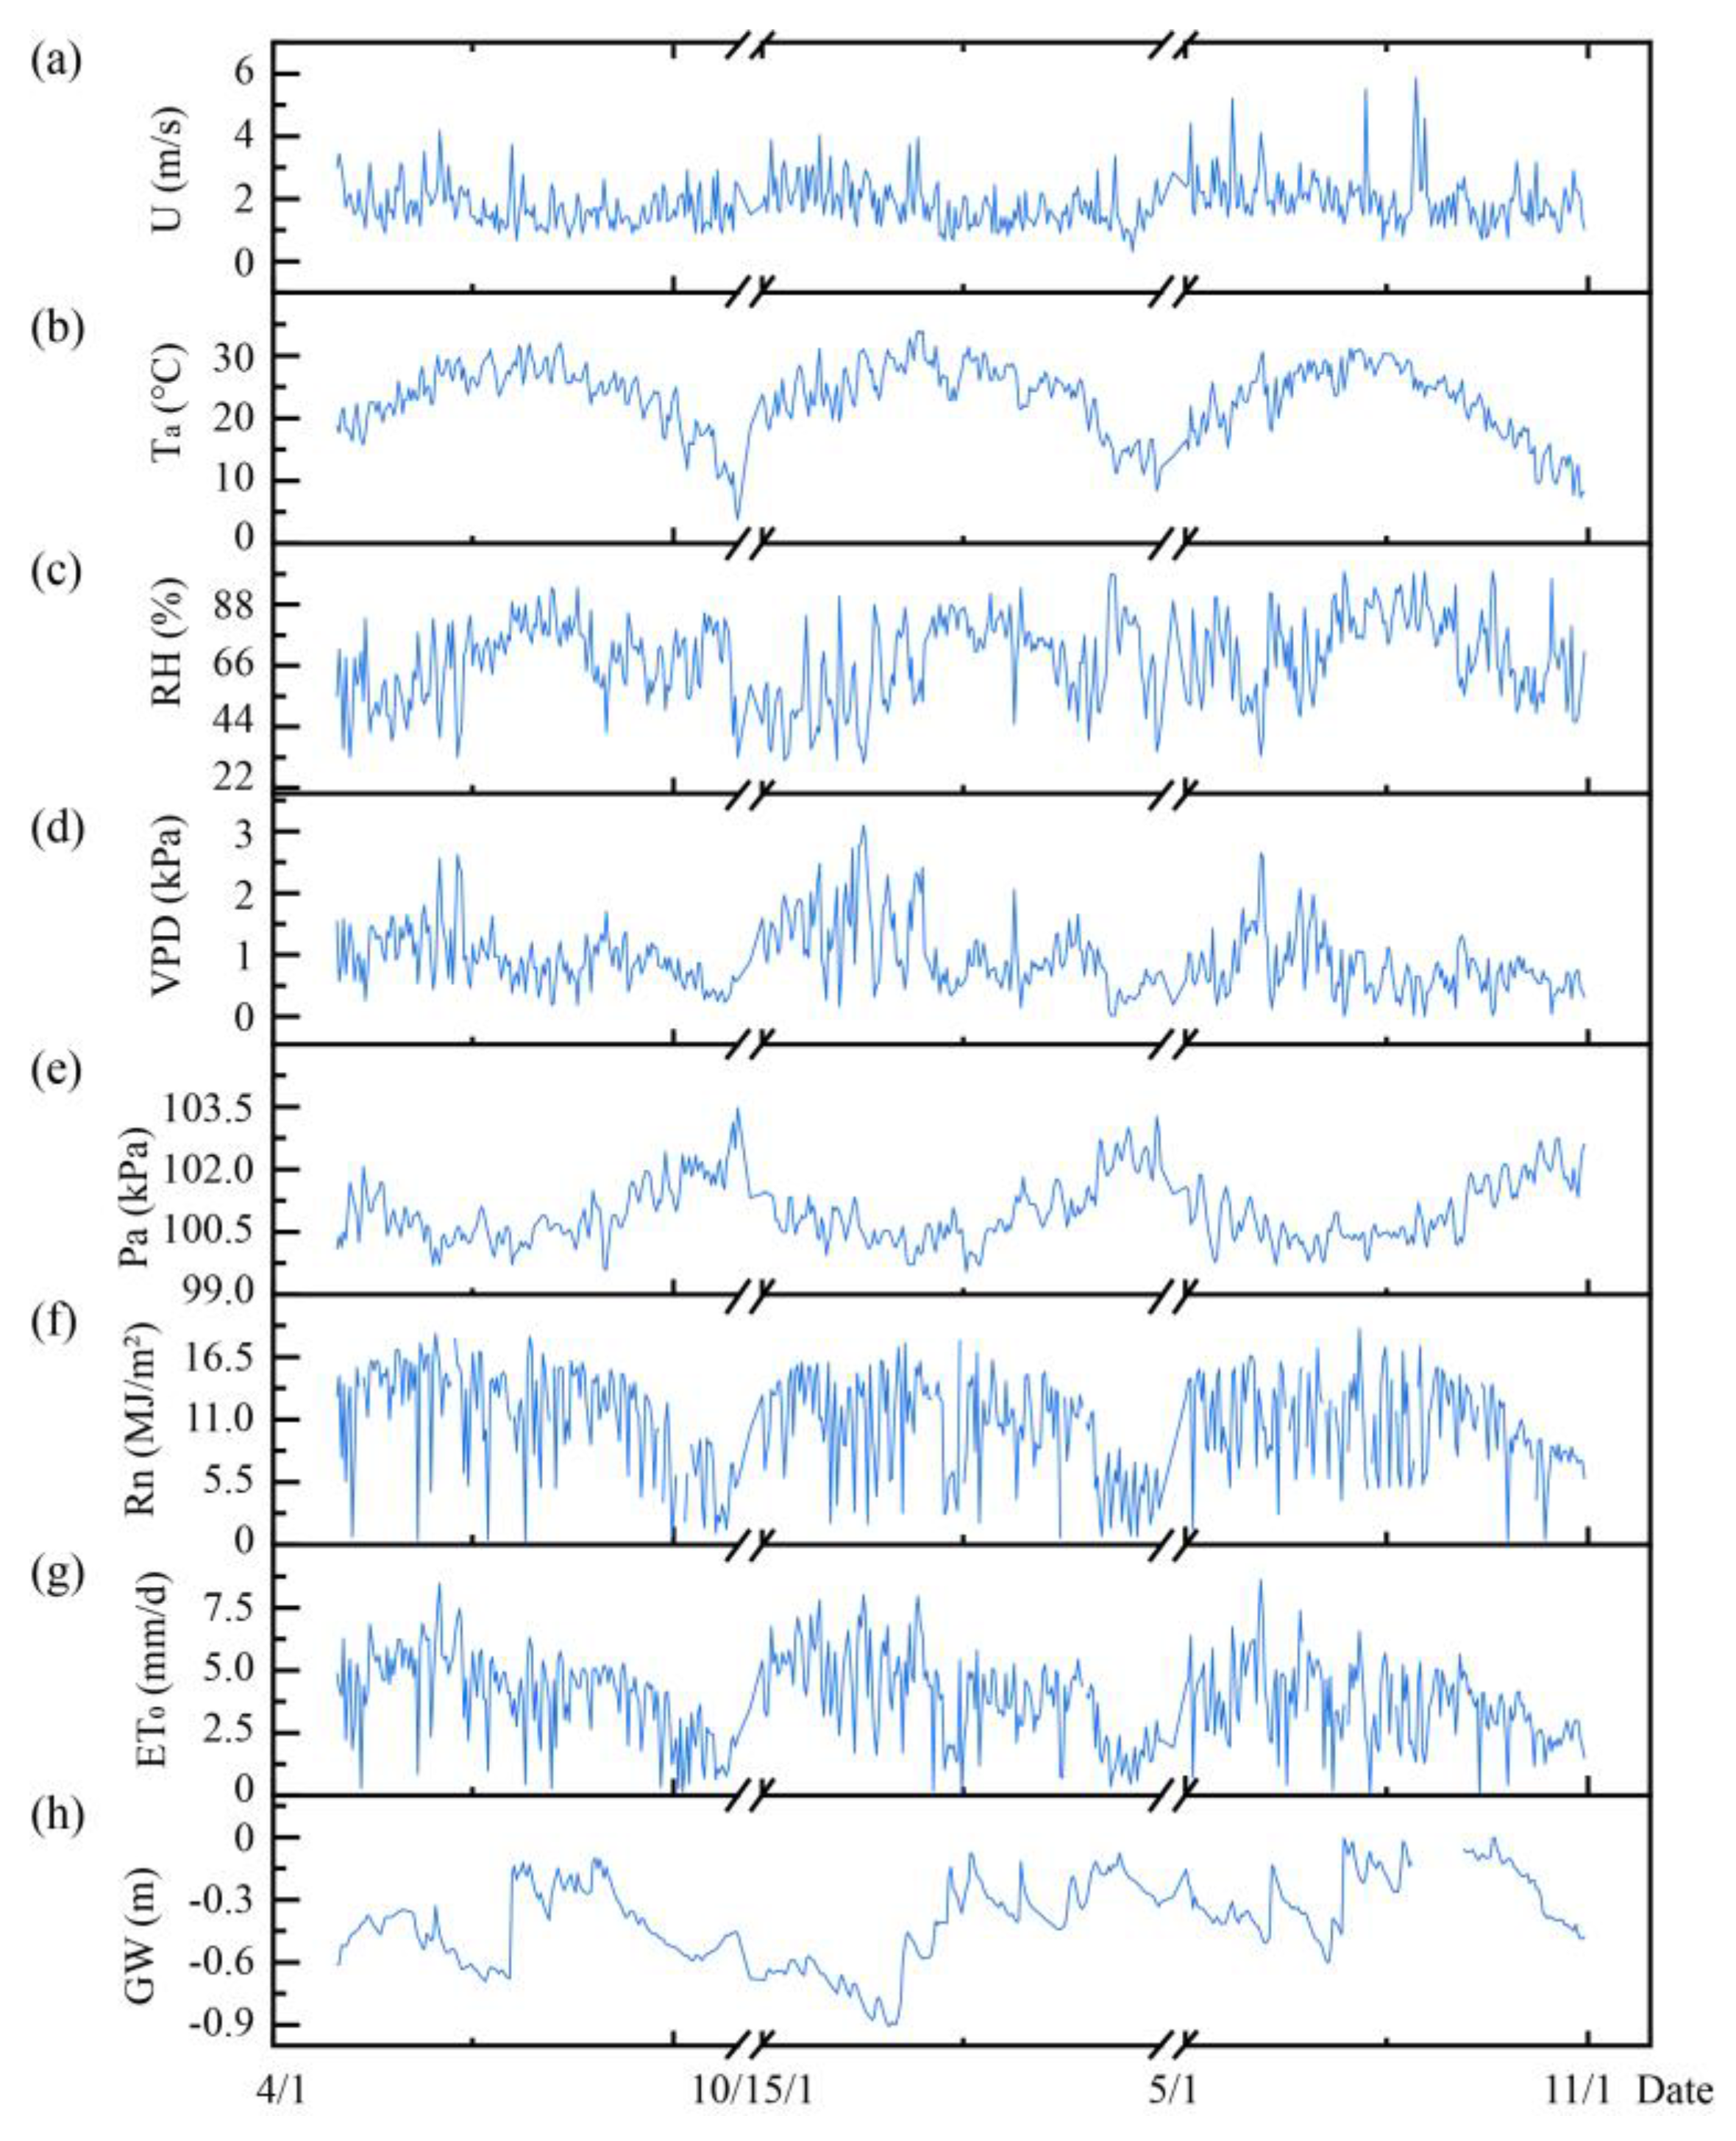
3.1. Observation of Environmental Factors and ET0

3.1.1. Diurnal Dynamics of Environmental Factors and ET0

Wind speed (U) fluctuated widely from May to October (Figure 3a). The maximum values were 4.19, 4.04 and 5.87 m/s in 2016, 2017 and 2018, respectively. The wind speed was much higher in 2018 than 2016 and 2017 for each month. Ta increased gradually from May to August, and the maximum values of Ta were 32.05, 34.00 and 31.28 °C in 2016, 2017 and 2018, respectively (Figure 3b). Then, Ta decreased and reached minimum values of 3.75, 8.40 and 7.38 °C in October of 2016, 2017 and 2018, respectively. RH showed the same trend as temperature. RH increased with temperature increases and reached the maximum values of 94, 99 and 100 in August of 2016, 2017 and 2018, respectively (Figure 3c). As the temperature declined, RH also decreased. The VPD maximum occurred in June, with values of 2.62, 3.10 and 2.64 kPa in 2016, 2017 and 2018 (Figure 3d). The lowest VPD occurred in October, with values of 0.93, 1.11 and 0.98 kPa in 2016, 2017 and 2018, respectively. Pa and Ta had the opposite tendency, dropping gradually from May to August and reaching minimum values of 99.58, 99.54 and 100.14 kPa in 2016, 2017 and 2018, respectively (Figure 3e). Then, Pa increased and reached the maximum value in October, with 103.48, 103.28 and 102.75 kPa in 2016, 2017 and 2018, respectively. Rn fluctuated widely during the growing season, especially from June to September (Figure 3f). The maximum values of Rn were 18.57, 17.98 and 19.02 MJ/m2 in 2016, 2017 and 2018, respectively. The total ET0 values were 735.53, 721.56 and 655.27 mm from May to October in 2016, 2017 and 2018, respectively (Figure 3g). The groundwater table fluctuated annually (Figure 3h), especially in 2017. During the growing period, the range of the change in the groundwater table was close to 1 m. In 2016, 2017, and 2018, the groundwater table remained at 0.5 m.

3.1.2. Variance Analysis of Environmental Factors in Different Years

The average values of meteorological factors and groundwater table from May to October are shown in Table 2. The U (2.03) and GW (−0.38) maximum values were in the wet year and significantly different from the normal year. Ta was the lowest in the wet year, significantly different from the dry year (p < 0.05), however, there is no significant difference between the normal year and dry year. Compared with dry and normal years, RH had a relatively high and significantly different value of 71.88 in the wet year. There was no difference in Pa among the 3 years. Rn differed significantly between the normal year and dry year. The mean values of VPD were 0.76 and 1.06 in the wet year and dry year. There were significant differences in VPD among the 3 years.

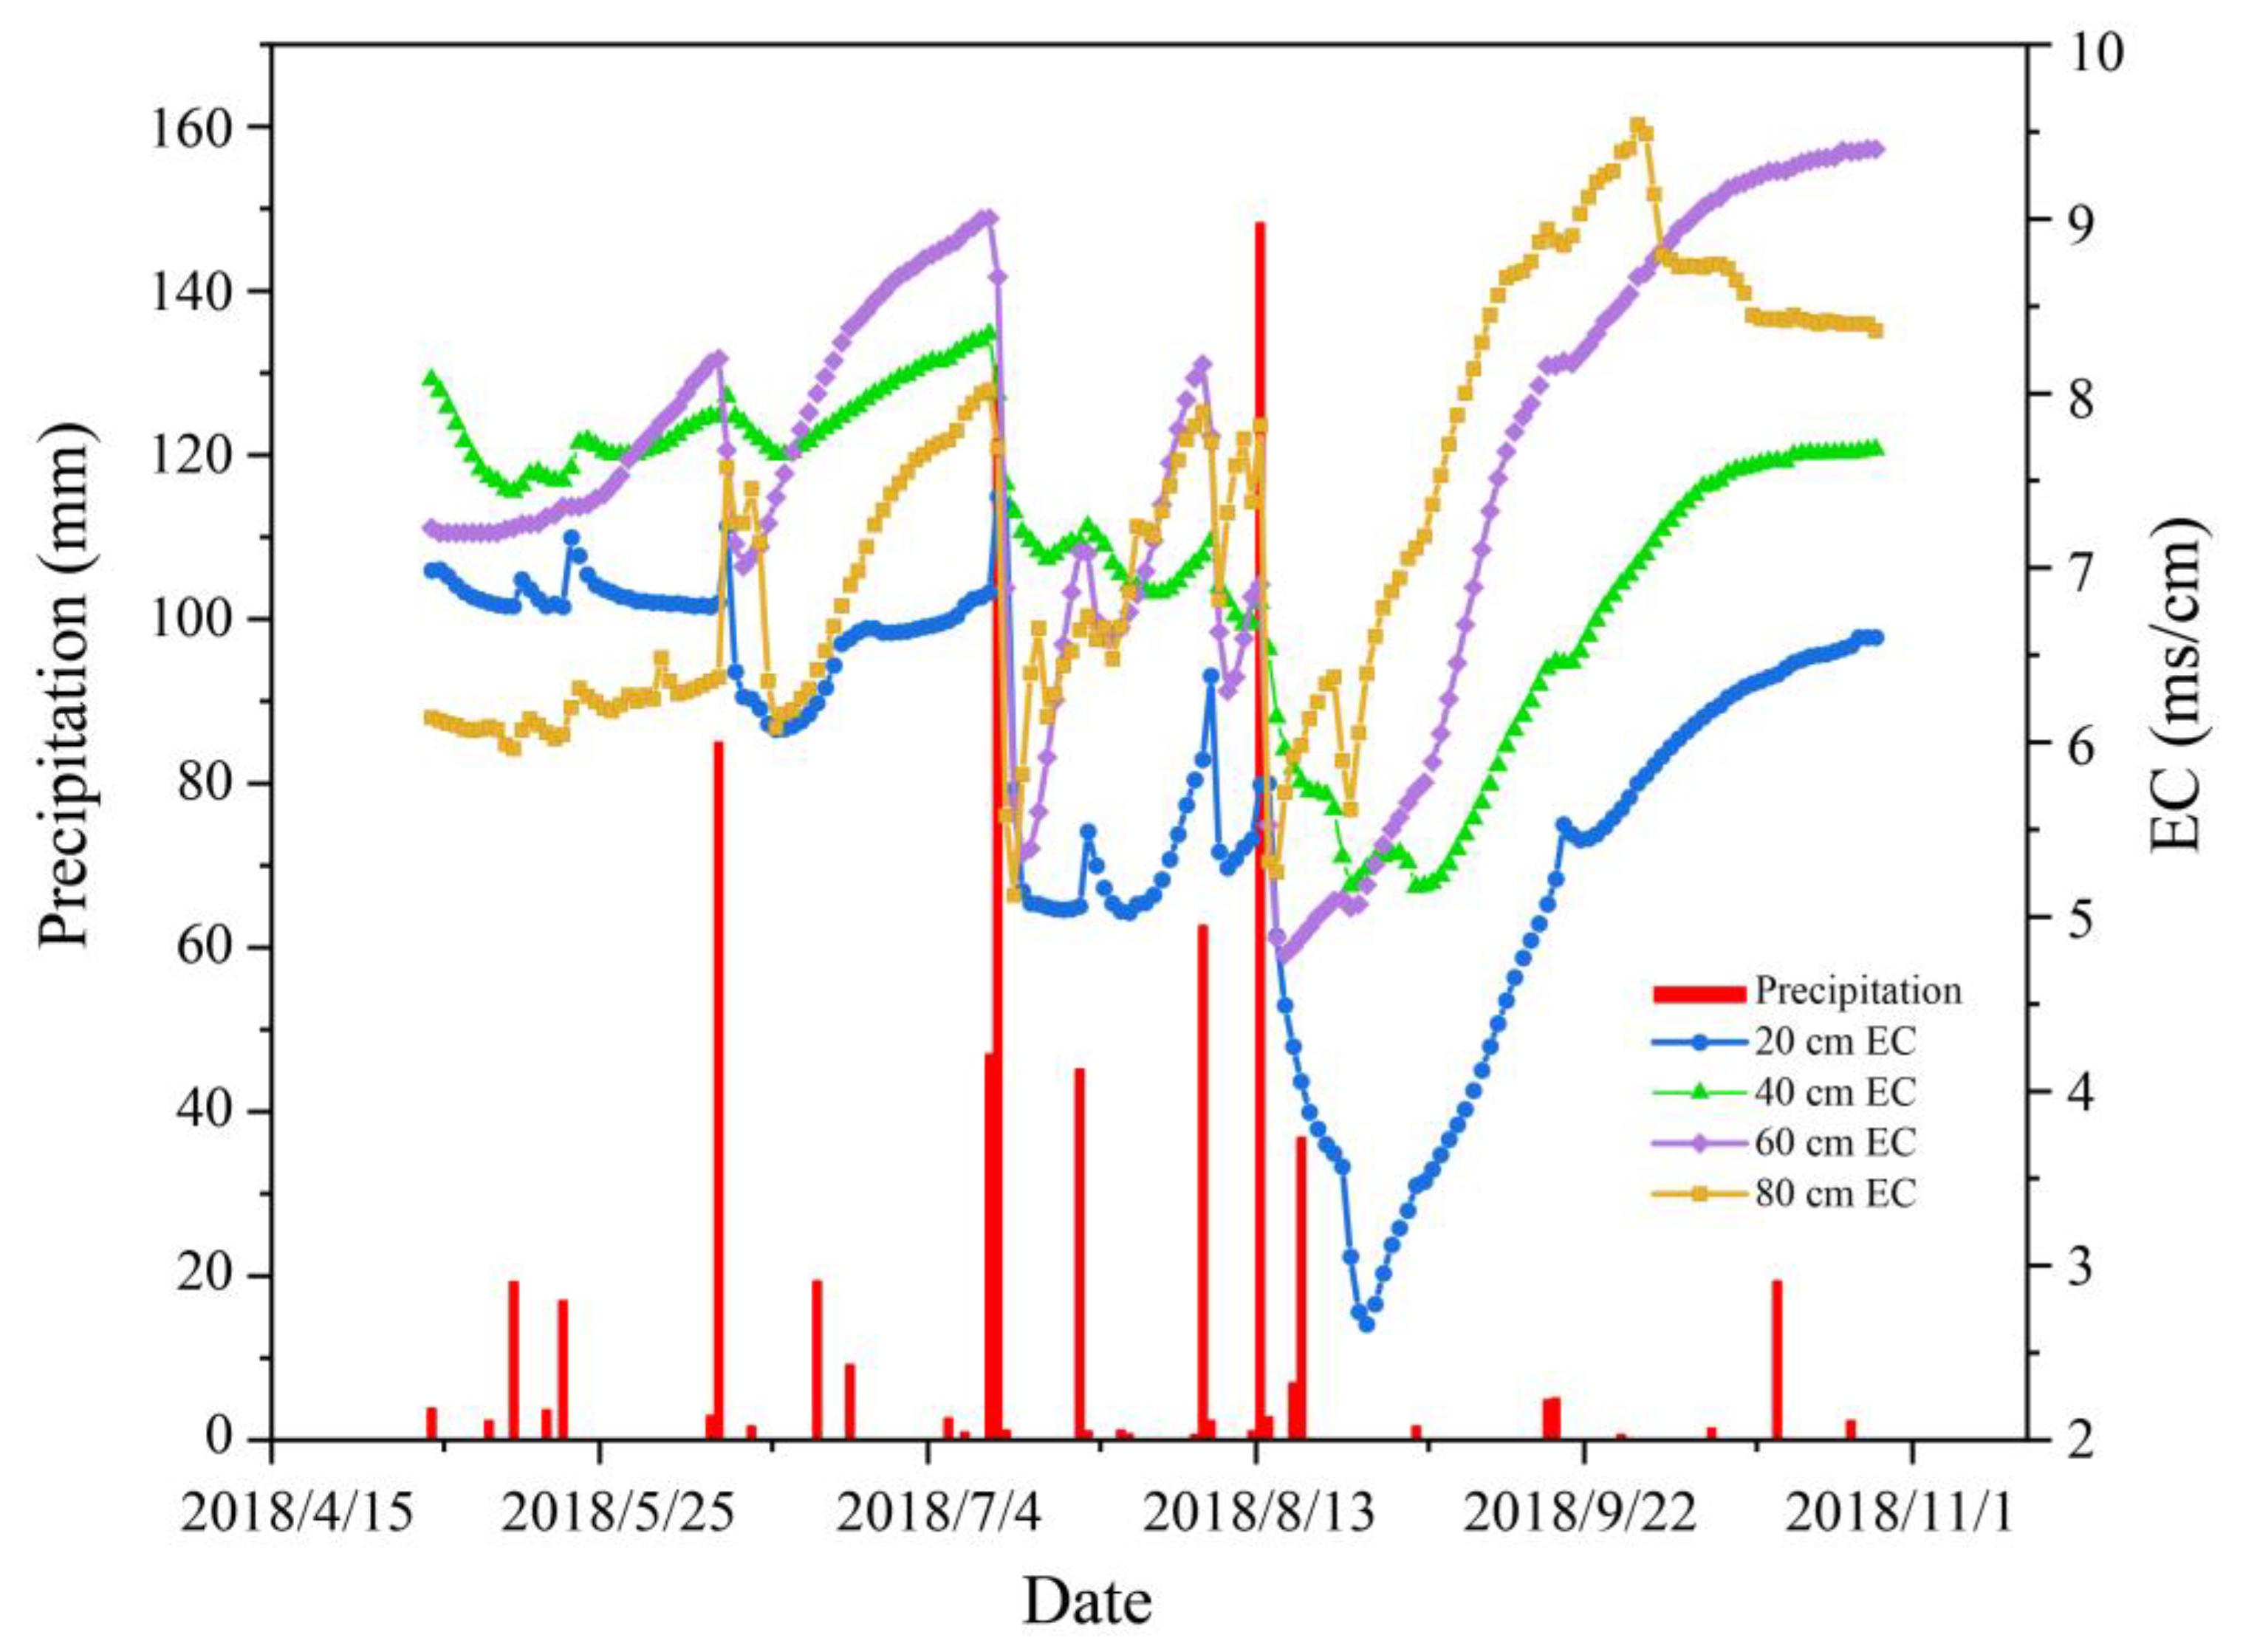
3.2. Precipitation Distribution and Daily Variation of Soil EC in Different Soil Layers in 2018

In the initial phase, the EC value of each soil layer was ordered as follows: 40 cm > 60 cm > 20 cm > 80 cm (Figure 4). When heavy rain (85 mm) occurred on 9 June, the EC value of the 20 cm layer quickly dropped from 7.23 to 6.08 ms/cm. After this stage, as the temperature increased, the EC values of different soil layers increased. In the rainy months of July and August, the EC values of the 20 cm and 40 cm layers remained relatively stable, while the EC values of the 60 cm and 80 cm layers continued to increase. After the rain in July and August, the EC value of the soil decreased as follows: 20 cm > 40 cm > 60 cm > 80 cm. After the frequent precipitation in July and August, compared with the initial stage, the EC values of the 20 cm, 40 cm, 60 cm, and 80 cm soil layers plummeted by 63%, 36%, 45%, and 32%, respectively. In general, planting Tamarix could help reduce soil salinity under natural conditions. However, if there are no measures to prevent evaporation, the salinity will return to high levels at the surface with soil evaporation.

3.3. Summary Statistics of Evapotranspiration and Its Components on Tamarix Land and Bare Land

The evaporation values were 136.6 mm on bare land and 207.6 mm on Tamarix land from May to October 2018. Maximum evaporation occurred in June and August, 42.1 and 44.9 mm on Tamarix land, and 30.0 and 23.9 mm on bare land (Table 3). The E of Tamarix land was 71 mm higher than bare land. Compared to Etb, the leaf cover lowered 94.3 mm of water. Transpiration of Tamarix was 306.6 mm, with the highest rate, 62.1 mm, in August. Total ET was 514.2 mm and the maximum value was 107 mm in August. Tamarix land consumed 377.6 mm more water than bare land, and the highest T/ET ratio appeared in October, with a maximum of 72.1%. Average T/ET ratio was 60.2% over the growing season.

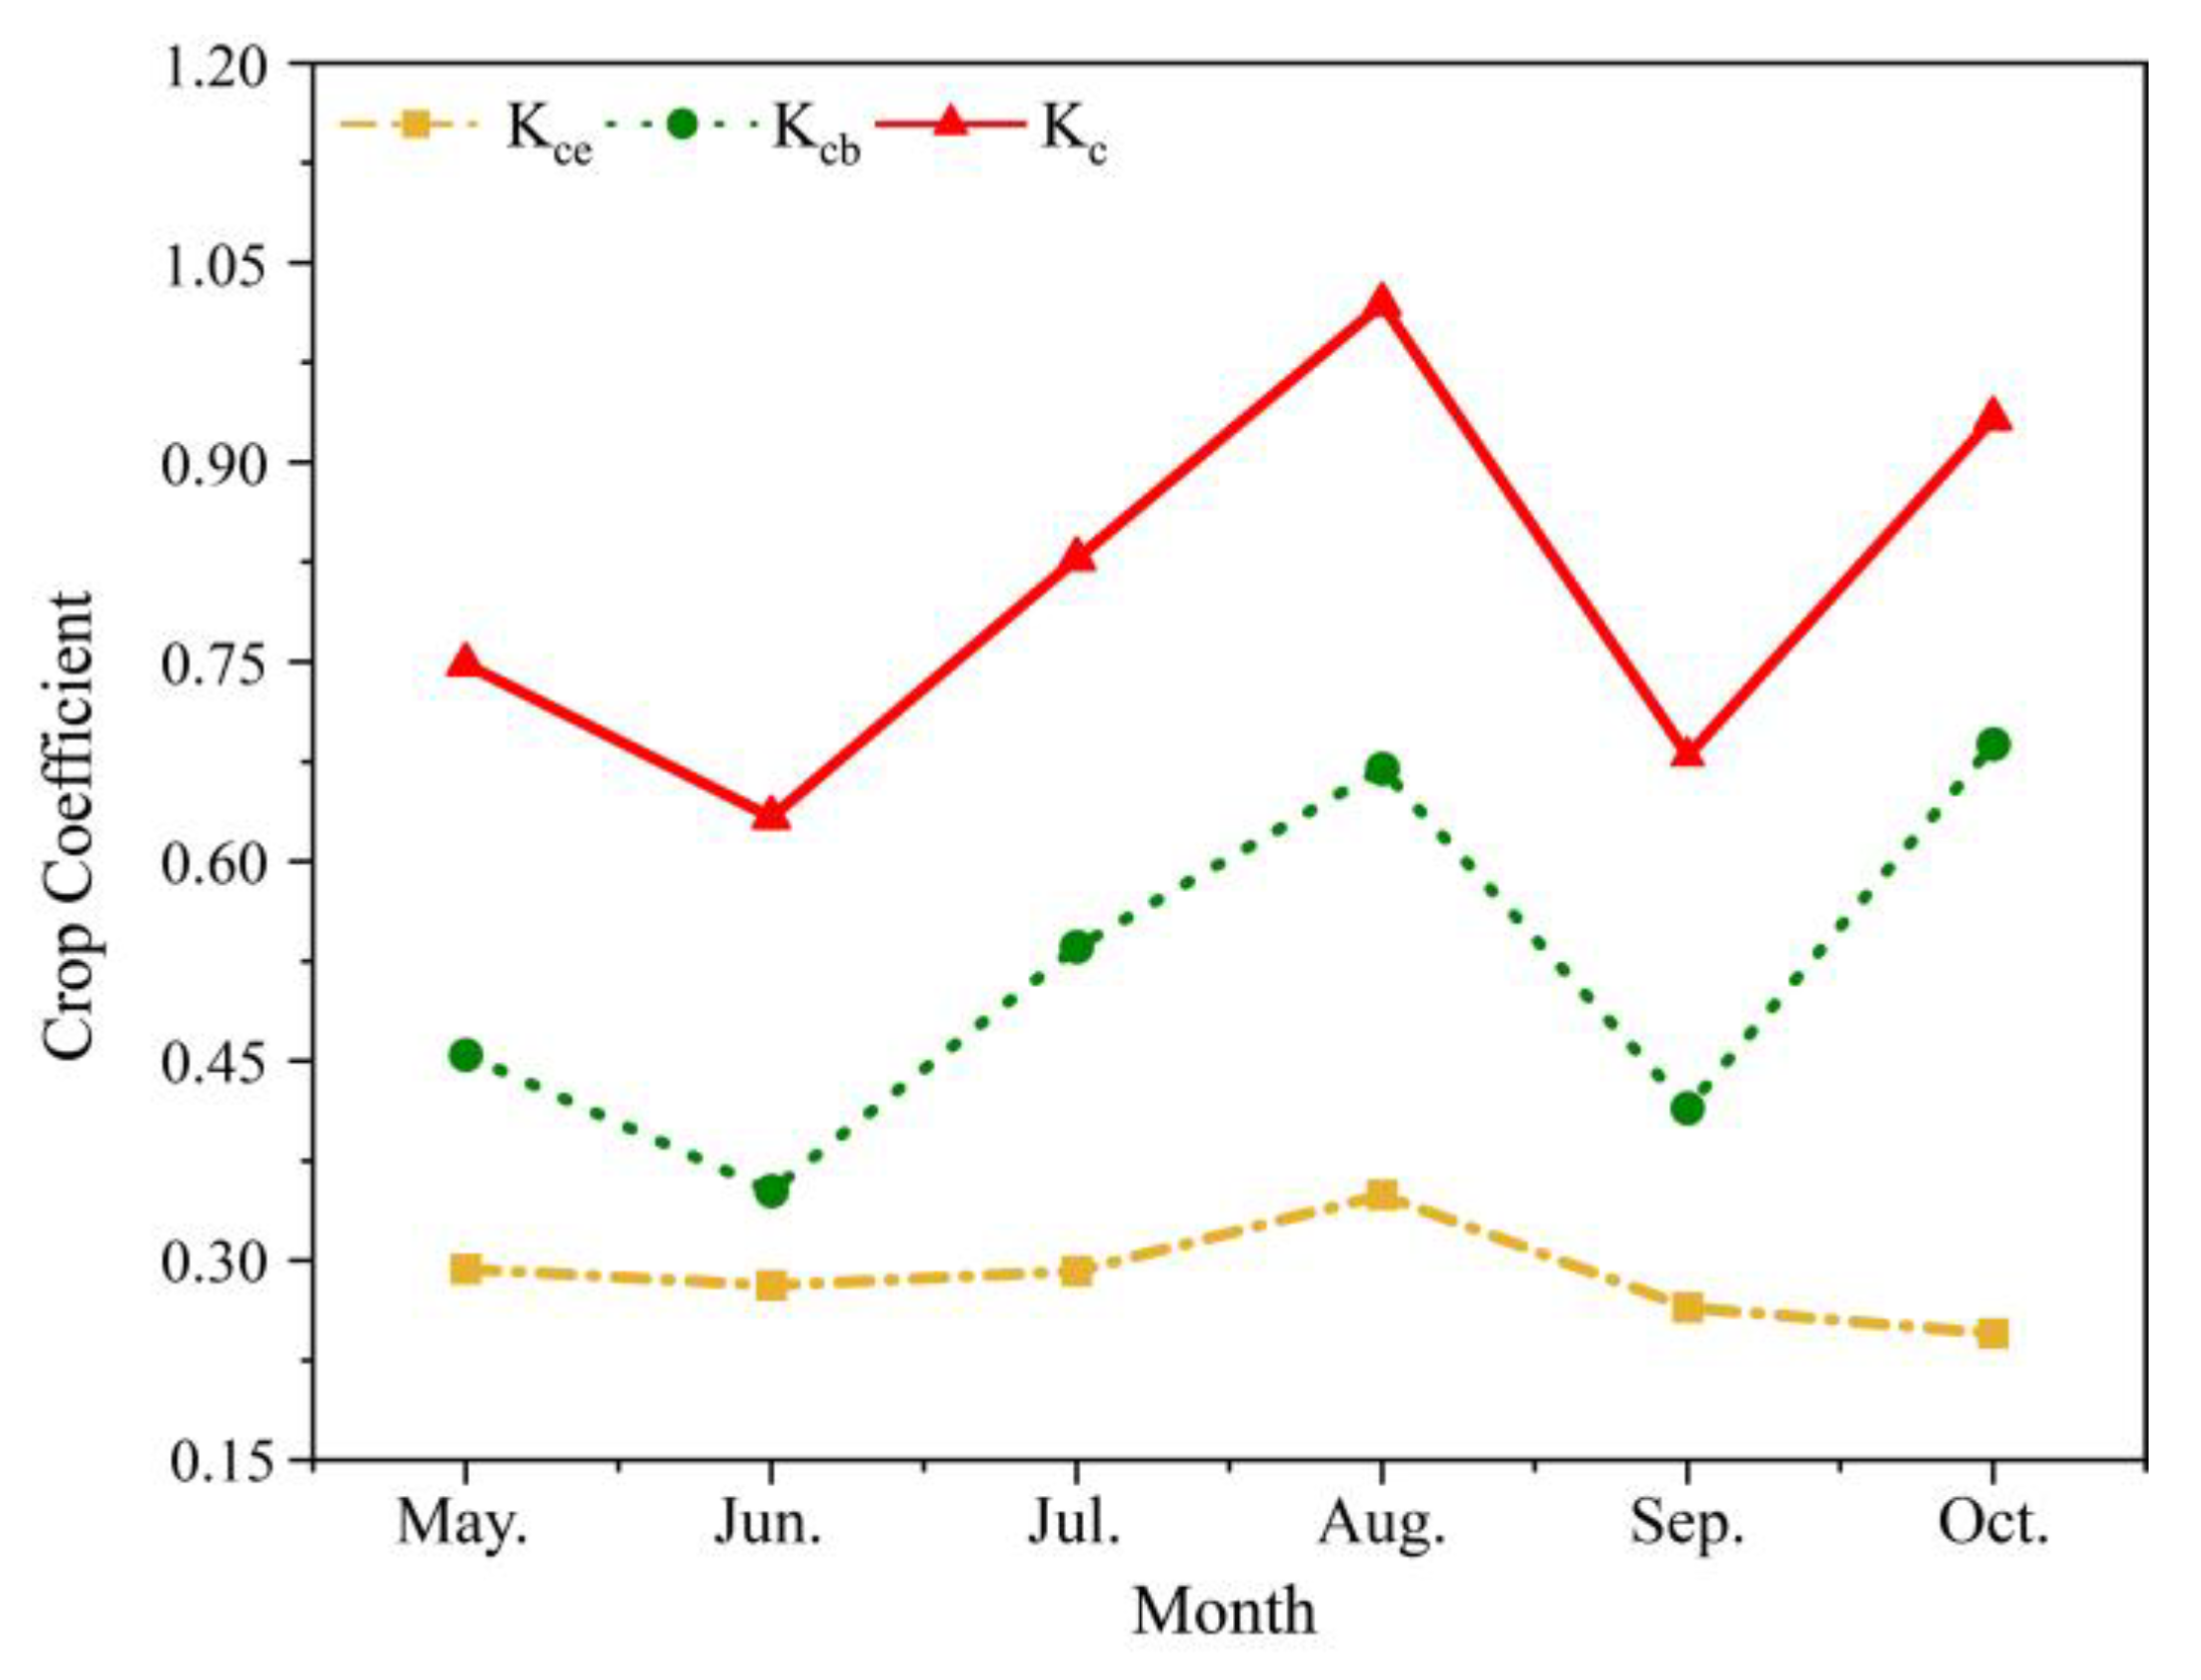
3.4. The Change of Crop Coefficient

The Kce was approximately 0.29 in the initial period (Figure 5). The maximum value of Kce was 0.35 in August, and the minimum value of Kce was 0.25 in October. Kcb and Kc had the same trend from May to October 2018. The values of Kcb and Kc were 0.45 and 0.74 in the initial period, and fell to minimum values of 0.35 and 0.63 in June. Then, the values of Kcb and Kc gradually increased until reached the first peak values of 0.67 and 1.02, occurred. Kcb and Kc dropped in September and fell to minimum values of 0.41 and 0.68. In total, the average values of Kce, Kcb, and Kc were 0.29, 0.52, and 0.81, respectively.

3.5. Effects of Environmental Factors on ET and Its Components

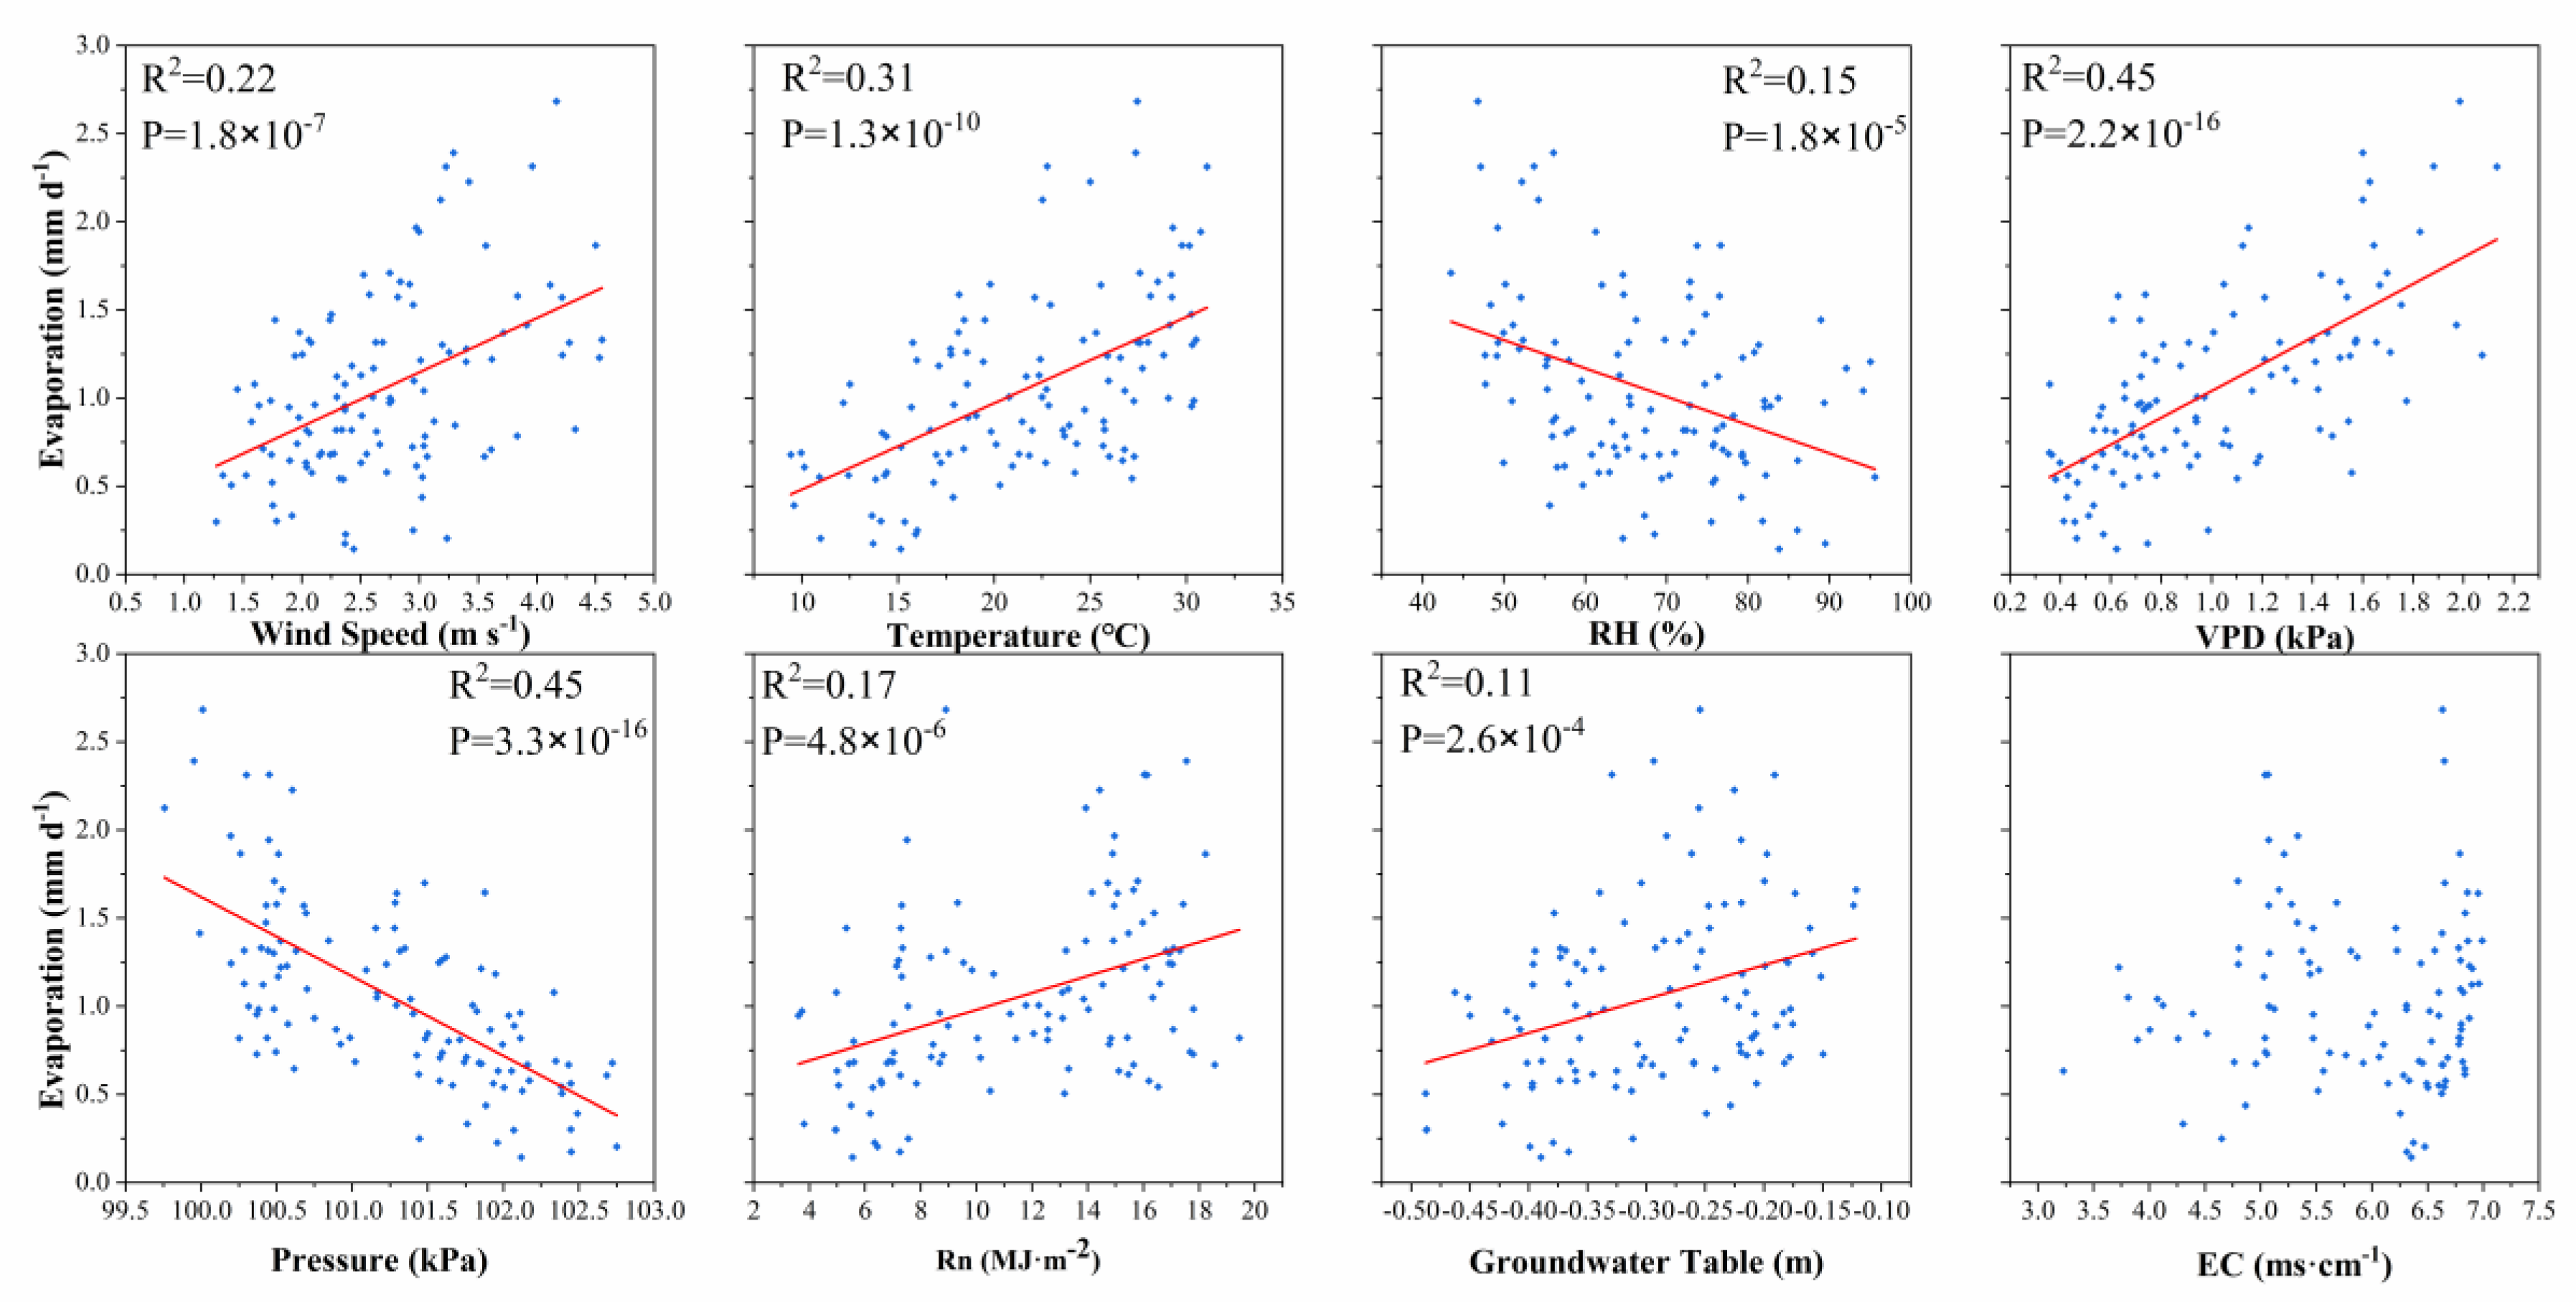
3.5.1. Effects of Environmental Factors on Evaporation

The evaporation was positively correlated with wind speed, temperature, VPD, and Rn (Figure 6). It showed a negative relationship with RH and atmospheric pressure. When the groundwater table rose, the evaporation also increased. VPD and atmospheric pressure had a relative good fit with evaporation, with R2 values of 0.45 and 0.45. The fit of the groundwater table to evaporation was poor, with an R2 of 0.11. The slopes of all fit lines were significantly different from zero.

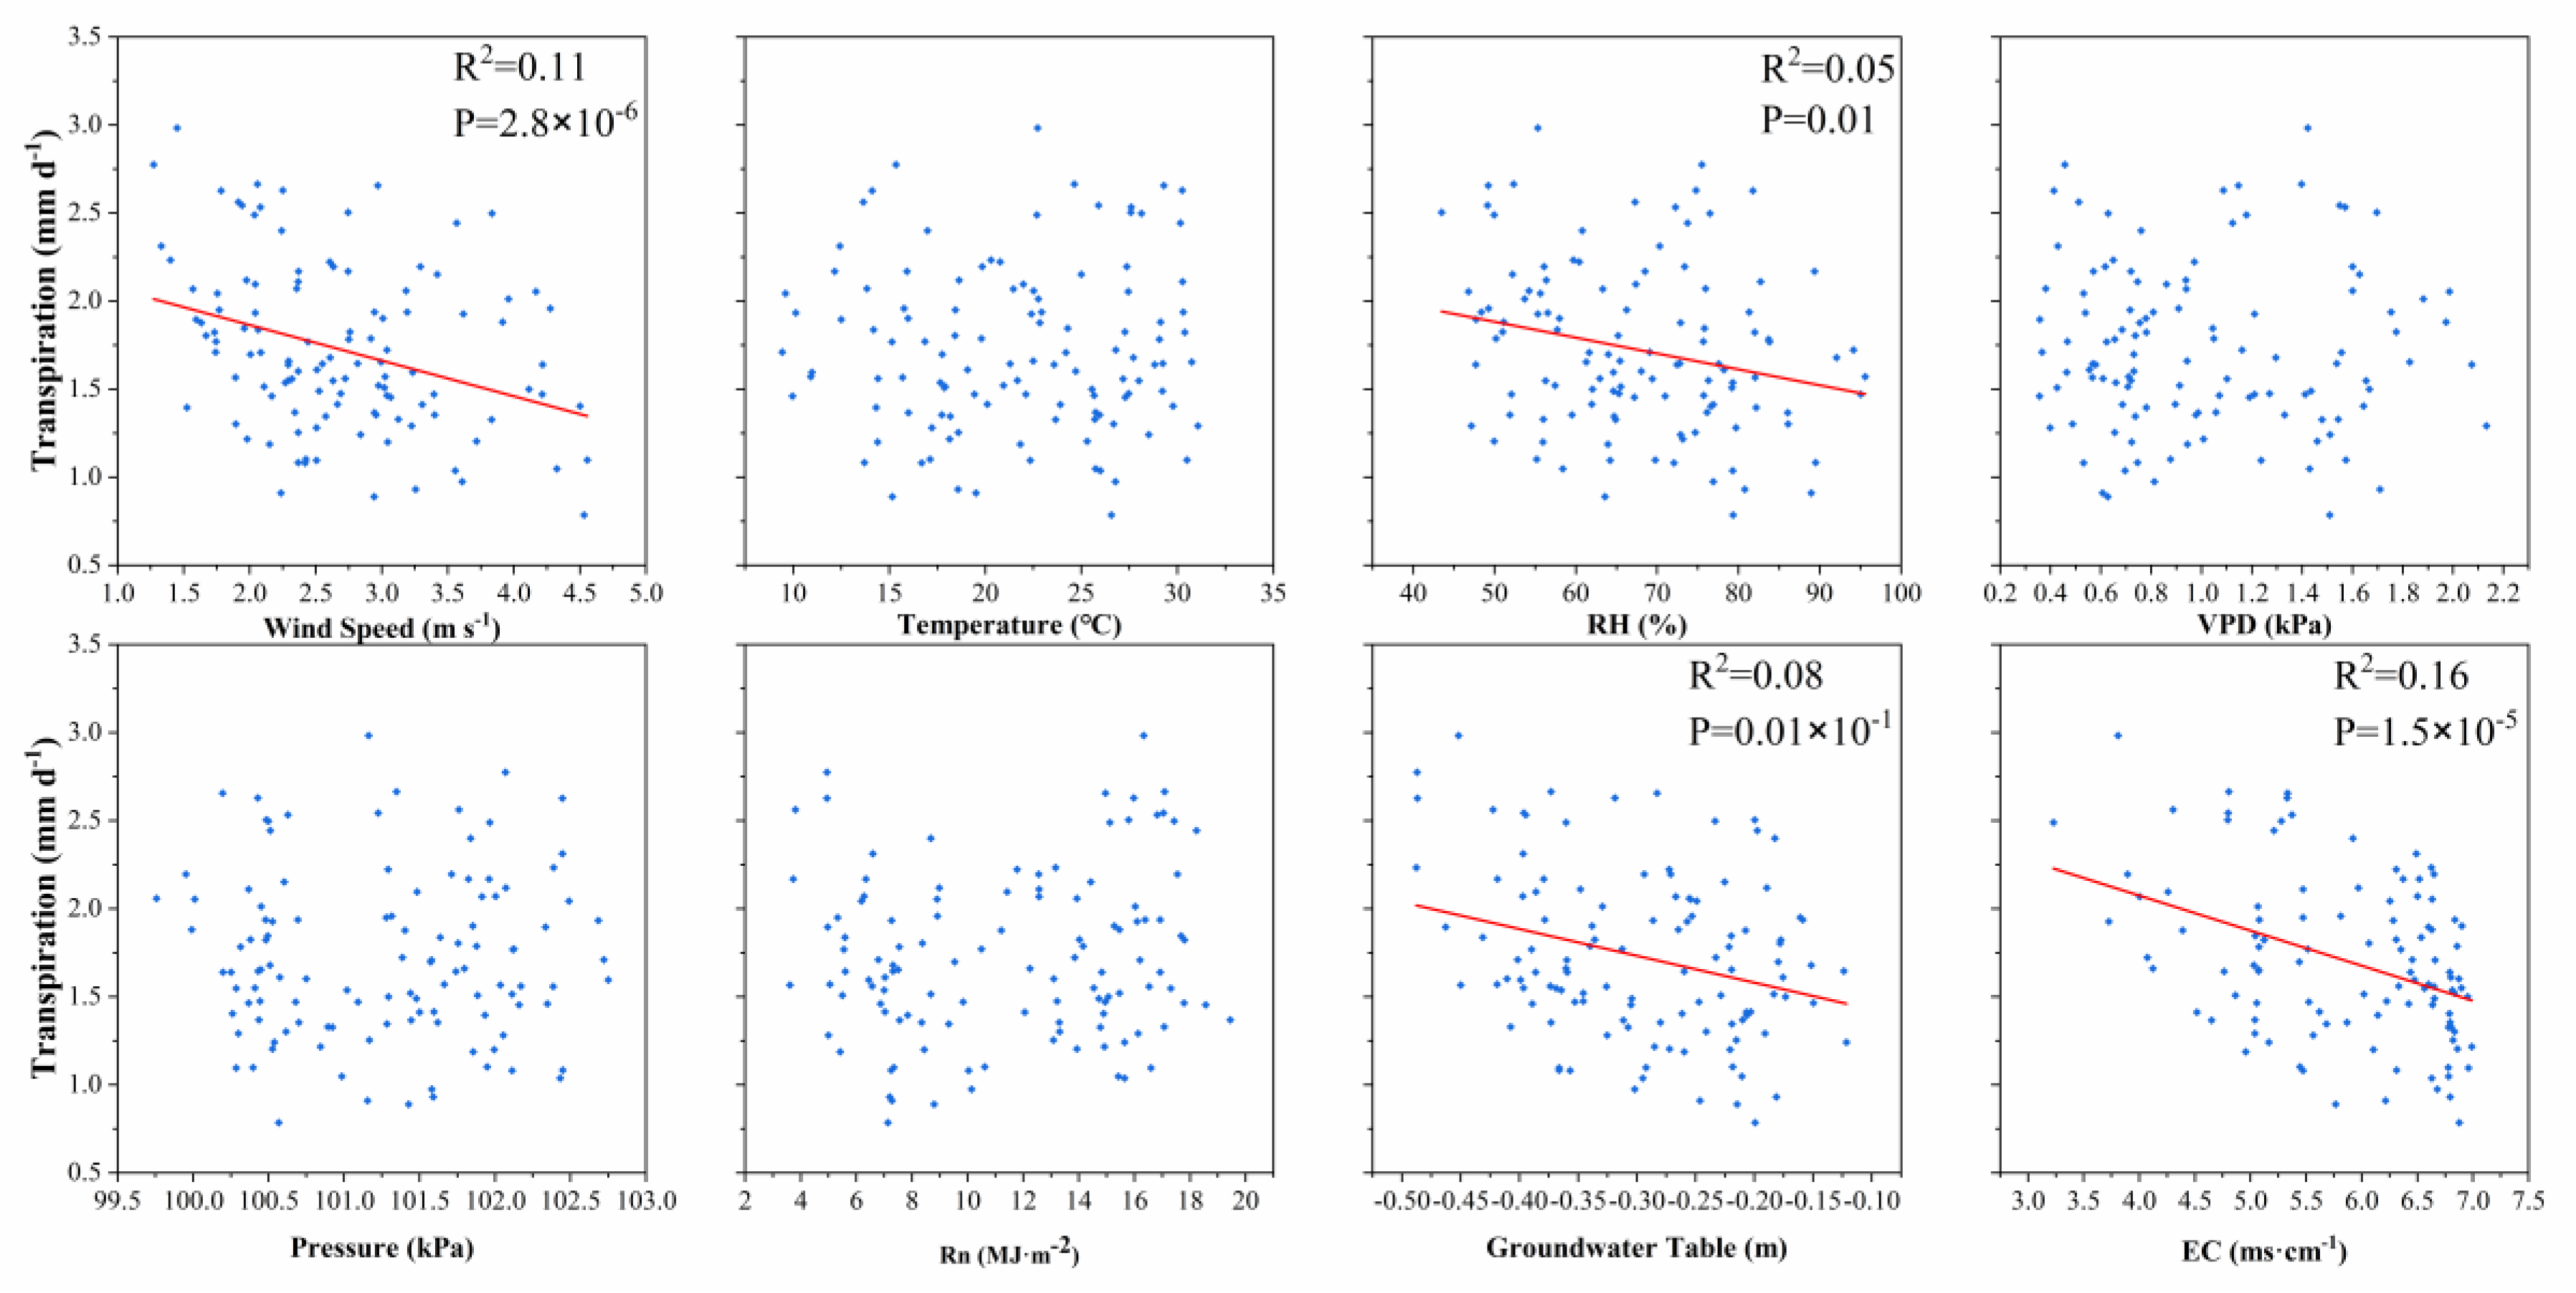
3.5.2. Effects of Environmental Factors on Transpiration

Transpiration showed a negative relationship with wind speed and RH (Figure 7). EC put up a negative effect on transpiration, and when the EC was enhanced, the transpiration decreased. The groundwater table also displayed a negative effect on transpiration. Compared to wind speed, RH and groundwater table, EC possessed the highest R2 of 0.16. The fit of RH and transpiration with the R2 of 0.05. The slopes of all fit lines were significantly different from zero.

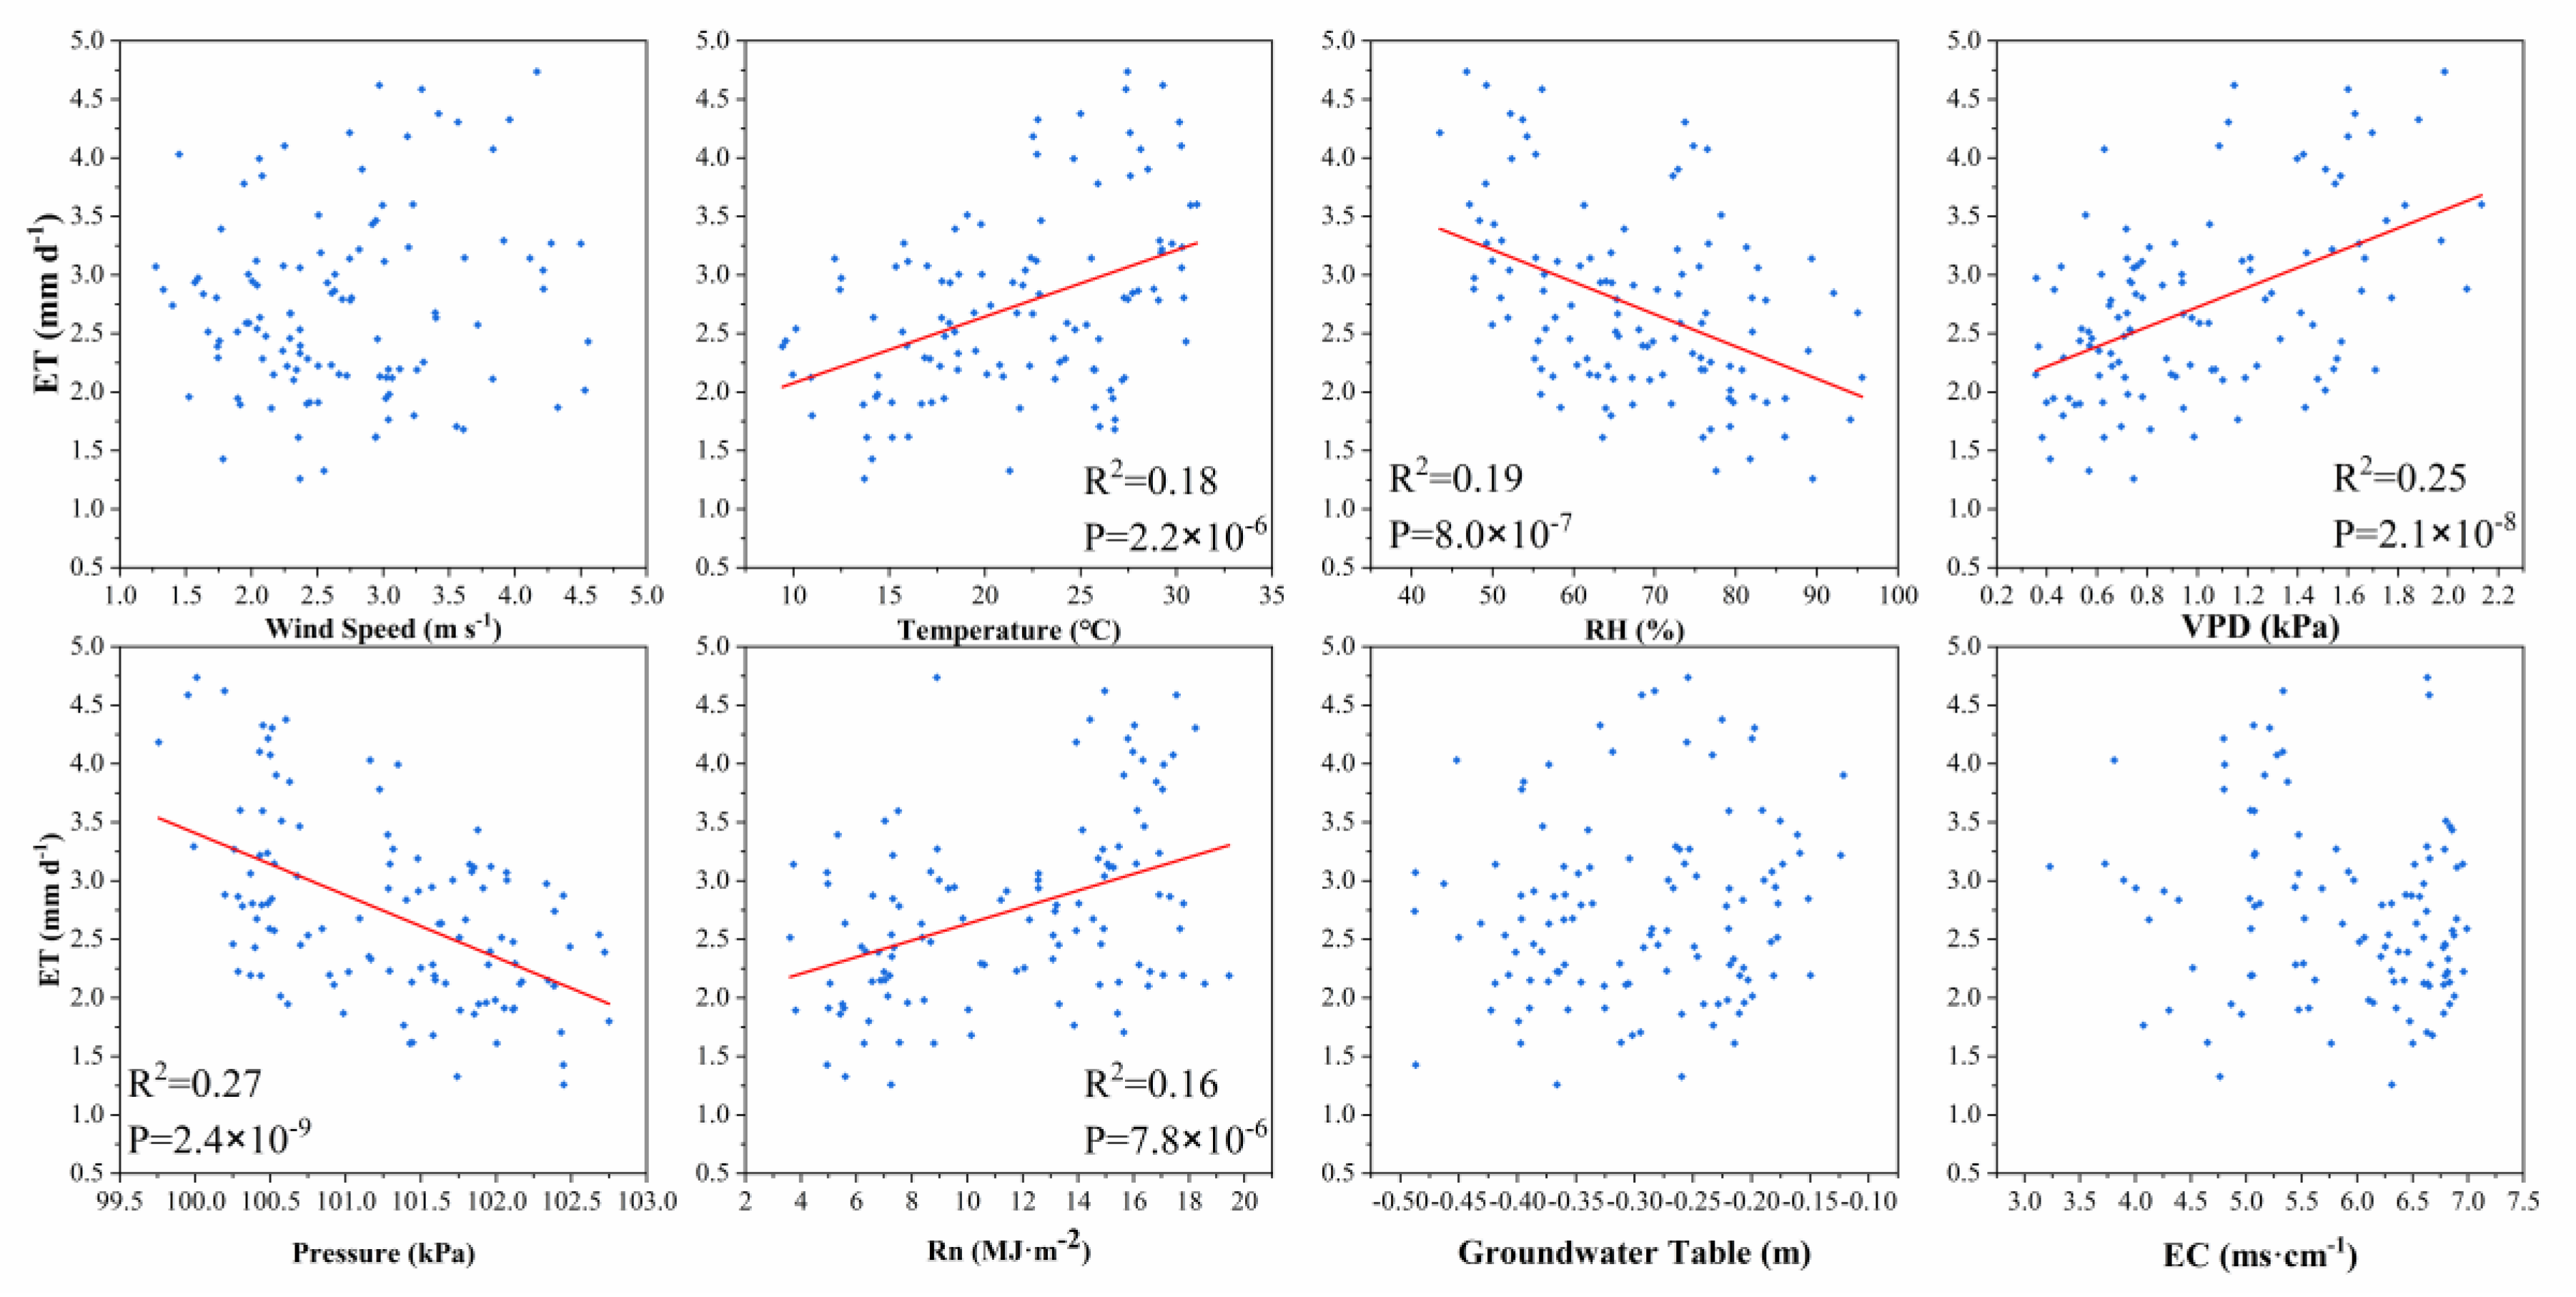
3.5.3. Effects of Environmental Factors on Evapotranspiration

Evapotranspiration had a positive relationship with temperature, VPD and Rn (Figure 8). With increasing temperature, VPD or Rn increased, and the evapotranspiration increased. RH and pressure expressed a negative effect on evapotranspiration; with increasing RH or atmospheric pressure, the evapotranspiration decreased. The atmospheric pressure showed a relative good fit with evapotranspiration, with an R2 of 0.27. The fit of Rn to evapotranspiration was poor, with an R2 of 0.16. The slopes of all fit lines were significantly different from zero.

3.6. Gray Relational Analyses of the Environmental Factors on ET and Its Components

VPD shows the maximum correlation coefficient value of 0.9717 with evaporation (Table 4), followed by the groundwater table, wind speed, EC, Rn, temperature, RH, and atmospheric pressure, with correlation coefficient values of 0.8871, 0.8659, 0.6842, 0.5182, 0.3444, 0.1374, and 0.0929, respectively. VPD also had the maximum correlation coefficient value, 0.9316, with transpiration, and wind speed had the maximum correlation coefficient, 0.9294, with evapotranspiration. Among all the influencing factors, the correlation coefficients of VPD to evaporation and transpiration were the highest, 0.9717 and 0.9313, and the correlation coefficient of wind speed and ET was the highest, 0.9294.

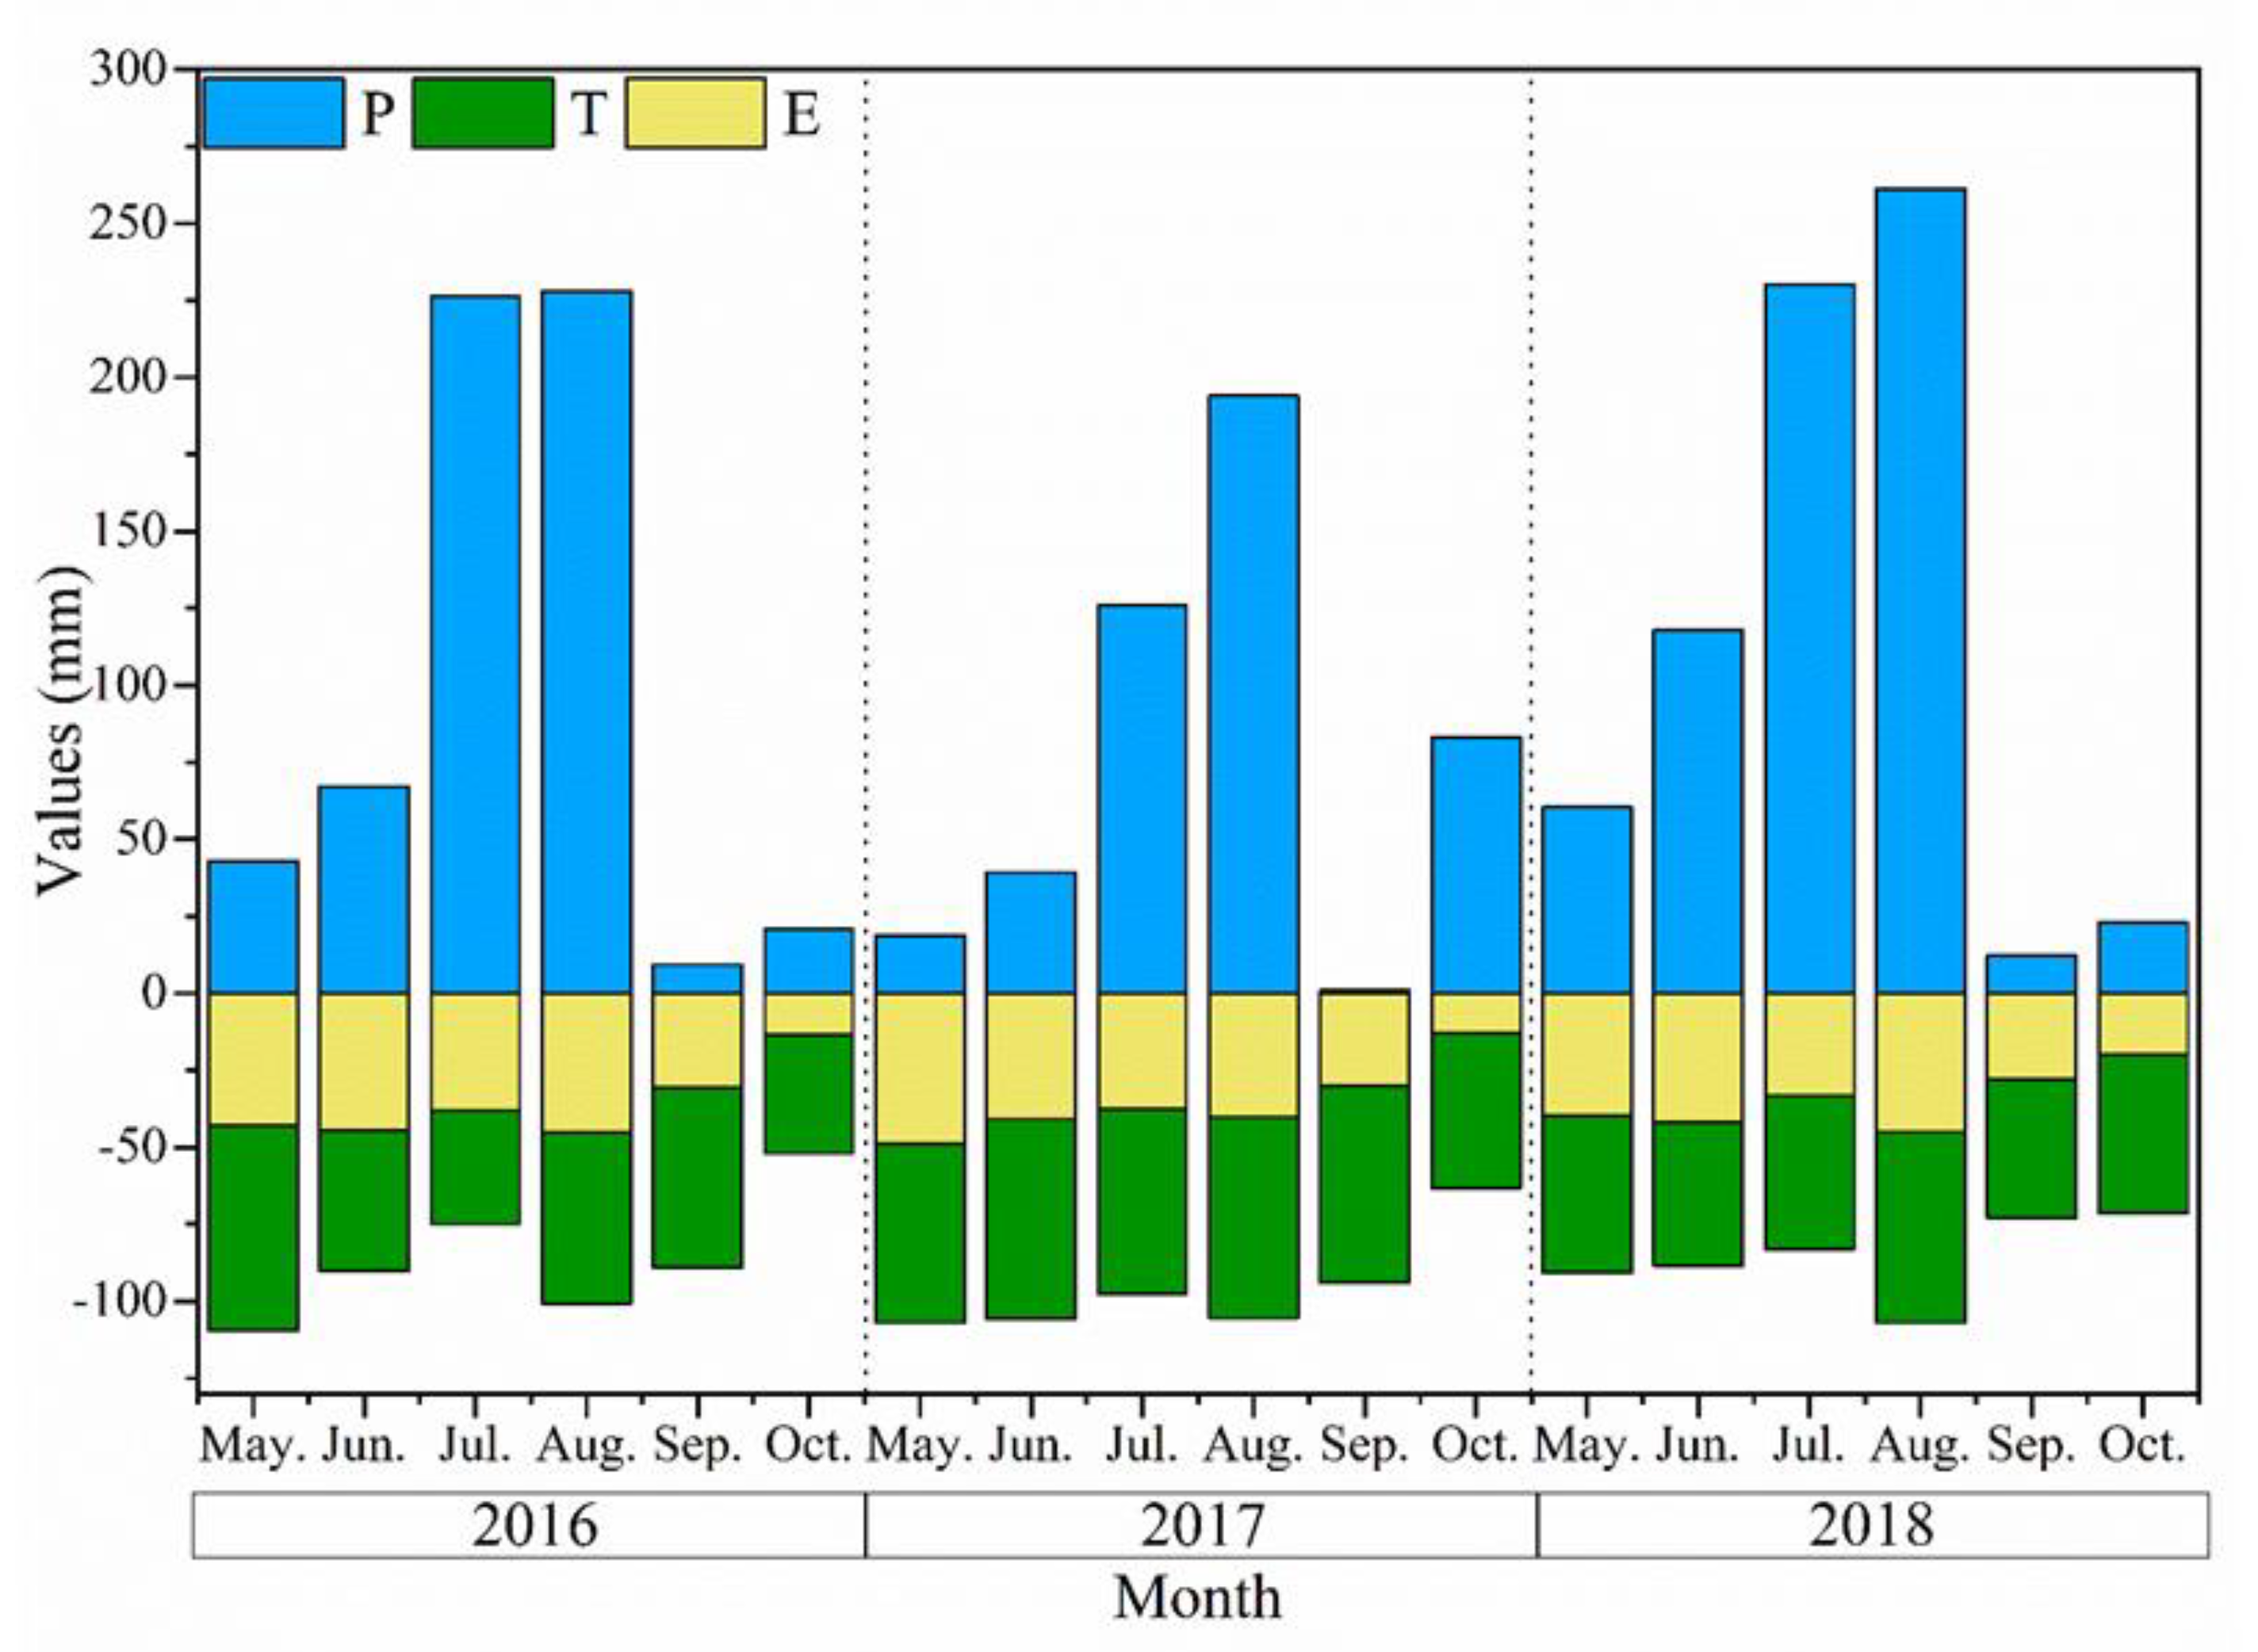
3.7. The Monthly Distribution of Evaporation, Transpiration, and Precipitation from May to October in 2016, 2017 and 2018

The values of evaporation from May to October in 2016 and 2017 were estimated by the product of Kcs and ET0. According to the precipitation frequency distribution, 2016, 2017 and 2018 represent normal, dry and wet year, respectively. The difference between precipitation and evapotranspiration can reflect the adequacy of water resources in this region. As shown in Figure 9, the total evapotranspiration values from May to October were 516.4, 573.8 and 514.2 mm in 2016, 2017 and 2018, respectively. The precipitation could not meet the ET balance and the water shortage was approximately −107.2 mm in 2017. In 2016, the precipitation was just enough to replenish the ET consumption, and the difference between the precipitation and ET was 77.76 mm. In 2018, the precipitation adequately met the ET balance, and the difference between the precipitation and ET was 187.46 mm.
Precipitation from events in May, June, September, and October of 2016 was less than the evapotranspiration loss during this period. In 2017, this was the situation in May, June, and September. Recharge via precipitation was inadequate in May, September, and October of 2018. The consistent months of recharge were July and August, while May and September were consistently drier. Overall, the months when water shortages occurred were May and September in 2016, 2017 and 2018.

4. Discussion

4.1. Quantifying the ET and Its Components (E and T) of Tamarix

Tamarix has a high LAI and can consume a lot of water through transpiration [10]. During the observation period, the transpiration values in 2016, 2017 and 2018 were 332.3 mm, 363.3 mm, and 306.6 mm, respectively. In a previous study, the total transpiration of Tamarix was 224 mm [6], which was much lower than the value in our observations. The main difference may be caused by the water supply. In the Hultine study site, the mean annual precipitation was 230 mm, less than half the precipitation (569 mm) in the current study area. Furthermore, the groundwater table remained at 0.5 m in our study site (Figure 3h). Thus, this region has a relatively sufficient supply of water. In the process of vegetation establishment, Tamarix approximately consumes 306.6 to 363.3 mm per year in the form of transpiration, participating in the water cycle of saline soil. Accurately estimating the ratio of plant T to ET (T/ET) is key to the quantitative study of the water cycle [13]. The ratio of T to ET is often used to evaluate the effects of transpiration on the water balance in an ecosystem [30]. Previous studies reported that transpiration accounted for approximately 64% of the total global ET [31,32]. From May to October, the average T/ET ratio was 60.2%, lower than the contribution of transpiration in the global water cycle. This situation indicated that dissipation via transpiration was the main factor in evapotranspiration of Tamarix.
The evaporation in Tamarix land was 71 mm, higher than that in the bare land, which indicated that the vegetation increased the soil moisture dissipation of the coastal saline soil, where the groundwater table was relatively shallow. However, the growth of Tamarix improved the soil’s physical properties. Many studies have shown that vegetation played a key role in decreasing bulk density and increasing soil porosity and water holding capacity of soil [33,34]. From 0 to 40 cm, the soil porosity of Tamarix land was greater than that of bare land (Table 1), which meant that the increase in soil pores supported the evaporation of groundwater recharge. Although we increased soil porosity and enhanced the soil evaporation by planting this plant, the soil evaporation also decreased because of the coverage of fallen leaves. The Tamarix leaf cover restricts evaporation in soil [35]. In this study, the existence of fallen leaves prevented 94.3 mm of water from evaporating from May to October (Table 3).
It is important to accurately understand the interaction of Tamarix ET and available water resources to better estimate the potential of Tamarix to rehabilitate saline soils. During the observation period in 2018, the total ET was 514.2 mm (Table 3). Many studies have shown that during the growing season, the measured ET was approximately 520 mm in the Heihe River basin [12] and 500 mm in the Tarim Basin [36]. The ET of Tamarix stands in the Hetao Irrigation District were 510 and 480 mm in 2012 and 2013 [37]. Previous research results [12,36,37] were obtained using the vorticity covariance method, which is based on vertical water vapor flux to estimate evapotranspiration. In this study, only soil evaporation and plant transpiration were considered, canopy-interception evaporation was ignored. Even so, many ET results of previous studies were lower than the ET of our study area. It meant that the ET of Tamarix in coastal saline soil was higher than that in inland areas of China.

4.2. The Effects of Environmental Factors on the ET

It is known that with increased atmospheric pressure, water vaporization requires more energy, thus decreasing evaporation and evapotranspiration. Temperature affects the exchange of matter and energy at the atmosphere–soil boundary. With the temperature increases, more ET would transport into the atmosphere. ET was significantly positively correlated with evaporation and transpiration. However, the plants’ transpiration and temperature were not linearly correlated. As too high or low temperature could reduce the transpiration, suitable temperature was required for plant growth [38]. When the leaf temperature was higher than the air temperature, the increase in wind led to a decrease in transpiration [39]. Therefore, the change in transpiration is not affected by a single temperature variable, but by multiple factors. RH was also an important factor affecting ET and reflects the distance between the air and saturation. The higher the RH, the lower the ET. The wind speed could affect the partitioning of energy by changing the RH and temperature of the evaporation surface and then affects the ET process by changing the VPD. In this study, the wind speed shows the highest correlation coefficient with evapotranspiration for 0.9294, supporting the notion that wind speed is an important factor effecting evapotranspiration.
Groundwater is the most important source of water and salts in arid wetlands [40,41]. Due to the continuous evaporation, the salt precipitated around the ground surface [42,43,44]. The former study presented that the accumulation of salt on the soil surface could reduce evaporation by decreasing the VPD of the soil surface [45], which was confirmed by the small amount of evaporation in the bare land in comparison to the Tamarix land. However, there was no correlation between EC and evaporation from the scatter plot (Figure 6). This might be caused by the lack of continuous monitoring of surface soil EC. Although Tamarix is a type of halophyte, with the properties of strong salt tolerance and drought resistance, these properties had certain limitations, which s supported by the scatter plots of EC and transpiration (Figure 7). Due to the high soil salt content beyond the salt tolerance range of Tamarix, the reduction of transpiration happened as a protective mechanism. In arid areas, Tamarix can relieve the effects of water deficit by absorbing groundwater [46]. However, the high EC groundwater (25 ms/cm) limits the absorption of water in this study area, and the higher the groundwater table, the smaller the transpiration. Both of the above cases indicated that Tamarix can adapt to environmental change in the process of vegetation construction in coastal saline land.

4.3. The Possibility of Vegetation Construction Using Tamarix

The shallow groundwater table and high-salinity, high-intensity evaporation caused salt from the groundwater to accumulate in the soil during the drought season [47,48]. The existence of excessive salt affected the soil’s physical and chemical properties. In the long term, the accumulation of salt inevitably affected the natural environment and ecological balance. Planting Tamarix could improve the soil texture by decreasing the bulk density, increasing the soil porosity and the water-holding capacity of the soil. These changes in the components of soil structure are conducive to salt leaching. During the rainy season, precipitation could carry salt from the surface soil layer through pores embedded in the roots to the deep layer (Figure 4), which played the role of desalination. Thus, planting Tamarix could reduce soil salinity, improve the soil environment and provide a good environment for plant growth.
Wheat, maize, cotton, and rice can be planted in the process of saline soil rehabilitation. In previous studies, during the growing season, the ET of winter wheat-summer maize was 740 mm [49] and 1008 mm [50]; the ET of cotton was approximately 600 mm [51] and 526 mm [52]; and the ET of rice was 600.6 mm and 614.8 mm [53]. The ET of Tamarix ranged from 514.2 to 573.8 mm in our study. The water consumption of winter wheat-summer maize far exceeded the annual average precipitation in the region. At the same time, these two crops were extremely dependent on freshwater and not suitable for planting in this region. As a halophyte, Tamarix can live in natural saline ecosystems. The cotton plant required mulching film to maintain moisture and a relatively low saline soil environment for growth. The physical structure of soil was changed by using plastic film, and the long degradation cycle led to ecosystem destruction. Rice plants needed amounts of freshwater, which was the scarcest in this region. Similarly, in the dry year, the precipitation was too low to support the consumption of Tamarix, so it had to absorb part of the groundwater. According to the groundwater observations of these 3 years, there was a drop in the groundwater table due to the water consumption of Tamarix, but not excessively (Figure 3h), so there is less concern about seawater intrusion due a sharp drop in the water table. Therefore, Tamarix is a reasonable choice for saline soil rehabilitation in coastal saline soil.

5. Conclusions

In this paper, the evapotranspiration of Tamarix in coastal saline land from May to October, 2016 to 2018 was speculated to range from 514.2 to 573.8 mm using the values of field measurements and estimation. Evapotranspiration possessed positive relationships with temperature, VPD, and Rn and negative relationships with RH and atmospheric pressure. Among all the evapotranspiration affecting factors, wind speed played the dominant role, followed by VPD and groundwater table. Although planting Tamarix increased soil water consumption, it could also improve components of soil structure and be useful for comfortable soil environment establishment. In the normal and wet years, water resources were sufficient to support the consumption of Tamarix in the coastal saline soil. Even in dry years, water balance can be met by reducing soil evaporation. In general, Tamarix was a suitable plant for the reclamation and rehabilitation of saline soil.

Author Contributions

Conceptualization, H.C., X.L., and H.S.; Data curation, H.C., A.R., C.Y. and K.G.; Writing—original draft preparation, H.C., A.R., X.F., and J.L.; Writing—review and editing, H.C., A.R., X.L., and H.S.; Visualization, H.C., A.R.; Supervision, X.L. and H.S.; Project administration, H.S.; Funding acquisition, X.L., J.W., and K.G.

Funding

This research was funded by the Key Deployment Project of the Chinese Academy of Sciences (KFZD-SW-1124). The National Natural Science Foundation of China (31371574,51809260). The Science and Technology Project of Hebei province, China (17227006D). Key Research and Development Program of Hebei Province (18226803D).

Conflicts of Interest

The authors declare no conflict of interest.

References

  1. Yang, J.S. Development and prospect of the research on salt-affected soils in China. Acta Pedol. Sin. 2008, 45, 837–845. [Google Scholar]
  2. Liu, X. Reclamation and utilization of saline soils in water-scarce regions of Bohai. Chin. J. Eco-Agric. 2018, 26, 1521–1527. [Google Scholar]
  3. Cui, B.; Yang, Q.; Zhang, K.; Zhao, X.; You, Z. Responses of saltcedar (Tamarix chinensis) to water table depth and soil salinity in the Yellow River Delta, China. Plant Ecol. China 2010, 209, 99–110. [Google Scholar]
  4. Cao, C.; Jiang, S.; Ying, Z.; Zhang, F.; Han, X. Spatial variability of soil nutrients and microbiological properties after the establishment of leguminous shrub Caragana microphylla Lam. plantation on sand dune in the Horqin Sandy Land of Northeast China. Ecol. Eng. 2011, 37, 1467–1475. [Google Scholar] [CrossRef]
  5. Xu, H.; Li, Y.; Xu, G.; Zou, T. Ecophysiological response and morphological adjustment of two Central Asian desert shrubs towards variation in summer precipitation. Plant Cell Environ. 2007, 30, 399–409. [Google Scholar] [CrossRef] [PubMed]
  6. Hultine, K.; Nagler, P.; Morino, K.; Bush, S.; Burtch, K.; Dennison, P.; Glenn, E.; Ehleringer, J.; Dennison, P. Sap flux-scaled transpiration by tamarisk (Tamarix spp.) before, during and after episodic defoliation by the saltcedar leaf beetle (Diorhabda carinulata). Agric. For. Meteorol. 2010, 150, 1467–1475. [Google Scholar] [CrossRef]
  7. Nippert, J.B.; Butler, J.J., Jr.; Kluitenberg, G.J.; Whittemore, D.O.; Arnold, D.; Spal, S.E.; Ward, J.K. Patterns of Tamarix water use during a record drought. Oecologia 2010, 162, 283–292. [Google Scholar] [CrossRef]
  8. Zhang, W.J.; Chong, Y.J.; Sheng, S.B.; An, T. Mechanism and measures for improving soil in alkali saline land by use of tamarix chinensis lour. Inn. Mong. For. Sci. Technol. 2003, 4, 3–7. [Google Scholar]
  9. Feng, X.; An, P.; Li, X.; Guo, K.; Yang, C.; Liu, X. Spatiotemporal heterogeneity of soil water and salinity after establishment of dense-foliage Tamarix chinensis on coastal saline land. Ecol. Eng. 2017, 121, 104–113. [Google Scholar] [CrossRef]
  10. Sala, A.; Smith, S.D.; Devitt, D.A. Water use by Tamarix ramosissima and associated phreatophytes in a Mojave Desert floodplain. Ecol. Appl. 1996, 6, 888–898. [Google Scholar] [CrossRef]
  11. Cleverly, J.R.; Dahm, C.N.; Thibault, J.R.; McDonnell, D.E.; Coonrod, J.E.A. Riparian ecohydrology: Regulation of water flux from the ground to the atmosphere in the Middle Rio Grande, New Mexico. Hydrol. Process. 2006, 20, 3207–3225. [Google Scholar] [CrossRef]
  12. Yu, T.; Qi, F.; Si, J.; Zhang, X.; Zhao, C. Tamarix ramosissima stand evapotranspiration and its association with hydroclimatic factors in an arid region in northwest China. J. Arid Environ. 2017, 138, 18–26. [Google Scholar] [CrossRef]
  13. Lian, X.; Piao, S.; Huntingford, C.; Li, Y.; Zeng, Z.; Wang, X.; Ciais, P.; McVicar, T.R.; Peng, S.; Ottle, C.; et al. Partitioning global land evapotranspiration using CMIP5 models constrained by observations. Nat. Clim. Chang. 2018, 8, 640–646. [Google Scholar] [CrossRef]
  14. Nagler, P.L.; Morino, K.; Didan, K.; Erker, J.; Osterberg, J.; Hultine, K.R.; Glenn, E.P. Wide-area estimates of saltcedar (Tamarix spp.) evapotranspiration on the lower Colorado River measured by heat balance and remote sensing methods. Ecohydrology 2009, 2, 18–33. [Google Scholar] [CrossRef]
  15. Nagler, P.L.; Scott, R.L.; Westenburg, C.; Cleverly, J.R.; Glenn, E.P.; Huete, A.R. Evapotranspiration on western U.S. rivers estimated using the Enhanced Vegetation Index from MODIS and data from eddy covariance and Bowen ratio flux towers. Remote Sens. Environ. 2005, 97, 337–351. [Google Scholar] [CrossRef]
  16. William, L.H.; Hart, C.R. Water Loss and Salvage in Saltcedar (Tamarix spp.) Stands on the Pecos River, Texas. Invas Plant Sci Mana. 2009, 4, 309–317. [Google Scholar]
  17. Allen, R.G.; Pereira, L.S.; Smith, M.; Raes, D.; Wright, J.L. FAO-56 Dual Crop Coefficient Method for Estimating Evaporation from Soil and Application Extensions. J. Irrig. Drain. Eng. 2005, 131, 2–13. [Google Scholar] [CrossRef]
  18. Chen, Y.; Xue, Y.; Hu, Y. How multiple factors control evapotranspiration in North America evergreen needleleaf forests. Sci. Total Environ. 2018, 622, 1217–1224. [Google Scholar] [CrossRef]
  19. Xu, M.; Wen, X.; Wang, H.; Zhang, W.; Dai, X.; Song, J.; Wang, Y.; Fu, X.; Liu, Y.; Sun, X.; et al. Effects of climatic factors and ecosystem responses on the inter-annual variability of evapotranspiration in a coniferous plantation in subtropical China. PLoS ONE 2014, 9, e85593. [Google Scholar] [CrossRef]
  20. Irmak, S.; Kabenge, I.; Skaggs, K.E.; Mutiibwa, D. Trend and magnitude of changes in climate variables and reference evapotranspiration over 116-yr period in the Platte River Basin, central Nebraska–USA. J. Hydrol. 2012, 420, 228–244. [Google Scholar] [CrossRef]
  21. Wu, S.H.; Jansson, P.-E.; Kolari, P. Modeling seasonal course of carbon fluxes and evapotranspiration in response to low temperature and moisture in a boreal Scots pine ecosystem. Ecol. Model. 2011, 222, 3103–3119. [Google Scholar] [CrossRef]
  22. Han, Y.; Zhang, L.; Wang, C.; Yuan, J.; Wei, H. Dynamic characteristics and influencing factors of actual evapotranspiration in cold wetland. South North. Water Transf. Water Sci. Technol. 2018, 16, 28–34. [Google Scholar]
  23. Zhao, Y.; Liu, Y.; Li, J.; Liu, X. Spatial and temporal variation of potential evapotranspiration and its sensitivity to meteorological factors in china from 1960 to 2013. Desert Oasis Meteorol. 2018, 12, 1–9. [Google Scholar]
  24. Daamen, C.C.; Simmonds, L.; Wallace, J.; Laryea, K.; Sivakumar, M. Use of microlysimeters to measure evaporation from sandy soils. Agric. For. Meteorol. 1993, 65, 159–173. [Google Scholar] [CrossRef] [Green Version]
  25. Sakuratani, T. A Heat Balance Method for Measuring Water Flux in the Stem of Intact Plants. J. Agric. Meteorol. 1981, 37, 9–17. [Google Scholar] [CrossRef]
  26. Gerdes, G.; Allison, B.E.; Pereira, L.S. Overestimation of soybean crop transpiration by sap flow measurements under field conditions in Central Portugal. Irrig. Sci. 1994, 14, 135–139. [Google Scholar] [CrossRef]
  27. Ren, D.; Xu, X.; Hao, Y.; Huang, G. Modeling and assessing field irrigation water use in a canal system of Hetao, upper Yellow River basin: Application to maize, sunflower and watermelon. J. Hydrol. 2016, 532, 122–139. [Google Scholar] [CrossRef]
  28. Allen, R.G. Crop evapotranspiration-Guidelines for computing crop water requirements-FAO Irrigation and drainage paper. Fao Rome 1998, 56, D05109. [Google Scholar]
  29. Wei, G.H.; Dong, X.N.; Yang, P.N. Study on water surface evaporation forecast based on multivariate linear regression model and gray relational analysis. Water Sav. Irrig. 2010, 2, 41–44. [Google Scholar]
  30. Blum, A. Effective use of water (EUW) and not water-use efficiency (WUE) is the target of crop yield improvement under drought stress. Field Crop. Res. 2009, 112, 119–123. [Google Scholar] [CrossRef]
  31. Schlesinger, W.H.; Jasechko, S. Transpiration in the global water cycle. Agric. For. Meteorol. 2014, 189, 115–117. [Google Scholar] [CrossRef]
  32. Good, S.P.; Noone, D.; Bowen, G. Hydrologic connectivity constrains partitioning of global terrestrial water fluxes. Science 2015, 349, 175–177. [Google Scholar] [CrossRef] [PubMed] [Green Version]
  33. Mishra, A.; Sharma, S.D.; Khan, G.H. Improvement in physical and chemical properties of sodic soil by 3, 6 and 9 years old plantation of Eucalyptus tereticornis Biorejuvenation of sodic soil. For. Ecol. Manag. 2003, 184, 115–124. [Google Scholar] [CrossRef]
  34. Lampurlanés, J.; Cantero-Martínez, C. Soil bulk density and penetration resistance under different tillage and crop management systems and their relationship with barley root growth. Agron. J. 2003, 95, 526–536. [Google Scholar]
  35. Villegas, J.C.; Breshears, D.D.; Zou, C.B.; Law, D.J. Ecohydrological controls of soil evaporation in deciduous drylands: How the hierarchical effects of litter, patch and vegetation mosaic cover interact with phenology and season. J. Arid Environ. 2010, 74, 595–602. [Google Scholar] [CrossRef]
  36. Yuan, G.; Zhang, P.; Shao, M.-A.; Luo, Y.; Zhu, X. Energy and water exchanges over a riparian Tamarix spp. stand in the lower Tarim River basin under a hyper-arid climate. Agric. For. Meteorol. 2014, 194, 144–154. [Google Scholar] [CrossRef] [Green Version]
  37. Ren, D.; Xu, X.; Ramos, T.B.; Huang, Q.; Huo, Z.; Huang, G. Modeling and assessing the function and sustainability of natural patches in salt-affected agro-ecosystems: Application to Tamarisk (Tamarix chinensis lour.) in Hetao, upper Yellow River basin. J. Hydrol. 2017, 552, 490–504. [Google Scholar] [CrossRef]
  38. Yang, Z.; Sinclair, T.R.; Zhu, M.; Messina, C.D.; Cooper, M.; Hammer, G.L. Temperature effect on transpiration response of maize plants to vapour pressure deficit. Environ. Exp. Bot. 2012, 78, 157–162. [Google Scholar] [CrossRef]
  39. Drake, B.G.; Raschke, K.; Salisbury, F.B. Temperature and Transpiration Resistances of Xanthium Leaves as Affected by Air Temperature, Humidity, and Wind Speed. Plant Physiol. 1970, 46, 324. [Google Scholar] [CrossRef]
  40. Shah, S.H.H.; Vervoort, R.W.; Suweis, S.; Guswa, A.J.; Rinaldo, A.; van der Zee, S.E.A.T.M. Stochastic modeling of salt accumulation in the root zone due to capillary flux from brackish groundwater. Water Resour. Res. 2011, 47, 27. [Google Scholar] [CrossRef]
  41. Van der Zee, S.E.A.T.M.; Shah, S.H.H.; Vervoort, R.W. Root zone salinity and sodicity under seasonal rainfall due to feedback of decreasing hydraulic conductivity. Water Resour. Res. 2014, 50, 9432–9446. [Google Scholar] [CrossRef]
  42. Xu, X.; Huang, G.; Sun, C.; Pereira, L.S.; Ramos, T.B.; Huang, Q.; Hao, Y. Assessing the effects of water table depth on water use, soil salinity and wheat yield: Searching for a target depth for irrigated areas in the upper Yellow River basin. Agric. Water Manag. 2013, 125, 46–60. [Google Scholar] [CrossRef]
  43. Shokri, N.; Lehmann, P.; Or, D. Liquid phase continuity and solute concentra tion dynamics during evaporation from porous media-pore scale processes near vaporization surface. Phys. Rev. E 2010, 81, 046308. [Google Scholar] [CrossRef] [PubMed]
  44. Geng, X.; Boufadel, M.C. Impacts of evaporation on subsurface flow and salt accumulation in a tidally influenced beach. Water Resour. Res. 2015, 51, 5547–5565. [Google Scholar] [CrossRef]
  45. Shokri-Kuehni, S.M.S.; Norouzi Rad, M.; Webb, C.; Shokri, N. Impact of type of salt and ambient conditions on saline water evaporation from porous media. Adv. Water Resour. 2017, 105, 154–161. [Google Scholar] [CrossRef] [Green Version]
  46. Xu, H.; Li, Y. Water-use strategy of three central asian desert shrubs and their responses to rain pulse events. Plant Soil 2006, 285, 5–17. [Google Scholar] [CrossRef]
  47. Li, X.; Kang, Y.; Wan, S.; Chen, X.; Chu, L. Reclamation of very heavy coastal saline soil using drip-irrigation with saline water on salt-sensitive plants. Soil Tillage Res. 2015, 146, 159–173. [Google Scholar] [CrossRef]
  48. Guo, K.; Liu, X. Dynamics of meltwater quality and quantity during saline ice melting and its effects on the infiltration and desalinization of coastal saline soils. Agric. Water Manag. 2014, 139, 1–6. [Google Scholar] [CrossRef]
  49. Luo, J.; Shen, Y.; Qi, Y.; Zhang, Y.; Xiao, D. Evaluating water conservation effects due to cropping system optimization on the Beijing-Tianjin-Hebei plain, China. Agric. Syst. 2018, 159, 32–41. [Google Scholar] [CrossRef]
  50. Sun, H.; Zhang, X.; Liu, X.; Liu, X.; Shao, L.; Chen, S.; Wang, J.; Dong, X. Impact of different cropping systems and irrigation schedules on evapotranspiration, grain yield and groundwater level in the North China Plain. Agric. Water Manag. 2019, 211, 202–209. [Google Scholar] [CrossRef]
  51. Holst, J.; Liu, W.; Zhang, Q.; Doluschitz, R. Crop evapotranspiration, arable cropping systems and water sustainability in southern Hebei, P.R. China. Agric. Water Manag. 2014, 141, 47–54. [Google Scholar] [CrossRef]
  52. Yang, P.; Hu, H.; Tian, F.; Zhang, Z.; Dai, C. Crop coefficient for cotton under plastic mulch and drip irrigation based on eddy covariance observation in an arid area of northwestern China. Agric. Water Manag. 2016, 171, 21–30. [Google Scholar] [CrossRef] [Green Version]
  53. Wang, Y.; Zhou, L.; Jia, Q.; Yu, W. Water use efficiency of a rice paddy field in Liaohe Delta, Northeast China. Agric. Water Manag. 2017, 187, 222–231. [Google Scholar] [CrossRef]
Figure 1. The precipitation distribution in different months of 2016–2018 and 30-year.
Water 11 02273 g001
Figure 2. The photograph of the study area and weather station. The red arrows indicate the location and the red triangle present the weather station.
Water 11 02273 g002
Figure 3. Diurnal dynamics of meteorological elements, ET0 and the GW from May to October in 2016, 2017 and 2018. (a) Wind Speed; (b) Temperature; (c) RH; (d) VPD; (e) Atmospheric Pressure; (f) Rn; (g) ET0; (h) Groundwater Table.
Water 11 02273 g003
Figure 4. Daily soil EC in different soil layers (20, 40, 60, and 80 cm) and the precipitation distribution from May to October in 2018.
Water 11 02273 g004
Figure 5. Average monthly soil evaporation coefficient (Kce), basal crop coefficient (Kcb) and crop coefficient (Kc) for Tamarix from May to October in 2018.
Water 11 02273 g005
Figure 6. Scatter plot of daily values of environmental factors and evaporation (data points = 109).
Water 11 02273 g006
Figure 7. Scatter plot of daily values of environmental factors and transpiration (data points = 109).
Water 11 02273 g007
Figure 8. Scatter plot of daily values of environmental factors and evapotranspiration (data points = 109).
Water 11 02273 g008
Figure 9. Precipitation, evaporation, and transpiration from May to October in 2016, 2017 and 2018.
Water 11 02273 g009
Table 1. Soil physical specifications for different soil layers.
Soil Layer (cm)Soil TextureBulk Density (g/cm3)Soil Porosity (%)Saturated Hydraulic Conductivity (cm/d)Salt Content (g/kg)
Bare Land0–20 Silt1.60 ± 0.0440 ± 10.36 ± 0.0238.24 ± 0.03
20–40 Silt1.56 ± 0.0641 ± 20.47 ± 0.018.32 ± 0.04
40–60 Silt1.53 ± 0.0242 ± 10.60 ± 0.027.10 ± 0.02
60–80 Silt1.56 ± 0.0341 ± 10.48 ± 0.037.19 ± 0.03
Tamarix Land0–20 Silt1.37 ± 0.0249 ± 135.45 ± 0.048.07 ± 0.04
20–40 Silt1.48 ± 0.0344 ± 10.61 ± 0.028.67 ± 0.03
40–60 Silt1.54 ± 0.0242 ± 10.55 ± 0.018.83 ± 0.02
60–80 Silt1.58 ± 0.0140 ± 10.44 ± 0.0311.37 ± 0.02
Table 2. ANOVA of environmental factors in different years.
YearU (m/s)T (°C)RH (%)Pa (kPa)Rn (MJ/m2)VPD (kPa)GW (m)
20161.73 a23.29 ab67.16 a100.95 a10.90 a0.94 a−0.51 a
20171.79 a24.01 a65.84 a100.97 a9.81 b1.06 b−0.56 a
20182.03 b22.35 b71.88 b100.95 a10.00 ab0.76 c−0.38 b
Note: a, b and c indicate a significant difference in the same column (p < 0.05).
Table 3. The E, T, ET, and the T/ET during the Tamarix growing season in 2018.
MonthEb (mm)Et (mm)Etb (mm)T (mm)ET (mm)T/ET
May29.7 ± 0.339.6 ± 0.357.6 ± 0.551.3 ± 0.8 90.9 ± 1.156.40%
June30.0 ± 0.342.1 ± 0.361.0 ± 0.346.3 ± 0.5 88.4 ± 0.852.40%
July16.2 ± 0.133.0 ± 0.350.9 ± 0.850.3 ± 0.683.3 ± 0.960.40%
August23.9 ± 0.244.9 ± 0.464.5 ± 0.662.1 ± 0.5107.0 ± 0.958.00%
September21.8 ± 0.328.0 ± 0.439.0 ± 0.445.0 ± 0.573.0 ± 0.961.60%
October15.0 ± 0.220.0 ± 0.228.8 ± 0.351.6 ± 0.6 71.6 ± 0.872.10%
Total136.6 ± 1.4207.6 ± 1.9301.9 ± 3.0306.6 ± 3.5514.2 ± 5.4
Table 4. Gray relational analyses of evaporation, transpiration, evapotranspiration, and environmental factors.
Correlation Coefficient
X1X2X3X4X5X6X7X8
E0.86590.09290.34440.97170.13740.68420.88710.5182
T0.90580.09260.35190.93160.13740.71590.83870.5369
ET0.92940.09330.36300.86000.13920.77150.77460.5650
Note: X1, wind speed; X2, pressure; X3, mean temperature; X4, VPD; X5, RH; X6, EC; X7, groundwater table; X8, Rn.

