Article

Evaluation of Partial Nitritation/Anammox (PN/A) Process Performance and Microorganisms Community Composition under Different C/N Ratio

Department of Sanitary Engineering, Faculty of Civil and Environmental Engineering, Gdansk University of Technology, Narutowicza Street 11/12, 80-233 Gdansk, Poland
*
Author to whom correspondence should be addressed.
Water 2019, 11(11), 2270; https://doi.org/10.3390/w11112270
Submission received: 7 September 2019 / Revised: 22 October 2019 / Accepted: 22 October 2019 / Published: 30 October 2019
(This article belongs to the Section Wastewater Treatment and Reuse)

Abstract

:
A one-stage partial nitritation/anammox (PN/A) process with intermittent aeration is possible under sidestream conditions, but implementation in a mainstream is a challenge due to increased Carbon/Nitrogen (C/N) ratios in domestic wastewater. This study investigated the effect of C/N ratios on process efficiency and the effect of narrowing non-aeration time on process improvement at high chemical oxygen demand (COD) load. An increase in TN removal efficiency was achieved in both series with gradual change of C/N ratio from 1 to 3, from 65.1% to 83.4% and 63.5% to 78% in 1st and 2nd series, respectively. However, at the same time, the ammonium utilization rate (AUR) value decreased with the increase in C/N ratio. At a high COD (C/N = 3) concentration, the process broke down and regained productivity after narrowing the non-aeration time in both series. Shifts in the system performance were also connected to adaptive changes in microbial community revealed by data obtained from 16S rRNA NGS (next-generation sequencing), which showed intensive growth of the bacteria with dominant heterotrophic metabolism and the decreasing ratio of autotrophic bacteria. The study shows that deammonification is applicable to the mainstream provided that the C/N ratio and the aeration/non-aeration time are optimized.

1. Introduction

Ammonium is the main form of nitrogen (N) presented in the municipal wastewater. The most commonly applied method of biological ammonia treatment to date is a conventional method involving the combination of nitrification and denitrification processes. The conventional process is considered to be effective, however, it has high operational costs due to high oxygen demand and commonly requires the addition of an external carbon source to support the denitrification step [1,2]. Thus, alternative solutions are intensively searched and investigated.
One of the most perspective technologies seems to be partial nitritation combined with the anammox process (PN/A), mainly due to theoretically about 60% lower oxygen requirement compared to the conventional process [3]. Moreover, demand for carbon sources could be reduced up to 100%, excessive sludge production by about 90% and greenhouse gas emissions limitation is possible to gain [4].
PN/A consists of two stages, where during the first, ammonium oxidizing bacteria (AOB) oxidize around 50% of initial ammonium to nitrite under aerobic conditions, while during the second stage, anaerobic ammonium oxidizing bacteria (AnAOB) oxidize residual NH4-N produced in previous step to NO2-N, under limited dissolved oxygen (DO) concentrations. In consequence, around 90% of ammonium is converted to nitrogen gas (N2) while the remaining 10% to nitrate (NO3-N) [5,6]. One of the most important challenges connected to PN/A implementation is the inhibition of nitrate oxidizing bacteria (NOB) activity to prevent a full nitrification pathway which leads to nitrate production. While in case of the side stream applications, under high N loads, NOB inhibition is possible due to presence of free ammonium and/or nitrous acid, and in mainstream treatment, a novel strategies have to be developed [7]. Periodic aeration is considered as a perspective approach in order to suppress NOB in mainstream wastewater treatment, due to their inability to trigger appropriate metabolic pathways in a relatively short time during the variable transition from anaerobic to aerobic conditions [8,9]. Variable aeration frequency benefits also AnAOB activity, especially for wastewater with a low C/N ratio and large loads of ammonia [10,11]. However, oxygen supply has to be provided with attention, on the one hand DO concentration has to be sufficient for partial NH4-N oxidation to NO2-N under aerobic conditions, on the other hand its overdose leads to full nitrification and inhibits AnAOB metabolism [12].
One of the examples of PN/A is the deammonification process, which has been widely applied for the treatment of high-strength ammonium wastewater and reject water (sidestream application) with low C/N ratios and elevated temperatures. Mainstream application of deammonifiaction i.e., to treat domestic wastewater seems to be attractive due to relatively low operational costs and slow excessive sludge production, however, unlike highly loaded wastewater, two issues have been identified. One issue is connected to NH4-N loads specified for domestic sewage, which is not sufficient to ensure NOB inhibition with free ammonia (FA). The second issue is related to C/N ratio, while deammonifiaction process efficiency relying on autotrophic bacteria activity (AOB and AnAOB); presence of elevated organic compounds concentration is known inhibitor of their metabolism [11]. The second issue could be solved by maintaining limited growth of heterotrophic denitrifies (HET) by applying effective oxygen supply for decomposition of organic compounds. On other hand, by exceeding the threshold of C/N ratio of organic matter loading rate, the intense growth of HET can lead to the wash-out of AnAOB from the system, the growth rate of which is very slow [12]. The doubling time of AnAOB ranges from 10 to 11 d at the maximum specific growth rate of 0.0027 h−1, thus, a long reactor start-up time is required [13]. Another problematic issue over mainstream deammonifiaction is susceptibility of AnAOB to external factors, such as DO and nitrite concentrations. By considering this, more often, the deammonifiaction process is run in sequencing batch reactors (SBR), which contributes to AnAOB cultivation due to easy and efficient biomass retention control, as well as reliable operation and configuration simplicity.
Recently, the Simultaneous partial Nitritation, Anaerobic ammonium oxidation and Denitritation process (SNAD) has also been developed, which is a combination of partial nitrification, anammox and denitrification; it is successfully used to remove N and organic carbon in the single reactor [14]. Such an approach was also successfully used for the treatment of industrial wastewater with a low C/N ratio and high NH4-N concentration [15]. The desired SNAD system performance can be achieved at DO concentration and a C/N ratio of 0.2–0.4 mgO2/L and 0.2–1.0 respectively at the same time [16].
There are many factors determining the technology used to remove N from wastewater, including existing infrastructure, required level of N removal and sewage properties, especially the ratio of C/N. The C/N ratio of wastewater usually ranges from 1:1 to 10:1, depending on the type of pre-treatment processes [17,18]. It seems that the deammonification process has better performance when biodegradable C/N ratio is lower than 0.5 [19]; however, there is a successful study which revealed that long-term biomass adaptation enables one to obtain N removal up to 95% when the C/N biodegradation ratio increased from 0.5 to 1.7 [9].
Moreover, the effectiveness of N removal in the deammonification process is influenced by the three most important factors related to aeration: DO concentration, aeration strategy (continuous vs. intermittent), aerobic to anaerobic phase duration ratio (R) and cycle length. For instance, a study [20] reflected that while at R = 1/3 and DO = 4 mg/L the highest N removal efficiency (69.5%) was obtained, significantly lower N removal rates were observed at R = 1 and R = 3 despite DO concentration.
The influence of the C/N ratio on the PN/A process has been widely tested, but it has not been associated with such factors as temperature and aeration strategy. The aim of this study was to examine the impact of differential C/N ratios and differential intermittent aeration strategy on enhancing the deammonification process rate at 20 °C. It was hypothesized that narrowing the non-aeration phase at high C/N ratio (C/N = 3) would improve the efficiency of the deammonification process. Because experiments were carried out over a period of more than 150 days, microbial community analysis based on 16S rRNA next-generation Sequencing (NGS) were performed in order to assess the biomass adaptation process in relation to the increased organic compound loads.

2. Materials and Methods

2.1. Laboratory Set-Up

The deammonification process was examined in a bench-scale sequencing batch reactor (SBR) with a working volume of 10 dm3 during two series, where the 1st series lasted for 90 days, while the 2nd series 64 days of the continuous system operation. The reactor was inoculated with biomass derived from the previously performed long-term experiment on side stream reject water treatment via the deammonification system. Reject water applied in previous studies were synthetic without carbon source addition. The system was equipped with a thermostatic jacket to maintain a constant temperature of 20 ± 1 °C in both series. The aeration was controlled with an aeration system consisting of an air pump (Mistral 200, Aqua Medic, Germany), DO probe (COS22D, Endress+Hauser, Switzerland), and an electromagnetic valve. The pH was controlled in the range of 7.3–7.9 with a programmable logic controller (PLC) connected with a pH probe (CPS471D, Endress+Hauser, Switzerland) by dosing 1 M solution of NaOH. In order to eliminate errors due to the variability of influent composition, the reactor was fed with the synthetic wastewater supplemented with medium as suggested by Dapena-Mora et al. [21] on a regular basis (once a week). The process was carried out in two series, during which the C/N ratio and the aeration strategy were changed. Both series were divided into five phases, each phase was established when C/N ratio was modified, the ratio was changed in a range from 1 to 3. Intermittent aeration mode was applied in all series with variable on/off phase duration in ranges from 3/3 to 3/15. Detailed experimental design with the all main parameters set are shown in Table 1.

2.2. Microbial Analysis

Biomass samples for microbial analysis were collected during the first (Deammon_INI) day of the 1st experimental series and the end of the last day (Deammon_END) of the 2nd experimental series. During sampling, 40 mL of the biomass sample were collected from the reactor, transferred to 50 mL tube and left for sedimentation. After supernatant removal, fresh 40 mL of the biomass were added, and the sedimentation step was repeated. Then, 150 mg of the concentrated biomass were subjected for total genomic DNA extraction with FastDNA™ SPIN Kit (MP Biomedicals, Santa Ana, CA, USA) in accordance to manufacturer protocol. After quality control by spectrophotometry with a 260/280 ratio, genomic DNA at a standardized concentration of 100 ng/μL was applied for Illumina next-generation sequencing (NGS) of 16S rRNA gene V3-V4 region amplified with 341F and 785R primers pair (Klindworth et al. 2013) in order to establish microbial community composition of the analyzed samples. Sequencing reactions were carried out with MiSeq sequencer by external executioner. Paired end reads were initially joined with FASTQ joiner and subjected to quality control with the FASTQ/A (at quality cut-off value = 20). Both tools are available at the Useqalaxy server (https://usegalaxy.org). Classification of the reads on each taxonomical level was carried out with Silva NGS server (http://www.arb-silva.de) by the use of database release version 132 at the species similarity level of 90% and OTUs (operational taxonomic units) clustering at 97%. Taxonomic and functional differences between metagenomes were analyzed using Statistical Analysis of Metagenomic Profiles (STAMP v. 2.1.3) [22].

2.3. Analytical Methods

The deammonification system performance was evaluated during 6 h tests by analyzing the behavior of NH4-N, NO2-N, NO3-N and COD concentrations. The samples of mixed liquor were filtered through 1.2 µm pore-size nitrocellulose membrane filters (Whatman, Kent, UK). Nitrate, nitrite and ammonia concentrations were determined spectrophotometrically by cuvette tests (Hach Lange GmbH). As an additional control to the conventional nitrogen forms concentrations measurements, total N were measured by a TOC analyzer (TOC-VCSH) coupled with a TN module (TNM-1) (SHIMADZU Corporation, Kyoto, Japan). In case of samples in which imbalance of nitrogen concentrations were detected, evaluation of the particular nitrogen forms was repeated. The biomass concentrations were determined as a volatile suspended solids (VSS) fraction of the total suspended solids (TSS) in accordance to Standard Methods (APHA, 2005). Based on the obtained results ammonium utilization rate (AUR) and nitrate production rate (NPR) were calculated to evaluate the deammonification process rate. In case of the AUR, total N (TN) and COD removal rates basic statistics (average, standard deviation) were determined (supplementary data Figures S1 and S2) in order to compare PN/A process performance between particular phases.

3. Results and Discussion

The application of the PN/A process in the mainstream is incomparably more difficult than in sidestreams due to high C/N > 2 ratios in domestic wastewater, which can lead to a decrease of AUR or accumulation of nitrates [23]. Therefore, it is important to introduce an effective strategy for COD removal during the first stage of municipal wastewater treatment. This can be achieved, for example, by a High Rate Activated Sludge (HRAS) process, the main objective of which is to increase the recovery of organic matter from wastewater [24]. The efficiency of COD removal in the HRAS process is usually >50%, however, such technology is not dedicated for nitrogen removal [25,26]. Alternatively, chemically enhanced primary treatment (CEPT) can be introduced prior to the biological reactor, which involves coagulation and flocculation to achieve a significant decrease of organic compounds concentrations presented in colloids and suspended solids fractions, however, such an approach generates chemical sludge and high operational costs [27]. Another solution to the problem of high C/N ratios is the adaptation of the optimal aeration strategy in the PN/A process. Studies on the influence of aeration on the PN/A process have been carried out [16,28,29,30] However, none of them have analyzed the impact of the reduction of non-aeration time during intermittent aeration on process performance at high C/N ratios. Our study, apart from determining the influence of C/N ratios on PN/A process performance, has been extended by this analysis and verified the hypothesis that the narrowing of non-aeration time has a positive effect on the nitrogen removal. Additionally, microbial analysis of the total bacterial community was performed to assess adaptive changes in its quantitative and qualitative composition under the influence of changes in operational conditions.

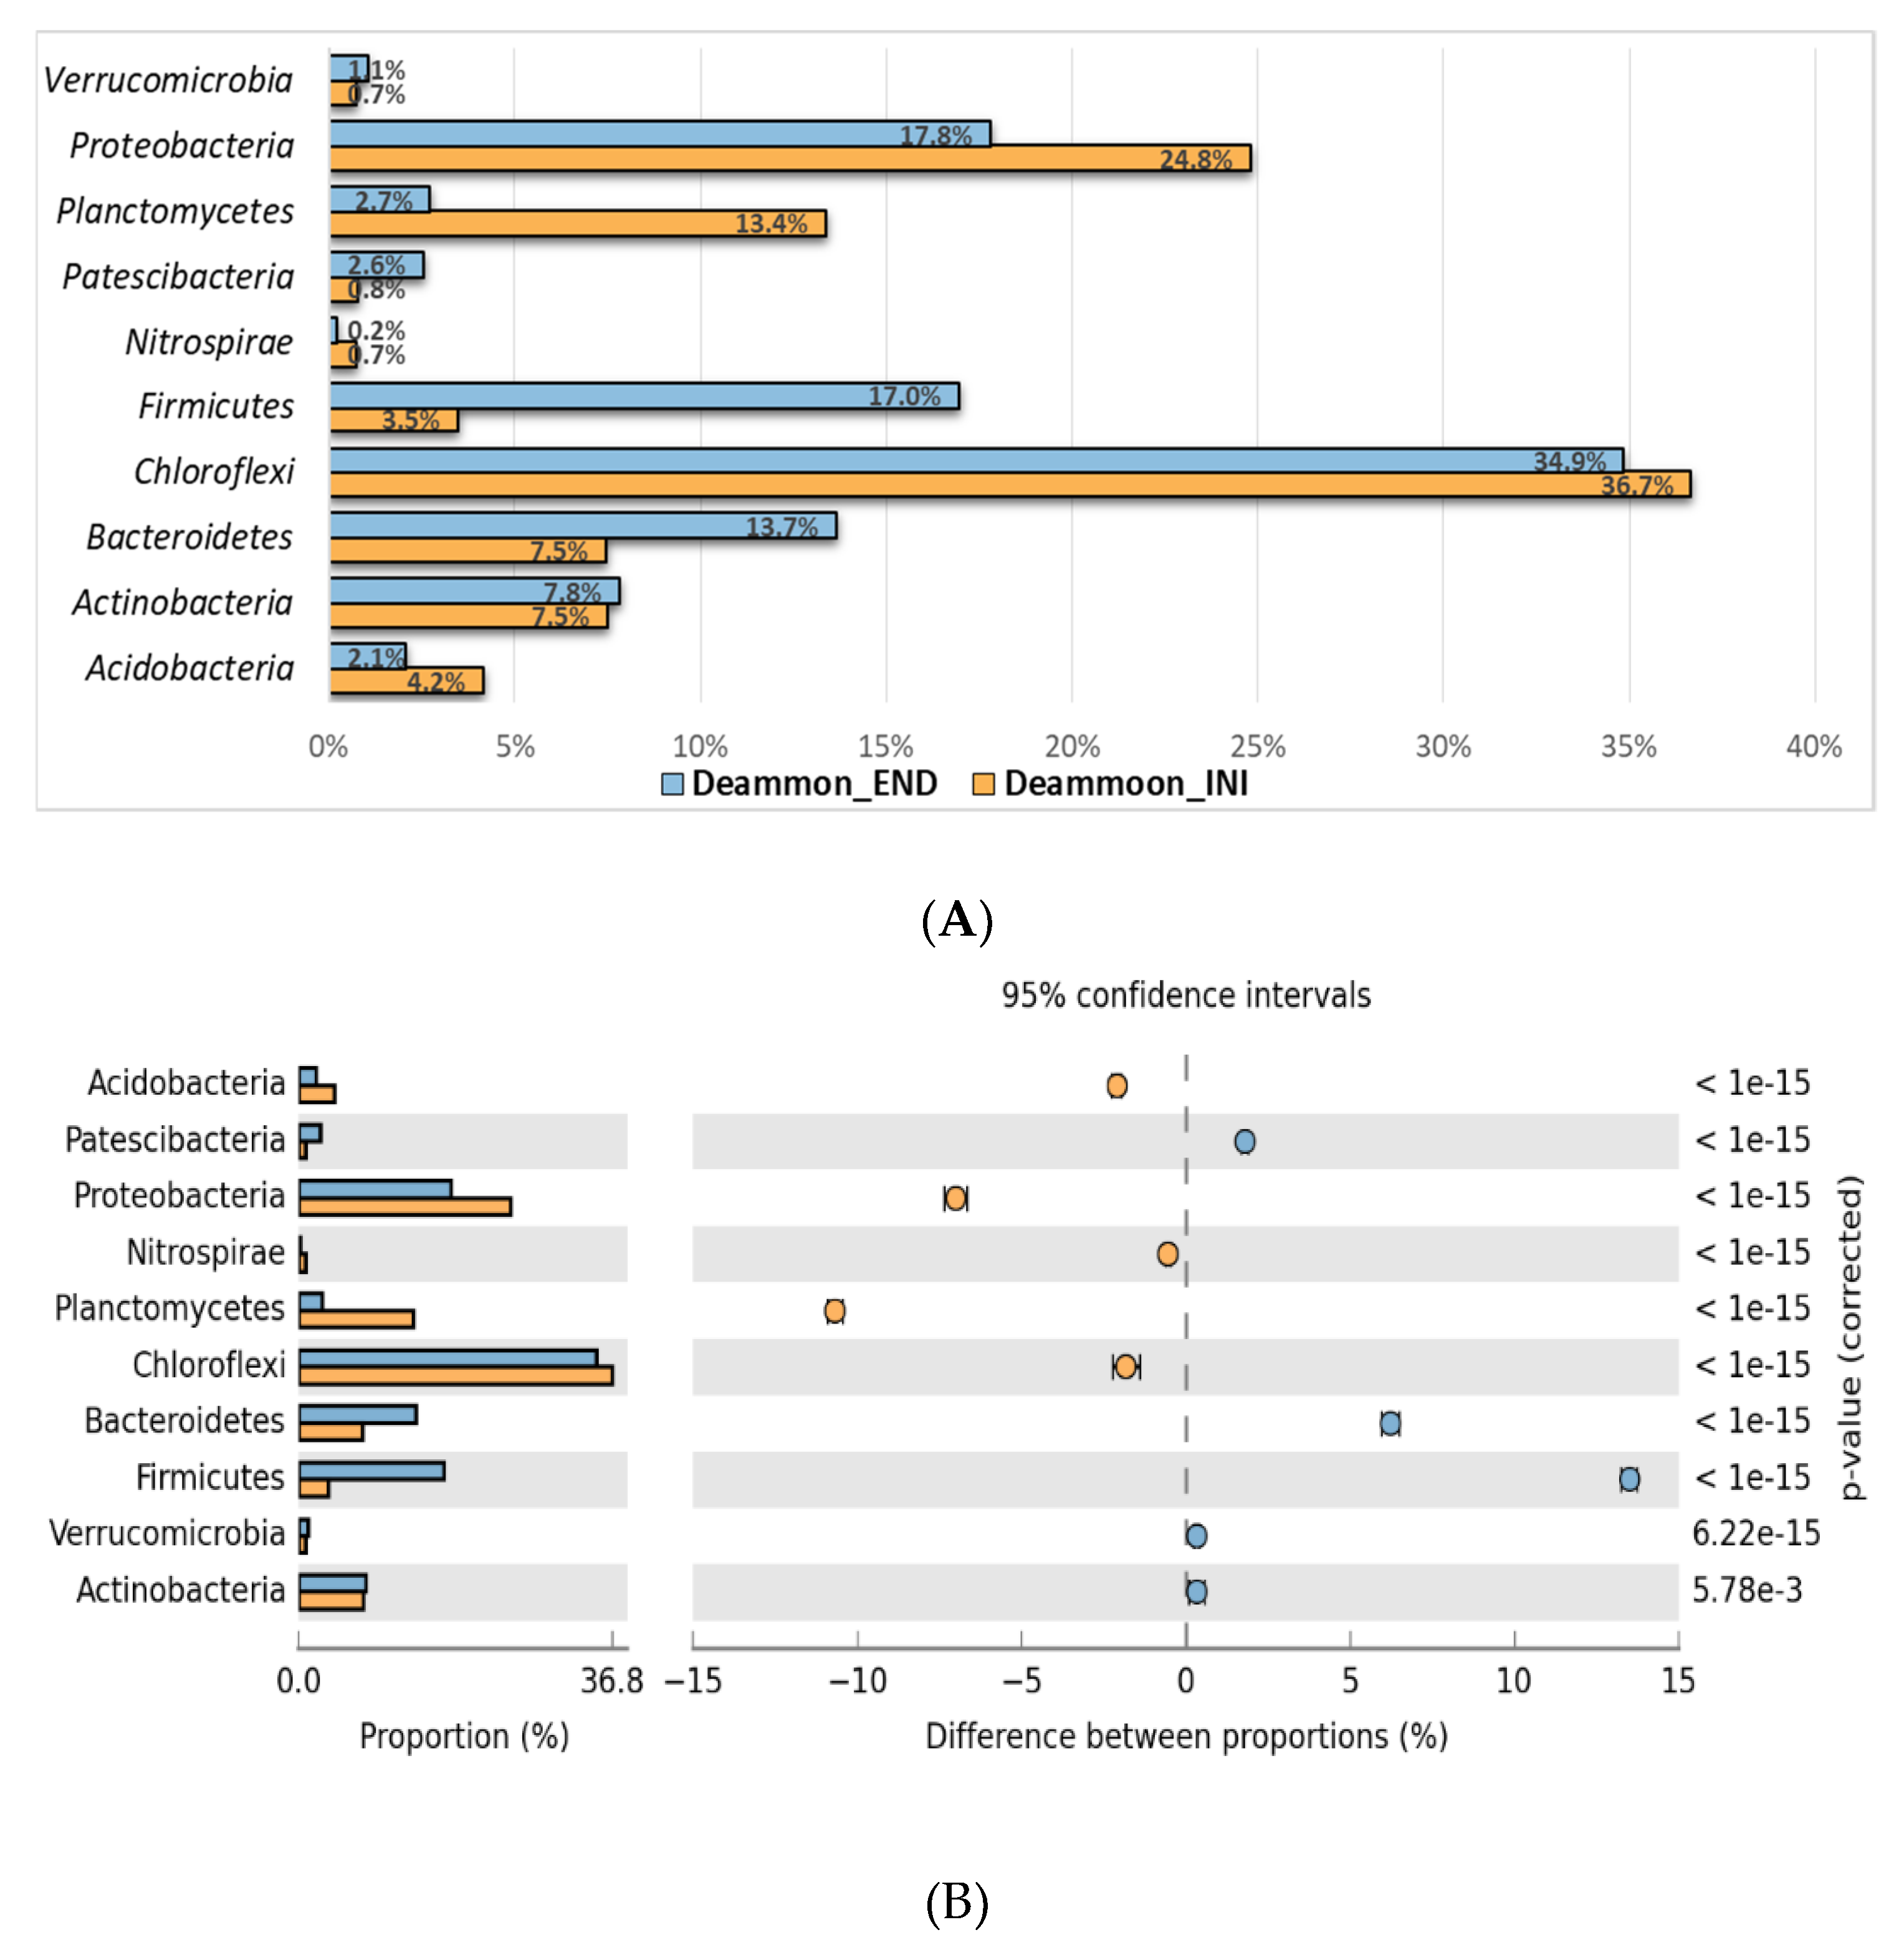
3.1. Microbial Analysis

From the initial (Deammon_INI) and adapted for 90 days (Deammon_END) biomass samples, 186,479 and 168,484 raw 16S rRNA gene sequences reads were obtained, from which 126,510 and 113,998 passed quality control, respectively (Table 2). Data output obtained from the Silva NGS server showed diversity increase of the microbial community after introduction of the carbon source measured as the number of the unique operational taxonomical units (OTUs) per specified reads number. From the initial 125 OTUs per 1000 reads, their number has increased by 150% to 188 OTUs. Phylogenetic composition and share of the particular physiological bacterial groups in biomass samples before and after 90 days of carbon addition is presented in. Figure 1 and Table 3.
The composition of the microbial community was subjected to significant changes during the experimental period. One of the trends was intensive growth of the bacteria with dominant heterotrophic (HET) metabolism which increased their abundance from 57.0 to 75.3%. However, it should be noted that this trend was limited to selected heterotrophic bacteria such as members of Bacillales (2.1–13%) and Clostridiales (0.4–1.2%) families from Firmicutes phylum or Ignavibacteriales from Chlorobi (from 7.0 to 11.0%), while others tend to remain at similar abundances. Chloroflexi was the most abundant HET organisms in both samples at avg. 25% share. From HET microorganisms only in terms of Pseudomonadales (1.7–0.1%) and Acidobacteria (4.2–2.1%) representatives some reduction of participation was noticed. Carbon dosage reduced numbers of representatives of all main autotrophic groups approx. by 60–75%. AOBs represented manly by Nitrosomonas genus decreased from 2.0 to 0.8%, NOBs predominated by Nitrospira from Nitrosprae Phylum has dropped from 0.7 to 0.2%, while anammox Candidatus Brocadia reduced their abundance more than four times from 8.1 to 1.8%.

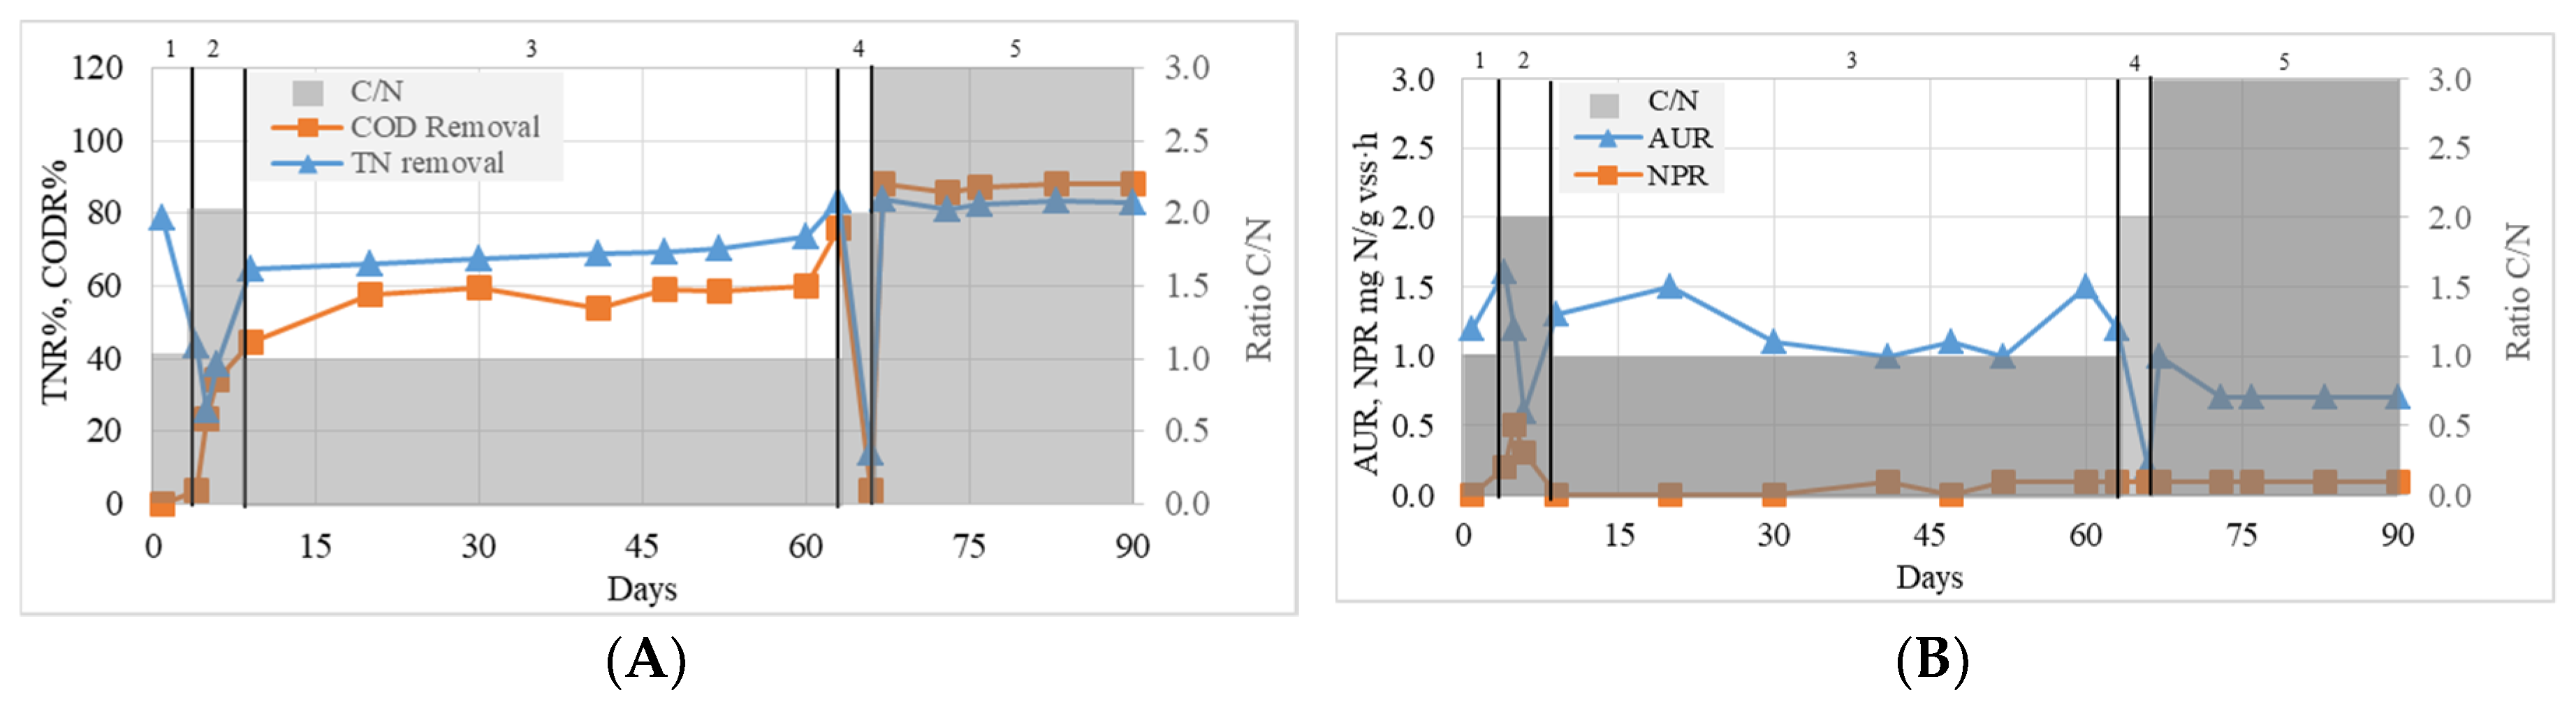
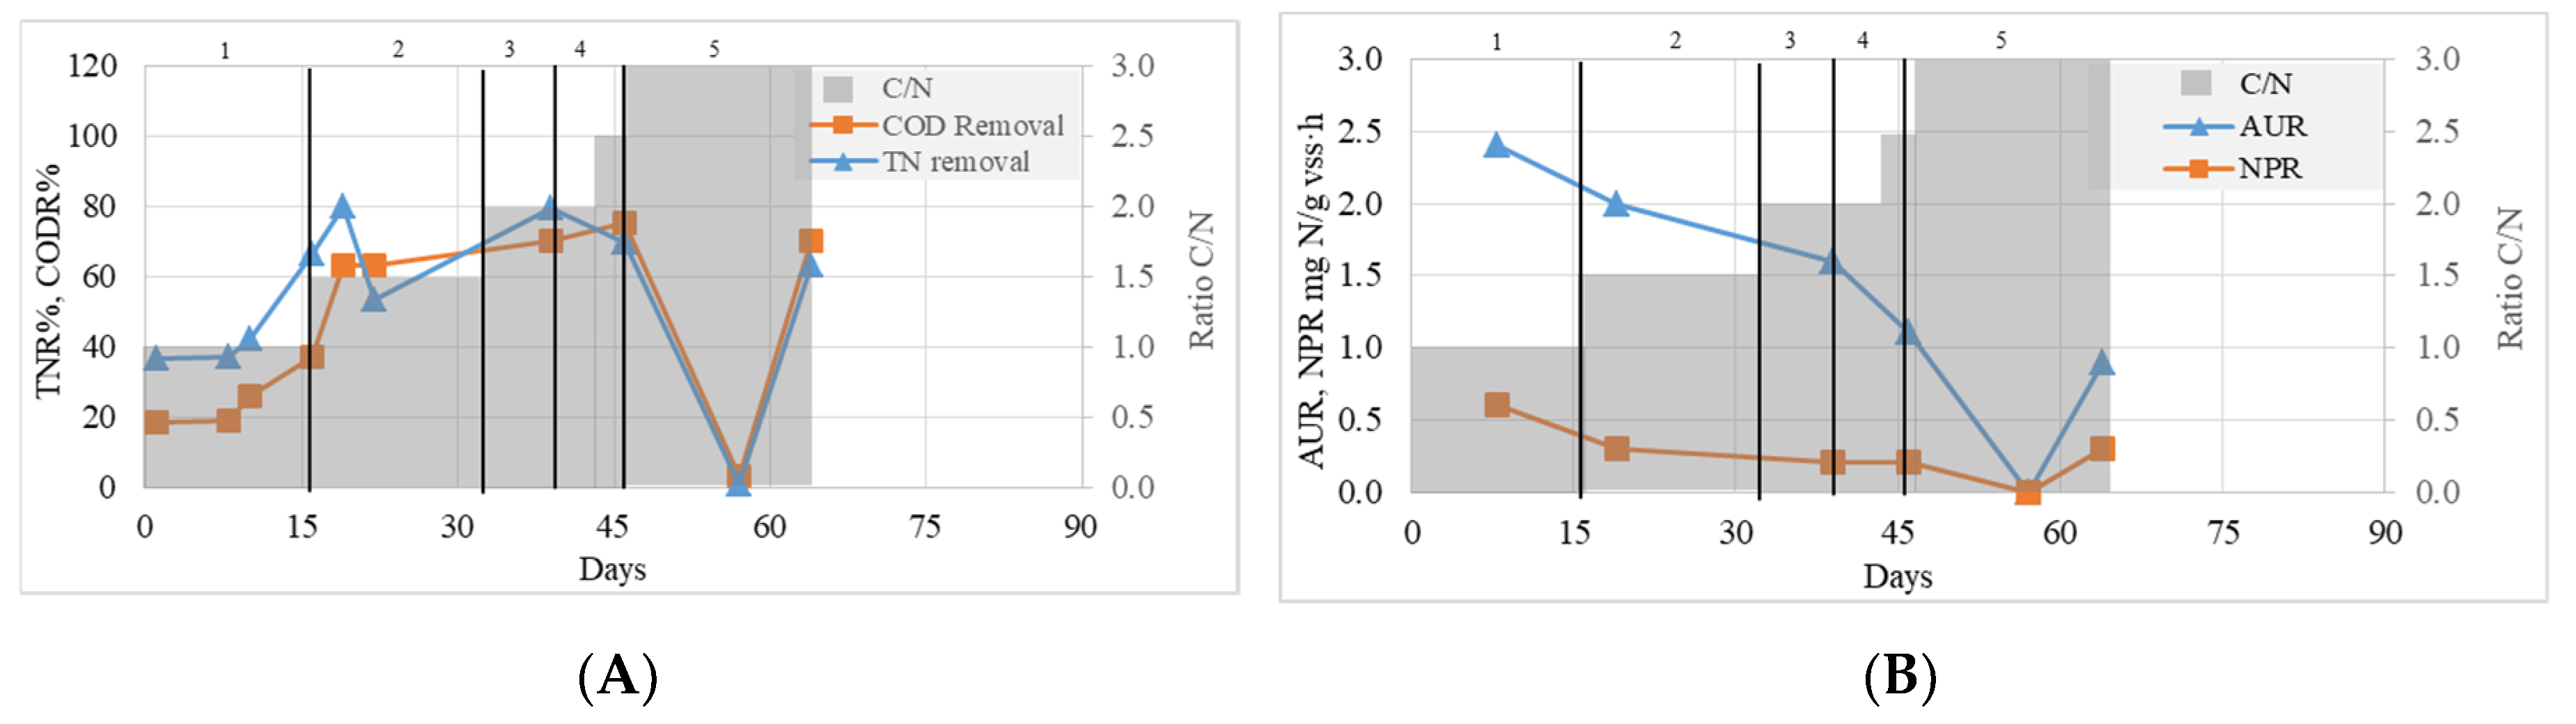
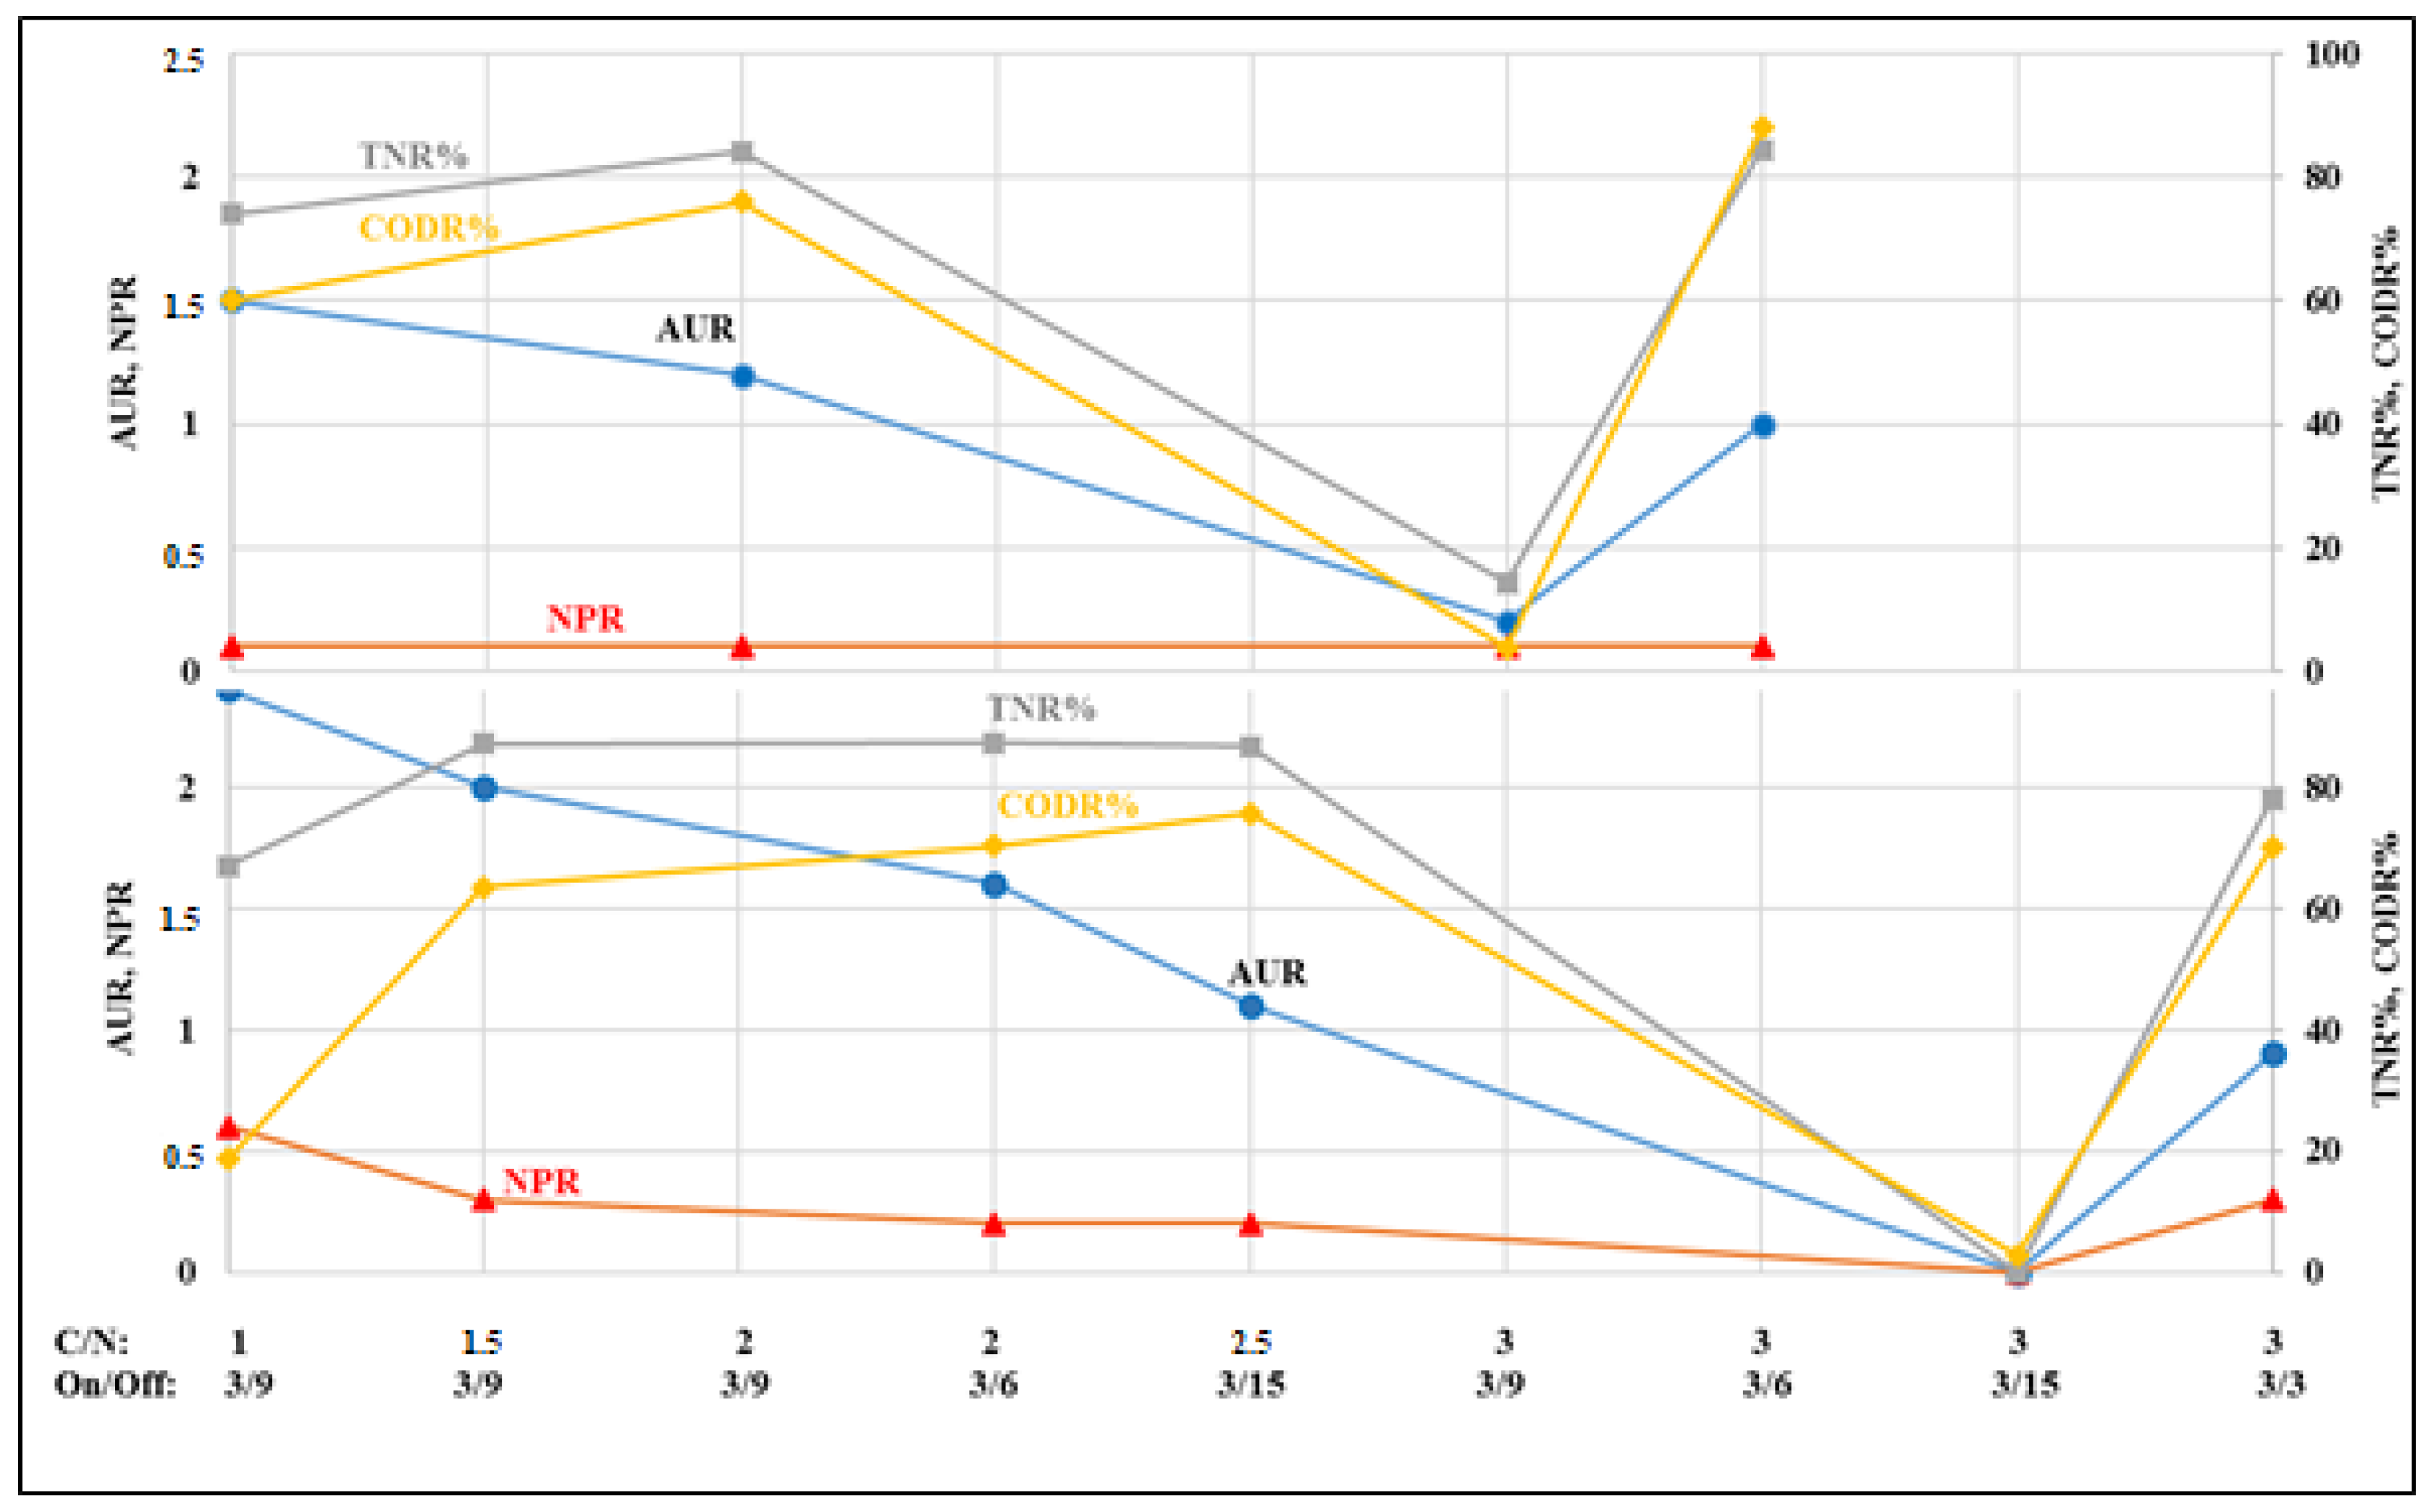
3.2. Effect of C/N Ratio on N Removal

In the first series of tests as well in the 2nd series, there were five phases that differed in the process control parameters and showed different dependencies. The phase division is shown in Figure 2 and Figure 3.
The main goal of the presented experiments was to characterize nitrogen removal processes in PN/A systems under increased C/N ratios during following experiment phases. In agreement with phase 1 where C/N = 1 total nitrogen removal reached 79%, after increasing the C/N ratio to 2 within 4 days, the TN removal efficiency decreased to about 40%. Averaged AUR values (approx. 1.2 N-NH4 mg/gvss·h) for the 1st and 2nd phases were comparable (supplementary materials Figure S1), however, continuous carbon dosage at C/N = 2 decreased AUR twice at the end of the 2nd phase. This indicates that increased carbon load inhibits AOB activity, but that the response occurs with a delay. Due to the fact that AUR decrease was stepwise, a sudden drop in the TN removal of efficiency was rather connected to inhibition of AnAOB. This supposition is supported by the behavior of NO3-N concentration (Supplementary Materials Tables S1 and S2). On the 1st day of the study, the increase in NO3-N was small, but on subsequent days, an increase in NO3-N was observed (about 12% larger on the 4th day compared to the 1st day), which negatively affected TN removal efficiency, which in the 2nd phase fluctuated between 20% and 45%. Reduction of NO2-N increased accordingly, at a C/N = 1 NO2- N was reduced by 0.93 mg/L, while at a C/N = 2 by 1.71 mg/L. It could also have been caused by decrease of NOB activity. During the following phase, it was decided to re-apply a C/N ratio of 1. Moreover, the addition of NO3-N together with COD in the 2nd phase of the 1st series was provided to assess NOB activity based on the increase in NO3-N and to induce activity of the heterotrophic denitrification process.
This resulted in an improved process and increased TN removal efficiency by over 20%. AUR increased to 1.3 mg/L/d on the 9th day and reached 1.5 mg/L/d after the stabilization of the 3rd phase on the 60th day. NPR in the 3rd phase oscillated around 0 mg/L/d. The increase in NO3-N did not change significantly, but there was also an increase in NO2-N concentration at the end of the test by about 95% compared to the start of the test. Until the 62nd day, TN removal efficiency ranged from 65 to 75%, growing steadily. The NH4-N removal efficiency was almost 100% at the end of this phase. These circumstances confirm an improvement in process efficiency after returning to a smaller C/N ratio of 1. The longer adaptation time allowed the C/N ratio of 2 to be re-used. This time it increased the TN removal efficiency by about 10%. The NH4-N removal efficiency remained unchanged at >99%. The change in ratio did not affect the increase in NO3-N production in this case. AUR decreased from 1.5 to 1.2 mg/L/d. NPR invariably oscillated around 0 mg/L/d. Again after 3 days, i.e., without using a longer adaptation, the C/N ratio was changed to 3 at the beginning of the 5th phase.
This reduced the TN removal efficiency from 84% to 14%. At such COD concentration, the number of AnAOB decreases, which adversely affects the long-term stability of the process [31]. Furthermore, the organic compound in high concentration was an ammonium monoxygenase inhibitor (AOB enzyme). Therefore, in the discussed phase, its presence inhibited the activity of nitrifying bacteria. AUR also fell to 0.2 mg/L/d. Similarly, NH4-N removal efficiency decreased by approximately 85%. This also resulted in negligible NO3-N production and a reduction in NO2-N production compared to the 63th day. However, the next day, TN removal efficiency returned to 84% again and slightly changed until the end of the study. NH4-N removal also regained efficiency up to about 100%. NO3-N production was around 96%. In turn, the NO2-N concentration increased to 0.94 mg/L on the last day of the study. AUR eventually increased to 0.7 mg/L/d at the end of the process. The NPR value in the fifth phase was approximately 0.1 mg/L/d until the end of the study. It turns out that heterotrophs reduced COD, which enabled an increase in AOB activity. Microbial data analysis proved the mentioned suppositions. Elongated carbon dosage at increased C/N ratio was responsible for the washout of main autotrophic bacteria (Table 1) from the system. While AOB and NOB decreased their abundances at around 55%, in case of AnAOB their share reduced over 80%. On the other hand, after 90 days of continuous carbon dosage, HET bacteria constituted 75% of the total bacterial community which reflects that main mechanism of the nitrogen removal in our system was switched from the anammox to denitratation and basically denitritation processes. The main mechanisms of nitrogen removal in biomass before and after adaptation to the organic carbon along with microorganisms responsible for them were visualized in Figure 4.
Similar observations were obtained in the second series of tests. The C/N ratio in this series was increased gradually by 0.5 from 1 to 3. Changing the C/N ratio from 1 to 1.5 resulted in an increase of TN removal efficiency from 42% to 66%. This may be due to an increase in activity of AnAOB, which increased exponentially at C/N ratios from 1.1 to 1.5 in Miao et al. [28]. In the 3rd phase, TN removal efficiency was 79.6% at a C/N ratio of 2, and then fell to about 70% in the 4th phase at a C/N ratio of 2.5. NH4-N removal efficiency did not change significantly during the test at C/N ≤ 2.5 ratios and oscillated around 98–99%. As in the first series, the change in the C/N ratio to 3 caused the process to collapse, and the TN removal efficiency and NH4-N removal efficiency dropped sharply to 0.7% and 2.4%, respectively. Only after 7 days did TN removal regain efficiency at 63%, similarly NH4-N removal efficiency −99.8%. After adaptation, regeneration followed and TN removal efficiency returned to 63%. AUR gradually decreased in the following days of the process from 2.4 mg/L/d on 8th day at C/N = 1 to 1.1 mg/L/d on 46th day at C/N = 2.5. After increasing the C/N ratio to 3, AUR fell to 0 mg/L/d and then increased to 0.9 mg/L/d on 64th day.
Our research has shown that increasing the C/N ratio to some extent improves the efficiency of TN removal. This indicates an increase in heterotrophic bacteria that denitrificate nitrates formed in the anammox or/either nitrification processes, while reducing the N concentration in wastewater [9]. This enables simultaneous partial nitration, anammox and denitrification, known as the SNAD process [32]. However, the presence of excessive COD promotes the proliferation of heterotrophs that compete for NO2-N with AnAOB and oxygen with AOB bacteria, which reduces the efficiency of N removal [33]. The effect of this phenomenon is a decrease in the AUR value in this study proportional to the increase in the C/N ratio.
Miao et al. [28] showed an improvement in the PN/A process efficiency as the C/N ratio increased. The TN removal efficiency increased from 31% to 77%, and the NH4-N removal efficiency from 54% to 83% after a gradual change in the C/N ratio from 1.1 to 2.5. Above this value, the PN/A process has deteriorated. It turns out that a slight increase in the C/N ratio from 0.01 to 0.13 improves the efficiency of TN removal from 78% to 84% [32]. Similar observations took place in our study.
Bi et al. [34] also showed an increase in TN removal efficiency from 61% to 99.5% with an increase in the C/N ratio from 1 to 1.8 and a decrease in the efficiency to 74% with a ratio of 3.5. Our results are therefore confirmed in the literature, although a completely different impact of the C/N ratio on the PN/A process was also described [32]. An increase in TN removal efficiency from 62% to 70% and NH4-N removal efficiency was found from 52% to 79% after a reduction of the C/N ratio from 0.75 to 0.5.
Therefore, it is necessary to know the response of the microbial community to various C/N ratios. In one study [30], the activity and number of AnAOB increased when the C/N ratio increased from 1.1 to 2, and at 2.5 this activity stopped growing. On the other hand, their growth rate oscillated around 0.034/d at C/N of 1.1–1.5, and with C/N to 2 increase, AnAOB showed a lower growth rate, which may be the result of limited nitrite production [30].
In Zhang et al. study [11], a high C/N ratio suppressed bioactivity and biodiversity of both AOB and AnAOB. This resulted in a reduction in N removal. It is also worth noting that the indicated tests and ours were carried out at a temperature of 20–35 °C, while De Clippeleir et al. [34] obtained the best TN removal efficiency of 45% at a C/N ratio of 1, and increasing the C/N ratio no longer allowed an increase in yield at the tested temperature of 15 °C. A comparison of the obtained TN removal efficiency and NH4-N removal efficiency at different C/N ratios in other studies is shown in Table 4.

3.3. Effect of C/N Ratio on COD Removal

Effective removal of COD required a sufficiently long start-up period to HET. This can be achieved by a gradual increase in the C/N ratio in the inflow.
In the 1st series, there is the trend of increasing COD removal efficiency along with the C/N ratio increase. On the first day of the study, COD removal was 0.27% at C/N = 1, while at the of the 1st series when C/N ratio of 3 was applied COD removal rate improved up to 88%. It turns out that a slight change in the C/N ratio from 1 to 2 caused an increase in COD removal efficiency by approximately 34%. The return to the C/N ratio = 1 did not cause a decrease in efficiency, contrary to expectations, and even caused its subsequent increase by another 30% to 60%. The change in C/N ratio from 2 to 3 had a significant impact on COD removal. This caused the process to break and improve again after 14 days of adaptation. This is because in the case of too high concentration of COD (C/N = 3), bacteria stop reducing NO3-N as a result of reducing their activity. COD is therefore not used for denitrification. COD removal efficiency recovers after narrowing the non-aeration time, as shown in Figure 5.
Similar relations were obtained in a 2nd series of tests. COD removal efficiency increased with the increase of the C/N ratio from 18.4% at C/N equal to 1 to 75.5% at C/N equal to 2.5. At a C/N value of 3, the process collapsed and caused COD removal efficiency at 2.9%. It then recovered 70.13% efficiency after 7 days.
The highest COD removal efficiency value obtained during the test is 88% in the 1st series at a C/N ratio of 3. This is an unsatisfactory value compared to [32] who achieved COD removal efficiency of 94% at C/N ratio equal to 0.5, as well as Jia et al. [35] with TN removal efficiency of about 90% with a C/N ratio of 1.2. In summary, a high C/N ratio should be used to obtain a high COD removal rate, however, it should be noted that at higher values, TN removal efficiency breaks down.
The variability of TN removal efficiency and COD removal efficiency depending on the C/N ratio during the whole test in series 1st and 2nd is summarized in Figure 2 and Figure 3.

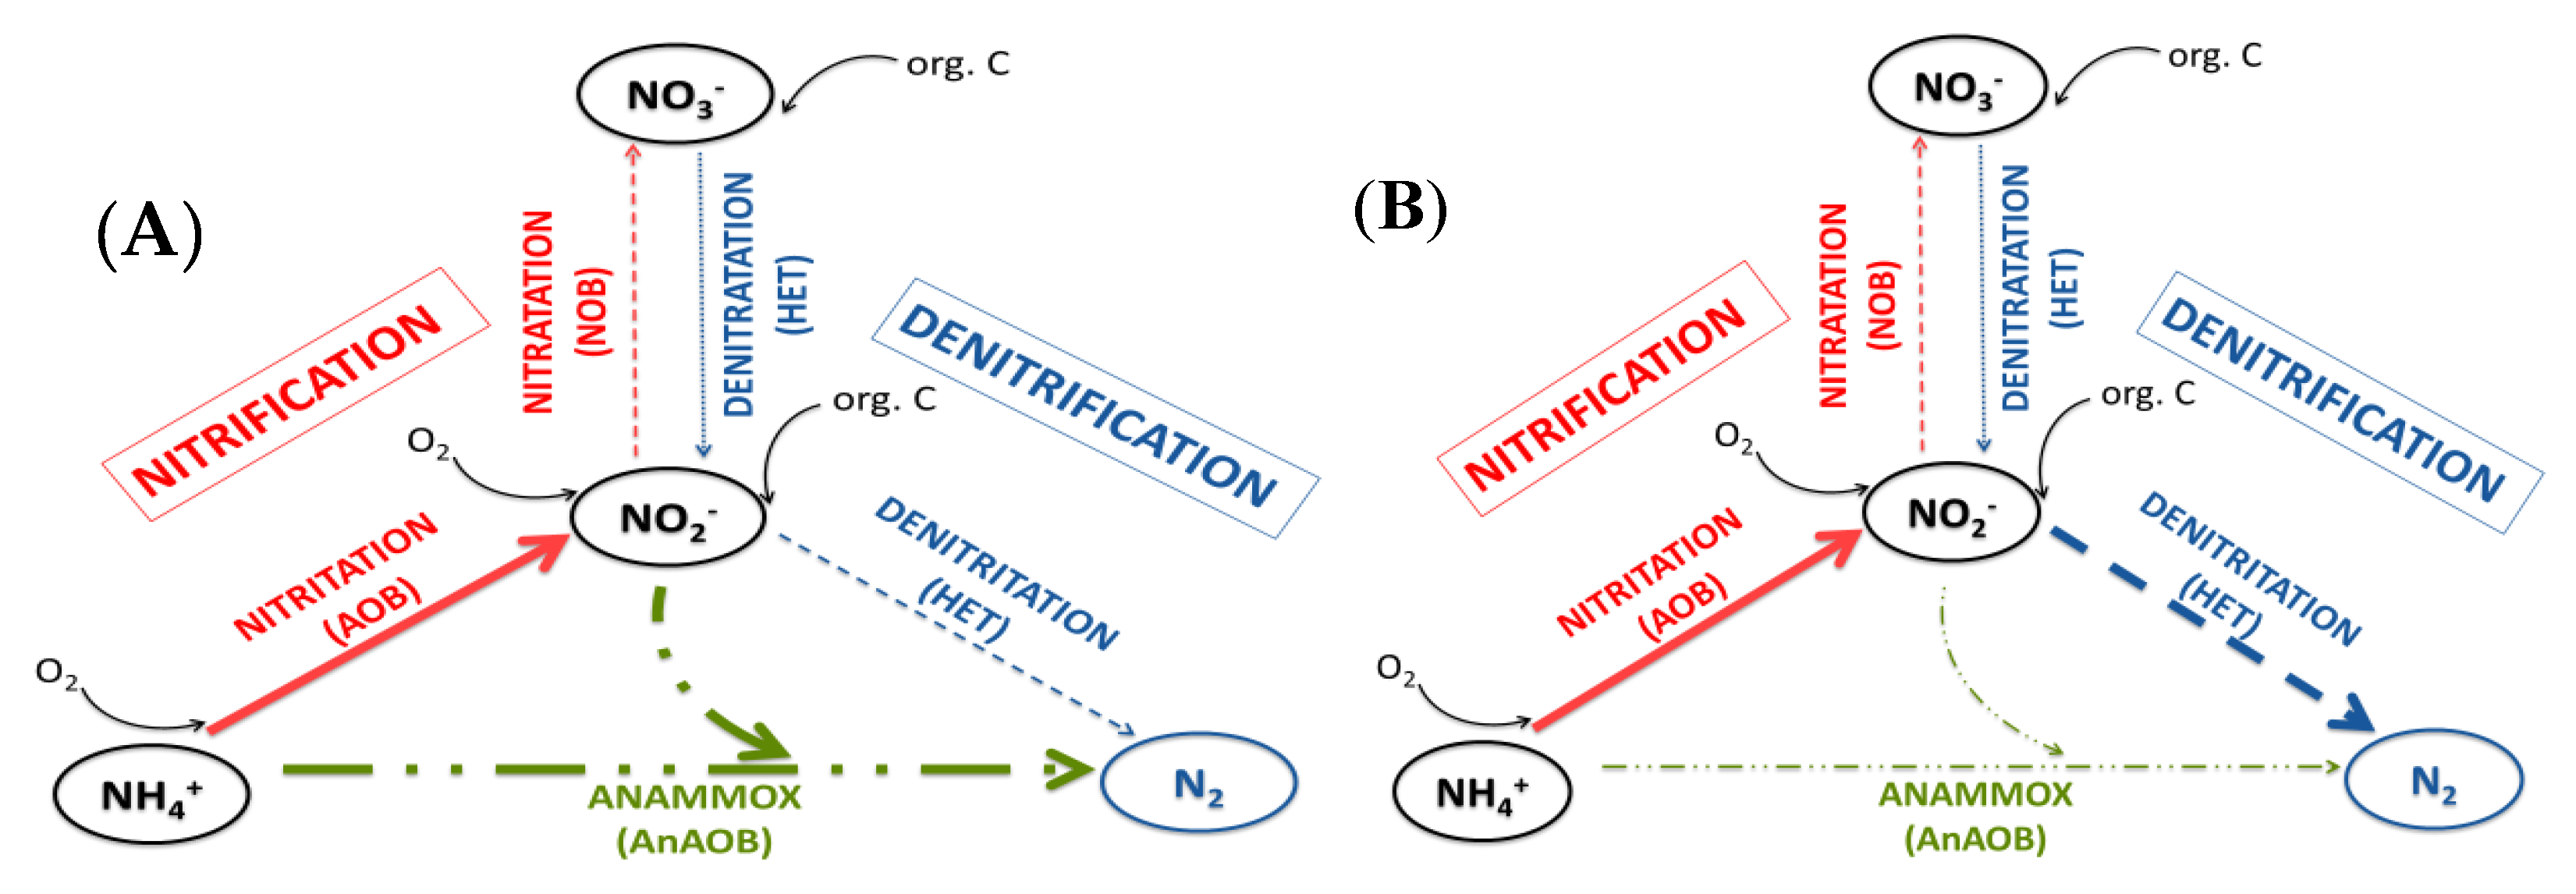
3.4. The Influence of the Aeration Strategy on the Improvement of N Removal

Miao et al. [27] achieved in their research different values of the indicated parameters with a similar C/N ratio of 1.1 and with different aeration strategies. They studied the influence of the DO value and continuous and intermittent aeration on the PN/A process. It turns out that a decrease in the DO value from 0.27 mg/L to 0.17 mg/L reduced the TN removal efficiency by about 44%. In the next step, they used intermittent aeration, which restored the value of TN removal efficiency to its original value. The concentration of nitrates then decreased from 30.8 to 2.1 mg N/L. It has already been stated that intermittent aeration is an effective method of preventing the accumulation of nitrates [5,36].
In our research in the first series of tests, the first 4 phases maintained constant aeration with an aer/non-aer ratio of 3 min/9 min. The change of the aeration strategy was decided in phase 5th, when the C/N ratio of 3 significantly reduced TN removal efficiency to 14%. Either the heterotroph activity was not yet adapted to such a high C/N ratio and required adaptation, or the amount of oxygen was not enough. The narrowing of the non/aer phase also increased the frequency of changes in the aer and non/aer phases. This resulted in both improved TN removal efficiency and NH4-N removal efficiency. This indicates an increase in heterotroph activity, which also translated into a reduction of organic compounds and enabled partial nitration in the next step. Importantly, both NO3-N and NO2-N production increased significantly, by 92% and 8%, respectively. On day 73th, aer/non-aer times changed to 3 min/12 min. This caused an initial small reduction in TN removal efficiency of 3%, which, however, returned to its original value of 84% after 10 days. NH4-N removal efficiency was not significantly different. There was a slight increase in NO3-N production and a decrease in NO2-N production. On the last day, the non-aeration phase was shortened to 9 min, which resulted in a much more pronounced increase in NO3-N production and a decrease in NO2-N production as compared to the previous change in aeration strategy.
Similar relations were obtained in a 2nd series of tests. TN removal efficiency increased from day 1 to day 19 from 36.7% to 79.9% with an aer/non-aer ratio of 3 min/9 min. A change of aer/non-aer ratio to 3 min/12 min on day 22 resulted in a decrease in TN removal efficiency to 53.4%. Narrowing the non-aer phase to 6 min increased TN removal efficiency to 79.6%. However, when we extend the non-aeration time, we can expect NO3-N to multiply as a result of the anammox process, which is then reduced by HET. This situation can be observed in the second series, when on the 42th day the aer/non-aer time was changed from 3 min/6 min to 3 min/15 min. Production of NO3-N increased by around 19%.
The impact of the non-aer phase on improving the process stability at its breakdown after changing the C/N ratio to 3 turns out to be significant. Then, thanks to the narrowing of the non-aer phase from 15 min to 3 min, TN removal efficiency improved by about 63%. This procedure results in more frequent oxygen phases that allow the accumulation of nitrites due to AOB activity. The earlier anoxic phase causes the inhibition of NOB activity for the duration of the aerobic phase, thanks to which partial nitrification and further use of nitrites in the anammox process is possible. Thanks to this modification, faster depletion of COD was achieved, which established favorable conditions for AOB and AnAOB.
Liu et al. [16] have very widely studied the simultaneous effect of the C/N ratio and the value of DO on PN/A. They showed that the highest TN removal efficiency can be obtained in C/N conditions in the range of 0.2–1 and DO in the range of 0.2–0.4 mgO2/L. With our DO at 0.7 mg/L, the most favorable C/N ratio indicated by them is in the range of 2.5–3, which is in line with our results.
The impact of individual aeration strategies in both study series is shown in Figure 5. Both series follow a similar tendency: TN removal efficiency, COD removal efficiency, AUR and NPR reduce to values close to 0, then recover their values after narrowing the non/aer phase from 9 to 6 min and from 15 to 3 min in the 1st and 2nd series, respectively.

3.5. Other Methods of Increasing the Efficiency of PN/A

In one study [34], the TN removal efficiency was improved after a sharp decrease in the C/N ratio of 2 by changing the feeding regime. Instead of two pulses of 10 min per hour, one 20 min period was introduced within one hour. This increased TN removal efficiency from 28% to 42%. The change also affected the reduction of NO3-N production.
However, Jenni et al. [9] showed that SRT has a significant impact on the PN/A process. When anammox activity decreased with increasing COD concentration, it was increased by increasing the SRT with 160 mg NH4-N/L/d to 220 mg NH4-N/L/d. In turn, NOB has the opposite effect of SRT and with its increase, the NOB activity decreases. AOB did not show any reaction to change in SRT. It therefore appears that at high C/N ratios, a high SRT should be maintained so that AnAOB can co-exist with heterotrophic bacteria.
It is also important to remember the optimal DO values for each C/N ratio, as described in detail by Miao et al. [31].
It would also be worth examining the increase in the efficiency of PN/A by changing the temperature and pH during the process. Also important for the PN/A process in the mainstream is to examine all the parameters at the same time and to determine the most favorable conditions for conducting the process for wastewater with high concentrations of the influencing COD. The research to improve PN/A efficiency with the use of intermittent aeration could also be extended to process optimization in terms of both process efficiency and aeration economics, as well as to investigate the effect of changes in aeration time.

4. Conclusions

The single-stage partial nitrification/anammox/denitritation process was developed to investigate the effect of the C/N ratio on process efficiency. The impact of changing non-aeration times has also been tested. An increase in TN removal efficiency was achieved in both series with gradual change of C/N ratio from 1 to 3 from 78.96% to 82.92% and 36.7% to 63.3% in 1st and 2nd series, respectively. COD removal efficiency also clearly increased during the tests from 0.27% to 87.94% and 18.39% to 70.13% in the 1st and 2nd series, respectively. However, at the same time the AUR dropped from 1.5 mg N/g VSS/h with a C/N ratio of 1–0.2 mg N/g VSS/h with the C/N ratio equal to 3. Critical C/N ratio for process efficiency was ratio 3 with the TN, NH4-N and COD removal efficiencies significantly reduced in both series. System performance was connected with the microbial community structure, which was affected by continuous increased of the carbon load. Autotrophs, especially AnAOB, reduced their abundances, which was accompanied by decrease of AUR along with increased C/N ratio. In parallel HET bacteria were on the rise and over dominated total bacterial community. Thus, PN/A system was rather redirected to the nitrification/nitritation followed by denitritation/denitrification processes. Despite relatively high abundance of the potential denitrifying bacteria system performance was systematically disturbed by C/N ratio manipulation. Either the HET activity was not yet adapted to the elevated C/N ratio and required acclamation period, or the aeration conditions were not optimized. The reduction of non-aeration time from 9 min to 6 min in 1st series and from 15 to 6 min in the 2nd series definitely improved the process. This indicates an increase in heterotroph activity, which also translated into a reduction of organic compounds and enabled partial nitration in the following step.

Supplementary Materials

The following are available online at https://www.mdpi.com/2073-4441/11/11/2270/s1, Table S1. Operational log of the experimental PN/A system under different C/N ratio (selected days of operation).; Table S2. N-NO3 and N-NO2 concentrations at the beginning and end of the SBR operational cycle during following days of the experiment.; Figure S1. Basis statistics (average and standard deviation (S)) over the AUR, TN and COD removal rates during following experimental phases in frame of 1st series.; Figure S2. Basis statistics (average and standard deviation (S)) over the TN and COD removal rates during following experimental phases in frame of 2nd series.

Author Contributions

Conceptualization, H.A.-H. and J.M. (Joanna Majtacz); methodology, J.M. (Joanna Majtacz); validation, P.K. and J.M. (Jacek Makinia.); formal analysis, P.K.; investigation, H.A.-H., D.G. and J.M. (Joanna Majtacz); writing—original draft preparation, D.G. and J.M. (Joanna Majtacz); writing—review and editing, P.K.; visualization, D.G. and J.M. (Joanna Majtacz); supervision J.M. (Jacek Makinia.); project administration, D.G.

Funding

This research received no external funding.

Acknowledgments

We would like to thank the reviewers for their helpful comments and for improving the manuscript.

Conflicts of Interest

The authors declare no conflict of interest.

References

  1. Cai, M.; Hu, J.; Wells, G.; Seo, Y.; Spinney, R.; Ho, S.H.; Dionysiou, D.D.; Su, J.; Xiao, R.; Wei, Z. Understanding mechanisms of synergy between acidification and ultrasound treatments for activated sludge dewatering: From bench to pilot–Scale investigation. Environ. Sci. Technol. 2018, 52, 4313–4323. [Google Scholar] [CrossRef]
  2. Luo, S.; Gao, L.; Wei, Z.; Spinney, R.; Dionysiou, D.D.; Hu, W.P.; Chai, L.; Xiao, R. Kinetic and mechanistic aspects of hydroxyl radical–mediated degradation of naproxen and reaction intermediates. Water Res. 2018, 137, 233–241. [Google Scholar] [CrossRef] [PubMed]
  3. Vlaeminck, S.E.; Clippeleir, H.; Verstraete, W. Microbial resource management of one-stage partial nitritation/anammox. Microbiol. Biotechnol. 2012, 5, 433–448. [Google Scholar] [CrossRef] [PubMed]
  4. Siegrist, H.; Salzgeber, D.; Eugster, J.; Joss, A. Anammox brings WWTP closer to energy autarky due to increased bio- gas production and reduced aeration energy for N-removal. Water Sci. Technol. 2008, 57, 383–388. [Google Scholar] [CrossRef] [PubMed]
  5. Lackner, S.; Gilbert, E.M.; Vlaeminck, S.E.; Joss, A.; Horn, H.; Loosdrecht, M.C. Full-scale partial nitritation/anammox experiences-an application survey. Water Res. 2014, 55, 292–303. [Google Scholar] [CrossRef] [PubMed]
  6. Kumar, M.; Lin, J.G. Co-existence of anammox and denitrification for simultaneous nitrogen and carbon removal-strategies and issues. J. Hazard. Mater. 2010, 178, 1–9. [Google Scholar] [CrossRef]
  7. Godwin, J.; Miller, M.W.; Klaus, S.; Regmi, P.; Wett, B.; Murthy, S.; Bott, C.B. Impact of limited organic carbon addition on nitrogen removal in a mainstream polishing anammox moving bed biofilm reactor. Water Environ. Fed. 2015, 1960–1978. [Google Scholar] [CrossRef]
  8. Lackner, S.; Horn, H. Comparing the performance and operation stability of an SBR and MBBR for single-stage nitritation–anammox treating wastewater with high organic load. Environ. Technol. 2013, 34, 1319–1328. [Google Scholar] [CrossRef]
  9. Jenni, S.; Vlaeminck, S.E.; Morgenroth, E.; Udert, K.M. Successful application of nitritation/anammox to wastewater with elevated organic carbon to ammonium ratios. Water Res. 2014, 49, 316–326. [Google Scholar] [CrossRef]
  10. Han, M.; Clippeleir, H.; Al-omari, A.; Wett, B.; Vlaeminck, S.E.; Bott, C.; Murthy, S. Impact of carbon to nitrogen ratio and aeration regime on mainstream deammonification. Water Sci. Technol. 2016, 74, 375–384. [Google Scholar] [CrossRef] [Green Version]
  11. Zhang, X.; Zhang, H.; Ye, C.; Wei, M.; Du, J. Effect of COD/N ratio on nitrogen removal and microbial communities of CANON process in membrane bioreactors. Bioresour. Technol. 2015, 189, 302–308. [Google Scholar] [CrossRef] [PubMed]
  12. Yang, Y.; Li, Y.; Gu, Z.; Lu, F.; Xia, S.; Hermanowicz, S. Quick start-up and stable operation of a one-stage deammonification reactor with a low quantity of AOB and ANAMMOX biomass. Sci. Total Environ. 2019, 654, 933–941. [Google Scholar] [CrossRef] [PubMed]
  13. Van der Star, W.R.; Abma, W.R.; Blommers, D.; Mulder, J.W.; Tokutomi, T.; Strous, M.; Picioreanu, C.; Loosdrecht, M.C. Startup of reactors for anoxic ammonium oxidation: Experiences from the first full-scale anammox reactor in Rotterdam. Water Res. 2007, 41, 4149–4163. [Google Scholar] [CrossRef] [PubMed]
  14. Lan, C.; Kumar, M.; Wang, C.; Lin, J. Development of simultaneous partial nitrification, anammox and denitrification (SNAD) process in a sequential batch reactor. Bioresour. Technol. 2011, 102, 5514–5519. [Google Scholar] [CrossRef] [PubMed]
  15. Daverey, A.; Chen, Y.C.; Dutta, K.; Huang, Y.T.; Lin, J.G. Start-up of simultaneous partial nitrification, anammox and denitrification (SNAD) process in sequencing batch biofilm reactor using novel biomass carriers. Bioresour. Technol. 2015, 190, 480–486. [Google Scholar] [CrossRef]
  16. Liu, T.; Ma, B.; Chen, X.; Ni, B.J.; Peng, Y.; Guo, J. Evaluation of mainstream nitrogen removal by simultaneous partial nitrification, anammox and denitrification (SNAD) process in a granule-based reactor. Chem. Eng. J. 2017, 327, 973–981. [Google Scholar] [CrossRef]
  17. Regmi, P.; Miller, M.W.; Holgate, B.; Bunce, R.; Park, H.; Chandran, K.; Wett, B.; Murthy, S.; Bott, C. Control of aeration, aerobic SRT and COD input for mainstream nitritation/denitritation. Water Res. 2014, 57, 162–171. [Google Scholar] [CrossRef]
  18. Meerburg, F.A.; Boon, N.; Van Winckel, T.; Vercamer, J.A.; Nopens, I.; Vlaeminck, S.E. Toward energy-neutral wastewater treatment: A high-rate contact stabilization process to maximally recover sewage organics. Bioresour. Technol. 2015, 179, 373–381. [Google Scholar] [CrossRef]
  19. Joss, A.; Salzgeber, D.; Eugster, J.; König, R.; Rottermann, K.; Burger, S.; Fabijan, P.; Leumann, S.; Mohn, J.; Siegrist, H. Full-scale nitrogen removal from digester liquid with partial nitritation and anammox in one SBR. Environ. Sci. Technol. 2009, 43, 5301–5306. [Google Scholar] [CrossRef]
  20. Żubrowska Sudol, M.; Yang, J.; Trela, J.; Plaza, E. Evaluation of deammonification process performance at different aeration strategies. Water Sci. Technol. 2011, 63, 1168–1176. [Google Scholar] [CrossRef]
  21. Dapena Mora, A.; Arrojo, B.; Campos, J.L.; Mosquera Corral, A.; Méndez, R. Improvement of the settling properties of Anammox sludge in an SBR. J. Chem. Technol. Biotechnol. 2004, 79, 1417–1420. [Google Scholar] [CrossRef]
  22. Parks, D.H.; Beiko, R.G. Identifying biologically relevant differences between metagenomic communities. Bioinformatics 2010, 26, 715–721. [Google Scholar] [CrossRef] [PubMed] [Green Version]
  23. Xu, X.; Qiu, L.; Wang, C.; Yang, F. Achieving mainstream nitrogen and phosphorus removal through Simultaneous partial Nitrification, Anammox, Denitrification, and Denitrifying Phosphorus Removal (SNADPR) process in a single-tank integrative reactor. Bioresour. Technol. 2019, 284, 80–89. [Google Scholar] [CrossRef] [PubMed]
  24. Guven, H.; Ozgun, H.; Ersahin, M.E.; Dereli, R.K.; Sinop, I.; Ozturk, I. High-rate activated sludge processes for municipal wastewater treatment: The effect of food waste addition and hydraulic limits of the system. Environ. Sci. Pollut. Res. 2019, 26, 1770–1780. [Google Scholar] [CrossRef] [PubMed]
  25. Kinyua, M.N.; Elliott, M.; Wett, B.; Murthy, S.; Chandran, K.; Bott, C.B. The role of extracellular polymeric substances on carbon capture in a high rate activated sludge A-stage system. Chem. Eng. J. 2017, 322, 428–434. [Google Scholar] [CrossRef]
  26. Trzciński, A.P.; Wang, C.; Zhang, D.; Ang, W.S.; Lin, L.L.; Niwa, T.; Fukuzaki, Y.; Ng, W.J. Performance of A-stage process treating combined municipal-industrial wastewater. Water Sci. Technol. 2017, 75, 228–238. [Google Scholar] [CrossRef]
  27. Ayoub, M.; Afify, H.; Abdelfattah, A. Chemically enhanced primary treatment of sewage using the recovered alum from water treatment sludge in a model of hydraulic clari-flocculator. J. Water Process Eng. 2017, 19, 133–138. [Google Scholar] [CrossRef]
  28. Miao, Y.; Zhang, L.; Yang, Y.; Peng, Y.; Li, B.; Wang, S.; Zhang, Q. Start-up of single-stage partial nitrification-anammox process treating low-strength swage and its restoration from nitrate accumulation. Bioresour. Technol. 2016, 218, 771–779. [Google Scholar] [CrossRef]
  29. Wang, G.; Xu, X.; Gong, Z.; Gao, F.; Yang, F.; Zhang, H. Study of simultaneous partial nitrification, ANAMMOX and denitrification (SNAD) process in an intermittent aeration membrane bioreactor. Process Biochem. 2016, 51, 632–641. [Google Scholar] [CrossRef]
  30. Wang, W.; Wang, Y.; Wang, X.; Zhang, Y.; Yan, Y. Dissolved oxygen microelectrode measurements to develop a more sophisticated intermittent aeration regime control strategy for biofilm-based CANON systems. Chem. Eng. J. 2019, 365, 165–174. [Google Scholar] [CrossRef]
  31. Miao, Y.; Peng, Y.; Zhang, L.; Li, B.; Li, X.; Wu, L.; Wang, S. Partial nitrification-anammox (PNA) treating sewage with intermittent aeration mode: Effect of influent C/N ratios. Chem. Eng. J. 2018, 334, 664–672. [Google Scholar] [CrossRef]
  32. Zhao, J.; Zuo, J.; Lin, J.; Li, P. The performance of a combined nitritation–anammox reactor treating anaerobic digestion supernatant under various C/N ratios. J. Environ. Sci. 2015, 30, 207–214. [Google Scholar] [CrossRef] [PubMed]
  33. Chen, H.; Liu, S.; Yang, F.; Xue, Y.; Wang, T. The development of simultaneous partial nitrification, ANAMMOX and denitrification (SNAD) process in a single reactor for nitrogen removal. Bioresour. Technol. 2009, 100, 1548–1554. [Google Scholar] [CrossRef] [PubMed]
  34. Bi, Z.; Takekawa, M.; Park, G.; Soda, S.; Zhou, J.; Qjao, S.; Ike, M. Effects of the C/N ratio and bacterial populations on nitrogen removal in the simultaneous anammox and heterotrophic denitrification process: Mathematic modeling and batch experiments. Chem. Eng. J. 2015, 280, 606–613. [Google Scholar] [CrossRef]
  35. De Clippeleir, H.; Vlaeminck, S.E.; De Wilde, F.; Daeninck, K.; Mosquera, M.; Boeckx, P.; Verstraete, W.; Boon, N. One-stage partial nitritation/anammox at 15 °C on pretreated sewage: fea1sibility demonstration at lab-scale. Appl. Microbiol. Biotechnol. 2013, 97, 10199–10210. [Google Scholar] [CrossRef]
  36. Jia, L.; Guo, J.S.; Fang, F.; Chen, Y.P.; Zhang, Q. Effect of organic carbon on nitrogen conversion and microbial communities in the completely autotrophic nitrogen removal process. Environ. Technol. 2012, 33, 1141–1149. [Google Scholar] [CrossRef]
Figure 1. Percent abundances of the quantitatively important (percentage ≥0.7% of the total bacterial community) bacterial phyla in the initial biomass (orange) and biomass after 90 days of continuous carbon addition (blue) (A). The graph (B) obtained with the STAMP software (below), shows the differences between the proportions of sequences in each sample with a confidence interval of 95%.
Water 11 02270 g001
Figure 2. C/N ratio, COD (chemical oxygen demand) and TN (total nitrogen) removal efficiencies (A) AUR (ammonium utilization ratio) and NPR (nitrate production rate) (B) values in each phase of the 1st series.
Water 11 02270 g002
Figure 3. C/N ratio, COD (chemical oxygen demand) and TN (total nitrogen) removal efficiencies (A) AUR (ammonium utilization ratio) and NPR (nitrate production rate) (B) values in each phase of the 2nd series.
Water 11 02270 g003
Figure 4. Key microbial groups involved in nitrogen metabolism and postulated nitrogen removal mechanisms in the biomass before (A) and after adaptation to the carbon source (B). AOB—ammonium oxidizing bacteria; AnAOB—anaerobic ammonium oxidizing bacteria; NOB—nitrite oxidizing bacteria; HET—heterotrophic denitrifiers.
Water 11 02270 g004
Figure 5. Influence of C/N ratios and aer/non-aer times on TN removal efficiency and COD removal efficiency in both series.
Water 11 02270 g005
Table 1. Operational parameters, C/N ratios and aeration strategies during following series of deammonification experiment.
ParametersUnit1st Series2nd Series
Phase 1Phase 2Phase 3Phase 4Phase 5Phase 1Phase 2Phase 3Phase 4Phase 5
Duration of the phasedays455132716233418
C/N ratio-1212311.522.53
Intermittent aeration modes m i n m i n 3/93/63/123/93/93/123/63/153/63/3
DO set point g   O 2   m 3 0.7
Temperature°C20
pH7.3–7.9
NH4-N con. in the synthetic reject water g   N   m 3 60–70
NH4-N load in the reactor g   N m 3 · d 27–32
Initial NH4-N con. in the reactor g   N   m 3 27–35
Table 2. Summary of the 16S rRNA gene Illumina NGS analysis.
Sample NameDeammonC_INIDeammonC_END
Sampling day190
Total number of the reads186,479168,484
Total number of the reads after QC126,510113,998
Avg. length444496
Number of the OTUs per 1000 reads125188
Table 3. Phylogenetic affiliation and percent abundances of the dominant representatives of basic physiological bacterial groups in the initial (INC) and biomass after end of the experiment with carbon dosage (END).
Physiological Function Affiliation to the Specific Taxonomic LevelAbundance [%]
DeammonC_INIDeammonC_END
AOBProteobacteria > Betaproteobacteria > Nitrosomonadales > Nitrosomonas2.00.8
NOBNitrospirae > Nitrospira > Nitrospirales > Nitrospiraceae > Nitrospira0.70.2
AnammoxPlanctomycetes > Planctomycetacia > Planctomycetales > unclassified Planctomycetales > Candidatus Brocadia8.11.8
HET 1Actinobacteria7.5Total HET
57.0
7.8Total HET
75.3
Acidobacteria4.22.0
Chlorobi > Ignavibacteria > Ignavibacteriales7.011.0
Chloroflexi > Anaerolineae25.026.0
Chloroflexi > Thermomicrobiales4.05.0
Firmicutes > Bacilli > Bacillales > Bacillaceae > Bacillus2.113.0
Firmicutes > Clostridia > Clostridiales0.41.2
Patescibacteria0.83.0
Proteobacteria > Gammaproteobacteria > Pseudomonadales1.70.1
Proteobacteria > Gammaproteobacteria > Burkholderiales2.02.0
Proteobacteria > Alphaproteobacteria > Rhizobiales3.04.0
1 Predominant heterotrophic metabolism.
Table 4. The comparison of the obtained TN removal efficiency and NH4-N removal efficiency at different C/N ratios in other studies.
Lp.C/NTemperature [°C]DO [mg/L]Removal Efficiency [%]RemarksReference
NH4-NTN
10.75350.4–0.65262In this SNAD process is the bioreactor bioreactor biological reactor (NRBC). On day 27. the dose of COD was lowered with 150 mg/L per 100 mg/L.[31]
0.57970
21.1300.8–1.25438.9The C/N ratios in SBR were gradually increased. Above C/N of 2.5, the efficiency of the process decreased.[32]
1,577.363.1
279.973.5
2,583.477.3
>2,5failure
31,132Continuous aeration DO = 0.27 (P1)>7058.8The process was carried out in SBR using real wastewater. Alternating aeration was used as a way to reduce the production of nitrates. In phase IV, SRT from 50d to 80d was increased.[28]
Continuous aeration DO = 0.17 (P2)>6014.7
Intermittent aeration DO = 0.5 (P3)>5056.8
Intermittent aeration DO = 0.5 (P4)>70>50
40.01321–1.59577.88Raw sewage containing mainly refractory materials. The process was carried out in SBR. PN/A was used to process the supernatant from anaerobic digestion.[33]
0.13-83.69
0.22-85.1
0.15-82.59
0.22-68.62
0.35-88.85
5130<0.5 -61The SAD process was carried out in two series with different XH/XAN ratios. The values given refer to the series A with the ratio XH/XAN = 0.4.[34]
1.8 -99.5
60.125–300.1–1 -6.8Process in a granule-based reactor. The effect of C/N ratio. DO value and granule size on the SNAD process was investigated.[16]
1 -<70
3 -73.6
70.5152.9 -36The OLAND process at RBC has been used. The research also concerned the influence of temperature. which was gradually adjusted from 29° to 15°.[35]
12.5 -45
1.52.4 -23
23 -28
23.6 -23
23.2 -42
81.2 - -9984–95The process was conducted in two identical SBBRs.[36]
9<0.5300.07 -80The laboratory scale reactor was started with the suspended biomass from the nitriding/anammox reactor to process the supernatant from the sludge digestion chamber. SRT was adjusted to improve bacterial activity.[9]
1.4 ->95
101st series120-10079The TN and NH4-N removal efficiency values given are average values. Apart from the C/N ratio, their value is affected by changes in the aeration method in individual phases.[our study]
27635.9
178.868.7
299.983.6
385.771.3
2nd series120-98.667.4
1.597.876.8
299.984
2.599.986.7
35139

