Article

Analysis of Raindrop Size Distribution Characteristics in Permafrost Regions of the Qinghai–Tibet Plateau Based on New Quality Control Scheme

1
Cryosphere Research Station on the Qinghai-Tibetan Plateau, State Key Laboratory of Cryospheric Sciences, Northwest Institute of Eco-Environment and Resources, Chinese Academy of Sciences, Lanzhou 730000, China
2
University of Chinese Academy of Sciences, Beijing 100049, China
3
Nanjing University of Information Science & Technology, Nanjing 210044, China
4
National Hydrology Research Center, Environment and Climate Change Canada, Saskatoon, SK M4Y1M7, Canada
5
School of Geography Science, Qinghai Normal University, Xining 810008, China
*
Author to whom correspondence should be addressed.
Water 2019, 11(11), 2265; https://doi.org/10.3390/w11112265
Submission received: 26 September 2019 / Revised: 16 October 2019 / Accepted: 25 October 2019 / Published: 28 October 2019
(This article belongs to the Section Hydrology)

Abstract

:
Raindrop size distribution (DSD) can reflect the fundamental microphysics of precipitation and provide an accurate estimation of its amount and characteristics; however, there are few observations and investigations of DSD in cold, mountainous regions. We used the second-generation particle size and velocity disdrometer Parsivel2 to establish a quality control scheme for raindrop spectral data obtained for the Qinghai–Tibet Plateau in 2015. This scheme included the elimination of particles in the lowest two size classes, particles >10 mm in diameter and rain rates <0.01 mm · h−1. We analyzed the DSD characteristics for different types of precipitation and rain rates in both permafrost regions and regions with seasonally frozen ground. The precipitation in the permafrost regions during the summer were mainly solid with a large particle size and slow fall velocity, whereas the precipitation in the regions with seasonally frozen ground were mainly liquid. The DSD of snow had a broader drop spectrum, the largest particle size, the slowest fall velocity, and the largest number of particles, followed by hail. Rain and sleet shared similar DSD characteristics, with a smaller particle size, slower velocity, and smaller number of particles. The particle concentration for different classes of rain rate decreased with an increase in particle size and decreased gradually with an increase in rain rate. Precipitation with a rain rate >2 mm · h−1 was the main contributor to the annual precipitation. The dewpoint thresholds for snow and rain in permafrost regions were 0 and 1.5 °C, respectively. The dewpoint range 0–1.5 °C was characterized by mixed precipitation with a large proportion of hail. This study provides valuable DSD information on the Qinghai–Tibet Plateau and can be used as an important reference for the quality control of raindrop spectral data in regions dominated by solid precipitation.

1. Introduction

Accurate observation of precipitation is essential for research and applications of regional to global climate, hydrology and ecology, calibration of remote sensing products [1,2]. However, observational data obtained by traditional precipitation gauges have a negative bias as a result of wind-induced undercatch, losses from wetting and evaporation, and the difficulties in measuring trace amounts of precipitation; the biases for solid precipitation may reach >60% in windy and cold conditions [2,3,4,5,6].
The climate in the permafrost regions of the Qinghai–Tibet Plateau is extremely cold and windy, with snowfall exceeding 40% of the annual precipitation and daily mean wind speeds >4 m · s−1 [7,8,9,10,11]. The uncertainties in traditional methods of measuring precipitation are particularly prominent under such climatic conditions and the measured precipitation is often much lower than the actual precipitation [4,5,7]. Meteorological stations are sparse and unevenly distributed over the Qinghai–Tibet Plateau with only four national meteorological stations in the permafrost regions, where the average altitude exceeds 4000 m, despite these areas accounting for more than half of the total area of the plateau [12]. In addition, the operation period of these stations are both short and inconsistent. These factors limit reliability of precipitation data over the Qinghai–Tibet Plateau [6]. Precipitation and snow cover are the two most important factors affecting thermal condition of permafrost after temperature; intensity and phase of precipitation have different effects on the thermal status of the surface, they also influence he development of, and changes in, the permafrost layer [13,14].
Raindrop size distribution (DSD) refers to the distribution of the number of raindrops per unit volume for a particular raindrop size. DSD, the basic feature of precipitation microphysics, varies widely with time, season, vertical height, and geographical region [15,16,17,18]. The applications of DSD range from the quantitative estimation of precipitation to the simulation of the processes and characteristics of precipitation [19,20,21]. The Parsivel instrument is a non-contact optical laser disdrometer used to measure the number and size of raindrops [22,23]. It is not limited by the shortcomings of traditional rain gages during measurements and provides detailed microphysical information about precipitation, including the distribution of raindrop size and fall velocity, precipitation type, rain rate, radar reflectivity, and visibility [24,25,26,27]. The Parsivel instrument provides a new method for obtaining more detailed and accurate precipitation data and may help to overcome the current deficiency of observations on precipitation microphysics over the Qinghai–Tibet Plateau. Accurate precipitation data in this region can improve our understanding of the characteristics of precipitation in cold regions, establish a parameterized scheme for diagnosing rainfall patterns, provide more reliable reference values for remote sensing products used to estimate solid precipitation, and investigate the influence of precipitation mechanisms on the degradation of permafrost [7,18,28].
Research on DSD has mainly focused on tropical and temperate coastal areas where rain is the dominant, or only, form of precipitation [19,29,30,31,32,33,34,35]. There have been few observations of DSD in cold and mountainous regions with complex precipitation mechanisms, especially over the Qinghai–Tibet Plateau. There have been a few studies of DSD in the southeastern Qinghai–Tibet Plateau, which has seasonally frozen ground, in which the empirical threshold method was used to the filter data [17,20,33]. However, the application of the empirical threshold method on the Qinghai–Tibet Plateau has yet to be verified. Moreover, the precipitation in the permafrost region of the Qinghai–Tibet Plateau is mainly solid and is accompanied by frequent instantaneous and short-term trace amounts of precipitation [7], which is clearly different from the characteristics of precipitation in the southeastern Qinghai–Tibet Plateau. It is therefore important to investigate the characteristics of the DSD in permafrost regions.
Using statistical and comparative analysis, we established a quality control scheme for raindrop spectral data suitable for the permafrost regions of the Qinghai–Tibet Plateau. Based on this data control scheme, we investigated the characteristics of the DSD and precipitation in permafrost regions. The results of this study provide a reference for filtering data on snow spectra and a basis for the parameterization of land surface processes and the input of parameters to hydroclimatic models in permafrost regions.

2. Sites, Data, and Methods
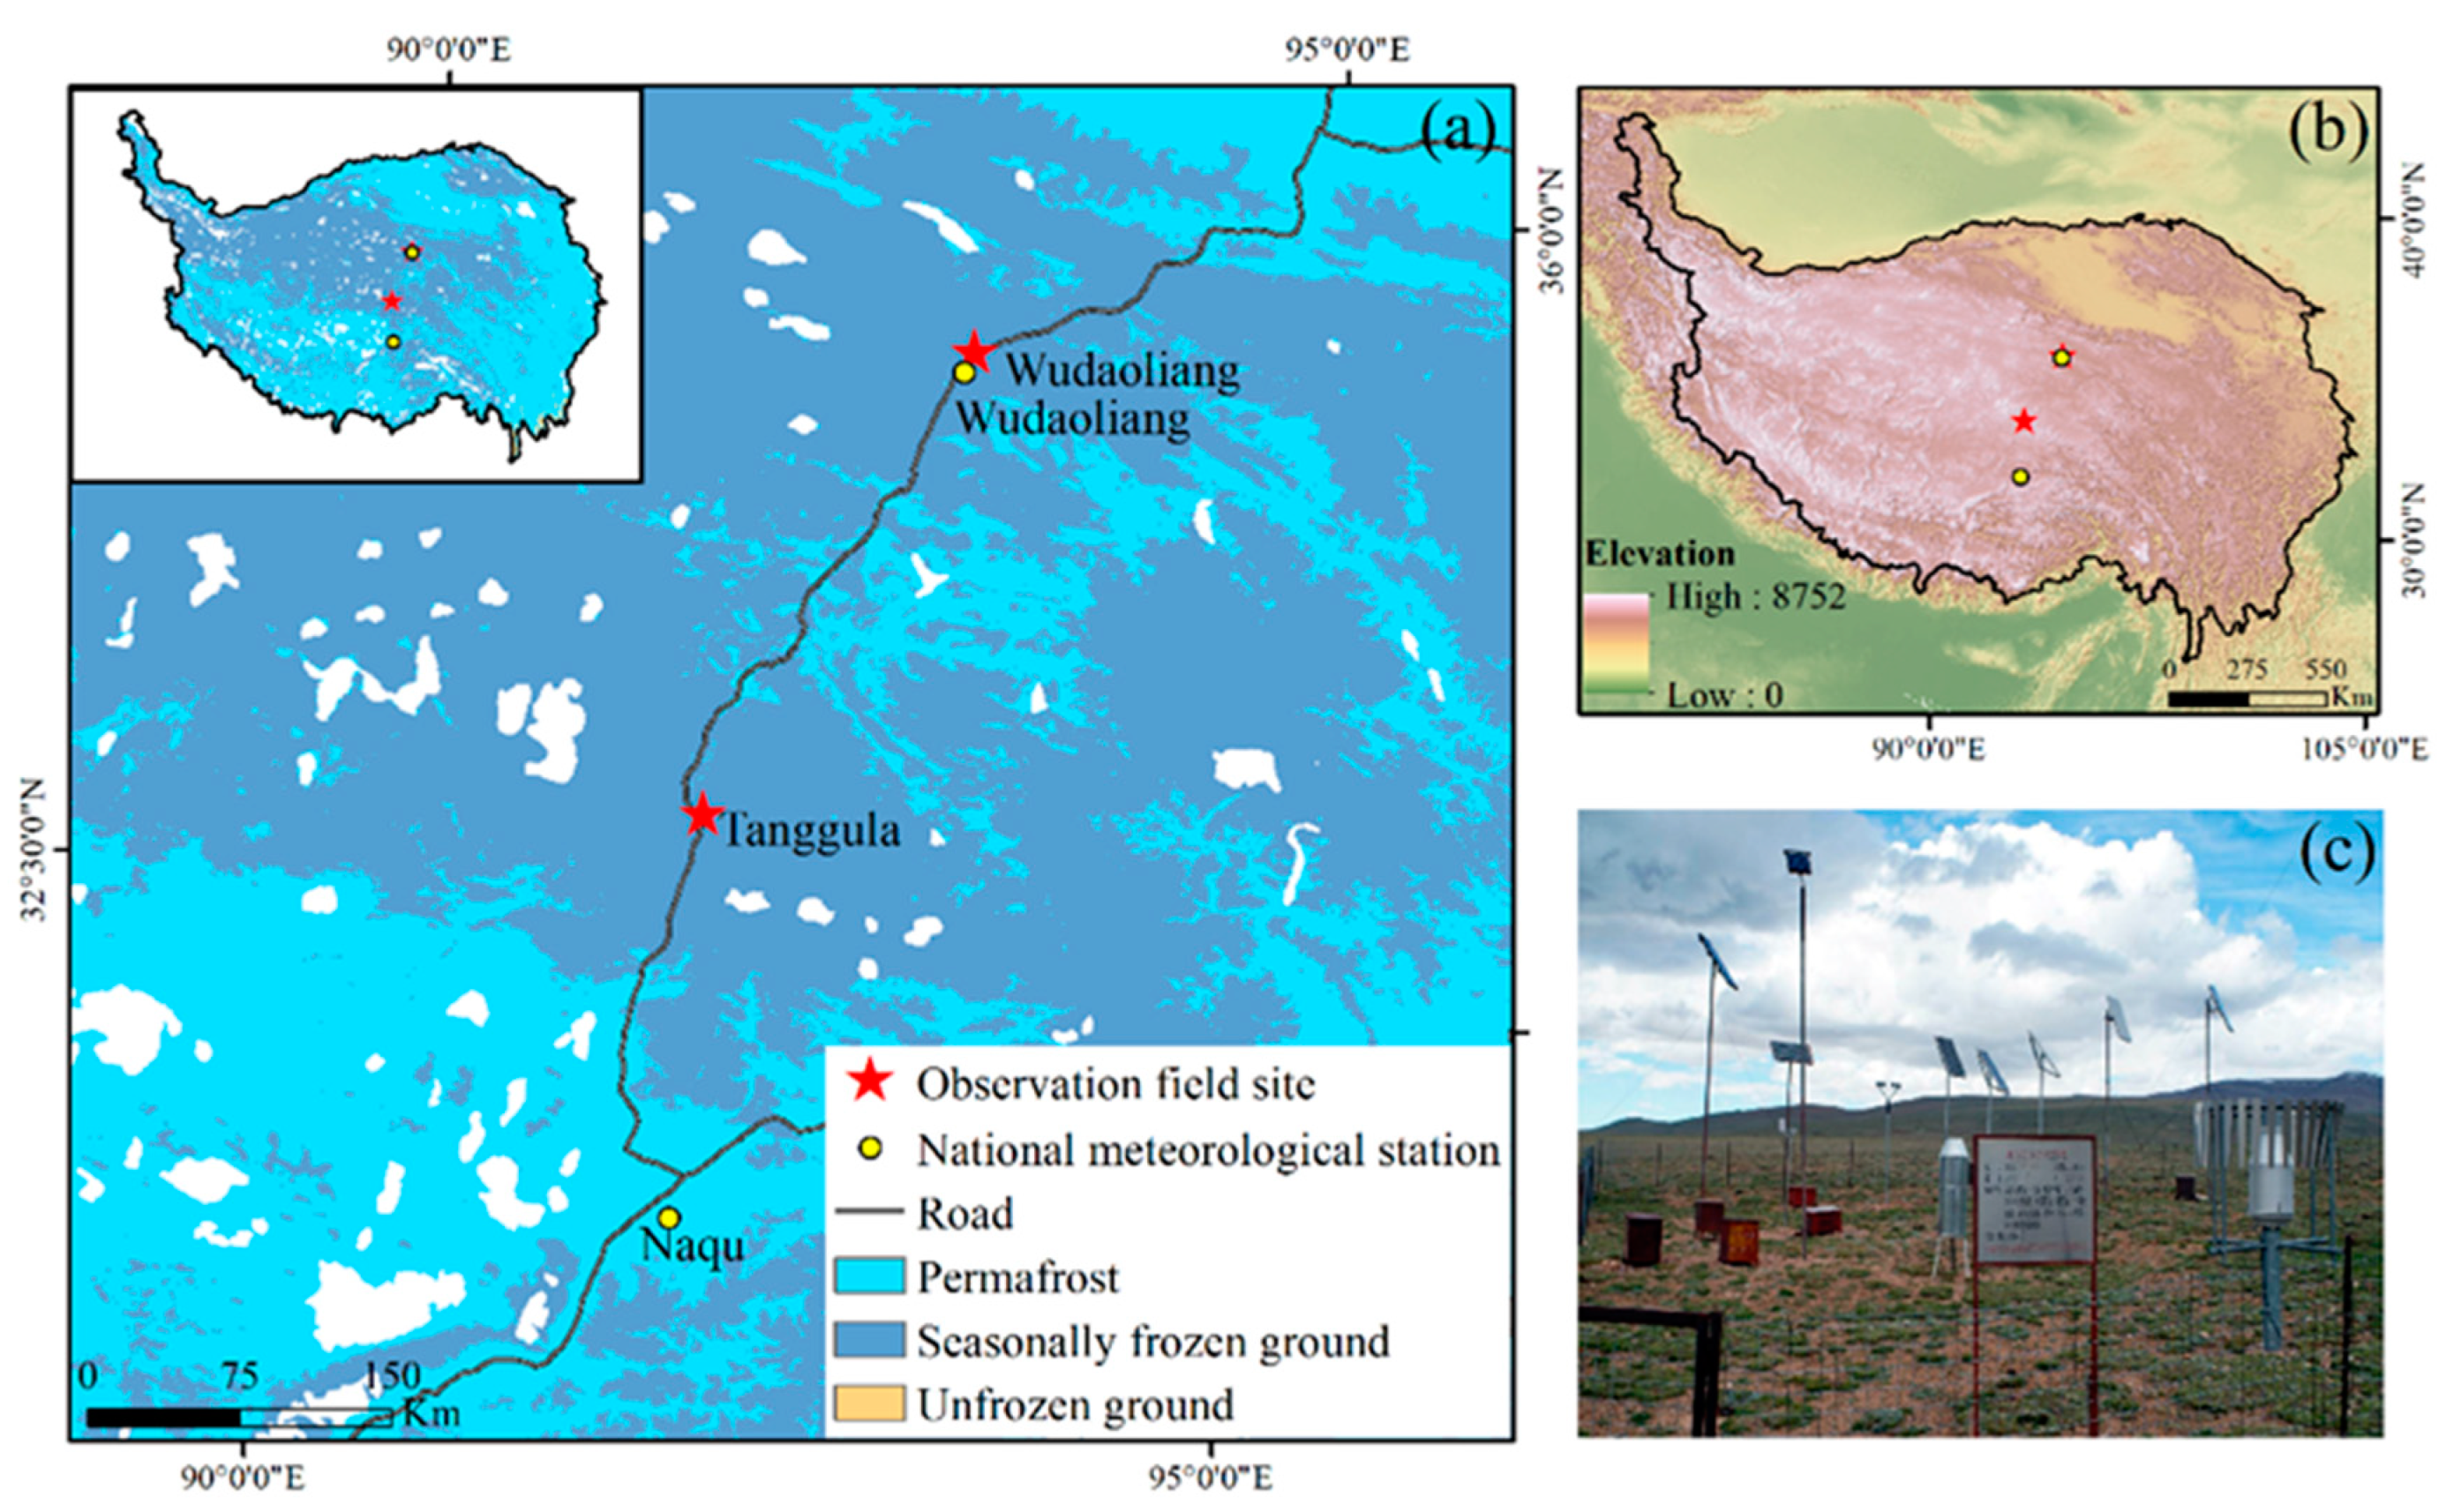
2.1. Study Sites

The two main field observation sites were located in Tanggula and Wudaoliang in the hinterland of the Qinghai–Tibet Plateau (Figure 1), both of which belong to the permafrost region (permafrost is the ground that remains at negative temperature conditions for two or more years). Both sites have established meteorological and raindrop spectrum observation systems. Tanggula is located on a gentle slope on the southwestern Tanggula Pass at an altitude of 5100 m and has an annual mean temperature of −4.9 °C. Wudaoliang is located near a section of the Qinghai–Tibet Highway at an altitude of 4783 m and has an annual mean temperature of −5.1 °C [7]. Naqu, an observation site at an altitude of 4500 m with an annual mean temperature of −0.3 °C in a region with seasonally frozen ground (seasonally frozen ground refers to the ground that freezes and thaws annually), was selected for comparison [12,17].

2.2. Instruments and Measurements

A second–generation Parsivel2 laser optical disdrometer manufactured by OTT Hydromet GmbH (Kempten, Germany) was used in this study. The disdrometers consist of a laser sensor that emits a horizontal laser beam and a closed transmitter and receiver. When a particle passes through the sampling space containing the laser beam, the width and crossing time are automatically recorded and the size and velocity of the precipitation particle are calculated [22,25]. The laser beam was 780 nm, and the sampling space was 1 mm thick with an area of 180 × 30 mm2 [23]. This instrument measures particles with diameters of 0–25 mm and velocities of 0–22.4 m · s−1 and divides these two physical quantities into 32 non-equidistant classes. The number of particles measured each minute is recorded as a 32 × 32 matrix of size and velocity and the number of particles in each class is counted. The instrument then subdivides the precipitation into eight types according to these physical quantities [23,36]. OTT Parsivel2 has reduced the errors caused by spattering and wind relative to the first–generation model and improved the smoothing of the laser beam, the measurement of particle size and velocity, and the calculation of raindrop deformation [23,27].
We used OTT Parsivel2 to measure the raindrop size and fall velocity, particle number, precipitation type, and rain intensity with an interval time of 60 s, and also used precipitation data recorded with a Geonor T–200B precipitation gauge (Oslo, Norwaw), wind speed, air temperature, and relative humidity at 2 m high at a sampling interval of 30 min in Tanggula and Wudaoliang. In addition, the daily precipitation data by Chinese standard rain gauge (Beijing, China, hereinafter referred to as CSRG) from Wudaoliang national meteorological station and 60-s raindrop spectrum data from Naqu national meteorological station were also used. The Wudaoliang national station is 1.7 km away from our filed observation sites (Figure 1). See Table 1 for details of measurement contents and measuring instruments; the observed data were stored by the Campbell Scientific CR3000 data–logger (Logan, UT., USA). Relevant data of the national meteorological station were obtained from http://data.cma.cn/.
The observation time series of the sites in the study were inconsistent as a result of uncontrollable factors such as power failures, extreme weather events, man-made damage, and interference from wild animals (Table 2). The measurement sequence of the Tanggula site was from January to December 2015. OTT Parsivel2 monitored the samples for 6834 min with precipitation of 439 mm, and the T–200B rain gauge obtained 30-min samples for 1068 with precipitation of 266.6 mm. The measurement sequence of the Wudaoliang site was from January to September 2015. OTT Parsivel2 monitored the samples for 7281 min with precipitation of 440 mm, and CSRG rain gauge of national meteorological station observed precipitation of 342.5 mm. The measurement sequence of the Naqu national station was from 15 July 2015 to 30 August 2015, and OTT Parsivel2 monitored the samples for 813 min with precipitation of 20.3 mm.

2.3. Raindrop Size Distribution

N ( D i ) = j = 1 32 n i j A i · Δ t · V j · Δ D i
where N(Di) (mm−1 · m−3) is the number concentration of raindrops per unit volume per unit size interval for a raindrop diameter Di (mm), nij is the number of raindrops within size class i and velocity class j, Vj (m · s−1) is the fall speed for velocity class j, Ai (m2) is the effective sampling area for the ith size class and ∆t (s) is the sampling time (set to 60 s in this study). The effective sampling area Ai is calculated as follows:
A i = 180 × ( 30 D i 2 )
Given N(Di), the rain rate R (mm · h−1) is calculated as follows:
R = 6 π × 10 4 i = 1 32 j = 1 32 V j D i 3 N ( D i ) Δ D i
The empirical formula for the relationship between the velocity (m · s−1) and the particle size (mm) is given by Atlas et al. [37]:
V ( D i ) = 9.65 10.3 exp ( 0.6 D i )
The dew point temperature is an important variable and closely corresponds to the type of precipitation, which is calculated from the air temperature and relative humidity based on the Magnus formula:
T d = c r / ( b r )
r = ln ( R H / 100 ) + b T / ( c + t )
where T is the air temperature (°C), RH is the relative humidity (%), b = 17.67, and c = 243.58 °C [38].

2.4. Quality Control of Data

Comparative observations from several different optical disdrometers show that the Parsivel instrument gives better results when observing snow particles and snowfall [23,27,39,40,41], but overestimates the number of large particles and underestimates their fall velocity (error < 20%) [27,40]. It is therefore necessary to control the quality of data for the raindrop spectra. At present, the most widely used quality control scheme is to set a threshold range according to the empirical power law relationship between the fall velocity (V) and raindrop size (D) [37] and then to eliminate the particles falling outside this threshold (referred to here as the empirical threshold method). However, there is no clear reference and basis for setting this threshold and the range chosen is very different in different studies (generally retaining 25–60% of the empirical formula) [17,19,29,42,43,44]. The empirical V–D relation given by Atlas et al. [37] refers to the basic theory of the final fall velocity of raindrops in still air proposed by Gunn and Kinzer [45] and combines rain and snow measurements obtained using Doppler radar. However, the Doppler spectrum does not determine the size distribution of snow and the power laws are only useful approximations over a limited range of the rain rate [37,43]. Therefore, the empirical V–D relation only objectively reflects the changes in particle velocity with size for liquid particles and inevitably eliminates much of the information on solid particles.
Therefore, in view of the above situation analysis, we have adopted the following quality control scheme for the raindrop spectrum data based on the DSD characteristics in permafrost regions and relevant studies on precipitation microphysical processes [17,19,30,37,39,40,41,46].
(1) Eliminating data below the first two size classes
The lowest two size classes (mean diameters of 0.062 and 0.187 mm) are not usually used because the recovery time of the laser system and noise distortion limit the accurate measurement of smaller drop sizes, especially particles with diameter <0.2 mm [17,22,31,43,47]. There was no data below these size classes in this study and therefore the minimum diameter of the raindrops in the sample was 0.312 mm.
(2) Eliminating particles with diameters >10 mm
In general, the diameter of raindrops is usually 0.5–6 mm, whereas drizzle drops are smaller at 0.2–0.5 mm. Snow is solid precipitation with different forms of ice crystals; groups of ice crystals form snowflakes in the form of six cones, needles, or multiple combinations. The diameter of snowflakes is usually 1–3 mm, although the number of larger snowflakes may increase at higher temperatures and lower wind speeds [48,49]. Previous observations have shown that the diameter of raindrops and snowflakes rarely reach or exceed 6 mm due to break-up when falling as rain or snow [49,50]. Large particles in the observation records should therefore be eliminated before calculating the physical quantities because these are likely to be instrumental artifacts. The microphysical properties of raindrops were estimated based on their size and velocity and even a small number of large particles will affect the results of the calculation [39,43,46,51]. In a hurricane observation experiment at Galveston, Texas, USA, Friedrich et al. [43] found that the radar reflectivity calculated after removing particles >5 mm in diameter was closer to the real value. Jaffrain and Berne [51] suggested that raindrops >7 mm in diameter were unrealistic. Yuter et al. [39] observed that the distribution of snow decreased significantly and disappeared as the particle diameter approached 10 mm. The accuracy of two-dimensional video and laser particle methods in detecting raindrops >10 mm diameter has yet to be verified [22]. Based on this analysis and considering that precipitation over the Qinghai–Tibet Plateau was mostly solid, we conservatively limited the maximum particle size to 10 mm to minimize the calculation errors caused by large particles.
(3) Eliminating trace amounts of precipitation with a rain rate <0.01 mm · h−1
There were generally errors in the measurement of trace amounts of precipitation and drizzle [52], which were largely caused by instrument noise and the presence of atmospheric particles [30,53]. Slight rainfall with a velocity <0.03 mm h−1 hardly reached the ground [54,55]. Considering frequent trace and short-term precipitation in the Qinghai–Tibet Plateau, the minimum threshold of rain rate was set to 0.01 mm h−1, which was also the minimum threshold in other relevant studies.

3. Results

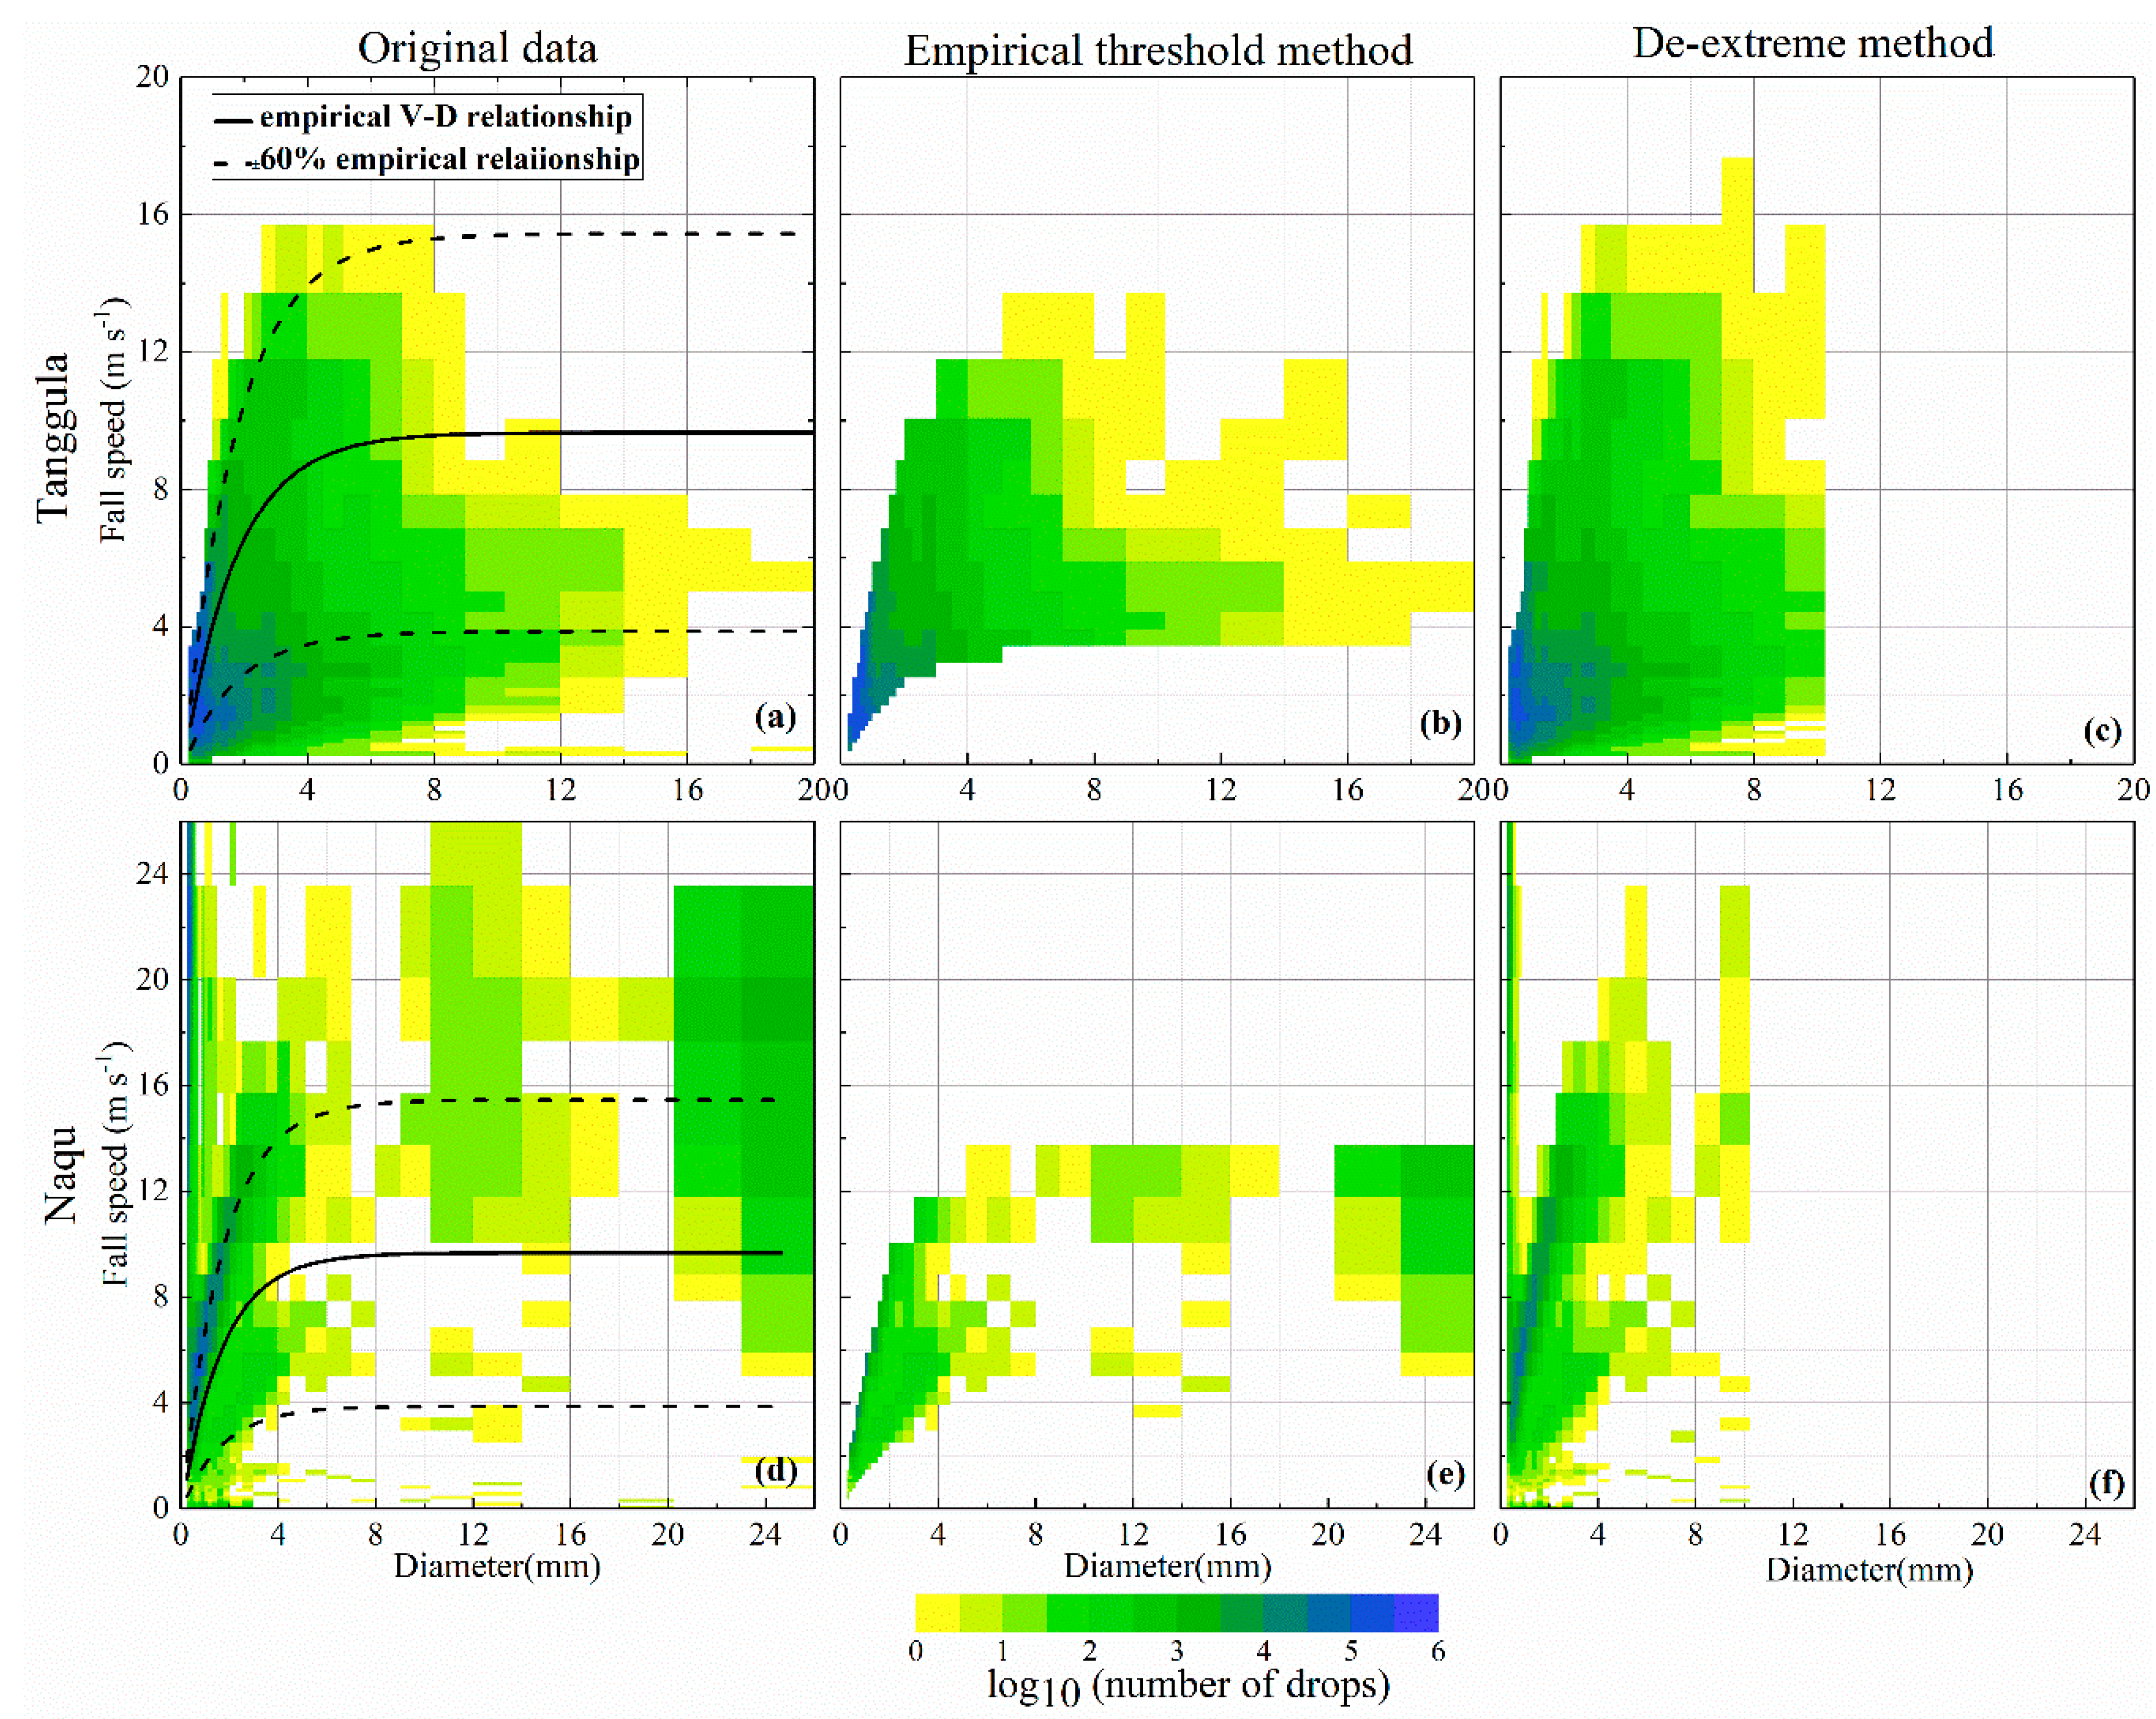
3.1. DSD Characteristics and Application of Data Control Schemes

After the establishment of the data quality control scheme (hereinafter referred to as the de-extreme method), we compared the original data from the DSD with the results obtained after the de-extreme method and the empirical threshold method. We analyzed the differences between the two data quality control schemes applied in different regions (permafrost regions and regions with seasonally frozen ground) and for different types of precipitation. The rationality of the de-extreme method was proved by comparing the measurement results obtained using the OTT Parsive2 instrument with those from other rain gauges and verifying the types of precipitation observed. We then analyzed the precipitation and DSD characteristics in the permafrost regions.
(1) Differences in DSD characteristics between permafrost regions and regions with seasonally frozen ground
The observation results from July to August 2015 showed that the DSD characteristics in summer were clearly different at the Tanggula and Naqu observation sites. The precipitation particles at Tanggula were larger with a lower fall velocity. Particles <4 mm dominated the precipitation events in this period and the raindrops were concentrated in the size range 0.3–1 mm with a velocity of 1 m · s−1 (Figure 2a). Precipitation particles at Naqu were generally smaller (0.3–2 mm) with a higher velocity (3–7 m · s−1) (Figure 2d).
The results of the quality control of the observational data in the two regions were clearly different using the empirical threshold and de-extreme methods. The summer precipitation in Tanggula was mainly solid and the relationship between particle size and velocity deviated from the V–D empirical formula of Atlas et al. [37]. The empirical threshold and de-extreme methods eliminated 50% and 5%, respectively, of the number of particles in Tanggula (Figure 2b,c). Summer precipitation in Naqu was mainly liquid and the relationship between particle size and velocity was closer to the V–D empirical formula than at Tanggula. The two data control schemes excluded 53% and 26%, respectively, of the number of particles (Figure 2e,f). The empirical threshold method removed a large number of low-velocity particles and smaller sized particles with a high velocity, whereas the de-extreme method retained more information on effective particles.
(2) DSD characteristics of different types of precipitation in permafrost regions
The precipitation particles at Tanggula in 2015 were mainly snow, followed by hail and rain particles. The precipitation was mainly composed of particles <4 mm. Snow, hail, rain, and sleet accounted for 86%, 10%, 3%, and 1%, respectively, of the annual precipitation (Figure 3a–d). The DSD of different types of precipitation had diverse characteristics and the application of the two data quality control schemes gave clearly different results for different types of precipitation. The rainfall mainly consisted of small particles with a high fall velocity and the raindrops were concentrated in the size range <1 mm and the velocity range 1–6 m · s−1 (Figure 3a). Compared to the empirical threshold method, the de-extreme data control methods retained larger sized particles with a slower velocity, especially particles in the size range 0.3–7 mm with a velocity <3 m · s−1 (Figure 3e,i). The number of such particles was relatively large at Tanggula. The two methods gave 17.9 and 13.3 mm, respectively, of rainfall (Figure 3e,i). The DSD of sleet was similar to that of rain, with a greater proportion of liquid particles. The total number of sleet particles was significantly reduced and the drops were mainly <1 mm with a velocity range of 2–6 m · s−1 (Figure 3b). The results of the two quality control schemes were similar for this type of particle (Figure 3f,j). The DSD of snow was mainly characterized by a large size, low velocity, and large number of particles and the relationship between particle size and velocity showed a large deviation from the V–D empirical formula of Atlas et al. [37]. Snow particles were highly concentrated in the size range <2 mm with a velocity <4 m · s−1, followed by the size range 2–4 mm and velocity range 1–4 m · s−1 (Figure 3c). The differences between the de-extreme and empirical threshold data control methods were most significant for snow and the filtered amounts of snowfall were 378.8 and 84.0 mm, respectively (Figure 3g,k). The empirical threshold method excluded most of the particle concentration intervals and all the sub-concentration intervals, but retained abnormally large particles >10 mm (Figure 3g). The DSD of hail was similar to that of snow, but with a smaller size and higher fall velocity (Figure 3d). Hail particles were mainly distributed in the size range 0.3–2 mm and velocity range 1–4 m · s−1 and the two quality control schemes resulted in little difference between the amounts of hail (Figure 3h,l).
In addition, in the 2015 precipitation events at Tanggula before data quality control was applied, the number of particles >10 mm in diameter accounted for 0.003% of the total and contributed about 20 mm of precipitation. These large particles were mainly recorded during snow and sleet precipitation when the corresponding temperature and relative humidity were higher (Figure 4). The number of large particles was the highest during snowfall, especially heavy and moderate snowfall events, which corresponded to the highest relative humidity (91%) and temperature (−2 to 0 °C). The number of large particles in sleet was lower than that in snowfall and corresponded to the highest temperature (2 °C).
(3) Measurement results of OTT Parsive2 compared with other rain gauges.
The amount of precipitation measured by the T-200B rain gauge at the Tanggula field observation site and the CSRG at Wudaoliang national meteorological station were used to verify the OTT Parsive2 data for the two regions.
Using the de-extreme method, the quality-controlled precipitation data obtained with the OTT Parsivel2 instrument was clearly lower than the original results and was closer to the values measured by the other rain gauges (Figure 5). The precipitation trends observed by the OTT Parsivel2 and the rain gauges were consistent, but the observed value of the OTT Parsivel2 was much higher than that of the rain gauges, with fluctuations and differences in individual months. The amount of precipitation at Tanggula in 2015 was recorded as 491, 439, and 267 mm, respectively, by the original output and quality-controlled results from the OTT Parsivel2 and the T-200B/CSRG rain gauge (Figure 5a), and the amount of precipitation at Wudaoliang from January to September 2015 was 506, 440, and 343 mm, respectively (Figure 5b), with the precipitation mainly concentrated in the period of April to September. The wind-induced undercatch of the T-200B/CSRG gauges accounted for 18% and 16% of the annual precipitation at Tanggula and Wudaoliang, respectively [6], but there was no such loss in the results from the OTT Parsivel2 instrument.
The OTT Parsivel2 instrument can accurately distinguish between different types of precipitation. We manually identified the different types of precipitation in 13 samples at Tanggula from July to August 2015. Figure 6 shows that the different types of precipitation observed by the OTT Parsivel2 were consistent with the manual identification and the instrument recorded gradual changes in the phase of precipitation in detail. Taking the precipitation event on 12 August 2015 as an example, the manual observation recorded sleet, whereas the OTT Parsivel2 instrument observed changes in the precipitation event from rain to sleet to hail to snow. An observation experiment in central Germany from October to November 2003 by Bloemink [56] also reported that a laser precipitation monitor clearly distinguished different types of precipitation, accurately identifying 99% of liquid and 93% of solid precipitation. Chen et al. [57] reported that the type of precipitation identified by the Parsivel instrument agreed with the results of manual identification when investigating the DSD of freezing rain in southern China in January 2008.
These results show that the data quality control scheme of the de-extreme method is more suitable for the permafrost regions of the Qinghai–Tibet Plateau, where it minimized the system errors while retaining more information of effective particles. The DSD in permafrost regions was characterized by solid precipitation, a broader spectrum, larger particles, and low fall velocities, which was clearly different from the characteristics of precipitation in regions with seasonally frozen ground. The DSD of different types of precipitation was also significantly different.

3.2. DSD Characteristics for Different Rainfall Rates

Figure 7a shows the accumulated particles at Tanggula in 2015 characterized by size and fall velocity. The drop spectrum was similar to that of the solid particles. The particles were concentrated in the size range <2 mm and the velocity range <4 m · s−1, accounting for 94% of the total number of particles. The pattern of DSD at Wudaoliang was similar to that at Tanggula (not shown) and the difference between the two sites was mainly reflected in the number of small- and medium-sized particles (Figure 7b). The number of particles of precipitation <0.8 mm at Tanggula was higher than that at Wudaoliang, whereas the number of particles in the size range 0.8–3 mm at Wudaoliang was higher than that at Tanggula. There was no clear difference in the number of particles >3 mm between the two sites.
The rain rate was divided into five classes (class 1, <0.1 mm · h−1; class 2, 0.1–1 mm · h−1; class 3, 1–2 mm · h−1; class 4, 2–5 mm · h−1; and class 5, ≥5 mm · h−1) to help understand the characteristics of the DSD under different precipitation mechanisms. The characteristics of precipitation (e.g., particle size, particle concentration, and rain rate) at Tanggula and Wudaoliang were very similar. The particle concentration of the rain rate at all levels decreased in stages with increasing particle size (Figure 8a,b). The decreasing trend was most significant in the size range 0.3–1 mm, most gentle in the size range 1–3 mm, relatively clear in the size range 3–5 mm, and relatively gentle for droplets >5 mm. The concentration of larger particles (especially particles >8 mm) clearly increased as the rain rate increased. The particle concentration corresponding to each level of rain rate decreased stepwise with the increase in the rain rate (Figure 8a,b). The particle concentration of class 2 was the largest, whereas the particle concentration of class 1 decreased rapidly to a minimum for particles >2 mm. The contribution of rain rate class to annual precipitation was inconsistent with the occurrence frequency (Figure 8c): The contribution of rain rate was class 4 > class 5 > class 2 > class 3 > class 1, whereas the occurrence frequency was class 2 > class 1 > class 3 > class 4 > class 5. The annual precipitation in permafrost regions of the Qinghai–Tibet Plateau was therefore mainly contributed by precipitation with a rain rate >2 mm · h−1, which accounted for >75% of the annual precipitation, whereas the frequency of such precipitation events only accounted for about 20%. The frequency of light precipitation and trace amounts of precipitation (classes 2 and 1) reached 80% and light precipitation was also one of the main contributions to the annual precipitation. Trace amounts of precipitation (class 1) have often been neglected in other observation experiments, but the influence of its high occurrence frequency and accumulation on environmental factors—especially on the moisture content of surface soil, temperature, and reflectivity—deserves further attention.
In addition, precipitation with a rain rate <0.01 mm · h−1 accounted for about 7.3% of the annual precipitation and was mainly solid precipitation, lasting from one to several minutes. If the reliability of these precipitation results is effectively confirmed in future observational tests, it will greatly increase the precipitation currently observed over the Qinghai–Tibet Plateau and provide an important reference for the precipitation correction scheme.

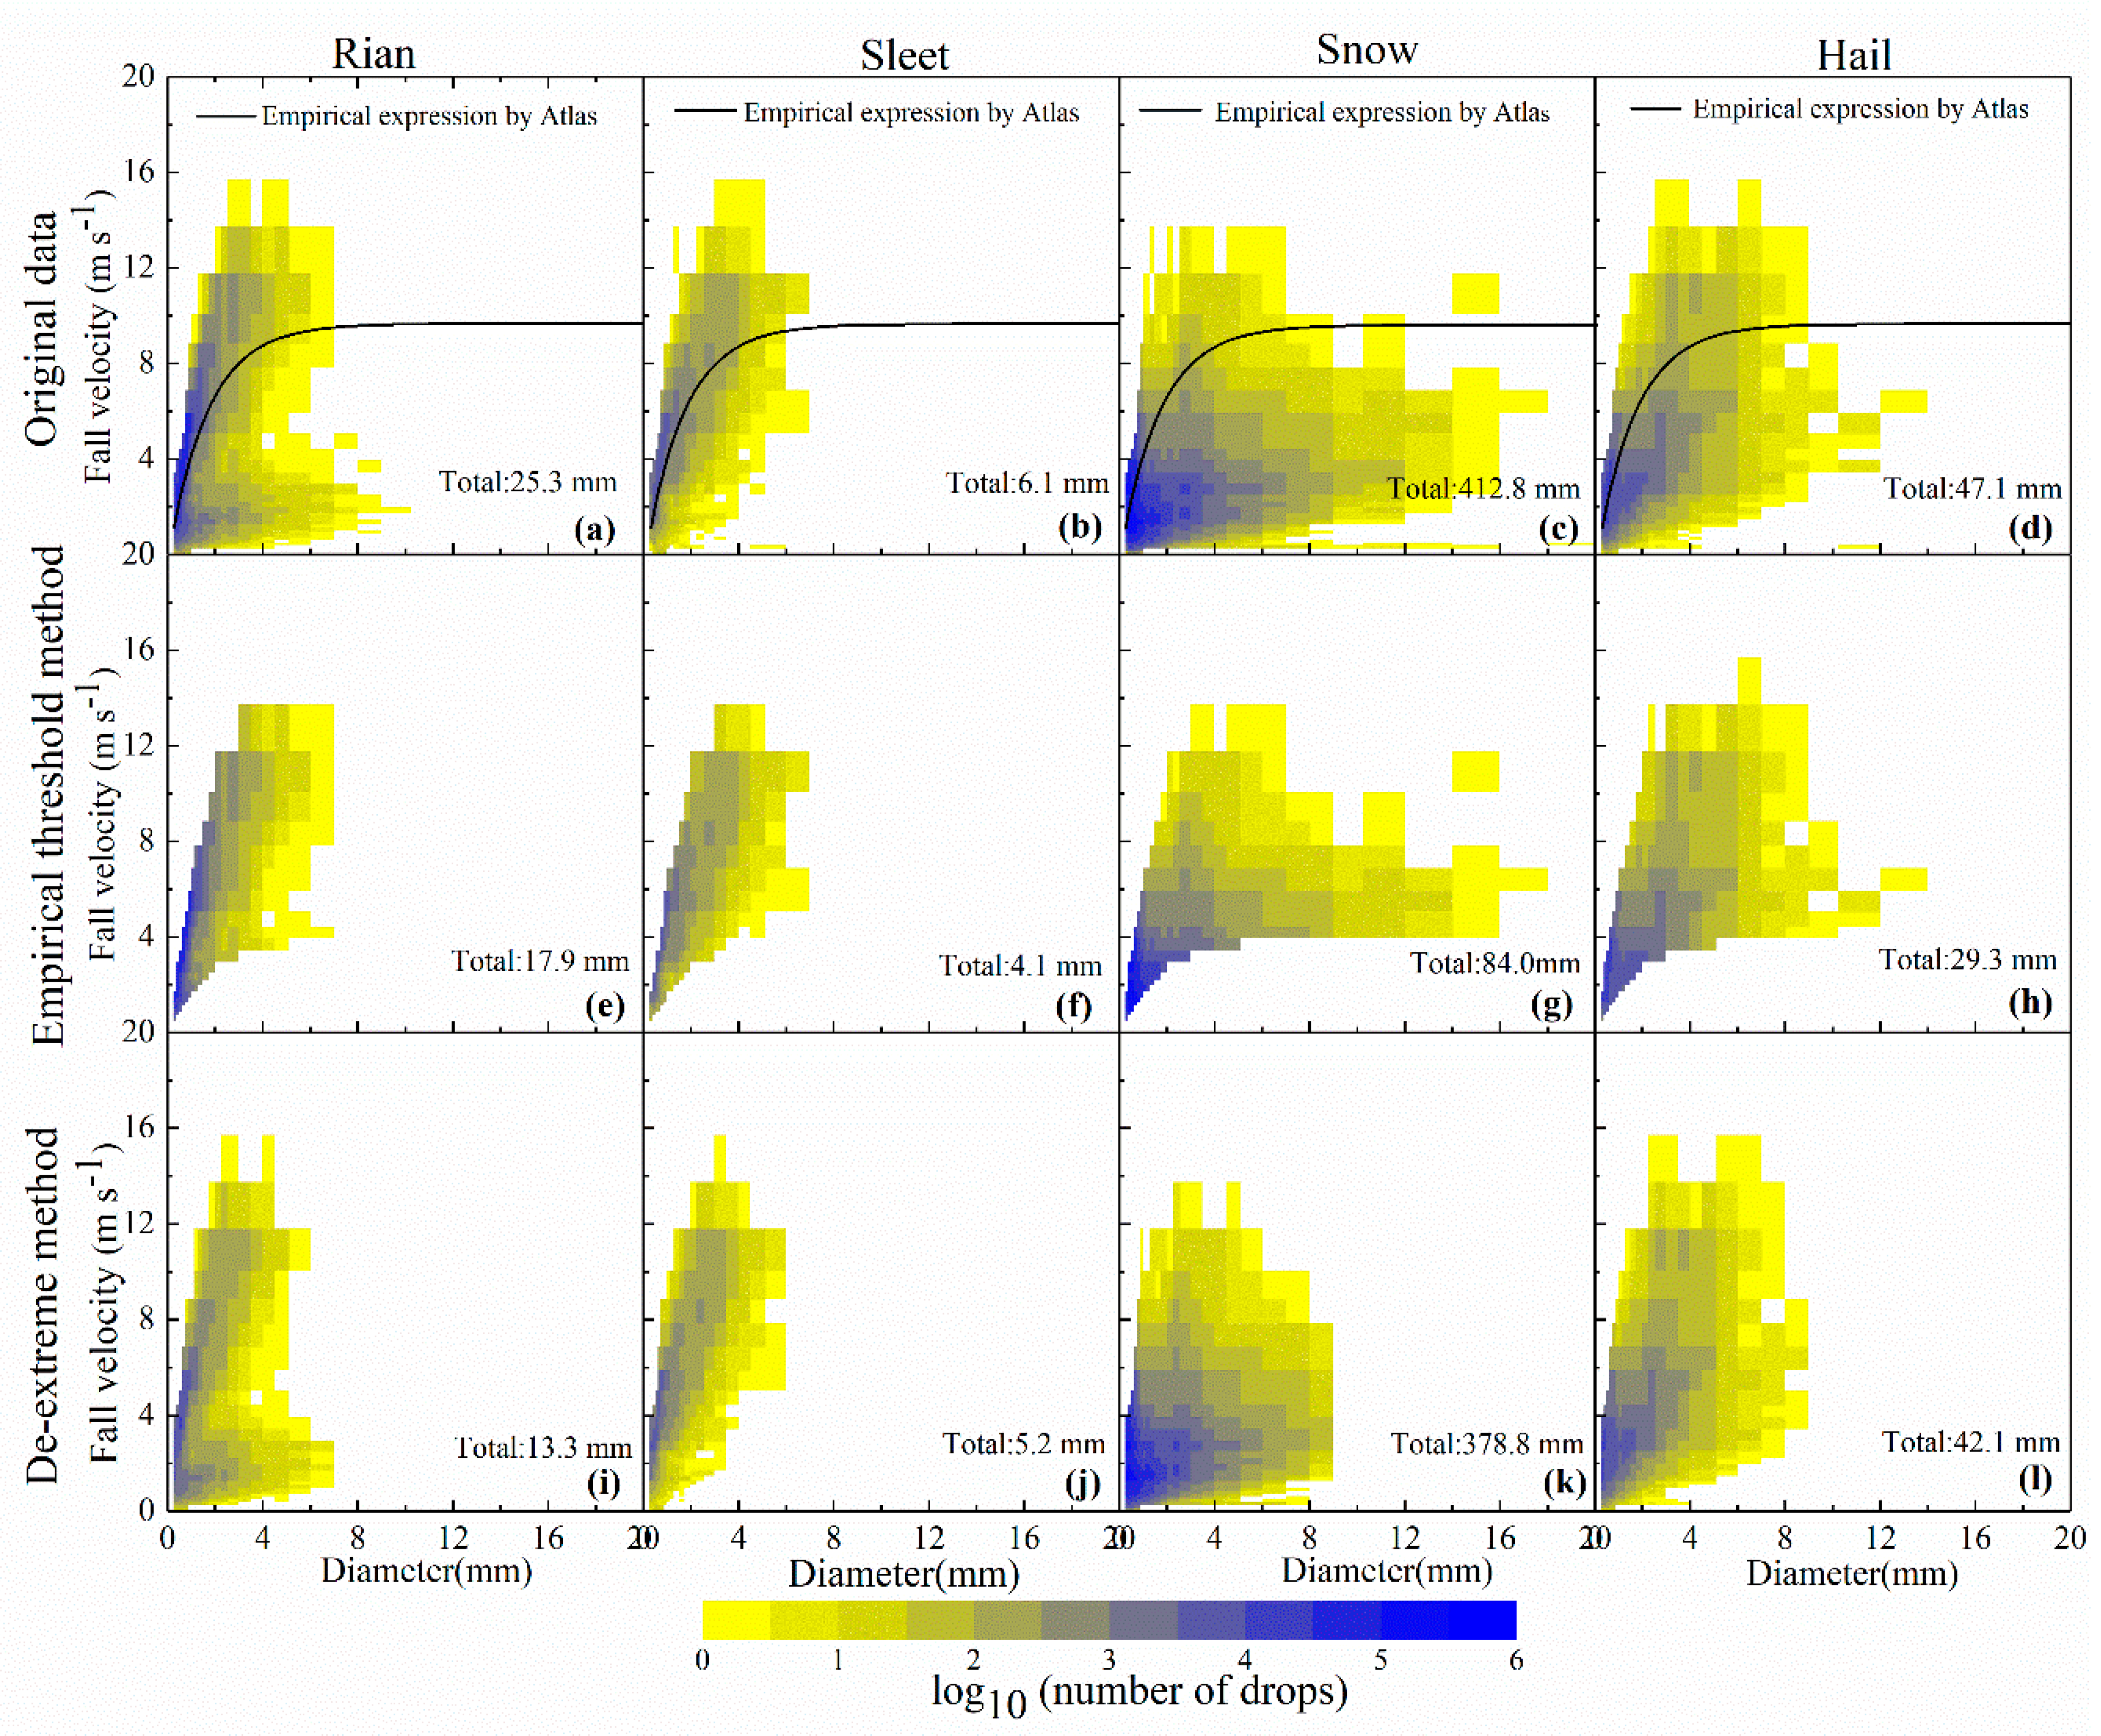
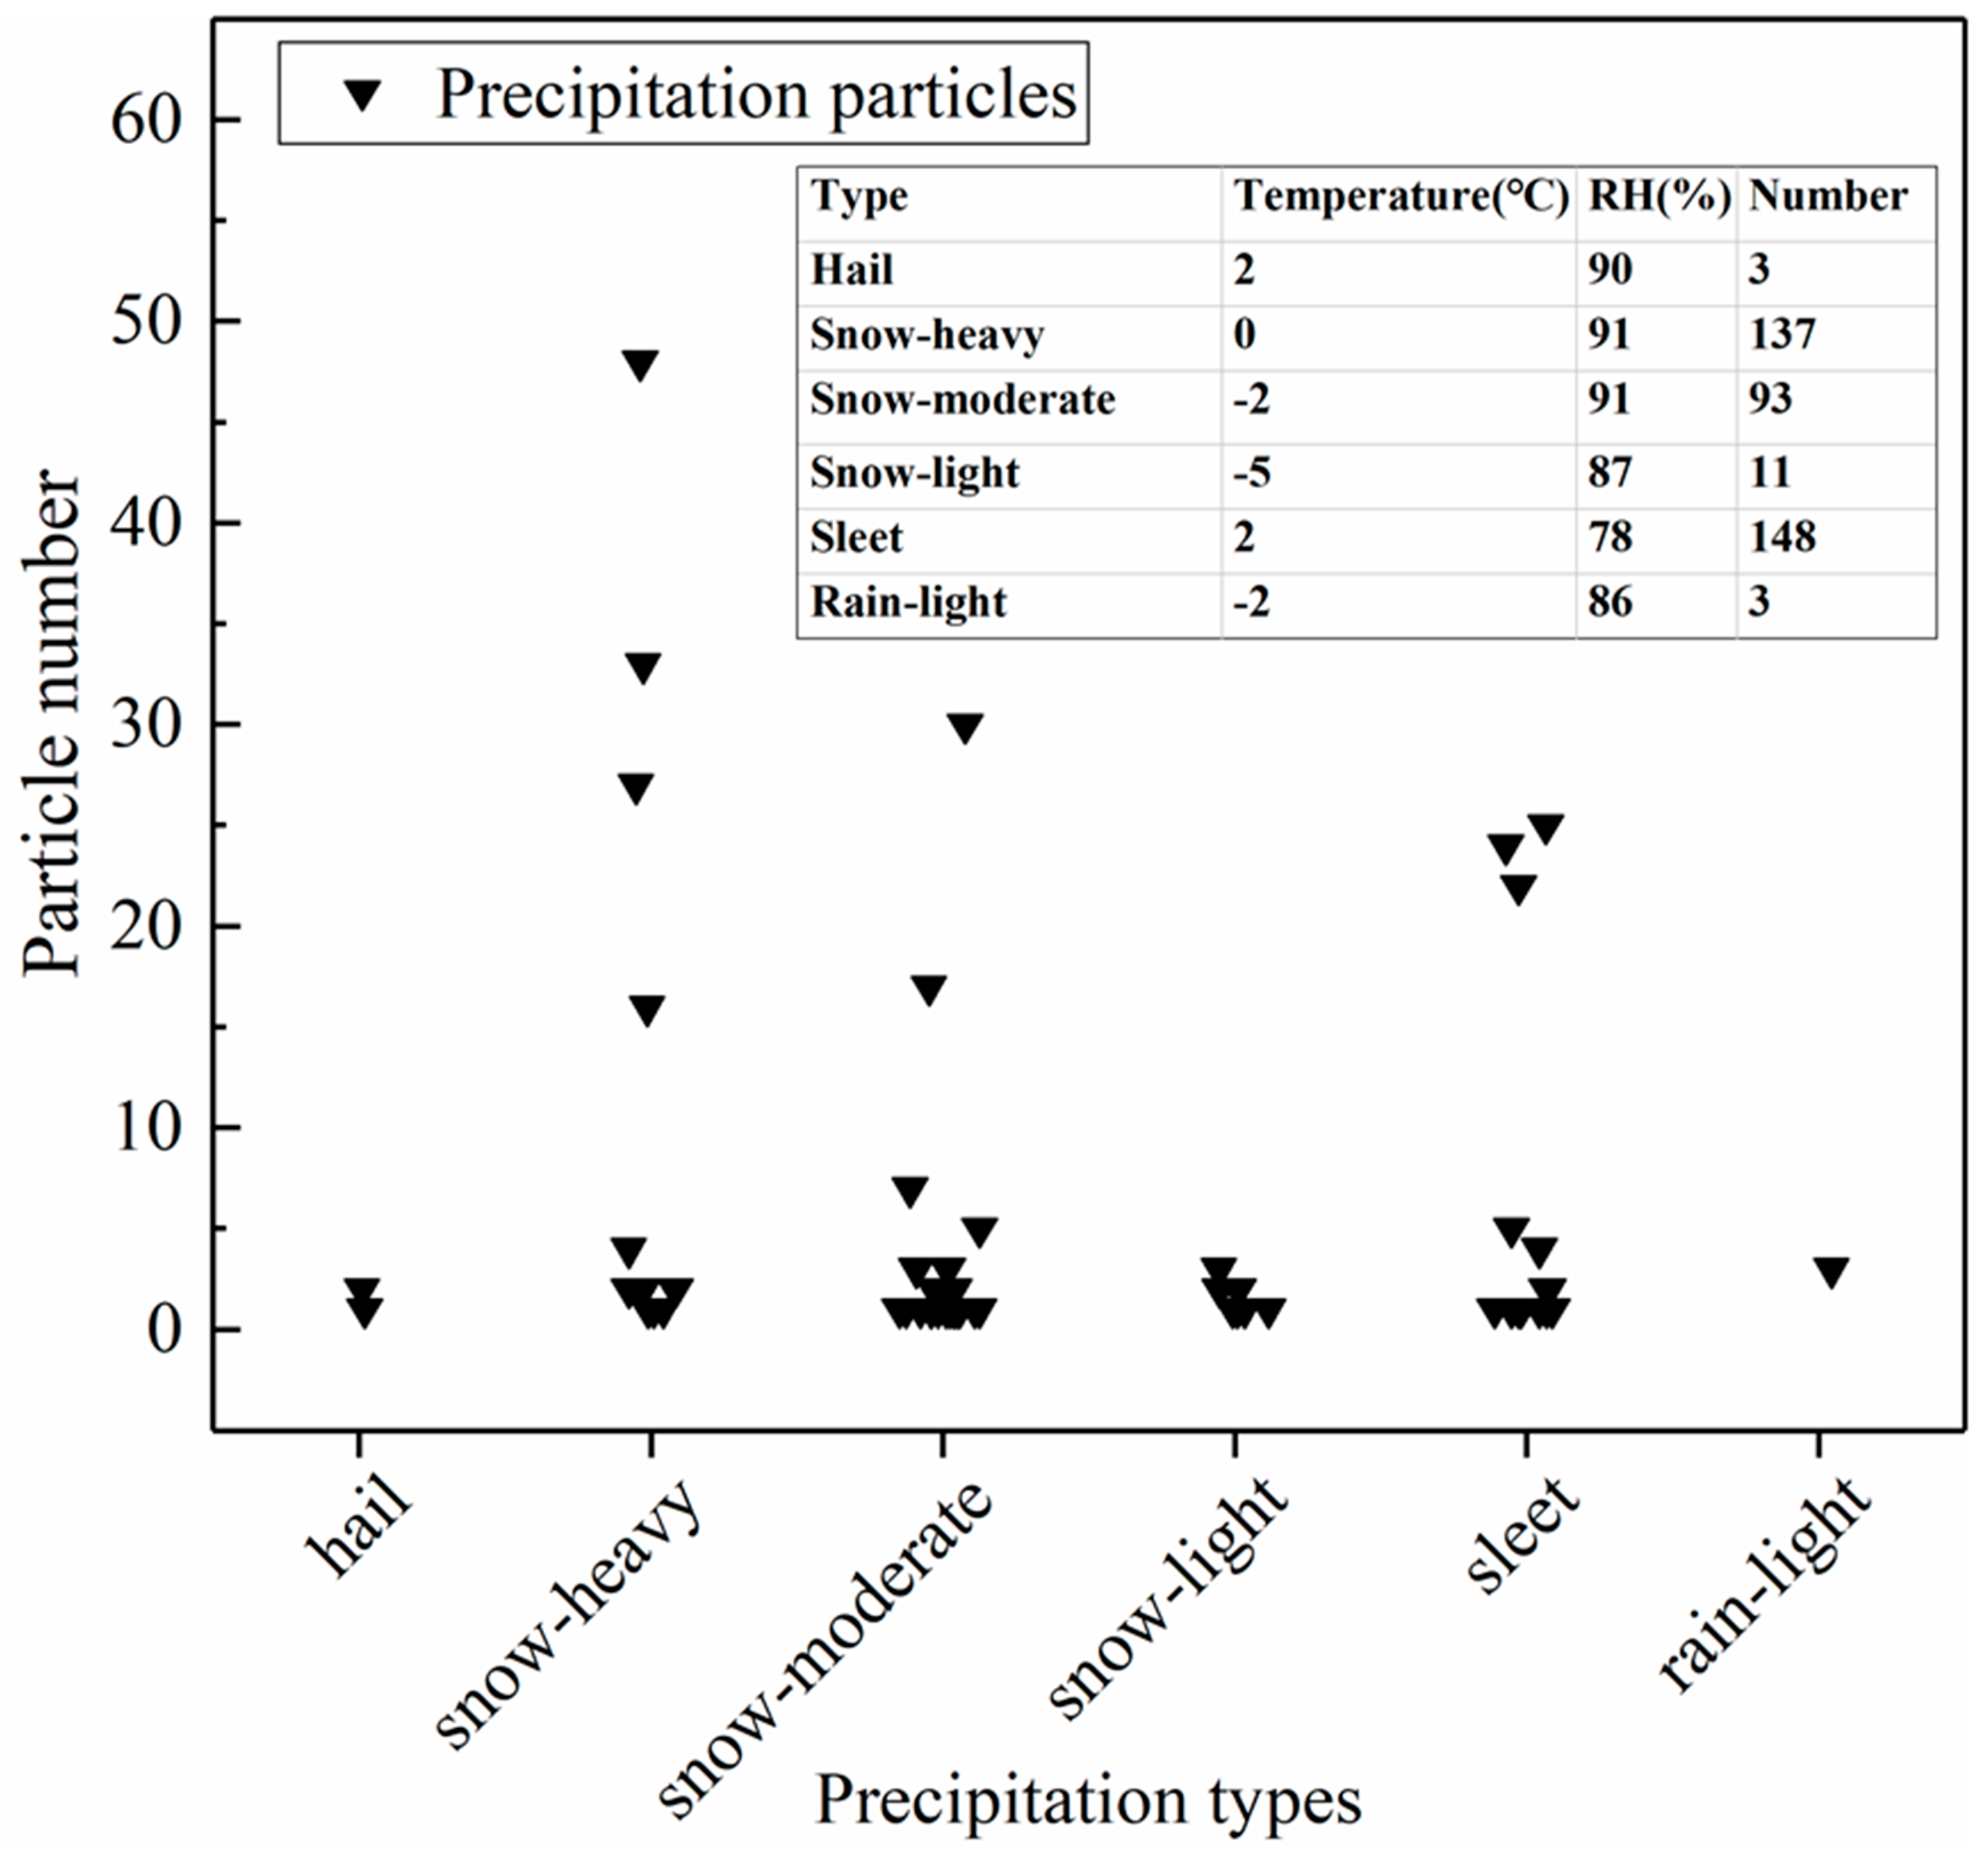
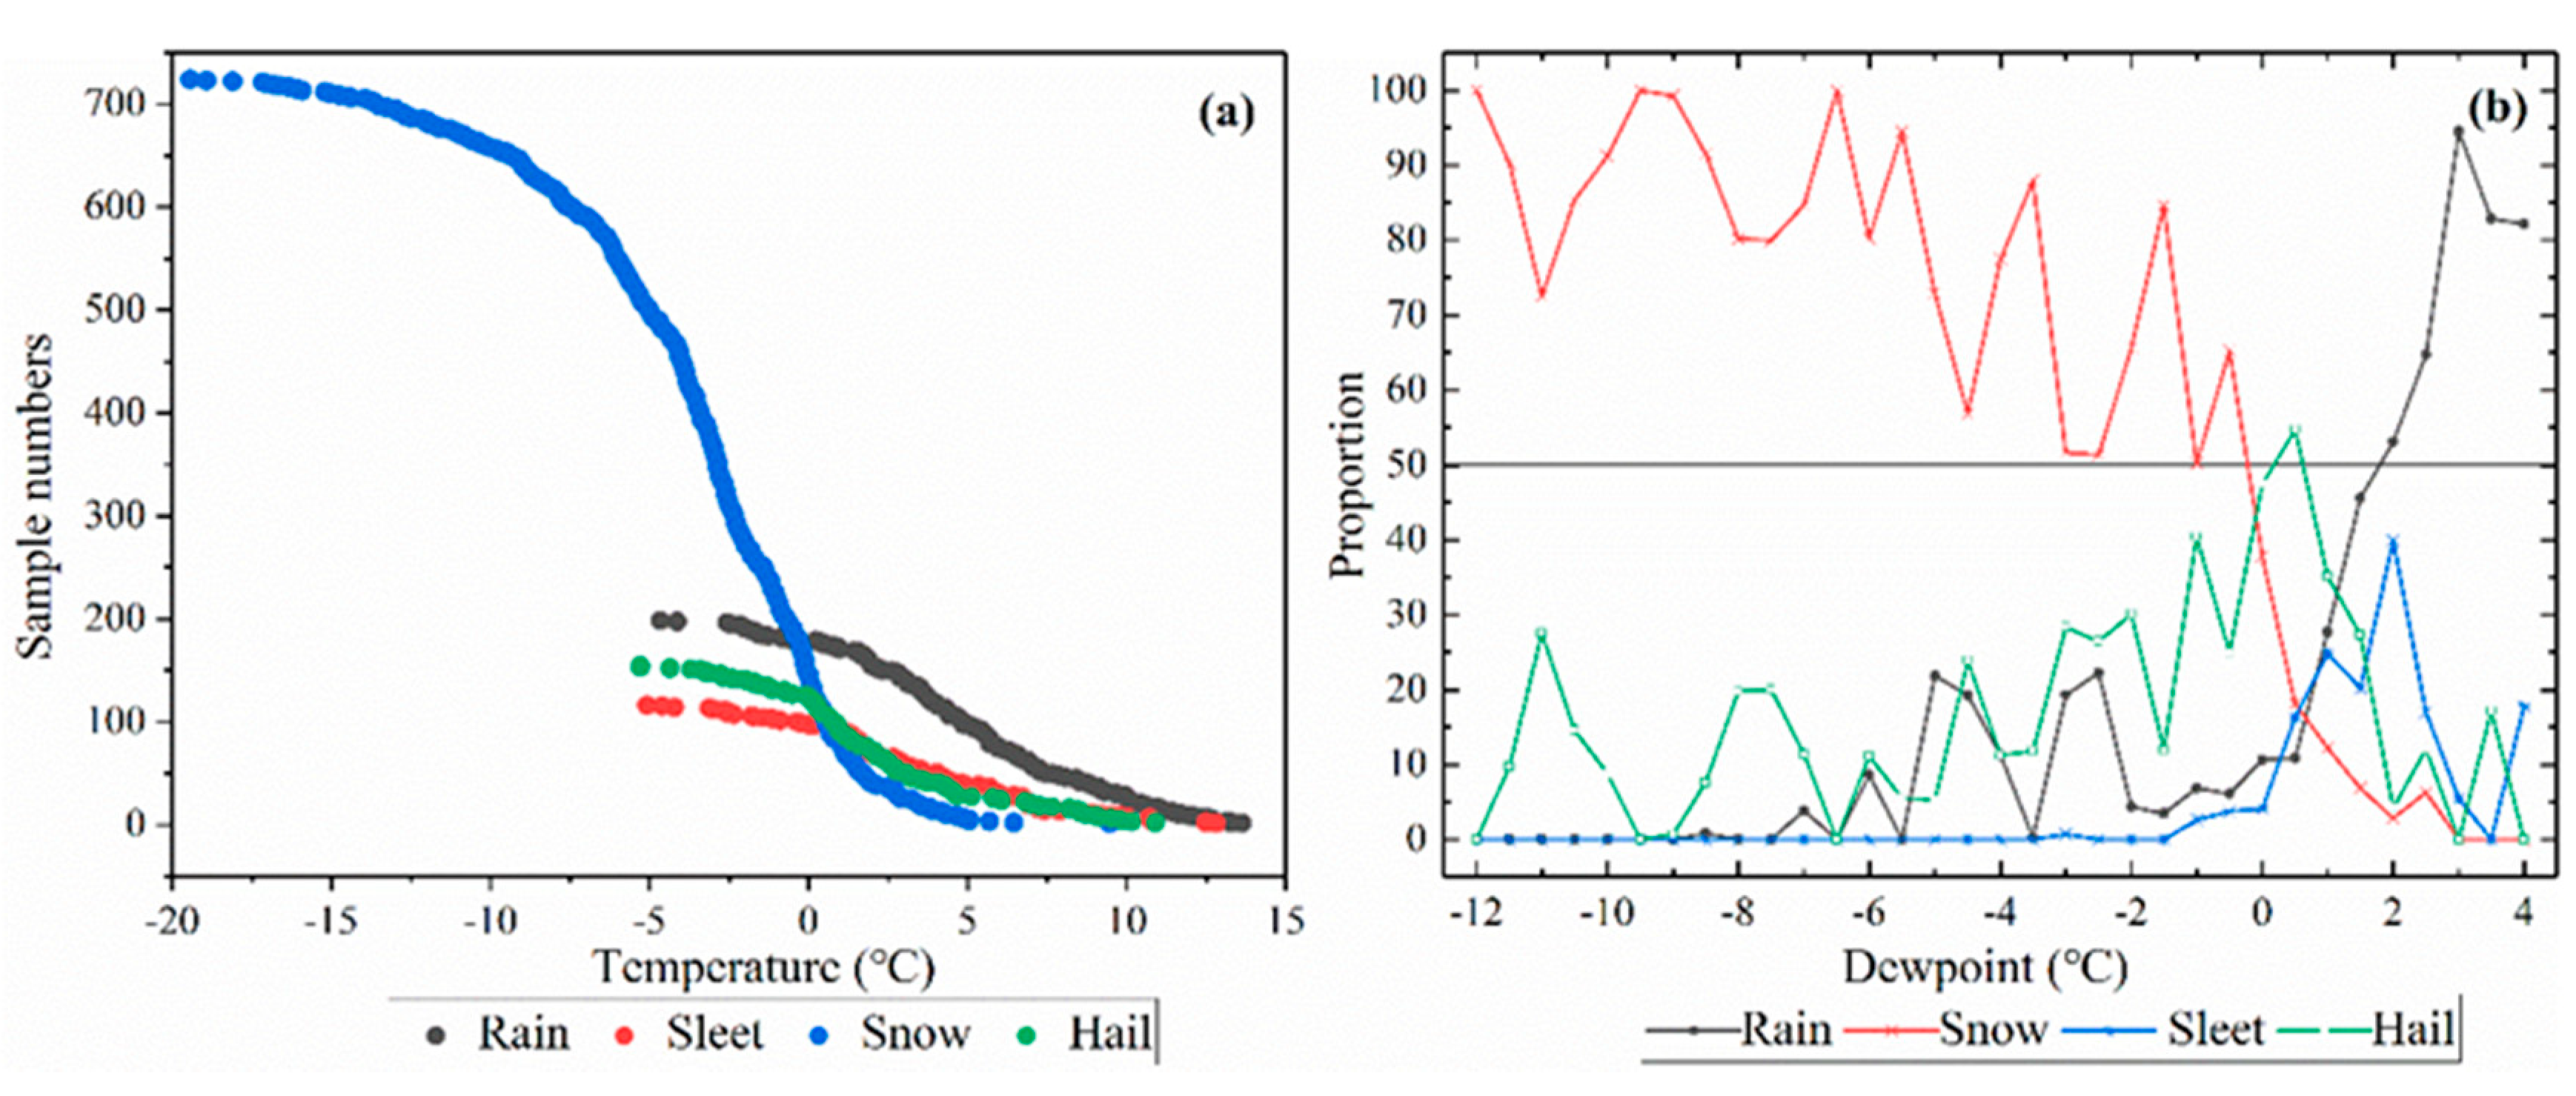
3.3. Temperature and Dewpoint Thresholds of Different Types of Precipitation

Different types of precipitation not only showed large differences in their DSD characteristics (Figure 3a–d), but also in the meteorological conditions required for their formation (Figure 9a,b). The maximum temperature threshold for snow at Tanggula in 2015 was 6.5 °C and the number of snowfall events increased significantly with the temperature at <1 °C; precipitation was completely in the form of snow at temperatures below −5 °C. The minimum temperature threshold for rain was −5 °C, whereas hail required temperatures between −5 and 11 °C and sleet temperatures between −5 and 13 °C. These three different types of precipitation were clearly reduced at temperatures below zero. Therefore, the relationship between the type of precipitation and the air temperature was complex at temperatures higher than −5 °C and temperature alone could not be used to distinguish different types of precipitation.
The dewpoint temperature takes into account the two most important factors that determine the type of precipitation: air temperature and atmospheric humidity [38]. These factors may be crucial in determining the type of precipitation in mountainous regions [58]. The proportion of each type of precipitation was counted in each half-hourly precipitation event for each half-degree interval of dewpoint temperature from −12 to 4.5 °C and the frequency distribution for each precipitation type was constructed within this dewpoint range (Figure 9b). In addition, the dewpoint corresponding to 50% proportion was taken as a metric to determine the precipitation type, and the half-point value was an important rain–snow threshold [38,58,59,60]. When the proportion of a certain type of precipitation exceeded 50%, more than half of the precipitation belonged to this particular type and the corresponding dewpoint was the threshold for the transition between the different types of precipitation. The proportion of snow decreased as the dewpoint increased, while the proportion of rain increased sharply. When the dewpoint was <0 °C, the precipitation was mainly snow, whereas when the dewpoint was >1.5 °C the precipitation was mainly rain. The precipitation was a mixed type dominated by hail when the dewpoint was in the range 0–1.5 °C.

4. Discussion

There is currently much interest in the characteristics of the DSD and comparative observation tests using laser disdrometers, but the research on data quality control schemes is still immature and regional differences in the characteristics of precipitation have not been fully considered. Although the data quality control scheme of the de-extreme method proposed in this study was an empirical judgment combining both theory and observational results, it was able to retain more information about effective solid and sleet particles to objectively reflect their DSD characteristics and to minimize the calculation error caused by abnormally large or small particles. The scheme provides a reference for the quality control of data for rain spectra in areas with complex precipitation. However, the critical values for trace amounts of precipitation and large particles used in this scheme were conservative estimates based on theoretical analysis and the objective existence of these types of precipitation are currently difficult to confirm by current observations and research on the Qinghai–Tibet Plateau. A combination of these results with other observation methods is therefore required to improve the accuracy of measurement in future experiments.
The permafrost region of the Qinghai–Tibet Plateau accounts for 56% of the total area of the plateau (Figure 1). Investigation of precipitation and its microphysical characteristics in this region will not only improve our understanding of the impact of precipitation on changes in permafrost, but also better represent the response of the Qinghai–Tibet Plateau to global climate change. The active layer is the interface for moisture and heat energy exchange between the permafrost and atmosphere. The occurrence time, type, patterns, and intensity of precipitation events have various cooling and heating effects on active layer, affecting the hydrothermal processes on the land from the surface to >1 m deep [8,61,62]. Future research will focus on the impact of the microphysical properties of precipitation on active layer.
The DSD in the permafrost region of the Qinghai–Tibet Plateau is characterized by a broader rain spectrum, larger particle size, low fall velocity, and a low rain rate, which is clearly different from that in the monsoon region [19,63,64]. Raindrops in eastern China are highly concentrated in the size range <4 mm with velocities <8 m · s−1 and the rain spectra in spring and summer are broader than those in other seasons [64]. Raindrops in southern China in summer are concentrated in the size range <4.5 mm with velocities <8 m · s−1 and the rain spectrum is much broader than that in eastern China [65]. Stratiform and shallow rain mainly has a rain rate of 1 mm · h−1 in summer in southern China, accounting for 15.1% of the total precipitation, whereas the rain rate of convective rain is mainly 5 and 7 mm · h−1, accounting for 62.7% of the total [65]. However, in the permafrost regions, most liquid particles are <2 mm in size, highly concentrated in the size range <1 mm and the overall velocity of the raindrops is relatively slow (Figure 3). The frequency of precipitation with a rain rate of 1 mm · h−1 is high, accounting for 24% of the annual precipitation, and the precipitation with a rain rate >2 mm · h−1 is the main contributor (54%) to the annual precipitation, of which precipitation with a rain rate >5 mm · h−1 accounts for 24% of the annual total (Figure 8b). However, the DSD in permafrost regions is similar to that in inland regions and in regions with a number of different types of solid precipitation. The liquid precipitation in northern and northwestern China is mainly composed of particles <2 mm and is highly concentrated in the size range <1 mm [66,67]. The DSDs in winter in the Oregon Cascade Mountains (mainly solid and mixed precipitation) [39] and in Hokkaido [68] are both similar to that in permafrost regions (Figure 8a), especially the DSD in the Oregon Cascade Mountains at temperatures of 0.5–1.5 °C and <0 °C [39]. This is probably because the temperature, type, and pattern of precipitation events in these regions were similar to those in the permafrost regions of the Qinghai–Tibet Plateau.
Precipitation patterns are divided into stratiform and convective rain according to their microphysical characteristics. The most commonly used classification scheme is based on the time series of the surface rain rate [17,19,67], and the scheme proposed by Bringi et al. [69] has been widely used to study the DSD characteristics of precipitation patterns in various climate types [15,20,30,35,70,71]. If the standard deviation of five consecutive DSD samples is <1.5 mm · h−1, then it is classified as stratiform, otherwise it is classified as convective if the rain rate is >5 mm · h−1 and the standard deviation is >1.5 mm · h−1 [69]. The precipitation patterns at Tanggula in 2015 were counted based on this classification scheme and convective rain accounted for 6% of the total number of samples and 30% of the total annual precipitation. Stratiform and convective rain accounted for 87.2% and 5.5% of the total number of samples in summer at Naqu [17]. However, these results probably underestimated the amount of convective rain on the Qinghai–Tibet Plateau. Liu et al. [72] used Tropical Rainfall Measuring Mission (TRMM) precipitation radar data to simulate convective rain in Asia, which accounted for about 55% of the annual precipitation recorded by satellite data, but >60% in the Weather Research and Forecasting (WRF) model simulation. Fu and Liu [73] also used TRMM precipitation radar data to show that convective rain accounted for about 30% of summer precipitation in the interior Qinghai–Tibet Plateau, but they did not think that the result was consistent with the strong convective conditions in the region.
The results of the method of classifying precipitation patterns according to rain rate were different from those of remote sensing, radar data, and model simulation. First, there was little heavy rainfall on the Qinghai–Tibet Plateau (Figure 8c) and many of the shallow convective and mixed patterns of rain were classified as stratiform using a threshold rain rate of 5 mm · h−1 [20,33,74]. Second, the same surface rain rate may originate from different precipitation clouds [61] and the method of classifying precipitation patterns by taking the rain rate as a single indicator contains some errors. Therefore, precipitation patterns should be classified by combining the DSD characteristics, radar detection, and remote sensing data [35].
Different types of precipitation have different effects on hydrological processes and the surface energy budget, which is important in global hydroclimatic simulations [58,75]. Much research has therefore concentrated on distinguishing rain and snow precipitation. Daily meteorological factors are used to analyze and calculate the rain–snow threshold. It has been reported that the rain–snow temperature threshold is >4 °C in the northern Qinghai–Tibet Plateau [76], 0 °C in the Qilian Mountains [75], and about 2–3 °C in Canada [2]. However, the relationship between the half-hourly precipitation type and the corresponding temperature in this study showed that the lowest temperature of rain was −5 °C and the highest temperature of snow was 6.5 °C (Figure 9a), which are very different from the statistical results of previous studies on a daily timescale. The dewpoint was used to distinguish different types of precipitation in this study and the results showed that the threshold values of dewpoint of rain and snow in permafrost regions on the Qinghai–Tibet Plateau were 0 and 1.5 °C, respectively, similar to those in northern Eurasia (0.5 and 1.0 °C) [38]. Ding et al. [77] determined the type of precipitation by establishing a parameterization scheme and the application of this scheme in the interior of the Qinghai–Tibet Plateau showed that the proportion of annual snowfall was about 40% [9], which was different from our observational results where the annual precipitation was mainly solid (Figure 3). Therefore, the rain–snow threshold obtained in this study based on the relationship between precipitation types and the dewpoint on a half-hourly timescale scale was closer to the critical threshold of the phase transition, which provides an important reference for the determination of different types of precipitation in permafrost regions.

5. Conclusions

We investigated the DSD characteristics in permafrost regions of the Qinghai–Tibet Plateau during 2015 using OTT Parsivel2 measurements. The quality-controlled dataset included 6834 and 7281 samples (minutes) corresponding to accumulated precipitation of 439 and 440 mm at Tanggula and Wudaoliang, respectively. Our main conclusions are as follows.
By analyzing the observational results and combining these with the results of previous studies, we propose a raindrop spectra data quality control scheme suitable for the permafrost region of the Qinghai–Tibet Plateau. This includes the elimination of the first two particle size classes, particles with >10 mm, and trace amounts of precipitation with a rain rate <0.01 mm · h−1.
The annual precipitation in permafrost regions of the Qinghai–Tibet Plateau was mainly solid, with snow and hail accounting for 86% and 10% of the annual total. The DSD was characterized by large particles with a slow velocity, with 94% of the precipitation particles concentrated in the size range <2 mm with velocities <4 m · s−1. There was no clear difference in the DSD characteristics between Tanggula and Wudaoliang in the permafrost regions, but these were significantly different from the DSD characteristics in regions with seasonally frozen ground (Naqu).
The particle concentration at different rain rates decreased gradually with increasing particle size and decreased stepwise with an increased in the rain rate. The frequency of precipitation with a rain rate >2 mm · h−1 was only 20%, but it contributed 75% of the annual precipitation. Precipitation events with a small rain rate occurred frequently.
The relationship between precipitation type and temperature was more complex in half-hourly precipitation events. Snowfall events clearly increased at temperatures <1 °C and rain, sleet, and hail decreased significantly as the temperature dropped below 0 °C. The dewpoint temperature may be used in practice to reflect the phase transition of precipitation. The dewpoint thresholds of snow and rain were 0 and 1.5 °C, respectively, whereas the range of mixed precipitation with a larger proportion of hail was 0–1.5 °C.
This study was limited to a preliminary statistical analysis of the DSD characteristics in permafrost regions of the Qinghai–Tibet Plateau and we did not consider different patterns of precipitation. This was because the traditional method of classifying precipitation patterns according to the surface rain rate greatly underestimated convective rainfall on the Qinghai–Tibet Plateau. We will in the future study the influence of different precipitation patterns and their effect on surface hydrothermal processes in permafrost regions using a wider range of datasets.

Author Contributions

Conceptualization, L.M., L.Z.; Formal analysis, L.M.; Funding acquisition, L.Z.; Methodology, L.M.; Project administration, L.Z.; Software, L.Z. (Lele Zhang) and Y.Q.; Supervision, D.Y.; Validation, Y.X.; Writing—riginal draft, L.M.; Writing—review & editing, L.M., L.Z. and D.Y.

Funding

This research is supported by the Strategic Priority Research Program of Chinese Academy of Sciences (XDA20020102), the National Natural Science Foundation of China (41601078,41671068,41705139), and the State Key Laboratory of Cryosphere Science (SKLCS-ZZ-2019).

Acknowledgments

The supports from the Cryosphere Research Station on the Qinghai–Tibetan Plateau are especially appreciated.

Conflicts of Interest

The authors declare no conflict of interest.

References

  1. Alazzy, A.A.; Lü, H.; Chen, R.; Ali, A.B.; Zhu, Y.; Su, J. Evaluation of satellite precipitation products and their potential influence on hydrological modeling over the Ganzi River Basin of the Tibetan Plateau. Adv. Meteorol. 2017, 2017, 1–23. [Google Scholar] [CrossRef]
  2. Pan, X.; Yang, D.; Li, Y.; Barr, A.; Helgason, W.; Hayashi, M.; Marsh, P.; Pomeroy, J.; Janowicz, R.J.; Li, Y. Bias Corrections of precipitation measurements across experimental sites in different ecoclimatic regions of western Canada. Cryosphere 2016, 10, 2347–2360. [Google Scholar] [CrossRef]
  3. Smith, C.D. Correcting the wind bias in snowfall measurements made with a Geonor T-200B precipitation gauge and Alter wind shield. In Proceedings of the 87th American Meteorological Society Annual Meeting, San Antonio, TX, USA, 14–18 January 2007; Volume 36, pp. 13–18. [Google Scholar]
  4. Sugiura, K.; Ohata, T.; Yang, D. Catch characteristics of precipitation gauges in high winds. J. Hydrometeorol. 2006, 87, 1182–1183. [Google Scholar]
  5. Yang, D.; Ohata, T. A bias-corrected siberian regional precipitation climatology. J. Hydrometeorol. 2000, 2, 122–139. [Google Scholar] [CrossRef]
  6. Ye, B.; Yang, D.; Ding, Y.; Han, T.; Koike, T. A bias-corrected precipitation climatology for China. J. Hydrometeorol. 2004, 5, 1147–1160. [Google Scholar] [CrossRef]
  7. Zhang, L.; Zhao, L.; Xie, C.; Liu, G.; Gao, L.; Xiao, Y.; Shi, J.; Qiao, Y. Intercomparison of solid precipitation derived from the weighting rain gauge and optical instruments in the interior Qinghai-Tibetan Plateau. Adv. Meteorol. 2015, 2015, 1–11. [Google Scholar] [CrossRef]
  8. Zhao, L.; Ping, C.-L.; Yang, D.; Cheng, G.; Ding, Y.; Liu, S. Changes of climate and seasonally frozen ground over the past 30 years in Qinghai–Xizang (Tibetan) Plateau, China. Glob. Planet. Chang. 2004, 43, 19–31. [Google Scholar] [CrossRef]
  9. Zhu, X.; Wu, T.; Li, R.; Wang, S.; Hu, G.; Wang, W.; Qin, Y.; Yang, S. Characteristics of the ratios of snow, rain and sleet to precipitation on the Qinghai-Tibet Plateau during 1961–2014. Quat. Int. 2017, 444, 137–150. [Google Scholar] [CrossRef]
  10. Guo, X.; Wang, L.; Tian, L.; Li, X. Elevation-dependent reductions in wind speed over and around the Tibetan Plateau. Int. J. Climatol. 2017, 37, 1117–1126. [Google Scholar] [CrossRef]
  11. You, Q.; Min, J.; Zhang, W.; Pepin, N.; Kang, S. Comparison of multiple datasets with gridded precipitation observations over the Tibetan Plateau. Clim. Dyn. 2015, 45, 791–806. [Google Scholar] [CrossRef]
  12. Zou, D.; Zhao, L.; Sheng, Y.; Chen, J.; Hu, G.; Wu, T.; Wu, J.; Xie, C.; Wu, X.; Pang, Q.; et al. A new map of permafrost distribution on the Tibetan Plateau. Cryosphere 2017, 11, 2527–2542. [Google Scholar] [CrossRef] [Green Version]
  13. Sugiura, K.; Ohata, T.; Yang, D.; Sato, T.; Sato, A. Application of a snow particle counter to solid precipitation measurements under Arctic conditions. Cold Reg. Sci. Technol. 2009, 58, 77–83. [Google Scholar] [CrossRef]
  14. Jin, H.; Li, S.; Cheng, G.; Shaoling, W.; Li, X. Permafrost and climatic change in China. Glob. Planet. Chang. 2000, 26, 387–404. [Google Scholar] [CrossRef]
  15. Suh, S.-H.; You, C.; Lee, D. Climatological characteristics of raindrop size distributions within a topographically complex area. Hydrol. Earth Syst. Sci. Discuss. 2015, 12, 4005–4045. [Google Scholar] [CrossRef]
  16. Chen, B.; Yang, J.; Pu, J. Statistical Characteristics of Raindrop Size Distribution in the Meiyu Season Observed in Eastern China. J. Meteorol. Soc. Jpn. 2013, 91, 215–227. [Google Scholar] [CrossRef] [Green Version]
  17. Chen, B.; Hu, Z.; Liu, L.; Zhang, G. Raindrop size distribution measurements at 4500 m on the Tibetan Plateau during TIPEX-III. J. Geophys. Res. Atmos. 2017, 122, 11092–11106. [Google Scholar] [CrossRef]
  18. Raupach, T.H.; Berne, A. Small-scale variability of the raindrop size distribution and its effect on areal rainfall retrieval. J. Hydrometeorol. 2016, 17, 2077–2104. [Google Scholar] [CrossRef]
  19. Zhang, A.; Hu, J.; Chen, S.; Hu, D.; Zhengqing, L. statistical characteristics of raindrop size distribution in the monsoon season observed in Southern China. Remote Sens. 2019, 11, 432. [Google Scholar] [CrossRef]
  20. Porcù, F.; D’Adderio, L.P.; Prodi, F.; Caracciolo, C. Rain drop size distribution over the Tibetan Plateau. Atmos. Res. 2014, 150, 21–30. [Google Scholar] [CrossRef]
  21. Thurai, M.; Bringi, V.; Gatlin, P.N.; Petersen, W.A.; Wingo, M.T. Measurements and modeling of the full rain drop size distribution. Atmosphere 2019, 10, 39. [Google Scholar] [CrossRef]
  22. Kathiravelu, G.; Lucke, T.; Nichols, P. Rain drop measurement techniques: A review. Water 2016, 8, 29. [Google Scholar] [CrossRef]
  23. Angulo-Martínez, M.; Beguería, S.; Latorre, B.; Fernández-Raga, M. Comparison of precipitation measurements by OTT Parsivel2 and Thies LPM optical disdrometers. Hydrol. Earth Syst. Sci. 2018, 22, 2811–2837. [Google Scholar] [CrossRef]
  24. de Moraes Frasson, R.P.; da Cunha, L.K.; Krajewski, W.F. Assessment of the Thies optical disdrometer performance. Atmos. Res. 2011, 101, 237–255. [Google Scholar] [CrossRef]
  25. Lanzinger, E. Rainfall Amount and Intensity Measured by the Thies Laser Precipitation Monitor; TECO-2006; TECO: Geneva, Switzerland, 2006; pp. 1–9. [Google Scholar]
  26. Tokay, A.; Kruger, A.; Krajewski, W.F.; Kucera, P.A.; Filho, A.J.P. Measurements of drop size distribution in the southwestern Amazon basin. J. Geophys. Res. D Atmos. 2002, 107, LBA-19. [Google Scholar] [CrossRef]
  27. Tokay, A.; Wolff, D.B.; Petersen, W.A. Evaluation of the new version of the laser-optical disdrometer, OTT Parsivel2. J. Atmos. Ocean. Technol. 2014, 31, 1276–1288. [Google Scholar] [CrossRef]
  28. Bourgouin, P. A Method to Determine Precipitation Types. Weather Forecast. 2000, 15, 583–592. [Google Scholar] [CrossRef]
  29. Kim, H.J.; Lee, K.O.; You, C.H.; Uyeda, H.; Lee, D.I. Microphysical characteristics of a convective precipitation system observed on July 04, 2012, over Mt. Halla in South Korea. Atmos. Res. 2019, 222, 74–87. [Google Scholar] [CrossRef]
  30. Wen, L.; Zhao, K.; Zhang, G.; Xue, M.; Zhou, B.; Liu, S.; Chen, X. Statistical characteristics of raindrop size distributions observed in East China during the Asian summer monsoon season using 2-D video disdrometer and Micro Rain Radar data. J. Geophys. Res. Atmos. Res. 2016, 121, 2265–2282. [Google Scholar] [CrossRef] [Green Version]
  31. Wu, Z.; Zhang, Y.; Zhang, L.; Lei, H.; Xie, Y.; Wen, L.; Yang, J. Characteristics of summer season raindrop size distribution in three typical regions of western Pacific. J. Geophys. Res. Atmos. 2019, 124, 4054–4073. [Google Scholar] [CrossRef]
  32. Moumouni, S.; Gosset, M.; Houngninou, E. Main features of rain drop size distributions observed in Benin, West Africa, with optical disdrometers. Geophys. Res. Lett. 2008, 35, 2–6. [Google Scholar] [CrossRef]
  33. Wu, Y.; Liu, L. Statistical characteristics of raindrop size distribution in the Tibetan Plateau and southern China. Adv. Atmos. Sci. 2017, 34, 727–736. [Google Scholar] [CrossRef]
  34. Mudiar, D.; Pawar, S.D.; Hazra, A.; Konwar, M.; Gopalakrishnan, V.; Srivastava, M.K.; Goswami, B.N. Quantification of observed electrical effect on the raindrop size distribution in tropical clouds. J. Geophys. Res. Atmos. 2018, 123, 4527–4544. [Google Scholar] [CrossRef]
  35. Seela, B.K.; Janapati, J.; Lin, P.-L.; Reddy, K.K.; Shirooka, R.; Wang, P.K. A comparison study of summer season raindrop size distribution between Palau and Taiwan, two islands in Western Pacific. J. Geophys. Res. Atmos. 2017, 122. [Google Scholar] [CrossRef]
  36. OTT Hydromet GmbH. Operating Instructions Present Weather Sensor OTT Parsivel2; OTT Hydromet GmbH: Kempten, Germany, 2016. [Google Scholar]
  37. Atlas, D.; Srivastava, R.C.; Sekhon, R.S. Doppler radar characteristics of precipitation at vertical incidence. Rev. Geophys. 1973, 11, 1–35. [Google Scholar] [CrossRef]
  38. Ye, H.; Cohen, J.; Rawlins, M. Discrimination of solid from liquid precipitation over Northern eurasia using surface atmospheric conditions. J. Hydrometeorol. 2013, 14, 1345–1355. [Google Scholar] [CrossRef]
  39. Yuter, S.E.; Kingsmill, D.E.; Nance, L.B.; Löffler-Mang, M. Observations of precipitation size and fall speed characteristics within coexisting rain and wet snow. J. Appl. Meteorol. Climatol. 2006, 45, 1450–1464. [Google Scholar] [CrossRef]
  40. Battaglia, A.; Rustemeier, E.; Tokay, A.; Blahak, U.; Simmer, C. PARSIVEL snow observations: A critical assessment. J. Atmos. Ocean. Technol. 2010, 27, 333–344. [Google Scholar] [CrossRef]
  41. Raupach, T.H.; Berne, A. Correction of raindrop size distributions measured by Parsivel disdrometers, using a two-dimensional video disdrometer as a reference. Atmos. Meas. Tech. 2015, 8, 343–365. [Google Scholar] [CrossRef] [Green Version]
  42. Lee, J.E.; Jung, S.H.; Park, H.M.; Kwon, S.; Lin, P.L.; Lee, G.W. Classification of precipitation types using fall velocity-diameter relationships from 2D-video distrometer measurements. Adv. Atmos. Sci. 2015, 32, 1277–1290. [Google Scholar] [CrossRef]
  43. Friedrich, K.; Higgins, S.; Masters, F.J.; Lopez, C.R. Articulating and stationary PARSIVEL disdrometer measurements in conditions with strong winds and heavy rainfall. J. Atmos. Ocean. Technol. 2013, 30, 2063–2080. [Google Scholar] [CrossRef]
  44. Zhang, H.; Zhang, Y.; He, H.; Xie, Y.; Zeng, Q. Comparison of raindrop size distributions in a midlatitude continental squall line during different stages as measured by parsivel over East China. J. Appl. Meteorol. Climatol. 2017, 56, 2097–2111. [Google Scholar] [CrossRef]
  45. Ross, G.; Gilbert, D. Kinzer the terminal velocity of fall for water droplets in stagnant air. J. Atmos. Sci. 1949, 6, 423–428. [Google Scholar]
  46. Testik, F.Y.; Pei, B. Wind effects on the shape of raindrop size distribution. J. Hydrometeorol. 2017, 18, 1285–1303. [Google Scholar] [CrossRef]
  47. Löffler-Mang, M.; Joss, J. An optical disdrometer for measuring size and velocity of hydrometeors. J. Atmos. Ocean. Technol. 2000, 17, 130–139. [Google Scholar] [CrossRef]
  48. Ishizaka, M.; Motoyoshi, H.; NakaiI, S.; Shina, T.; Kumakura, T.; Muramoto, K. A new method for identifying the main type of solid hydrometeors contributing to snowfall from measured size-fall speed relationship. J. Meteorol. Soc. Jpn. 2013, 91, 747–762. [Google Scholar] [CrossRef]
  49. Liu, J.; Chen, R.; Song, Y.X.; Yang, Y.; Qing, W.; Han, C.; Liu, Z. Observations of precipitation type using a time-lapse camera in a mountainous region and calculation of the rain/snow proportion based on the critical air temperature. Environ. Earth Sci. 2014, 73, 1545–1554. [Google Scholar] [CrossRef]
  50. D’Adderio, L.P.; Porcù, F.; Tokay, A. Evolution of drop size distribution in natural rain. Atmos. Res. 2018, 200, 70–76. [Google Scholar] [CrossRef]
  51. Jaffrain, J.; Berne, A. Experimental quantification of the sampling uncertainty associated with measurements from PARSIVEL disdrometers. J. Hydrometeorol. 2011, 12, 352–370. [Google Scholar] [CrossRef]
  52. Gultepe, I. Measurements of light rain, drizzle and heavy fog. In Precipitation: Advances in Measurement, Estimation and Prediction; Springer: Berlin/Heidelberg, Germany, 2008; pp. 59–79. [Google Scholar]
  53. Mercier, F.; Chazottes, A.; Barthès, L.; Mallet, C. 4-D-VAR assimilation of disdrometer data and radar spectral reflectivities for raindrop size distribution and vertical wind retrievals. Atmos. Meas. Tech. 2016, 9, 3145–3163. [Google Scholar] [CrossRef] [Green Version]
  54. Rosenfeld, D.; Chemke, R.; Demott, P.; Sullivan, R.C.; Rasmussen, R.; McDonough, F.; Comstock, J.; Schmid, B.; Tomlinson, J.; Jonsson, H.; et al. The common occurrence of highly supercooled drizzle and rain near the coastal regions of the western United States. J. Geophys. Res. Atmos. 2013, 118, 9819–9833. [Google Scholar] [CrossRef]
  55. Vanzanten, M.C.; Stevens, B.; Vali, G.; Lenschow, D.H. Observations of drizzle in nocturnal marine stratocumulus. J. Atmos. Sci. 2005, 62, 88–106. [Google Scholar] [CrossRef]
  56. Bloemink, H.I. Precipitation type from the Thies disdrometer. In Proceedings of the WMO Technical Conference on Instruments and Methods of Observation (TECO-2005), Bucharest, Romania, 4–7 May 2005; pp. 1–7. [Google Scholar]
  57. Chen, B. Characteristics of the raindrop size distribution for freezing precipitation observed in Southern. J. Geophys. Res. 2011, 116. [Google Scholar] [CrossRef]
  58. Jennings, K.S.; Winchell, T.S.; Livneh, B.; Molotch, N.P. Spatial variation of the rain-snow temperature threshold across the Northern Hemisphere. Nat. Commun. 2018, 9, 1148–1157. [Google Scholar] [CrossRef] [PubMed]
  59. Kienzle, S.W. A new temperature based method to separate rain and snow. Hydrol. Process. Int. J. 2008, 22, 5067–5085. [Google Scholar] [CrossRef]
  60. Froidurot, S.; Zin, I.; Hingray, B.; Gautheron, A. Sensitivity of precipitation phase over the Swiss Alps to different meteorological variables. J. Hydrometeorol. 2013, 15, 685–696. [Google Scholar] [CrossRef]
  61. Zhang, S.; Li, X. Soil moisture and temperature dynamics in typical alpine ecosystems: A continuous multi-depth measurements-based analysis from the Qinghai-Tibet Plateau, China. Hydrol. Res. 2017, 49, 194–209. [Google Scholar] [CrossRef]
  62. Zhang, Z.; Wu, Q.; Gao, S.; Hou, Y. Response of the soil hydrothermal process to difference underlying conditions in the Beiluhe permafrost region. Environ. Earth Sci. 2017, 76, 194. [Google Scholar] [CrossRef]
  63. Tang, Q.; Xiao, H.; Guo, C.; Feng, L. Characteristics of the raindrop size distributions and their retrieved polarimetric radar parameters in northern and southern China. Atmos. Res. 2014, 135–136, 59–75. [Google Scholar] [CrossRef]
  64. Wen, L.; Zhao, K.; Wang, M.; Zhang, G. Seasonal variations of observed raindrop size distribution in East China. Adv. Atmos. Sci. 2019, 36, 346–362. [Google Scholar] [CrossRef]
  65. Ge, R.; Ruan, Z.; Huo, Z.; Wei, M.; Li, F.; Ruan, Y. Statistical characteristics of raindrop size distribution in south China summer based on the vertical structure derived from VPR-CFMCW. Atmos. Res. 2019, 222, 47–61. [Google Scholar]
  66. Wen, G.; Xiao, H.; Yang, H.; Bi, Y.; Xu, W. Characteristics of summer and winter precipitation over northern China. Atmos. Res. 2017, 197, 390–406. [Google Scholar] [CrossRef]
  67. Niu, S.; Jia, X.; Sang, J.; Liu, X.; Lu, C.; Liu, Y. Distributions of raindrop sizes and fall velocities in a semiarid plateau climate: Convective versus stratiform rains. J. Appl. Meteorol. Climatol. 2010, 49, 632–645. [Google Scholar] [CrossRef]
  68. Minda, H.; Makino, T.; Tsuda, N.; Kaneko, Y. Performance of a laser disdrometer with hydrometeor imaging capabilities and fall velocity estimates for snowfall. IEE J. Trans. Electr. Electron. Eng. 2016, 11, 624–632. [Google Scholar] [CrossRef]
  69. Bringi, V.N.; Chandrasekar, V.; Hubbert, J.; Gorgucci, E.; Randeu, W.L.; Schoenhuber, M. Raindrop size distribution in different climatic regimes from disdrometer and dual-polarized radar analysis. J. Atmos. Sci. 2003, 60, 354–365. [Google Scholar] [CrossRef]
  70. Alhilali, M.; Lam, H.Y.; Din, J. Comparison of raindrop size distribution characteristics across the Southeast Asia region. Telkomnika 2018, 16, 2522–2527. [Google Scholar] [CrossRef]
  71. Sreekanth, T.S.; Varikoden, H.; Resmi, E.A.; Mohan Kumar, G. Classification and seasonal distribution of rain types based on surface and radar observations over a tropical coastal station. Atmos. Res. 2019, 218, 90–98. [Google Scholar] [CrossRef]
  72. Liu, D.; Yang, B.; Zhang, Y.; Qian, Y.; Huang, A.; Zhou, Y.; Zhang, L. Combined impacts of convection and microphysics parameterizations on the simulations of precipitation and cloud properties over Asia. Atmos. Res. 2018, 212, 172–185. [Google Scholar] [CrossRef]
  73. Fu, Y.; Liu, G. Possible misidentification of rain type by TRMM PR over Tibetan Plateau. J. Appl. Meteorol. Climatol. 2007, 46, 667–672. [Google Scholar] [CrossRef]
  74. Thompson, E.J.; Rutledge, S.A.; Dolan, B.; Thurai, M. Drop size distributions and radar observations of convective and stratiform rain over the equatorial Indian and West Pacific Oceans. J. Atmos. Sci. 2015, 72, 4091–4125. [Google Scholar] [CrossRef]
  75. Liu, J.; Chen, R. Discriminating types of precipitation in Qilian Mountains, Tibetan Plateau. J. Hydrol. Reg. Stud. 2016, 5, 20–32. [Google Scholar] [CrossRef] [Green Version]
  76. Liu, Y.; Ren, G.; Sun, X.; Li, X. A new method to separate precipitation phases. Hydrol. Earth Syst. Sci. Discuss. 2018, 1–38. [Google Scholar] [CrossRef]
  77. Ding, B.; Yang, K.; Qin, J.; Wang, L.; Chen, Y.; He, X. The dependence of precipitation types on surface elevation and meteorological conditions and its parameterization. J. Hydrol. 2014, 513, 154–163. [Google Scholar] [CrossRef]
Figure 1. Location and topography of the study area. (a) Location of observation sites and spatial distribution of permafrost. (b) Topography of the Qinghai–Tibet Plateau. (c) Photograph of observation devices at the Tanggula comprehensive observation field site.
Water 11 02265 g001
Figure 2. Comparison of the raindrop size distribution (DSD) and data quality control schemes in Tanggula and Naqu from July to August 2015. (ac) DSD based on original data, the empirical threshold method, and the de-extreme method in Tanggula. (df) DSD based on the original data, empirical threshold method, and de-extreme method in Naqu. The solid line indicates the V–D empirical relationship, and the dashed lines indicate the ±60% V–D relationship. The V–D relationship is the empirical fall velocity–diameter relationship of Atlas et al. [37].
Water 11 02265 g002
Figure 3. Characteristics of the raindrop size distribution (DSD) for different types of precipitation and the application of different data quality control schemes to precipitation at Tanggula. (ad) DSD of rain, sleet, snow, and hail using the original data. (eh) DSD of rain, sleet, snow, and hail using the empirical threshold method. (il) DSD of rain, sleet, snow, and hail using the de-extreme method. The V–D relationship is the empirical fall velocity–diameter relationship of Atlas et al. [37].
Water 11 02265 g003
Figure 4. Statistics of meteorological conditions observed for precipitation particles >10 mm in diameter.
Water 11 02265 g004
Figure 5. Comparison of observational results obtained by the OTT Parsivel2 instrument and other rain gauges at (a) Tanggula and (b) Wudaoliang. OTT-ori refers to the origin output recorded by the Parsivel2 instrument; OTT-cor refers to quality control of the data by the de-extreme method; T200B refers to the results observed by the Geonor T-200B rain gauges; and Chinese standard rain gauge (CSRG) refers to the results observed by Chinese standard rain gauges.
Water 11 02265 g005
Figure 6. Types of precipitation identified (a) manually and (b) by the OTT Parsivel2 instrument from July to August 2015. The yellow boxes indicate precipitation events recorded by both methods and the dark yellow boxes indicate precipitation events identified by the instrument, but not manually.
Water 11 02265 g006
Figure 7. (a) The raindrop size distribution for Tanggula in 2015. (b) Changes in the size and amount of precipitation particles.
Water 11 02265 g007
Figure 8. (a,b) Variation in particle concentration with size and (c) amount of accumulated precipitation with rain rate for different rainfall rates at Tanggula and Wudaoliang.
Water 11 02265 g008
Figure 9. (a) Relationship between temperature and the occurrence of rain, sleet, snow, and hail at Tanggula. (b) Relationship between the dewpoint and the proportion of rain, sleet, snow, and hail in precipitation at Tanggula.
Water 11 02265 g009
Table 1. Measurement contents and instruments.
Measurement ContentInstruments/NumberSampling Interval
PrecipitationOTT Parsivel2 by OTT Hydromet GmbH, Germany/160 s
Geonor T–200B by Norway/130 min
CSRG by China/11 day
Wind speedRM Young 05103 series wind speed and direction sensors by Campell GmbH, USA/130 min
Air temperatureHMP45C temperature and humidity sensor by Vaisal GmbH, Finland/130 min
Relative humidity30 min
Table 2. Geographical location and measurement time series of the observation sites.
Observation SitesLatitude (°)Longitude (°)Altitude
(m)
DisdrometerTime SeriesSamples
(minutes)
Accumulated Precipitation (mm)
Tanggula32.5891.865100OTT Parsivel21/1/2015–31/12/20156834439
Wudaoliang35.2291.084783OTT Parsivel21/1/2015–30/9/20157281440
Naqu31.2992.044508OTT Parsivel15/7/2015–30/8/201581320.3

