Impacts of Emerging Agricultural Practices on Groundwater Quality in Kahe Catchment, Tanzania


1
School of Material Energy Water and Environmental Science (MEWES), Department of Water Environmental Science and Engineering (WESE), The Nelson Mandela African Institution of Science and Technology, P.O. Box 447 Arusha, Tanzania
2
Water Infrastructure and Sustainable Energy Futures (WISE–Future), The Nelson Mandela African Institution of Science and Technology, P.O. Box 9124 Arusha, Tanzania
3
Department of Civil Engineering, Ardhi University, P.O. Box 35176 Dar es Salaam, Tanzania
*
Author to whom correspondence should be addressed.
Water 2019, 11(11), 2263; https://doi.org/10.3390/w11112263
Submission received: 3 July 2019
/
Revised: 14 August 2019
/
Accepted: 28 August 2019
/
Published: 28 October 2019
(This article belongs to the Special Issue Groundwater Resources Management: Reconciling Demand, High Quality Resources and Sustainability)
Abstract
:This paper assesses the impacts of farmers’ intensive use of agrochemicals (fertilizers and pesticides) on groundwater quality in the Kahe catchment. Samples were collected during the wet and dry seasons of the year 2018 and analyzed for the presence of agrochemicals in the water. Groundwater chemistry was dominated by magnesium-sodium-bicarbonate (Mg-Na-HCO3−). The cations levels were in the trend of Mg2+ >Na+ > Ca2+ > K+, whereas anions were HCO3− > Cl− > SO42− for both seasons. The NO3− had an average value of about 18.40 ± 4.04 and 7.6 ± 1.7 mg/L in the wet and dry season, respectively. Elevated levels of nitrate, sulfate, phosphate, and ammonium were found in water samples collected near the large-scale sugarcane plantation in the catchment. For both seasons, Pb, Cd, Fe, Mn, Zn and Cu concentrations averaged approximately 0.08 ± 0.03, 0.11 ± 0.03, 0.16 ± 0.02, 0.11 ± 0.01, 0.46 ± 0.05, and 0.55 ± 0.02 mg/L, respectively. On the other hand, the concentrations were higher in shallow wells than in the deep boreholes. Pesticides’ residues were below the detection limit in all sampled groundwater. The findings from this study provide important information for intervention in groundwater quality management in Kahe Catchment, Tanzania.
1. Introduction
Groundwater is a vital water supply source to a community for different purposes in many sub-Saharan Africa countries [1]. It acts as an improved water supply in urban and rural areas so as to cope with surface water scarcity [2]. However, anthropogenic activities including agricultural practices, industrial effluents and inappropriate waste disposal on the land surface are considered to be major sources of groundwater pollution [3,4,5]. Recently, in agricultural fields, intensive use of agrochemicals (fertilizers and pesticides) have gradually increased in crop production worldwide [6]. To grow crops, large- and small-scale farmers use agrochemicals to increase their crop yields. As a result, they have increased their rates of fertilizers and pesticides applications, which could be impacting the groundwater quality. However, groundwater quality depends on different factors such as geological formation, soil type/soil permeability, the depth to the water table, the amount of rain and the hydraulic conductivity of the aquifer, and solubility of the rock materials within the aquifer system [7].
Degraded groundwater quality may present a public health risk given that the water is also being used by the households for their domestic needs. Globally, the use of fertilizers and pesticides is far higher than in Sub-Saharan Africa. For instance, the average application rate of fertilizers is reported to be about 19.3, 100 and 20 kg N/ha in Tanzania, Kenya and South Africa, respectively [8], while the global average is 220 kg N/ha [9]. The main risk of the increased application of agrochemicals by farmers arises from the apparent lack of knowledge on how, when, and what quantity to be used for a particular crop. It is likely that fertilizers and pesticides are being leached into groundwater systems through the intensification of irrigation and rainfall intensity [6,10]. Globally, this contributes about 70% of groundwater pollution [11], as several studies have shown in different parts of the world [10,12,13]. For instance, Rui et al. [14] argue that intensive fertilizer use has become one of the major sources of heavy metal contamination in groundwater around the agricultural areas. Numerous studies have reported on elevated levels of heavy metals in groundwater in agricultural fields in different parts such as in South West Bank, Palestine [15], in Lagos, Nigeria [16], in Hail region, Saudi Arabia [17], in Keko and Kigogo, Tanzania [18]. These include Pb, Zn, As, and Ni derived from inorganic fertilizers [19,20], or cadmium which is found in phosphate fertilizer [21,22,23]. Excessive use of the N-fertilizers is, therefore, a major source of groundwater nitrate pollution [13,24]. High levels of nitrate can lead to adverse impacts on human health such as methemoglobinemia for young children [24]. Past studies in Kahe catchment have concluded that the groundwater quality is still good [25,26], but recently reported agricultural land expansion in the catchment [26,27,28,29], increasing groundwater-based irrigation, may have impacted the water source. It is not yet well understood how the emerging use of fertilizers in the area contributes to nitrate pollution in groundwater. There is also limited information on the impacts of fertilizer use around agricultural fields in groundwater in the Kahe catchment.
Pesticides application has gradually increased in the agricultural fields in Tanzania; about 81% of pesticides are used in the livestock and agricultural area [6]. When the pesticides are used in areas with intensive irrigation or rainfall intensity, it is possible that they percolate through the soil and directly into groundwater [30]. According to Vrba [31], pesticides in groundwater are found in more than 20% to 25% of the agricultural areas in the Netherlands. In Tanzania, following mishandling at Vikuge farm (Kibaha), high levels of hexachlorocyclohexane (HCH) and dichlorodiphenyltrichloroethane (DDT) were recorded in sampled groundwater [32]. When pesticides surpass the recommended drinking water standards, they are linked to human health risks [33]. In the lower part of the Kahe catchment in northern Tanzania, one of the farms with intensive use of pesticides is Tanganyika Planting Company (TPC) for sugarcane plantation [34]. In Tanzania, several studies have reported pesticide pollution in surface water, soils and sediments [35,36,37,38]. For example, in the TPC farm area, about 90% of organochlorine pesticides were dominant in the soil [38]; while aldrin, dieldrin, heptachlor epoxide, HCH, endosulfan, and DDT were detected in surface water [39]. However, there is limited information regarding the presence of pesticide residues in groundwater.
In this study, it is examined whether the intensive agricultural practices through the use of fertilizers and pesticides to increase crop production is impacting groundwater quality in Kahe catchment. This area is well known for large scale irrigators such as TPC for sugarcane plantation, as well as small scales such as paddy rice, coffee, bananas, maize, onions, tomatoes, horticulture, and vegetables, which are all reliant on groundwater for crop irrigation. Groundwater samples collected from the area were analyzed for major dissolved cations, major dissolved anions, heavy metals, and pesticides. The findings provide useful information for sustainable management of the water resources in the Kahe catchment, as well as for future monitoring programs of the groundwater resources in the Pangani basin as a whole.
2. Materials and Methods
2.1. Study Area Description
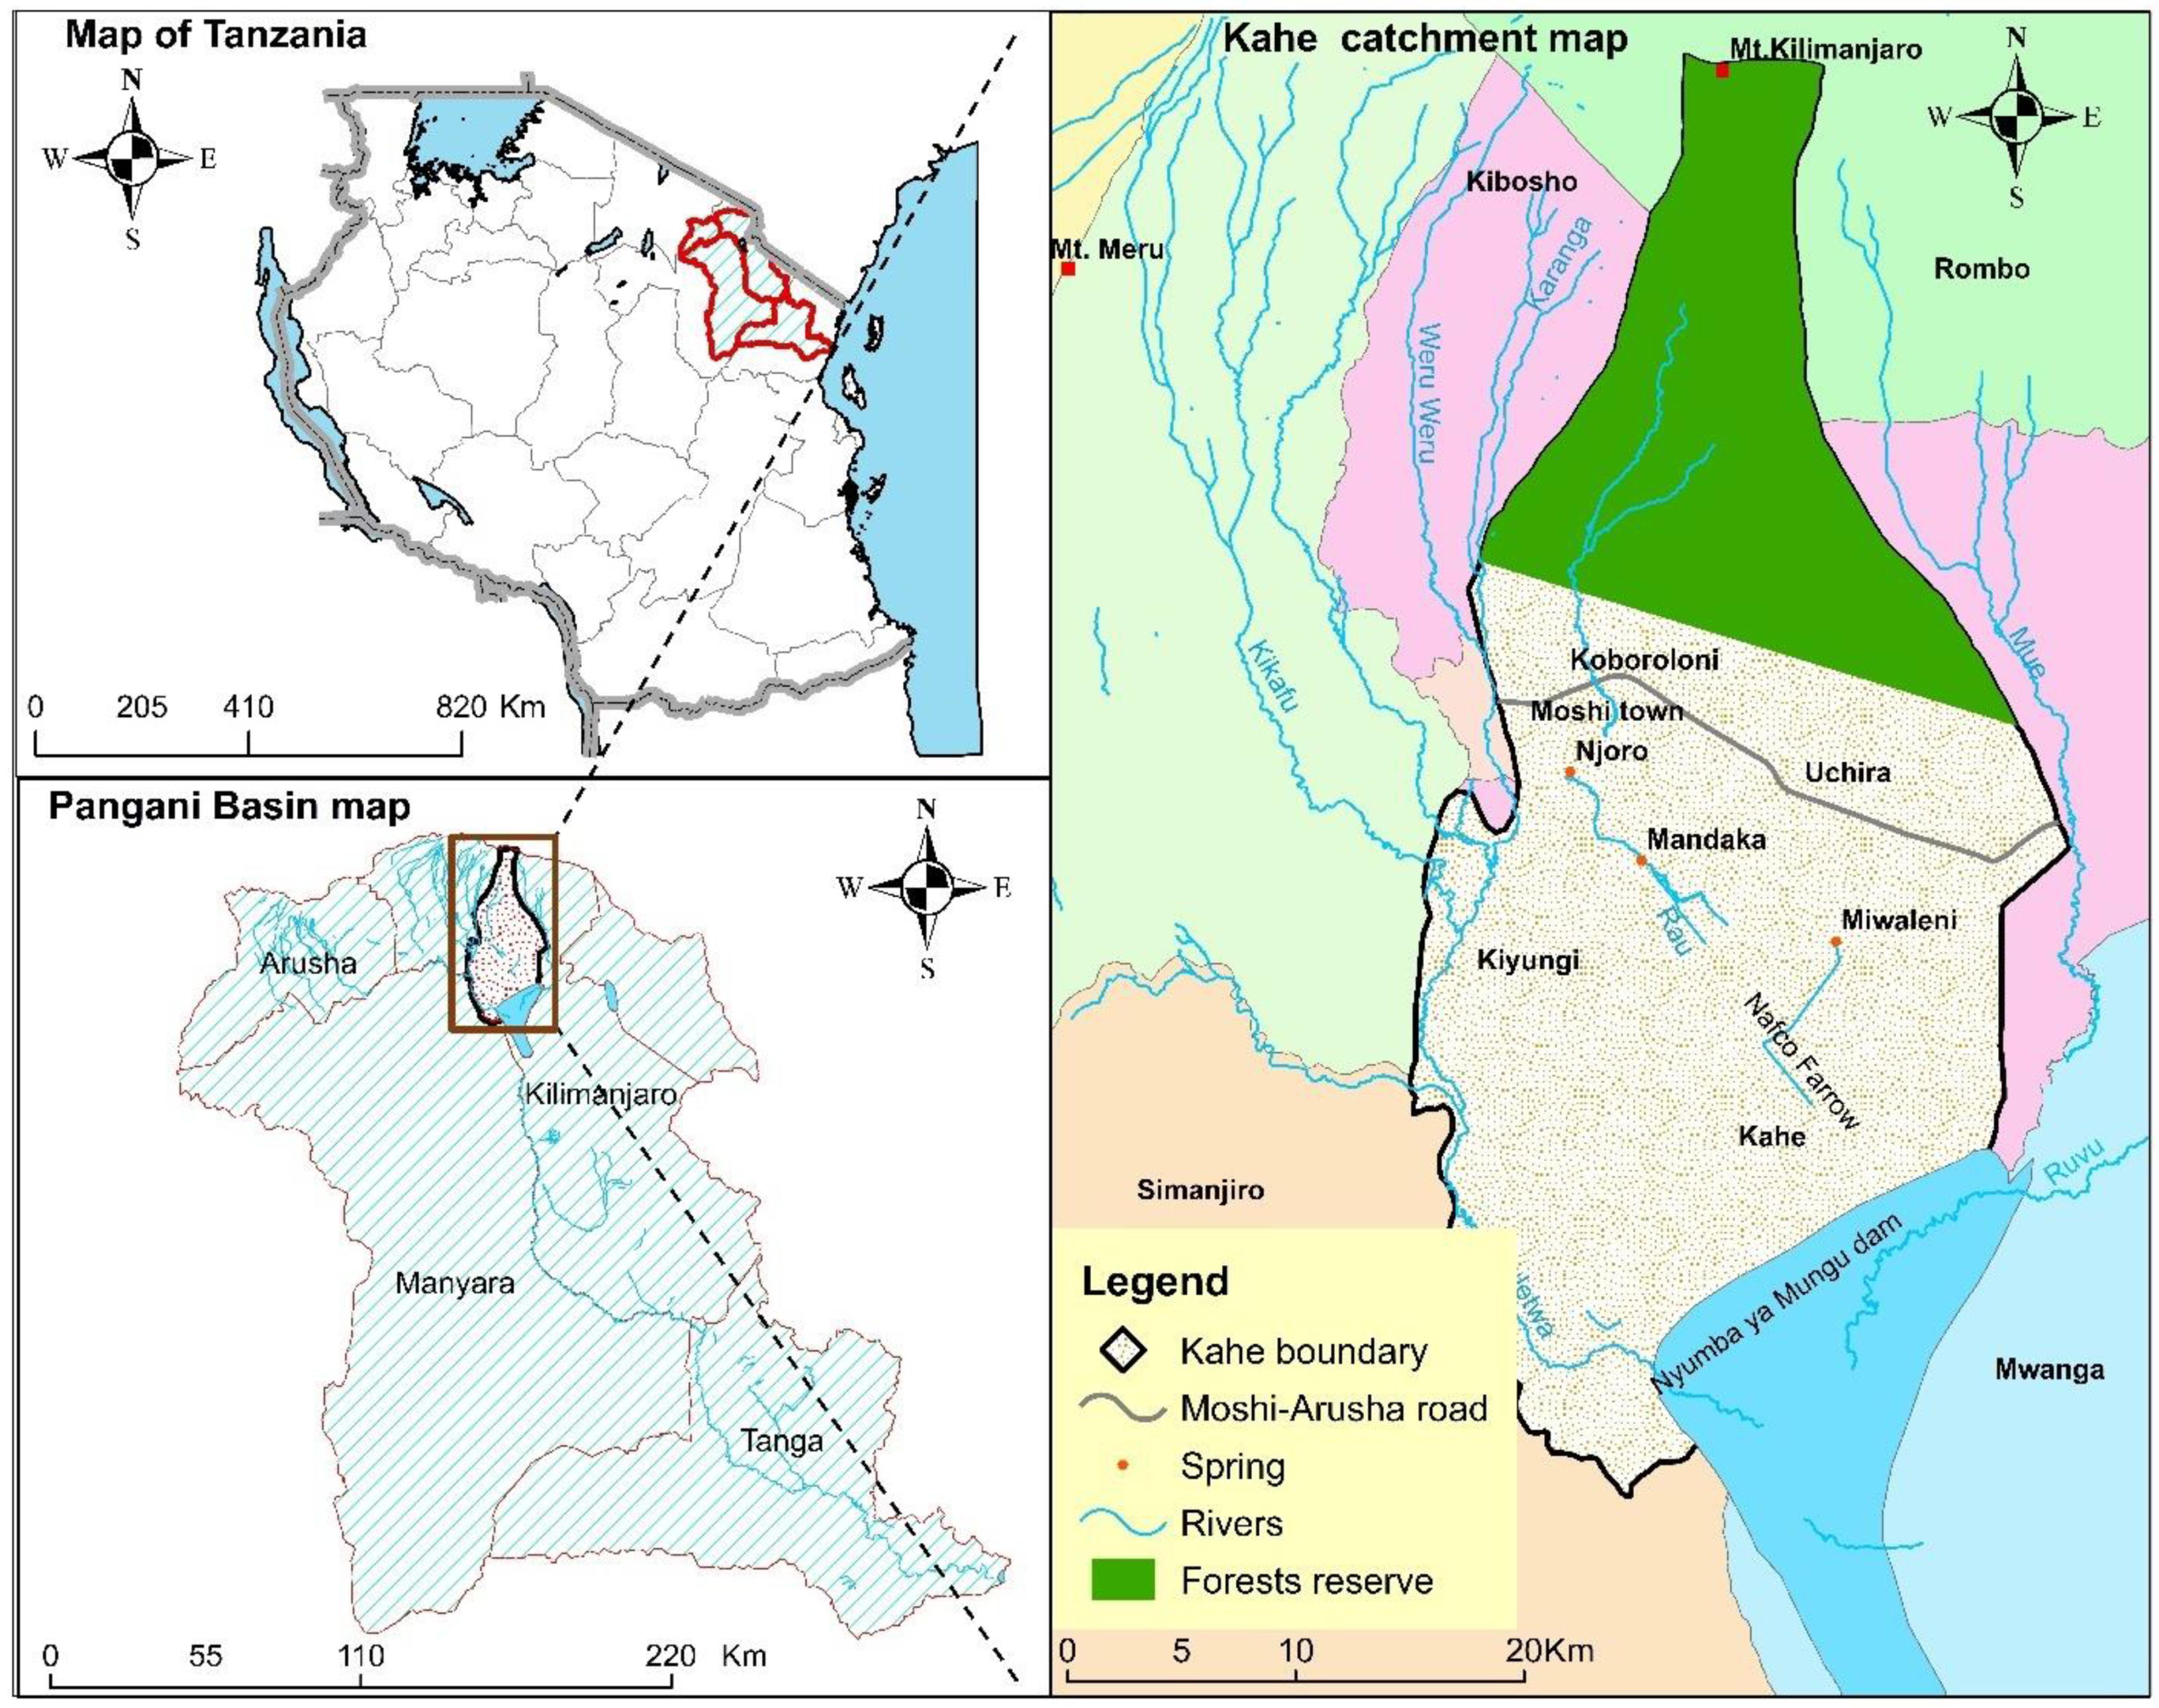
Kahe catchment is one of the sub-catchments of the Pangani Basin located on the southern slopes of Mt. Kilimanjaro, in northern Tanzania (Figure 1). It has a total area of approximately 1038 km2 [26]. The uppermost part of the catchment starts on the slopes of Mt. Kilimanjaro and ends at Nyumba ya Mungu dam. Meanwhile, the eastern and western part of the catchment is bounded by the Rombo and Hai districts, respectively. The area is characterized by semi-arid to Savannah climate and regulated by the intertropical convergence zone [26]. It receives a bi-modal rainfall with two peaks in March–June (long rain) and November−December (short rain). The annual rainfall on the southern slope of Mt. Kilimanjaro varies with altitude where the maximum total rainfall of about 3000 mm/year occurs at an altitude above 2100 m amsl [40]. The lower elevation plains which are located below 1100 m amsl receive approximately 500−800 mm/year [40], while in the mid-level altitude of Mt. Kilimanjaro rainfall ranges from 1000 to 2000 mm/year [40]. The higher amount of annual rainfall occurs in the upper zone covered by natural dense forests. The annual air temperature in the catchment ranges from 15−36 °C, with June−August being the coldest months (15−23 °C) and January−February being the hottest months (32−35 °C) [26]. Furthermore, temperature decreases with increasing altitude where the mean annual temperature is 23.4 °C at an altitude of 813 m amsl, and 5.0 °C at 4000 m amsl [41].
The area is drained by several rivers including Karanga, Kikafu, Rau, Weru Weru, and Kikuletwa originating from the upper slopes of Mt. Kilimanjaro and Mt. Meru located in Arusha region (Figure 1). The rivers provide an estimated inflow to Nyumba ya Mungu dam of about 35–43 m3/s [29], and a dam has a storage capacity of 870 million m3 which supplies hydropower a total of 95 Megawatt (MW) in Tanzania [42]. The area above 1800 m amsl is reserved as natural forest zone and Kilimanjaro National Park (Figure 1), while human settlements and intensive agricultural practices based irrigation are in the lower elevation plains (900–1800 m amsl) [42]. The population growth, as well as the government and farmers investment in irrigated agriculture such as the lower Moshi irrigation scheme by Japan International Cooperation Agency (JICA), have contributed to the agricultural land expansion in the lower elevation plains of the Kahe catchment.
2.2. Geological and Hydrogeological Setting
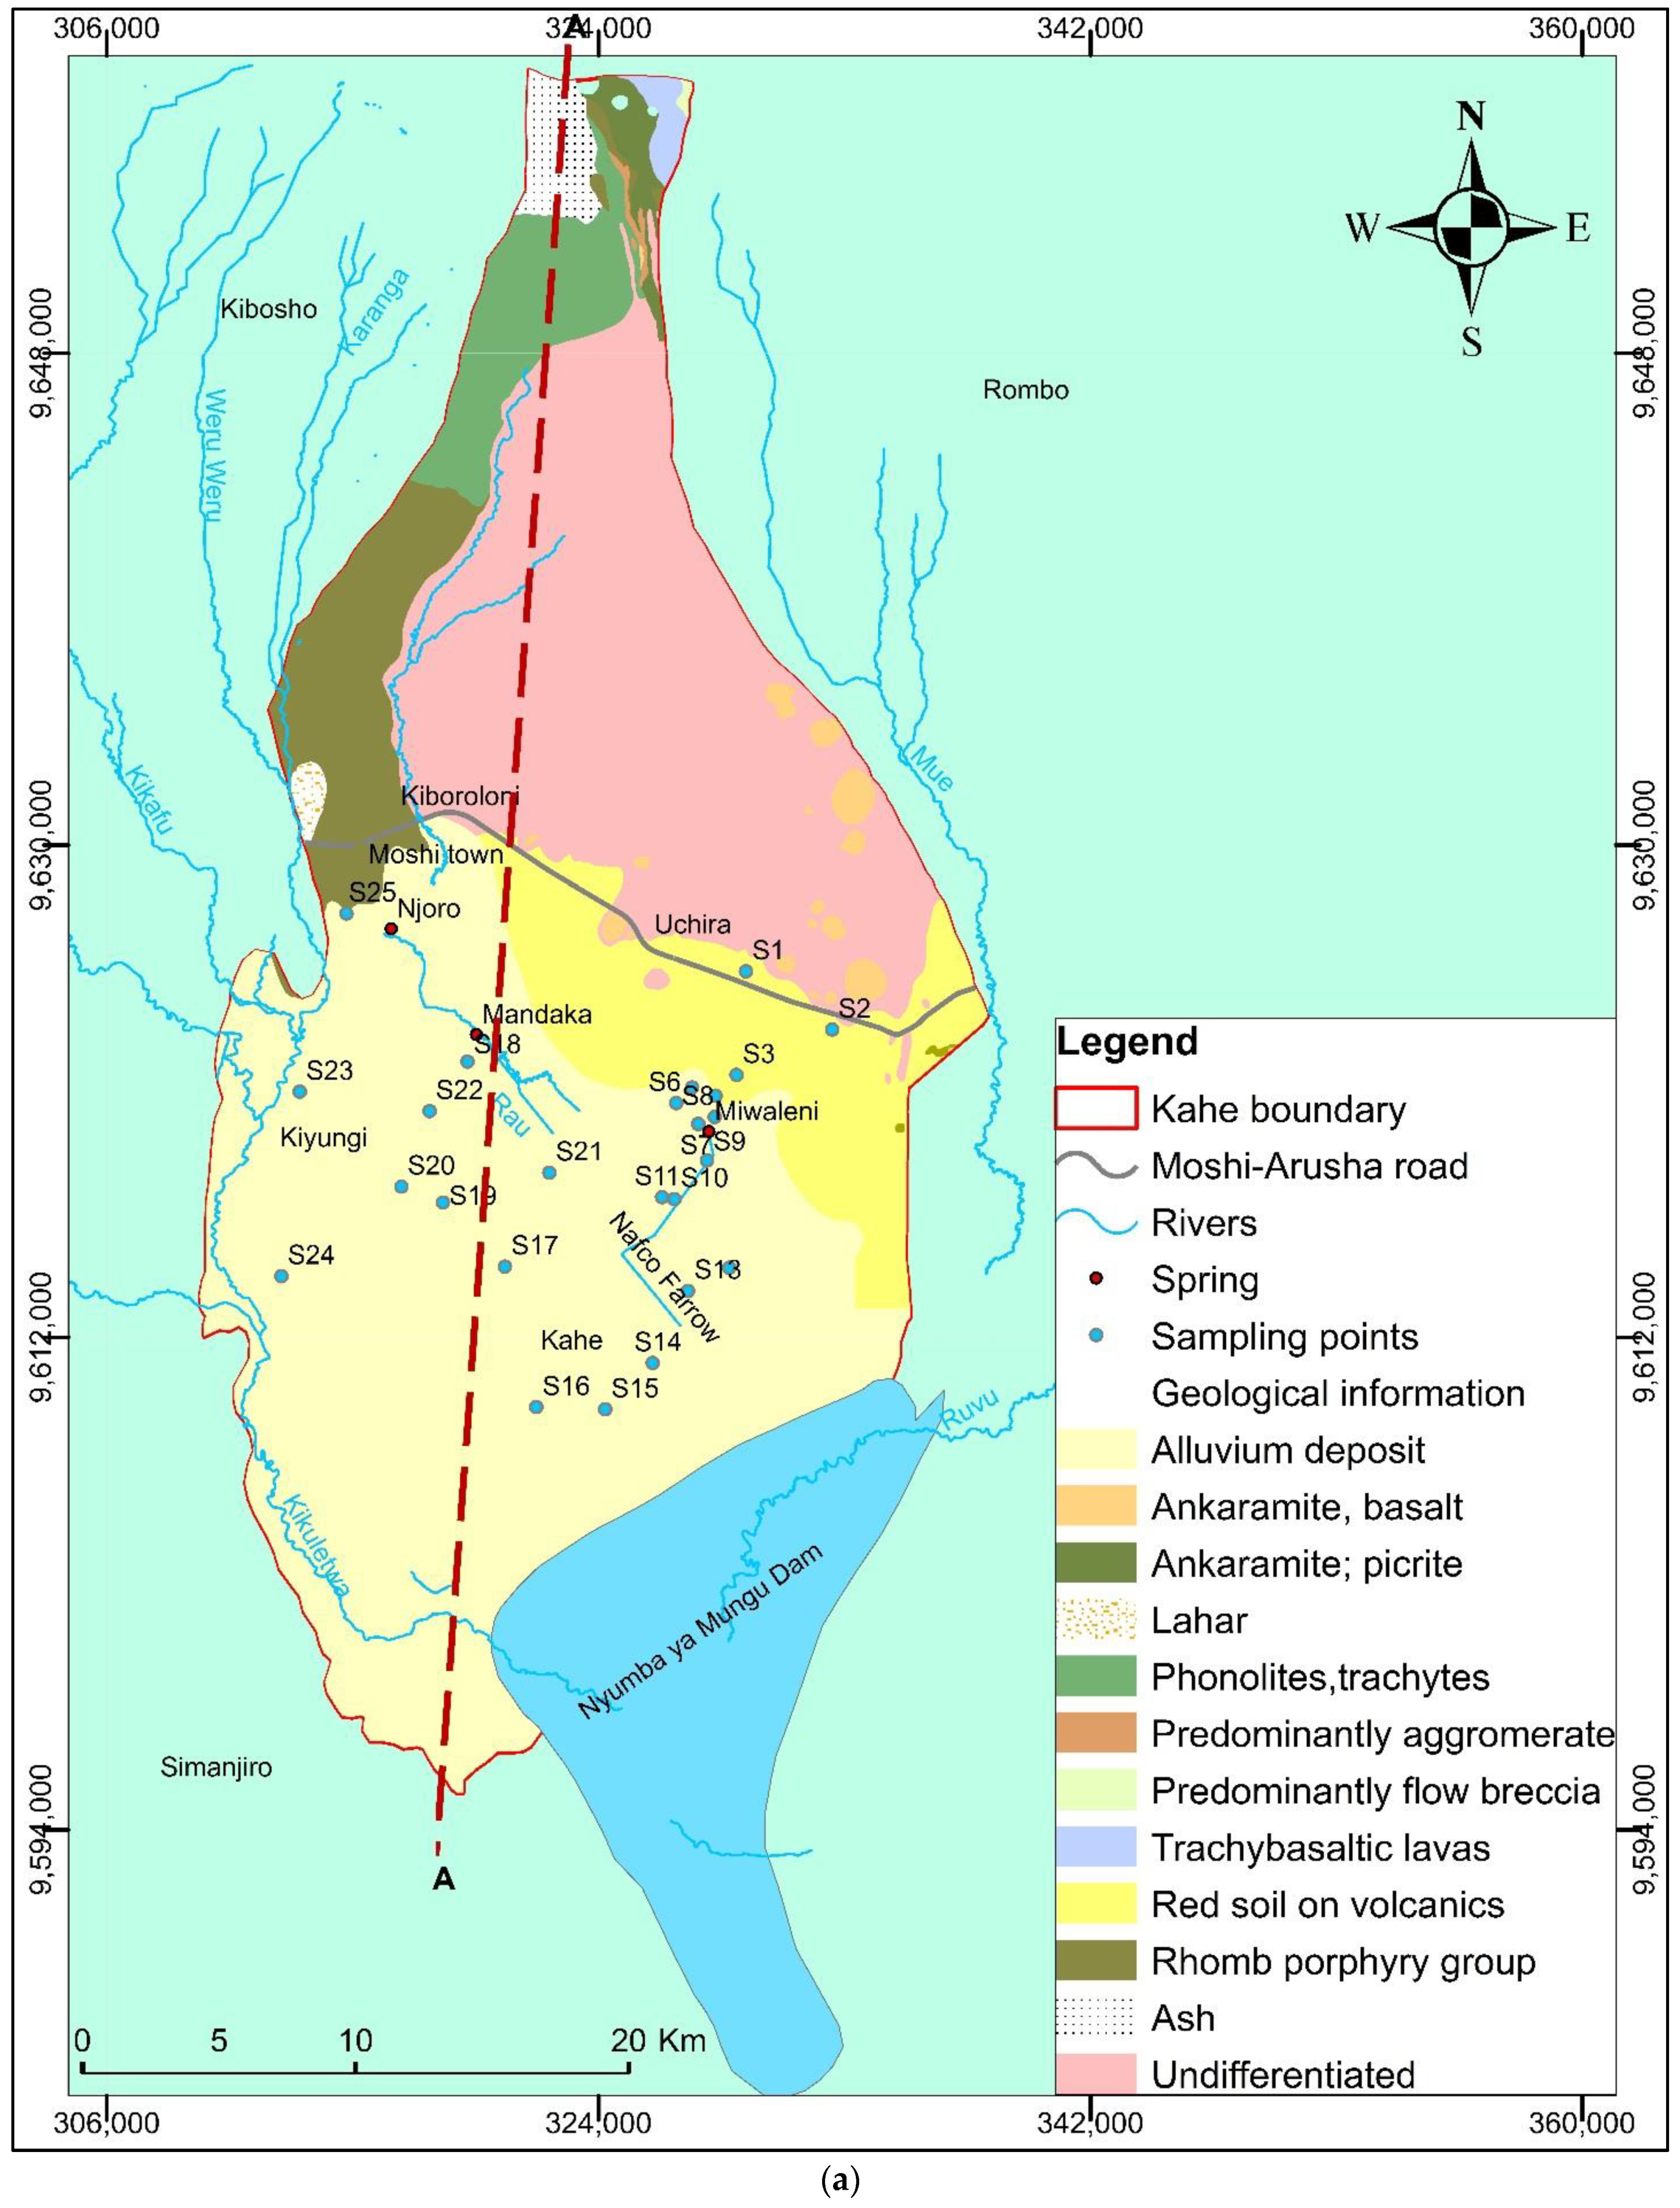
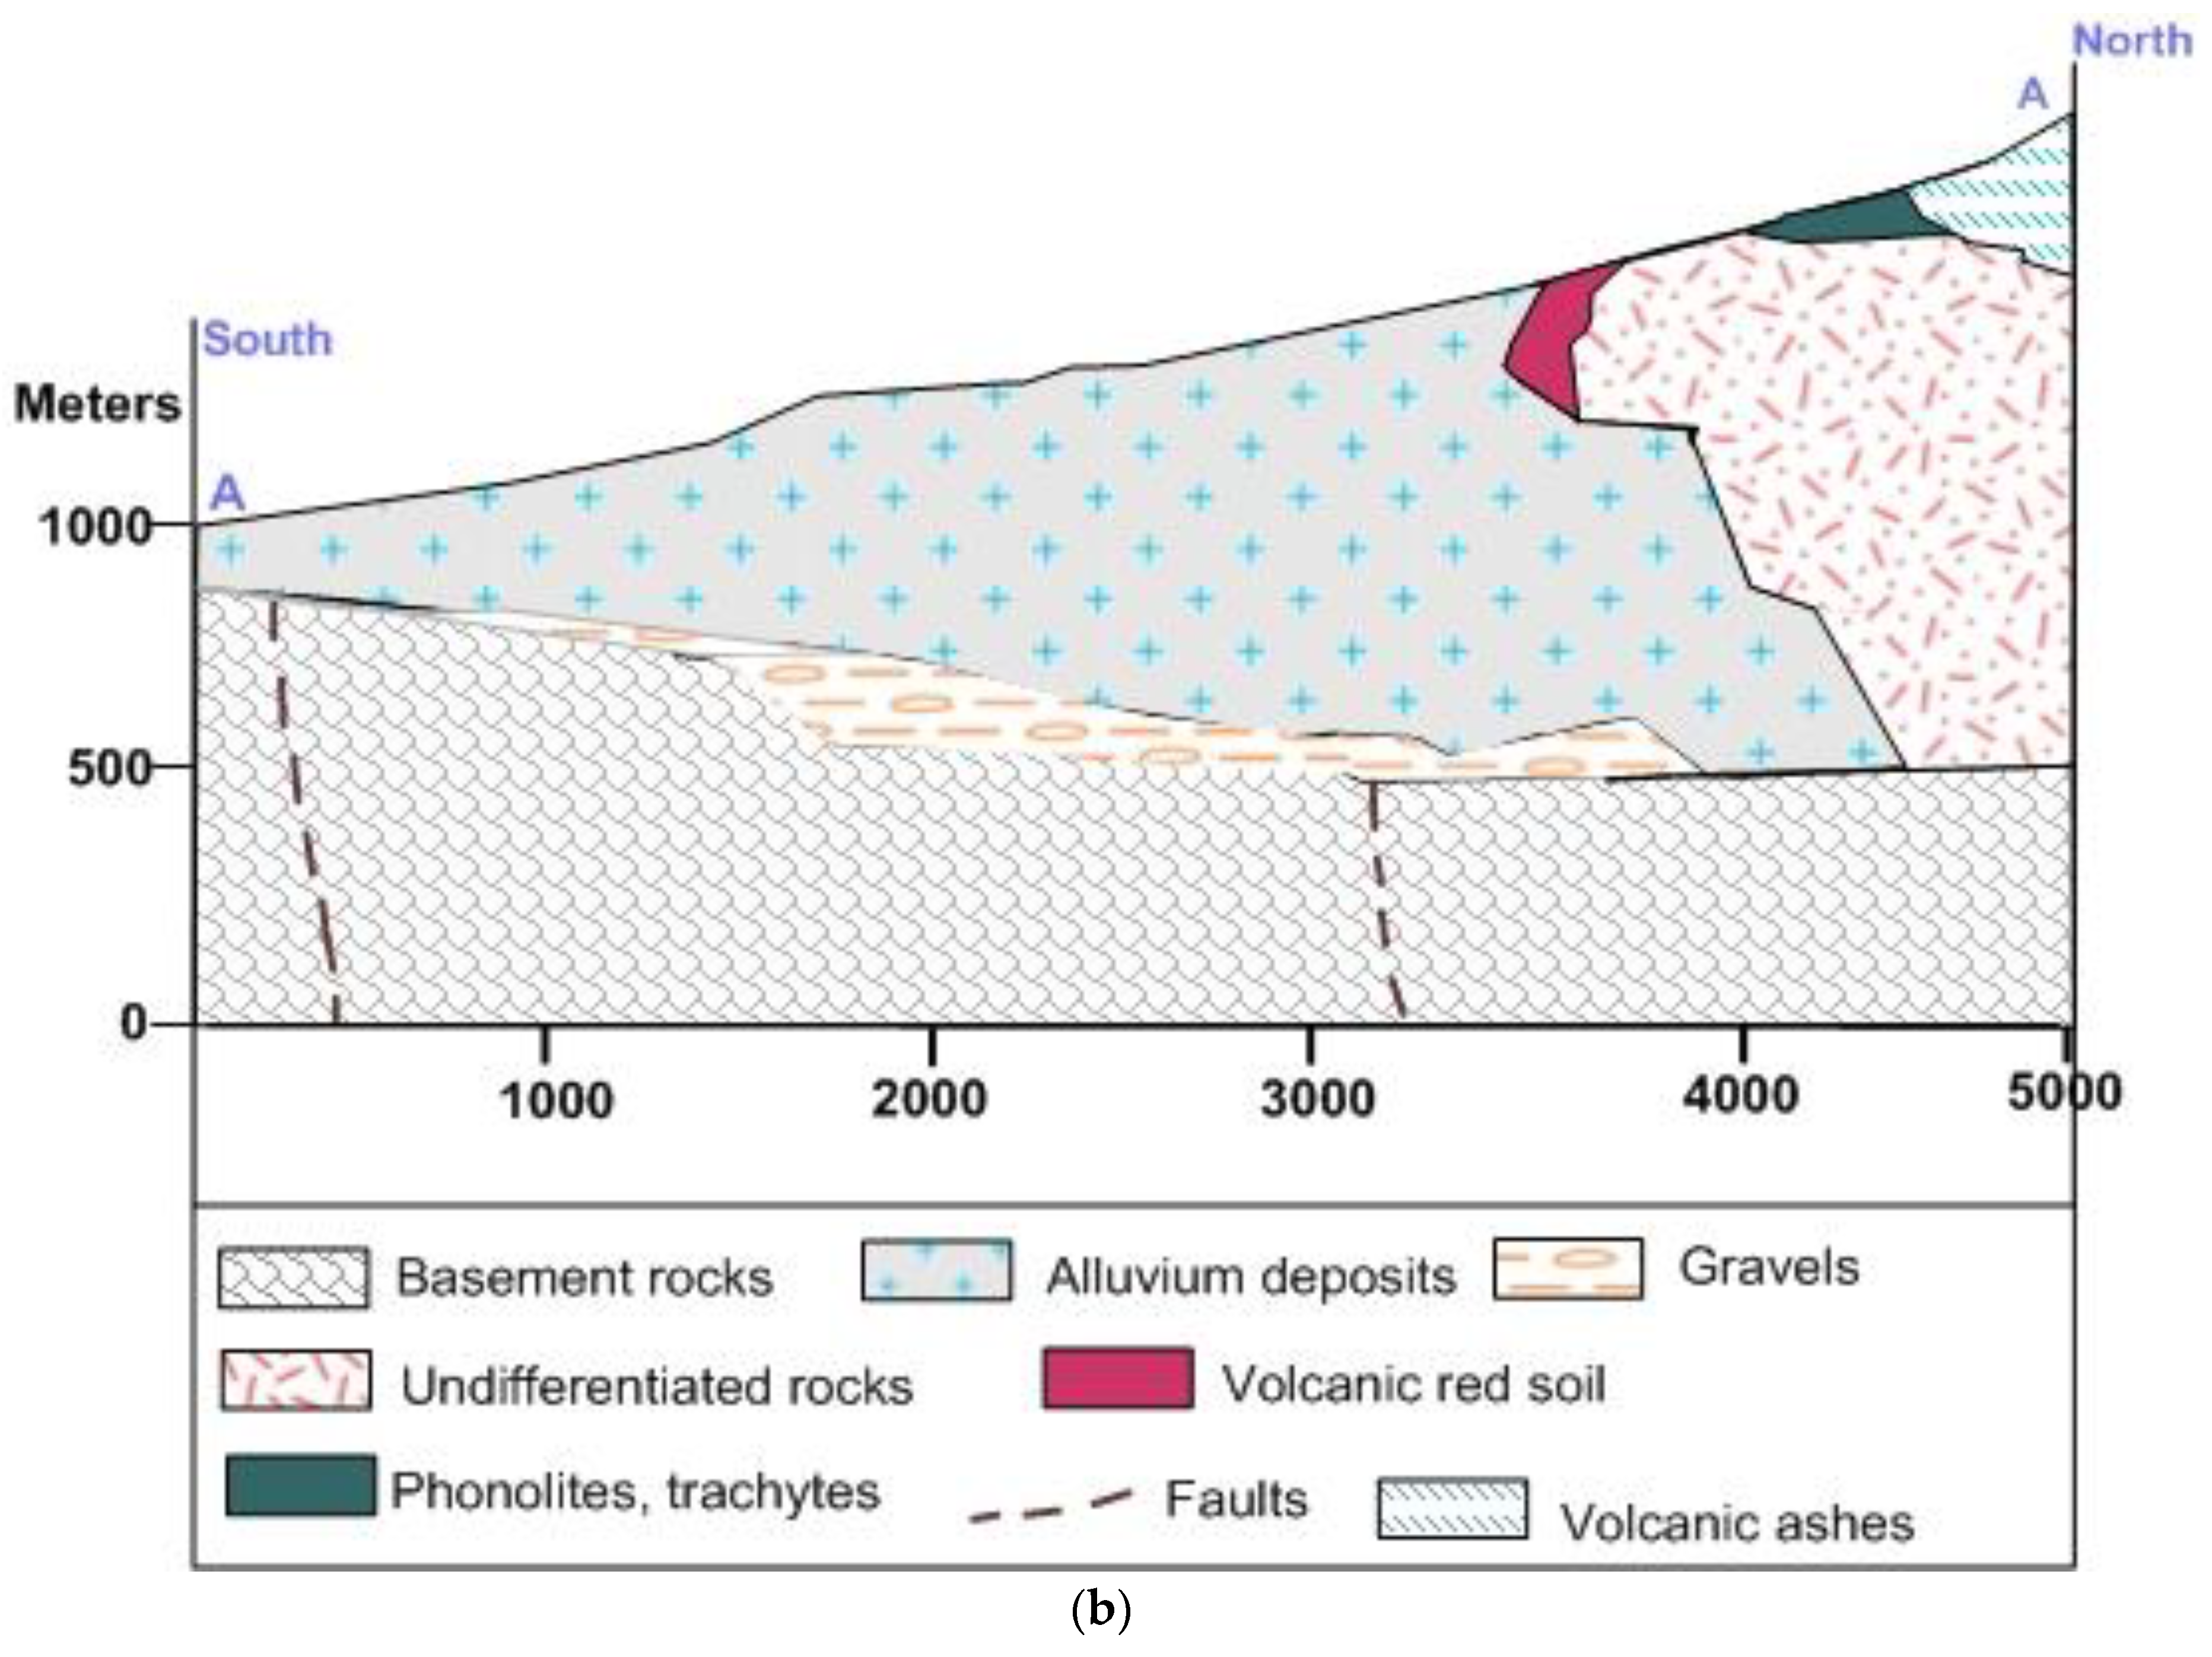
The geological formation of the catchment starting from the center to the southern part of Moshi town is studded by quarternary superficial deposits of alluvium and Neogene superficial deposits of volcanic red soil derived from weathering of volcanic rock materials (Figure 2a). Mount Kilimanjaro is the major source of the volcanic activities in the Kahe catchment. These volcanic rocks are chiefly olivine, alkali basalts, phonolites, trachytes, nephelinites, and pyroclastics [43]. The alluvium deposits predominantly comprised sand, gravel, and clay, along with cancerous deposits with volcanic lava (basalts, trachytes) and pyroclastic volcanic rocks [26]. The cross-section showed that the layers are mostly unconsolidated (Figure 2b), its thickness is approximate >200 m at the center and becomes thicker towards north-east (NE) and shallow in the south near Nyumba ya Mungu dam [26]. The eastern part of the catchment, particularly north-east (NE) of Moshi-Arusha road, is covered by undifferentiated Neogene volcanic rocks (tertiary) that are related to the Shira eruptions. Shira volcanic eruptions produce volcanic rocks such as olivine, alkali basalts, trachybasalt, trachyandesite, basanite, and nephelinite, whereby they contain a wide variety of gravels materilas [26]. The western part is covered by Neogene phonolitic and trachytic rocks related to the Kibo and Mawenzi eruptions. The volcanic lavas (i.e., rhomb porphyry and trachyandesite group) were transported downward by rivers (Kikuletwa and Mue rivers) and deposited in the lower elevation plains. The Neogene volcanic rocks of rhomb porphyritic group including Penck rhomb porphyr and Weru Weru agglomerates extend towards the peak of Mt. Kilimanjaro (Figure 2a).
Kahe catchment is characterized as a fissured (residual soils on volcanic, undifferentiated rocks) and fractured volcanic hydrogeological aquifer [26]. Figure 2b shows that its formation was associated with limited faults which makes the basement rocks impermeable for a groundwater flow system [29]. Also, volcanic ashes and sedimentary formations, particularly fine-grained alluvium deposits, are characterized by low transmissivity which becomes practically impervious [44]. Groundwater recharge mainly takes place in high elevation on the slopes of Mt. Kilimanjaro along fractured formations as well as through infiltration. It has high conductivities, generally low groundwater tables, moderate topography, and porous aquifer media [26]. Groundwater potentiality in the fractured formation is also supported by a number of springs around the fault zone (Figure 2a). For instance, the area has the largest spring (Miwaleni spring) with a constant flow of 3–4 m3/s [29], and the smallest springs including Mandaka and Njoro springs (Figure 2). The groundwater bearing formation lies between 2 and 60 m depths and deep wells had >100 m depth [26]. However, reliable information is required to demarcate the geometry of the aquifer; the wells used had limited hydrogeological data (well logs, depth, and specific yield) in the study.
2.3. Methods
2.3.1. Fieldwork and Groundwater Sampling
A handled global positioning system (GPS) device (Garmin Etrex 30xJ) was used to map the location of sampled shallow wells and the deep boreholes in the study area. A total of 25 wells were sampled: n = 4, deep boreholes with depth >100 m, and n = 21, shallow wells with depth <30 m (Figure 2a). Most of the shallow wells for irrigation are concentrated in the lower plains (900–1800 m amsl), where intensive agriculture is practiced by large and small scale farmers. The samples were collected during April–May 2018 (wet season) and September–October 2018 (dry season) in the study area. The groundwater samples were not collected in site locations above 1800 m amsl, the area characterized as natural forest zone and Kilimanjaro National Park (Figure 1).
The preliminary in-situ measurements of temperature, pH value, electrical conductivity, dissolved oxygen, and total dissolved solids were performed using multi-parameter HANNA instrument, Model HI 9828. The multi-parameter was calibrated before the measurement of the in-situ physical parameters using standard procedures recommended by the manufacturers [45].
Groundwater samples in open shallow wells were collected at least 50 cm below the water table using a bottle sampler, whereby, in closed deep boreholes the mixed water was collected after pumping for more than 20 minutes [46]. Groundwater samples were collected in clean 1 L HDPE plastic bottles for major ions analysis. For major ions and heavy metals including sodium (Na+), potassium (K+), magnesium (Mg2+), calcium (Ca2+), iron (Fe2+), zinc (Zn2+), lead (Pb2+), copper (Cu2+) cadmium (Cd2+) and manganese (Mn2+) water samples were collected in clean 1 L HDPE plastic bottles and acidified using concentrated nitric acid, HNO3 to a pH less than 2.0 [47]. Pesticides residue analysis water samples were collected using 1 L glass bottles and covered by black plastics to avoid rapid degradation due to a physical condition such as temperature and light intensity [48]. All samples were stored in a cool box containing frozen icepack and later transferred to the refrigerator at 4 °C at the laboratory.
2.3.2. Laboratory Analyses
(i) Major Cations and Trace Heavy Metals
All major cations Na+, K+, Mg2+, Ca2+ and heavy metals Cu2+, Fe2+, Cd2+, Pb2+, Zn2+, and Mn2+ were analyzed using atomic absorption spectrometer (AAS) PerkinElmer Analyst 100, in accordance with Standard Method for Examination of Water and Wastewater [47], to determine the concentration of each element in the sampled groundwater.
(ii) Major Anions
The concentrations of sulfate, nitrate, phosphate, and ammonium were determined according to the respective specified methods [49]: sulfate (SulfaVer 4 method) with SulfaVer 4 reagents, nitrate (cadmium reduction method) using Nitra Ver 5 Reagent, phosphate (ascorbic acid method) with Phos Ver 3 powder pillow, NH4+ (salicylate method) using ammonia salicylate and ammonia cyanurate reagent powder pillow. The HACH DR 2800 spectrophotometer was set and run at a specified shaking and reaction time as well as wavelength.
Bicarbonate (HCO3−) and carbonate (CO32−) were determined by titration method using standard sulfuric acid and Bromocresol green indicator solution [44]. Chloride (Cl−) content was determined by argentometric titration method using standard silver nitrate (AgNO3) titrant and potassium chromate indicator solution. Fluoride content was determined by the ion-selective electrode (ISE) method. These methods were realized in accordance with the Standard Method for Examination of Water and Wastewater [47].
(iii) Extraction of the Pesticides Samples
Unfiltered water samples were extracted by liquid–liquid extraction method (LLE) as described by [50]. About 500 mL of water samples were quantitatively transferred to a 0.5 L separating funnel and the bottle rinsed with ~30 mL of dichloromethane and combined with the water sample in the separating funnel. The combined contents were then successively extracted with dichloromethane three times (1 × 30 mL, 1 × 30mL, and 1 × 40 mL) with a total of 100 mL. The organic layer was filtered through a plug of cotton wool topped with anhydrous sodium sulfate Na2SO4 (~30 g) for drying and removing the impurities [50]. The combined extracts were concentrated in vacuo at 40 °C, and the final extract was made up in 2 mL ready for analysis using Gas Chromatography Mass Spectrometer (GC-MS).
2.3.3. Quality Assurance
Quality assurance was achieved by (i) calibration and verification of all instruments/equipment used, (ii) standardization and or checking efficiency and efficacy of all chemicals and reagents used, (iii) proper sampling and sub-sampling procedures (e.g., shaking) to ensure homogeneity of test samples [46], (iv) use of quality control samples prepared from certified reference materials, (v) determination of triplicate samples during on-site analysis and in-house analysis [47]. Data check accuracy for major constituents were computed by cations–anions charge balance [51].
2.3.4. Statistical Analysis
The statistical analyses were performed using Origin Pro 9.0 Lab software. The technique helps to understand the significant correlation of different parameters in a sampled groundwater by developing the correlation coefficients matrix. One-way analysis of variance (ANOVA-single factor) statistical test was used to compare all measured variables between a dry and wet season in Origin Pro 9.0 Lab software. For comparison, Alpha (α) = 0.05 is used to test for significance between the measured parameters in the wet season and dry season. Difference of the means is significant (p < 0.05) or not significant (P > 0.05). Multivariate statistical analysis technique, such as cluster analysis (CA) and principal components analysis (PCA), was performed using Paleontological Statistics (PAST) Software Package, Version 3.08 [52]. The technique was employed to understand the relationship between variables from different sampling sites and their relevance with respect to groundwater quality. Cluster analysis helps in grouping objects into classes (clusters) on the basis of similarities within a class and dissimilarities between different classes [53]. Moreover, to understand groundwater-chemistry composition for both shallow dug wells and deep boreholes in the wet and dry seasons, the analyzed sampled groundwater were plotted on the trilinear diagram as developed by Piper [54]. Basically, the trilinear piper diagram was designed for categorizing groundwater on the basis of chemical composition, and to compare chemical trends among different aquifer systems [51].
3. Results and Discussion
The complete sampled groundwater results for the wet season and dry season are presented in Table A1 and Table A2, respectively. The analyzed groundwater parameters were compared to the recommended allowable drinking water Tanzanian Bureau of Standard [55] and international guidelines by WHO [24]. The summary of statistics including minimum, maximum, mean and standard deviation (SD) of the sampled groundwater are presented in Table 1.
3.1. Multivariate Cluster Analysis
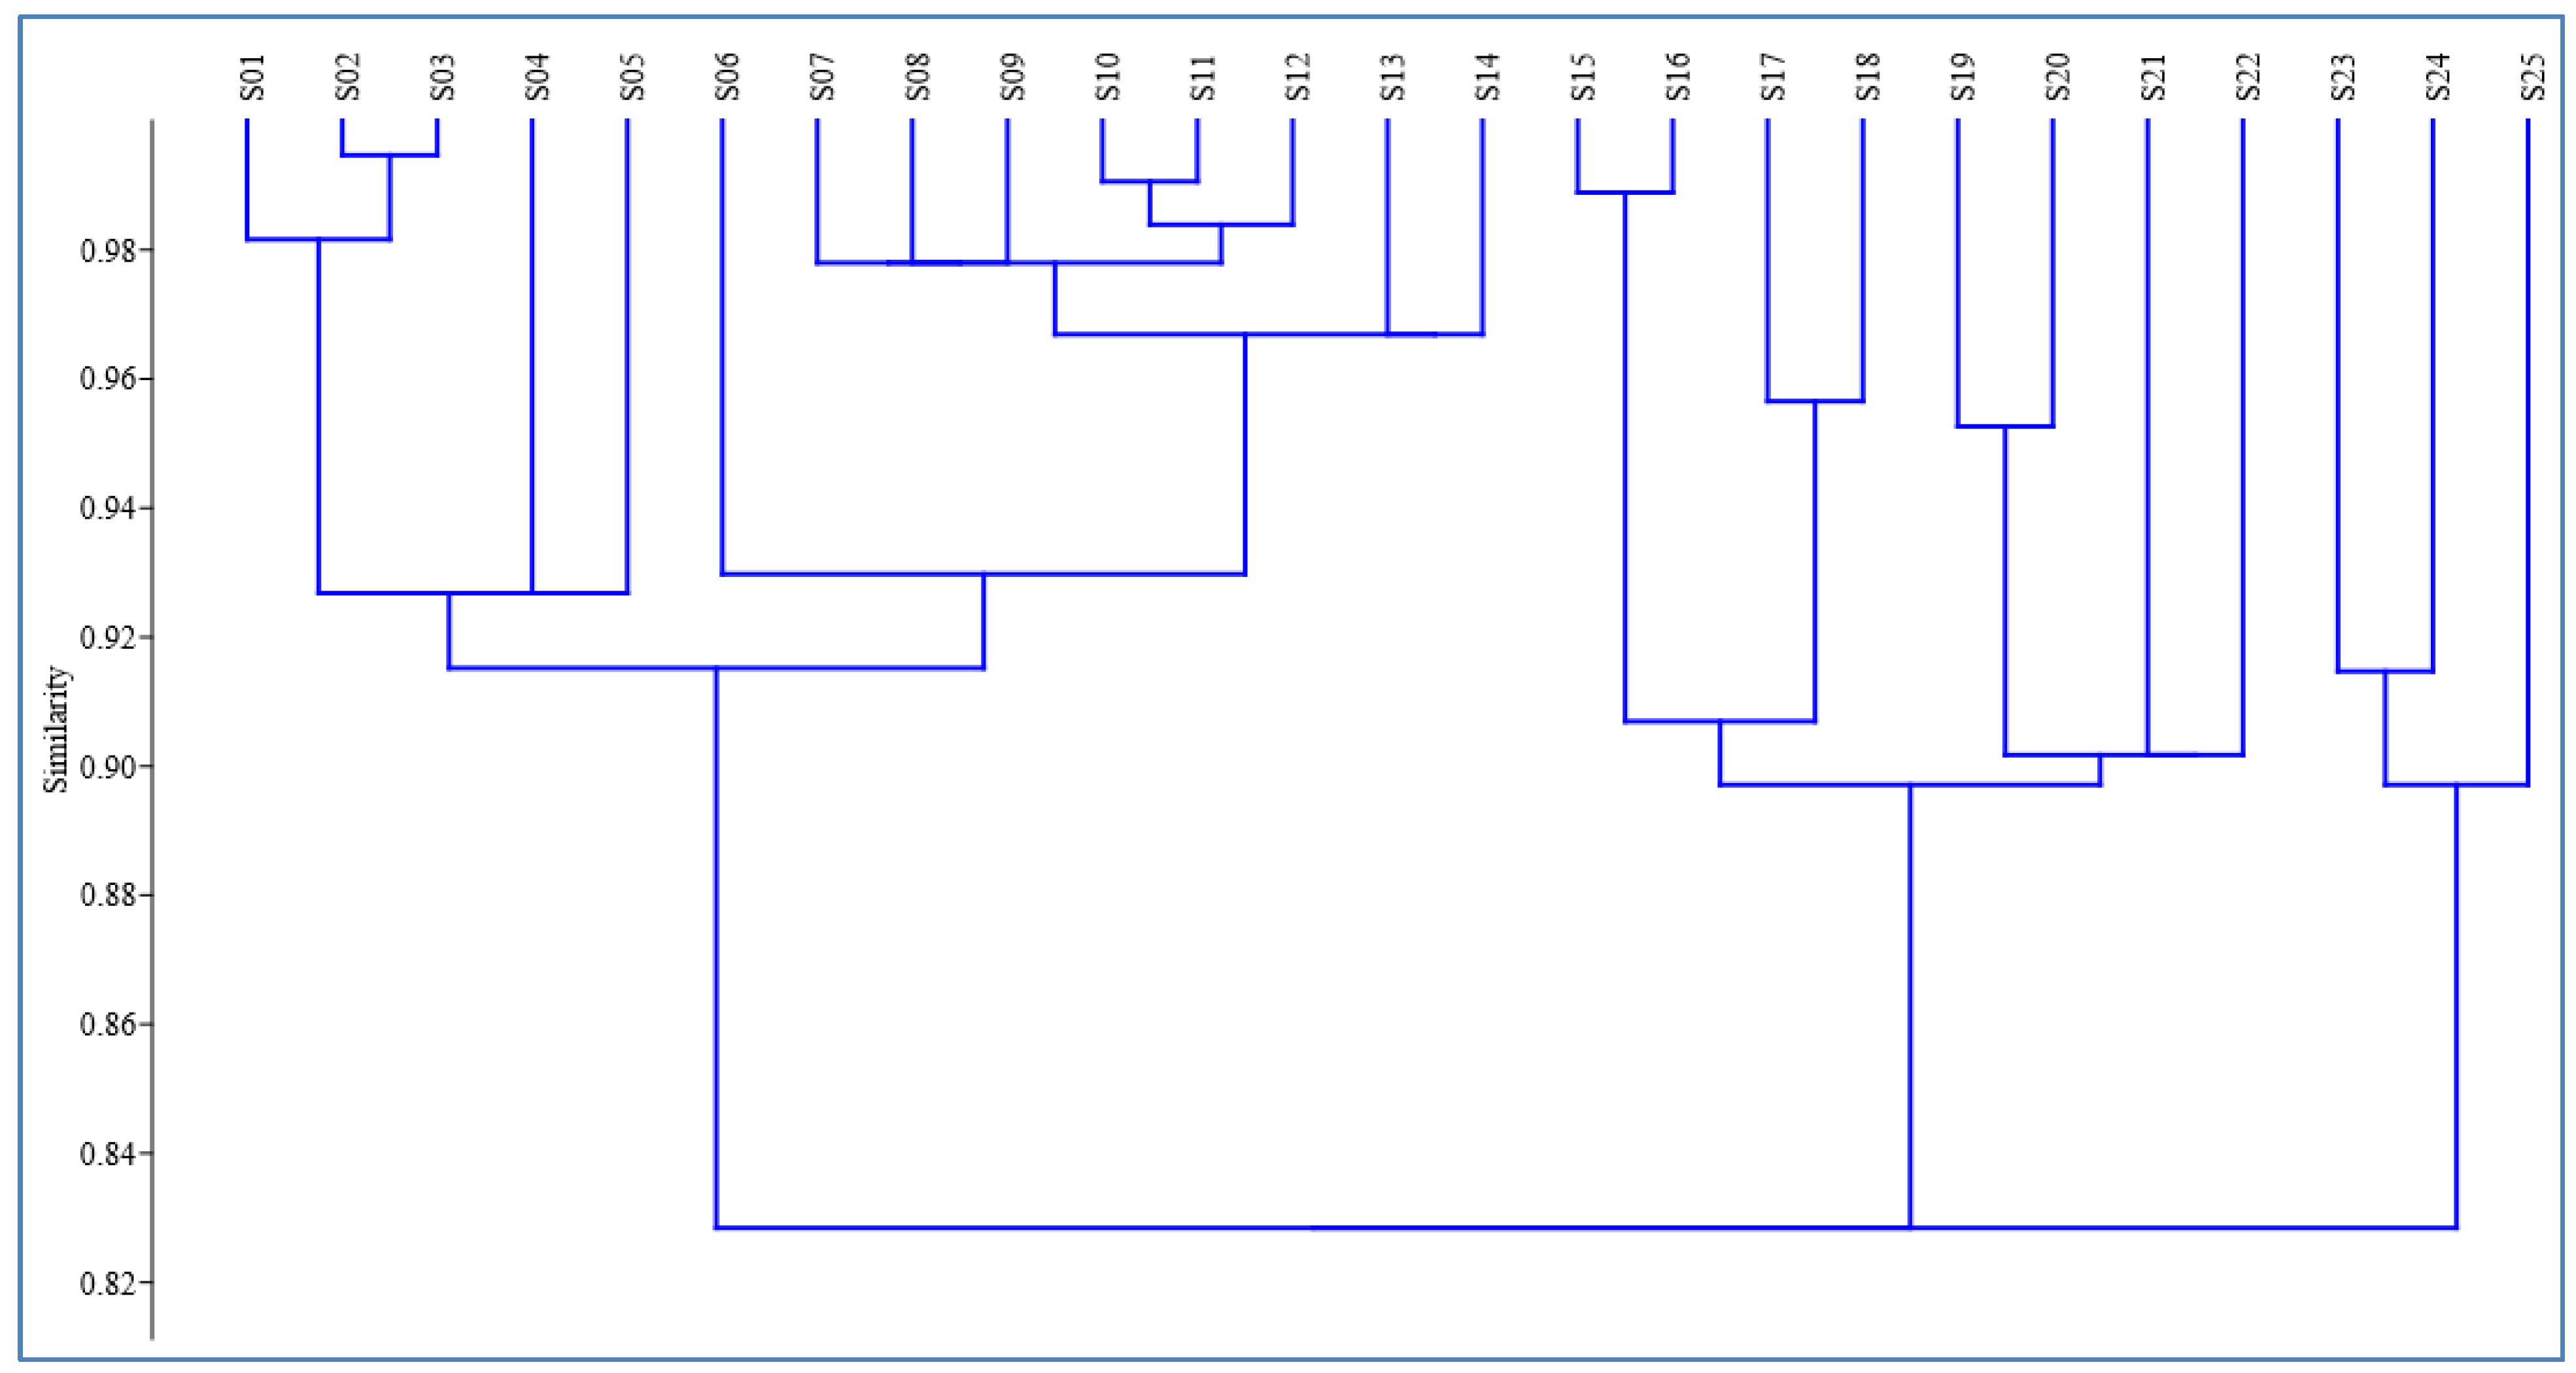
Cluster analysis reveals the best results for interpretating four different groups of similarity between the twenty-five sampling sites referring to the different groundwater-quality parameters (Figure 3). The first group cluster A comprises a total of five samples which indicated similarity great than 93%; they are all located in the upper part of the catchment. For cluster A, four sampling sites (S01, S02, S03, and S05) out of five samples were collected from deep borehole water (>100 m) above 2000 m amsl. The second group (cluster B) comprised nine samples (S06–S14), and eight samples had >96% similarity index. Cluster C has a total of eight sampling sites all being a shallow well (<30 m), and two (25%) of its sub-clusters have greater than 98% similarity index. The final group (cluster D) has three sampling sites with great than 90% similarity both shallow groundwater as located in the western zone in a studied area. Generally, twenty-five sampling sites have revealed a similarity above 90% for all sampled groundwater in the dry and wet season.
3.2. Physical–Chemical Characteristics
Results of in-situ measurements are summarized in Table 1; the groundwater temperatures in the shallow wells and deep boreholes varied seasonally, but not significantly (r (25) = 0.28, F = 0.858, p = 0.644). Also, no positive correlation was found between the analyzed variables (Table A3 and Table A4). It ranged between 22–27 °C, with an average value of 24.8 ± 0.29 °C in both seasons. However, sampled groundwater temperatures were almost similar with mean annual air temperatures 23.4 °C reported by [41]. Sampled groundwater was acidic to alkaline, as pH value varied between 6.12 and 8.41 for both seasons. About 24% of the water samples had pH < 7 in both seasons. However, all water samples were within the recommended value of 6.5–8.5 for drinking water guidelines [24,55].
The suitability of groundwater for drinking and irrigation purpose was indicated by the concentration of total dissolved solids (TDS) [31]. The average total dissolved solids were 459.76 ± 56.91 and 494.32 ± 46.78 mg/L in the wet and dry season, respectively. A value above 500 mg/L is undesirable for drinking water [56]. In the study area, the higher TDS concentration occurs in the western periphery, making the groundwater unsuitable for irrigation. For instance, in the western periphery near a shallow well (S07), the maize and tomatoes were not growing well relative to another area with a low value of TDS, especially the eastern part of the Kahe catchment.
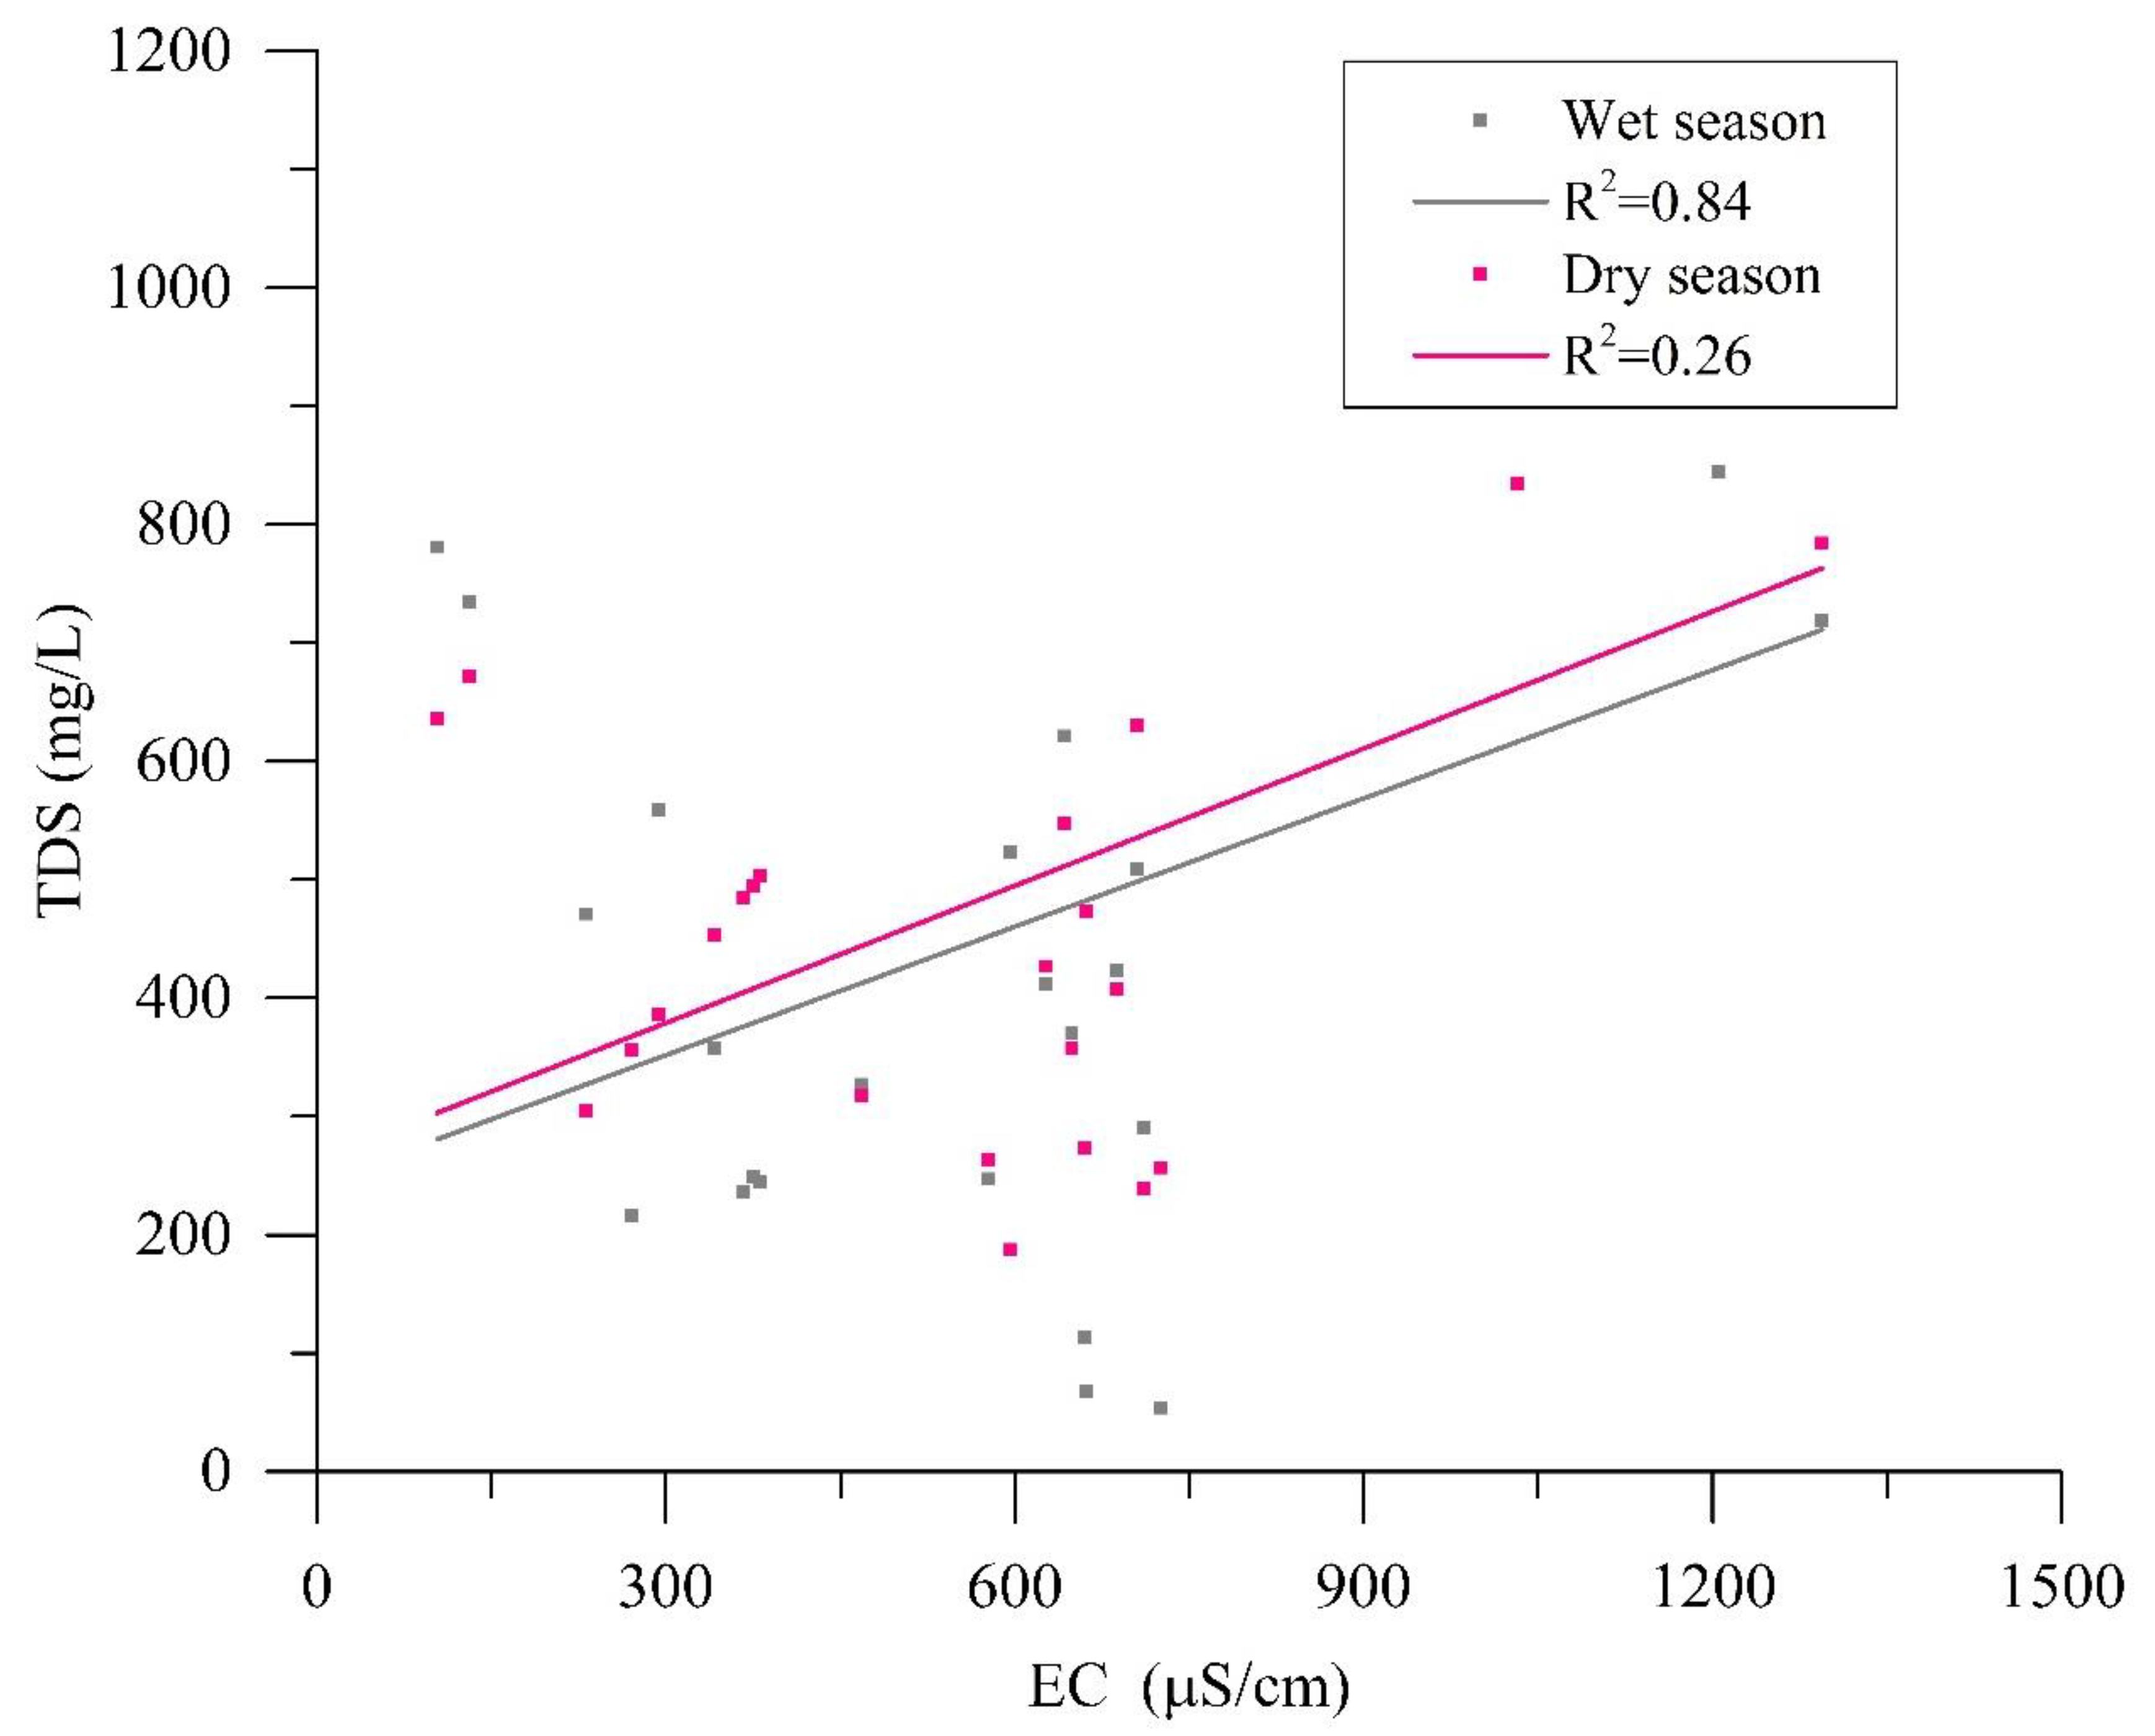
The average electrical conductivity was 797.38 ± 99.25 μS/cm in the wet season and 598.43 ± 64.9 μS/cm in the dry season. The values were higher than the permissible value recommended by the World Health Organisation (WHO) [24]. It is found that electrical conductivity in sampled groundwater was proportional to the amount of total dissolved solids (Figure 4). There was significant positive correlation between EC and TDS with Pearson coefficients r (25) = 0.92, p < 0.02 for wet season (Table A3) and r (25) = 0.54, p < 0.01 in a dry season (Table A4). However, in most of the deep boreholes the TDS and EC values were within the recommended limits by in the WHO guidelines [24].
3.3. Major Ions in Groundwater
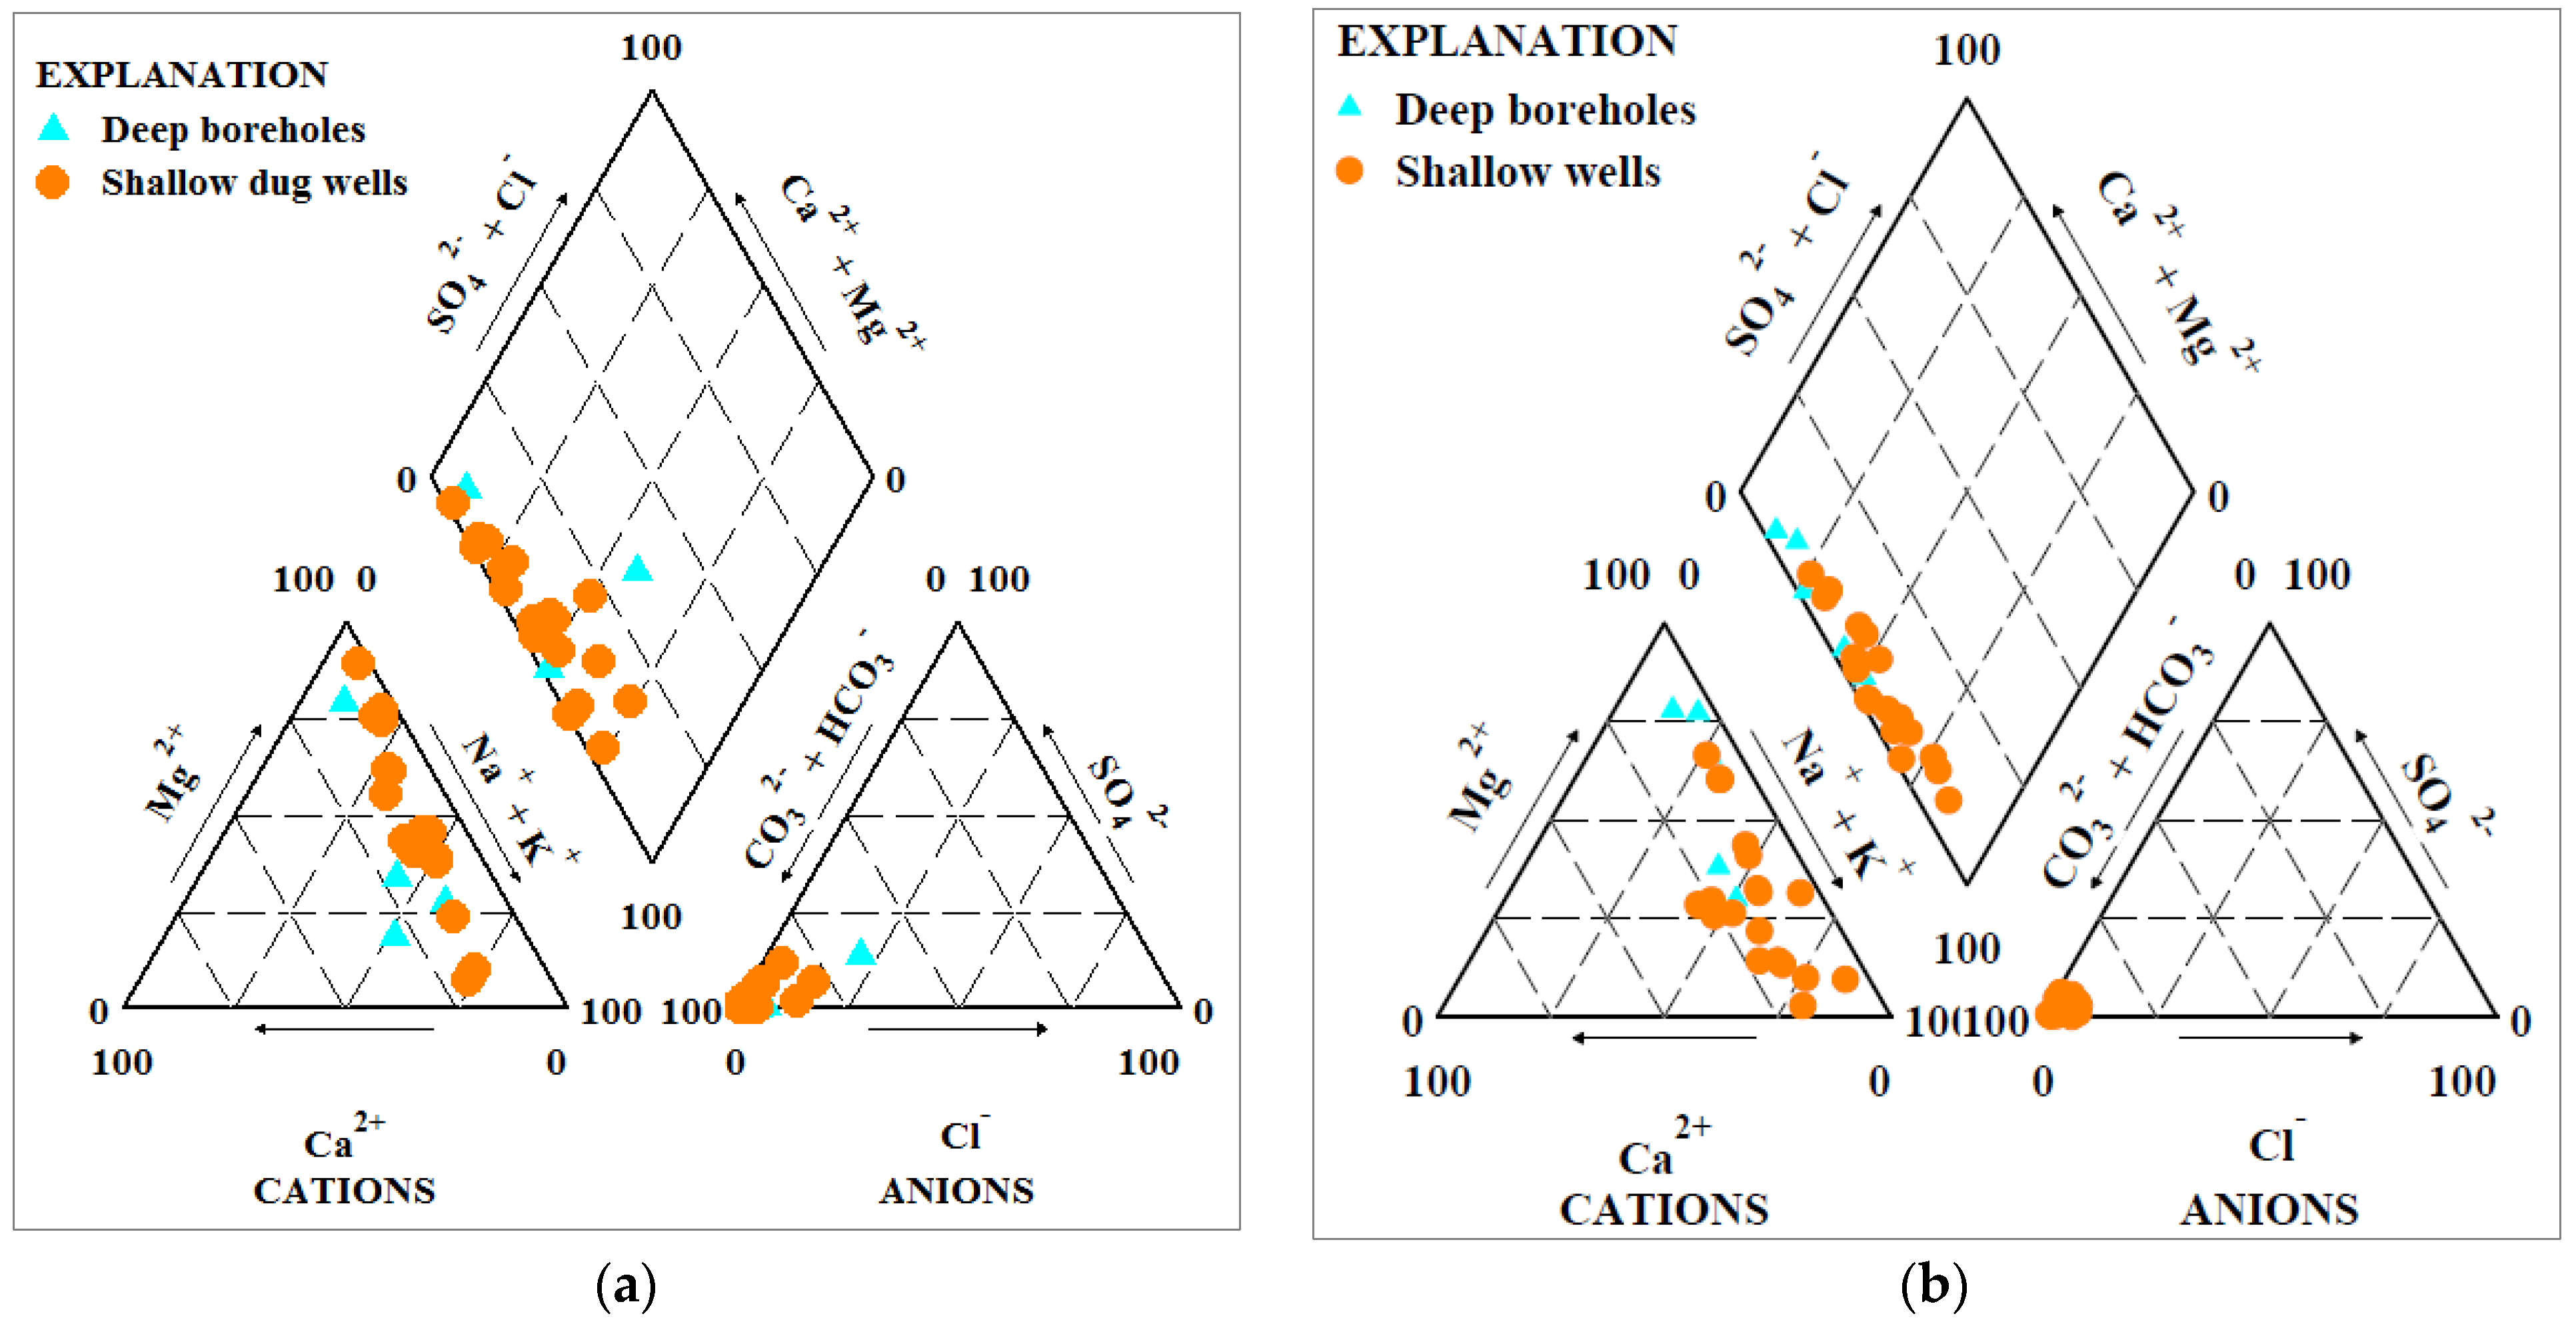
The major ions composition in studied groundwater is presented in piper diagram, in the wet season (Figure 5a) and in the dry seasons (Figure 5b). The analyzed water samples showed no significant difference in the cation and anion contents with respect to a depth between the wet and dry season (p > 0.05) (Table 2). There is statistically equal cation and anion concentration across all sampling depth in the Kahe catchment. Results show that groundwater chemistry is typically dominated by magnesium-sodium-bicarbonate (Mg-Na-HCO3−) water type. Magnesium and sodium was abundant compared to other cations (Mg2+ > Na+ > Ca2+ > K+) in all groundwater samples. Elevated magnesium concentrations were 256 and 165.4 mg/L in the wet and dry season, respectively, while sodium had an average value of 57.26 ± 9.96 mg/L in the wet season and 44.49 ± 7.74 mg/L in the dry season (Table 1). The recorded high levels in the wet season are likely attributed to a cation exchange reaction between Na+ and Mg2+ through water–rock interaction movement during the rainfall intensity events in the study area. Bicarbonate concentrations dominated more than other major anions (HCO3− > Cl− > SO42−) for both seasons. These have an average of 250.08 ± 36.13 mg/L in the wet season and 312.24 ± 27.94 mg/L in the dry season (Table 1). The major ions distribution (Figure 5a,b) and significant positive correlation (Table A3) between bicarbonate ions (HC03−) and cations were: (Na+ r (25) = 0.53, p = 0.02), (Mg2+ r (25) = 0.33, p < 0.01), (Ca2+ r (25) = 0.67, p < 0.021) and (K+ r (25) = 0.41, p < 0.019). The similar trend of significant positive correlation was observed in Table A4. High bicarbonate levels in groundwater resulted from the reaction of carbon dioxide in the unsaturated soil zone and rainwater [57]. However, no literature documented the standard value of bicarbonate for drinking purposes, but a value above 200 mg/L is unsuitable for drinking water [58,59]. Overall, 36% of the sampled groundwater is permissible for drinking purpose. Generally, groundwater chemistry in the catchment is characterized by magnesium-sodium-bicarbonate water type. Similar findings have been reported the dominance of the sodium and magnesium in groundwater [44,60,61], as well as groundwater type in the Kilimanjaro aquifer [24], and Arusha aquifer [44] in Tanzania.
The chloride (Cl−) levels in the wet season varied from 1.82 to 111.47 mg/L with an average value of 21.40 ± 6.12 mg/L and in the dry season, it ranged from 5.27 to 22.86 mg/L and averaged 12.08 ± 0.95 mg/L. With the exception of two sites (S13 and S20), groundwater samples from all the 23 other sites had chloride concentrations below 100 mg/L. The source of the Cl− in groundwater is mostly from rainfall and sedimentary rocks with chloride minerals and irrigation processes [31]. However, chloride concentrations in the Kahe catchment in groundwater possibly come from the irrigation return.
Fluoride (F−) in 23 of the sampled groundwater sources was within the limit of 1.5 mg/L recommended for drinking water by WHO [24], while two samples S07 and S20 exceeded the value; all samples were within the Tanzanian standards [55]. The fluoride concentration varied from 0.20 mg/L to 1.61 mg/L and from 0.06 to 1.54 mg/L during the wet and dry season, respectively (Table 1). Its variation from one site to another is possibly associated with the geological formation (Figure 2a), which may have different dissociation rate, rainfall intensity, and cation exchange process in the aquifer system [44]. There was a significant positive relationship between F− and K+, r (25) = 0.57, p < 0.01) (Table A3), and negative correlation with alkaline earth elements (Ca2+ and Mg2+) (Table A4). This correlation probably occurs through ionic exchange reaction and precipitation, when calcium and magnesium ion removed from the groundwater system additional K+ and F− ions are released from minerals such as nepheline in the aquifer materials. This study argues with several scholars who reported the relation between fluoride and alkali earth metals [62,63], as well as fluoride with bicarbonate (weak acid) [44]. The spatial distribution of fluoride concentrations indicates high fluoride concentration in shallow wells, i.e., at a depth 7–16 mn (cluster B and C), and lower values in deep boreholes (at a depth >100 m) for cluster A, but not significantly different with r (25) = 0.627, F = 1.215, p = 0.548 in both seasons in the area. In the study area, high fluoride concentrations in groundwater were likely due to the presence of basalt formation and other fluoride-rich volcanic materials such as lahars and volcanic ash (Figure 2a,b). However, groundwater quality for drinking purpose in the Kahe catchment is generally good, though in some areas it is considered not suitable for drinking purposes with elevated concentrations.
3.4. Seasonal Distribution of Nitrate, Sulphate, Phosphate, and Ammonium
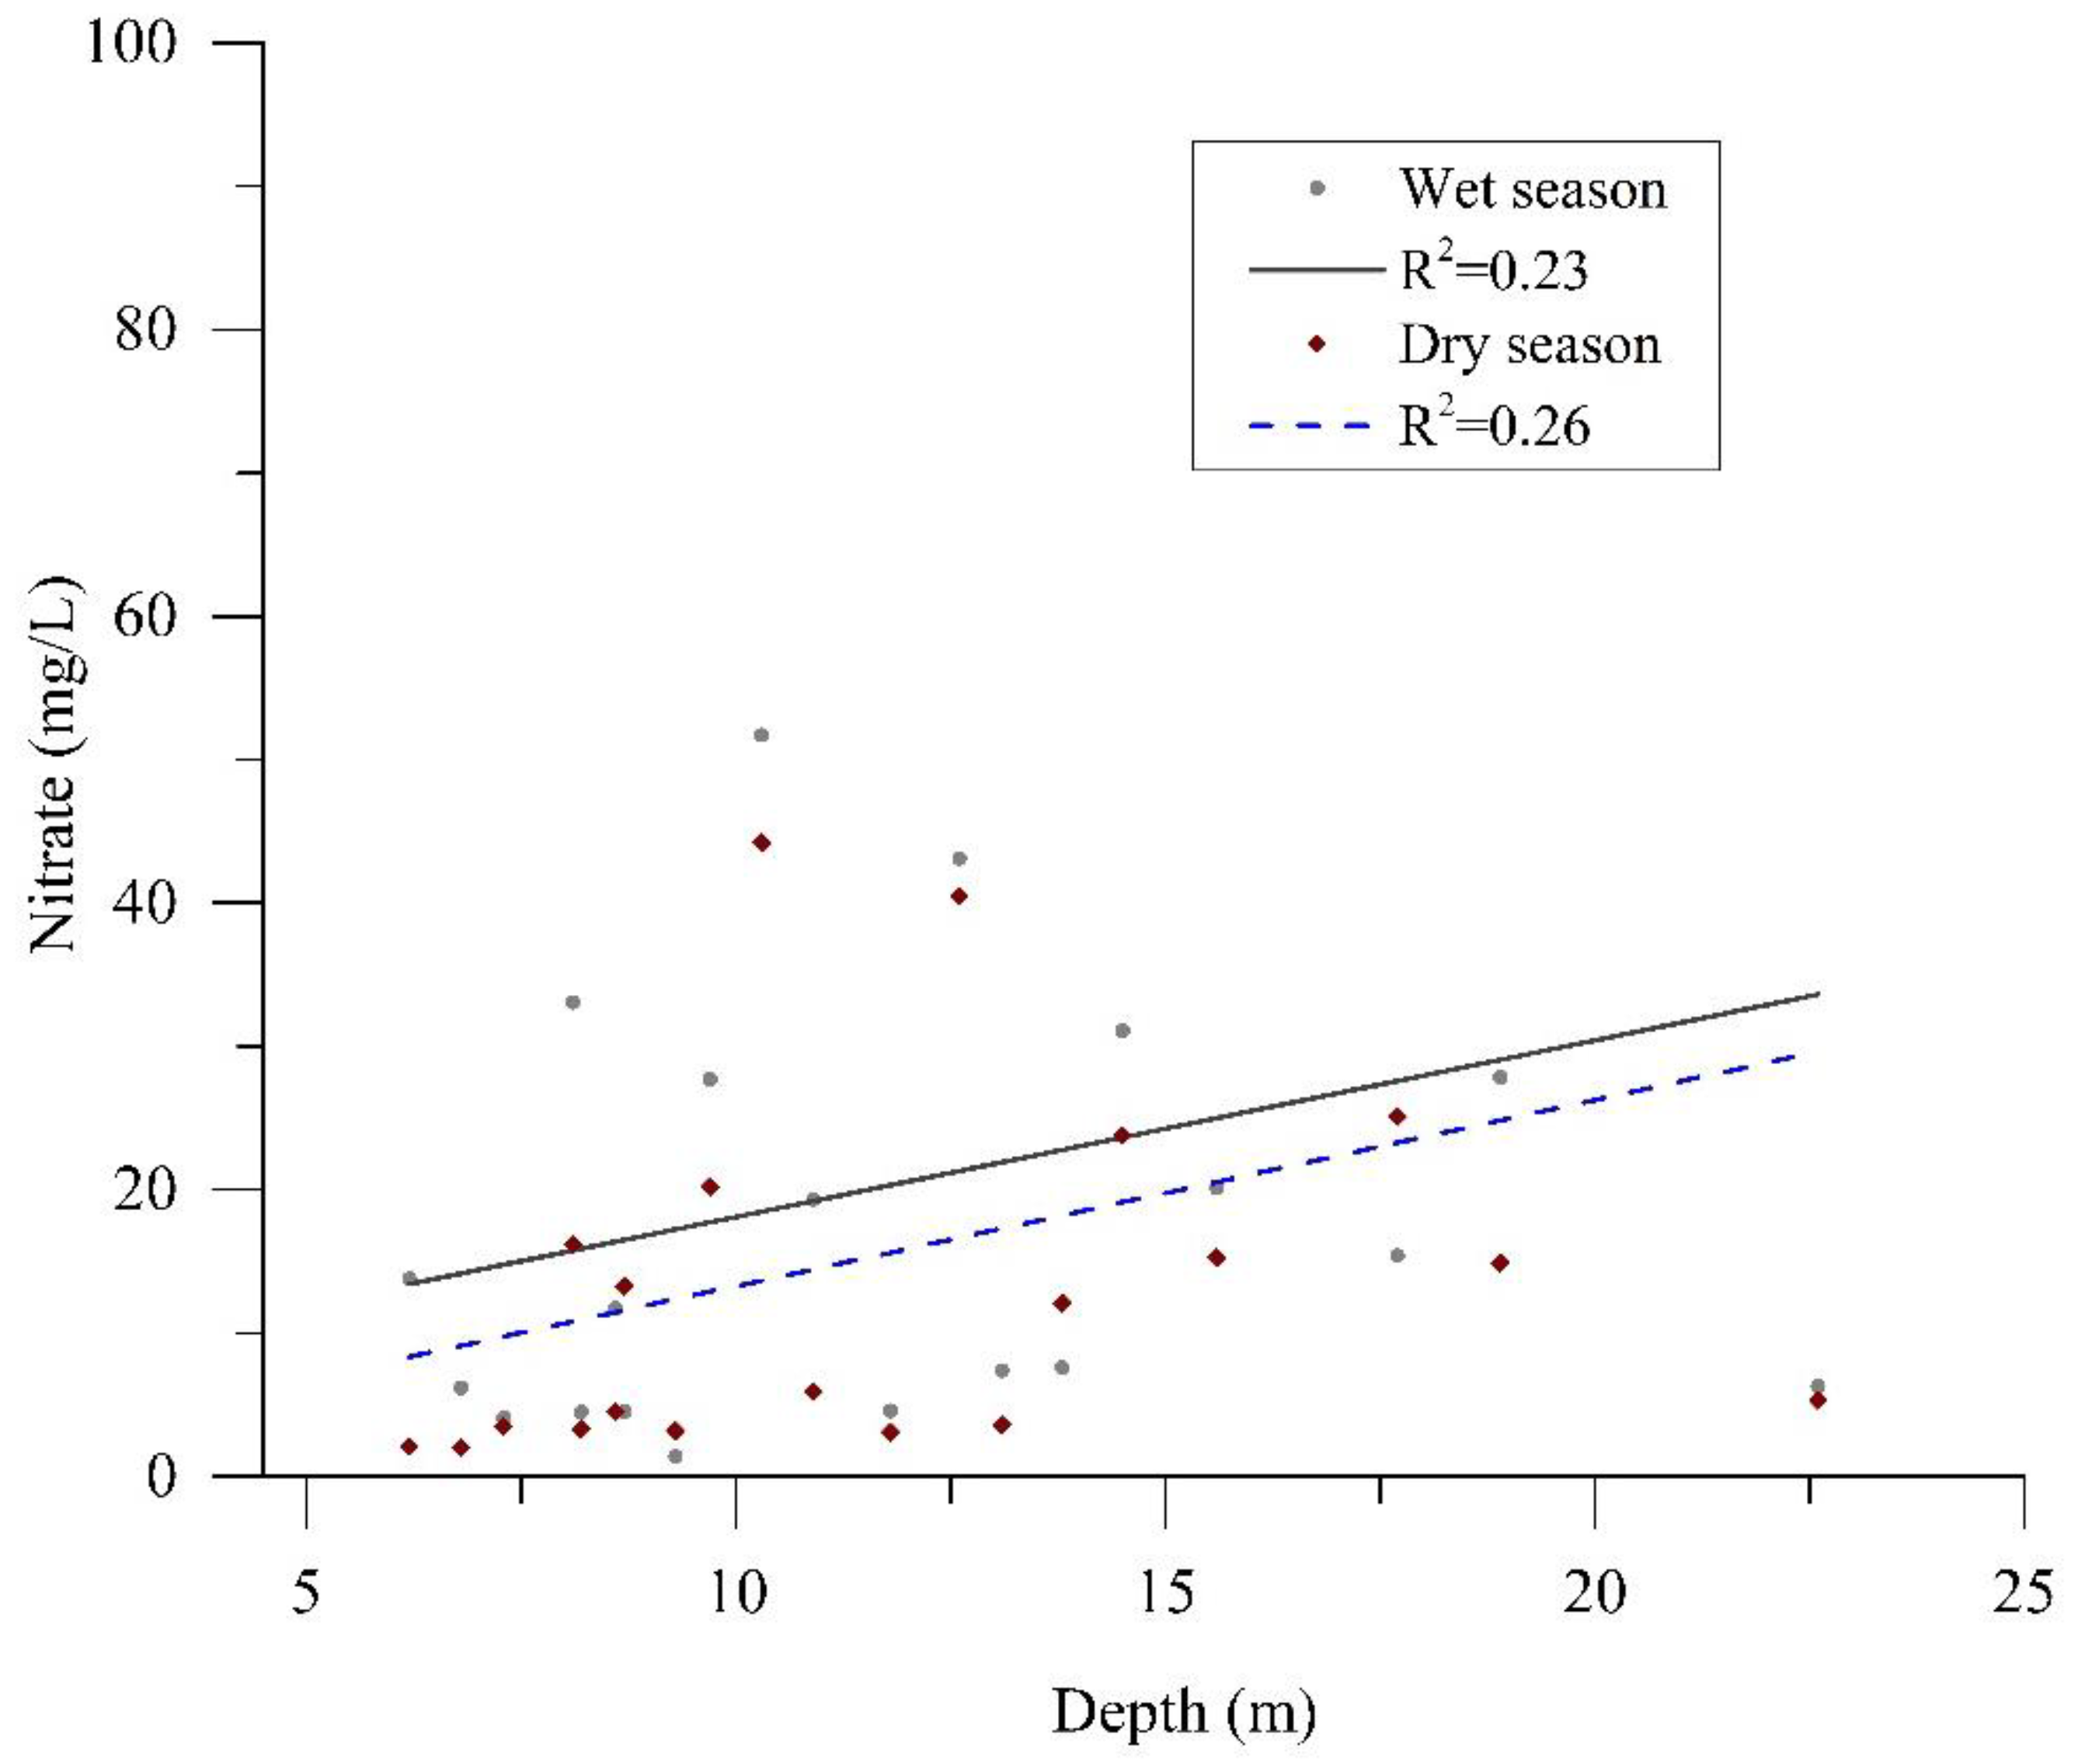
In lower elevation plains around Mt. Kilimanjaro, high levels of nitrate (NO3−) in groundwater have been reported [25]. The sampled groundwater with relatively high N03− levels above 40 mg/L were from location S04 and S13; about 8% of the water samples (2 out of 25) exceeded the recommended WHO drinking water limit of 50 mg/L [24]. However, most of the water samples were recorded below 100 mg/L. From ANOVA one way analysis, results show that nitrate varied with depth, but not significantly at level p = 0.05, r (25) = 0.26, F = 1.35, p = 0.21 and r (25) = 0.32, F = 2.3, p = 0.15 in the wet and dry season, respectively. In shallow wells (at a depth below 17 m) the high content of NO3− was higher than in the deep boreholes for both wet and dry season (Figure 6). Similar studies reported the decrease of NO3− with respect to the depth due to intensive nitrogen fertilizer application in the agricultural field [64,65], while Scheytt [66] found that the nitrate concentrations decreased at depth 5–15 m below the ground surface. Nitrate concentrations in groundwater also varied seasonally, ranging from 1.4 to 89.9 mg/L and 1.8 to 40.5 mg/L in the wet and dry season, respectively. They were significantly different between the wet and dry season (r (25) = 0.36, F = 3.99, p = 0.051). The high recorded nitrate levels in the wet season likely of leaching of nitrogen fertilizers into groundwater through irrigation and rainfall intensity in a study area. This contradicts the study by Scheytt [66] reporting elevated nitrate around the agricultural fields during the rainfall events.
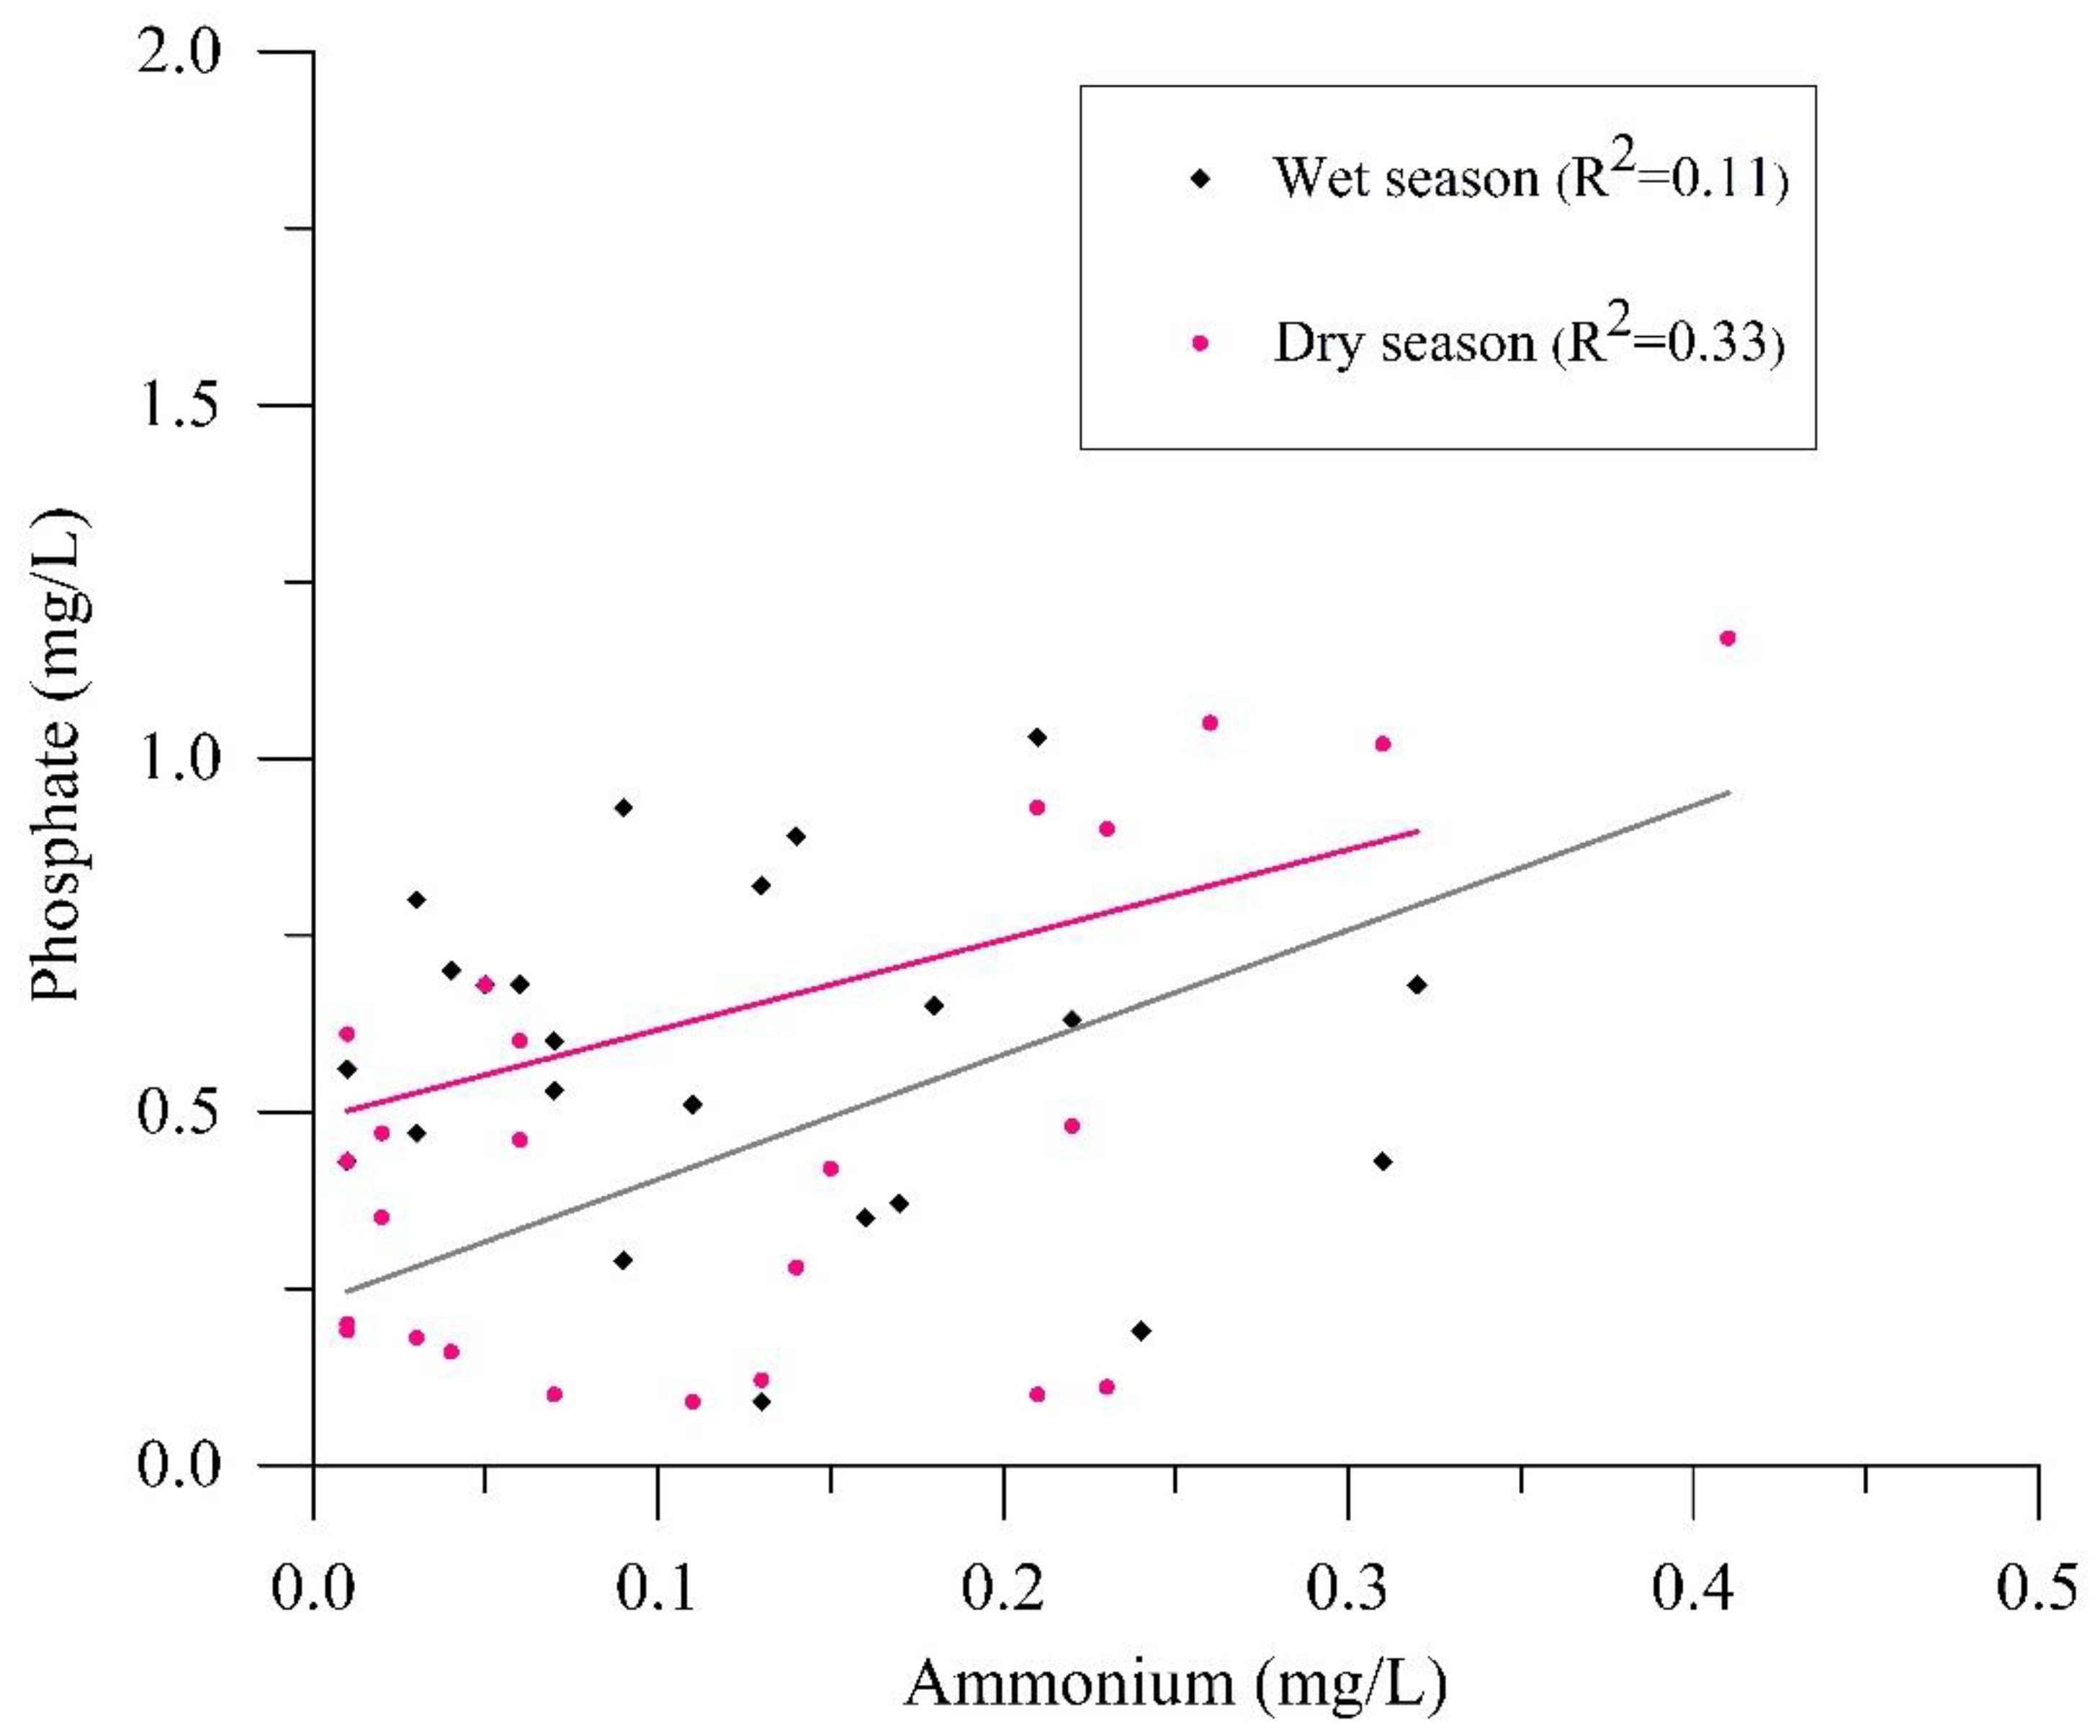
According to Patil and Patil [67] chemical fertilizers were among the major sources of phosphate level in groundwater. The results from this study showed that maximum values of PO43− and NH4+ were 1.86 and 0.32 mg/L in the wet season, and about 1.17 and 0.41 mg/L, respectively, but all are within the permissible limit [55]. However, elevated levels of phosphate and ammonium noticed from cluster C (S20, S22) and cluster D (S24) out of twenty-five sample locations. There is a correlation between phosphate and ammonium, r (25) = 0.57, p = 0.005 in the wet season (Table A3), and a partial linear relationship (Figure 7). The possible source of phosphate and ammonium in groundwater was attributed to intensive fertilizers use for crop production.
Sulphate (SO42−) concentrations varied seasonally. In the wet and dry season sulphate concentrations were 17.40 ± 3.81 mg/L and 11.12 ± 2.79 mg/L, respectively, with a maximum value of about 55 mg/L and 43 mg/L (Table 1). Scheytt [66] showed that sulphate enriched in the soil through fertilizing infiltrates directly into groundwater. For instance, sulphur available in inorganic fertilizers generally exists as sulphate (e.g., ammonium sulphate) [68]. The high rate of SYNERGIZER fertilizer application possibly contributed to sulphate in groundwater in the area. Thus, measured elevated value may be associated with the recycling of irrigation water from agricultural practices instead of geological materials. Kahe catchment is comprised of volcanic rock and alkaline volcanic lavas such as pyroclastics (Figure 2a,b), where neither relate with metallic sulphide minerals reported as a major source of sulphate in groundwater [31]. In excess of 600 mg/L, it is linked to human health risk [24], such as in the gastrointestinal tract [24].
The raised values of nitrate, phosphate, sulphate, and ammonium in sampled groundwater were found near Tanganyika Planting Company (TPC) sugarcane plantation farm where intensive fertilizers have been in use since the early 1940s [34]. Also, there is a large number of small-scale irrigators for farming paddy rice, coffee, bananas, onions, tomatoes, horticulture, and vegetables, many of whom have increased their application of fertilizers for crop production. The source of elevated nitrate, sulphate phosphate and ammonium in the sampled groundwater nearby TPC sugarcane plantation farm in the western periphery in the Kahe catchment is therefore likely from the agricultural effluents.
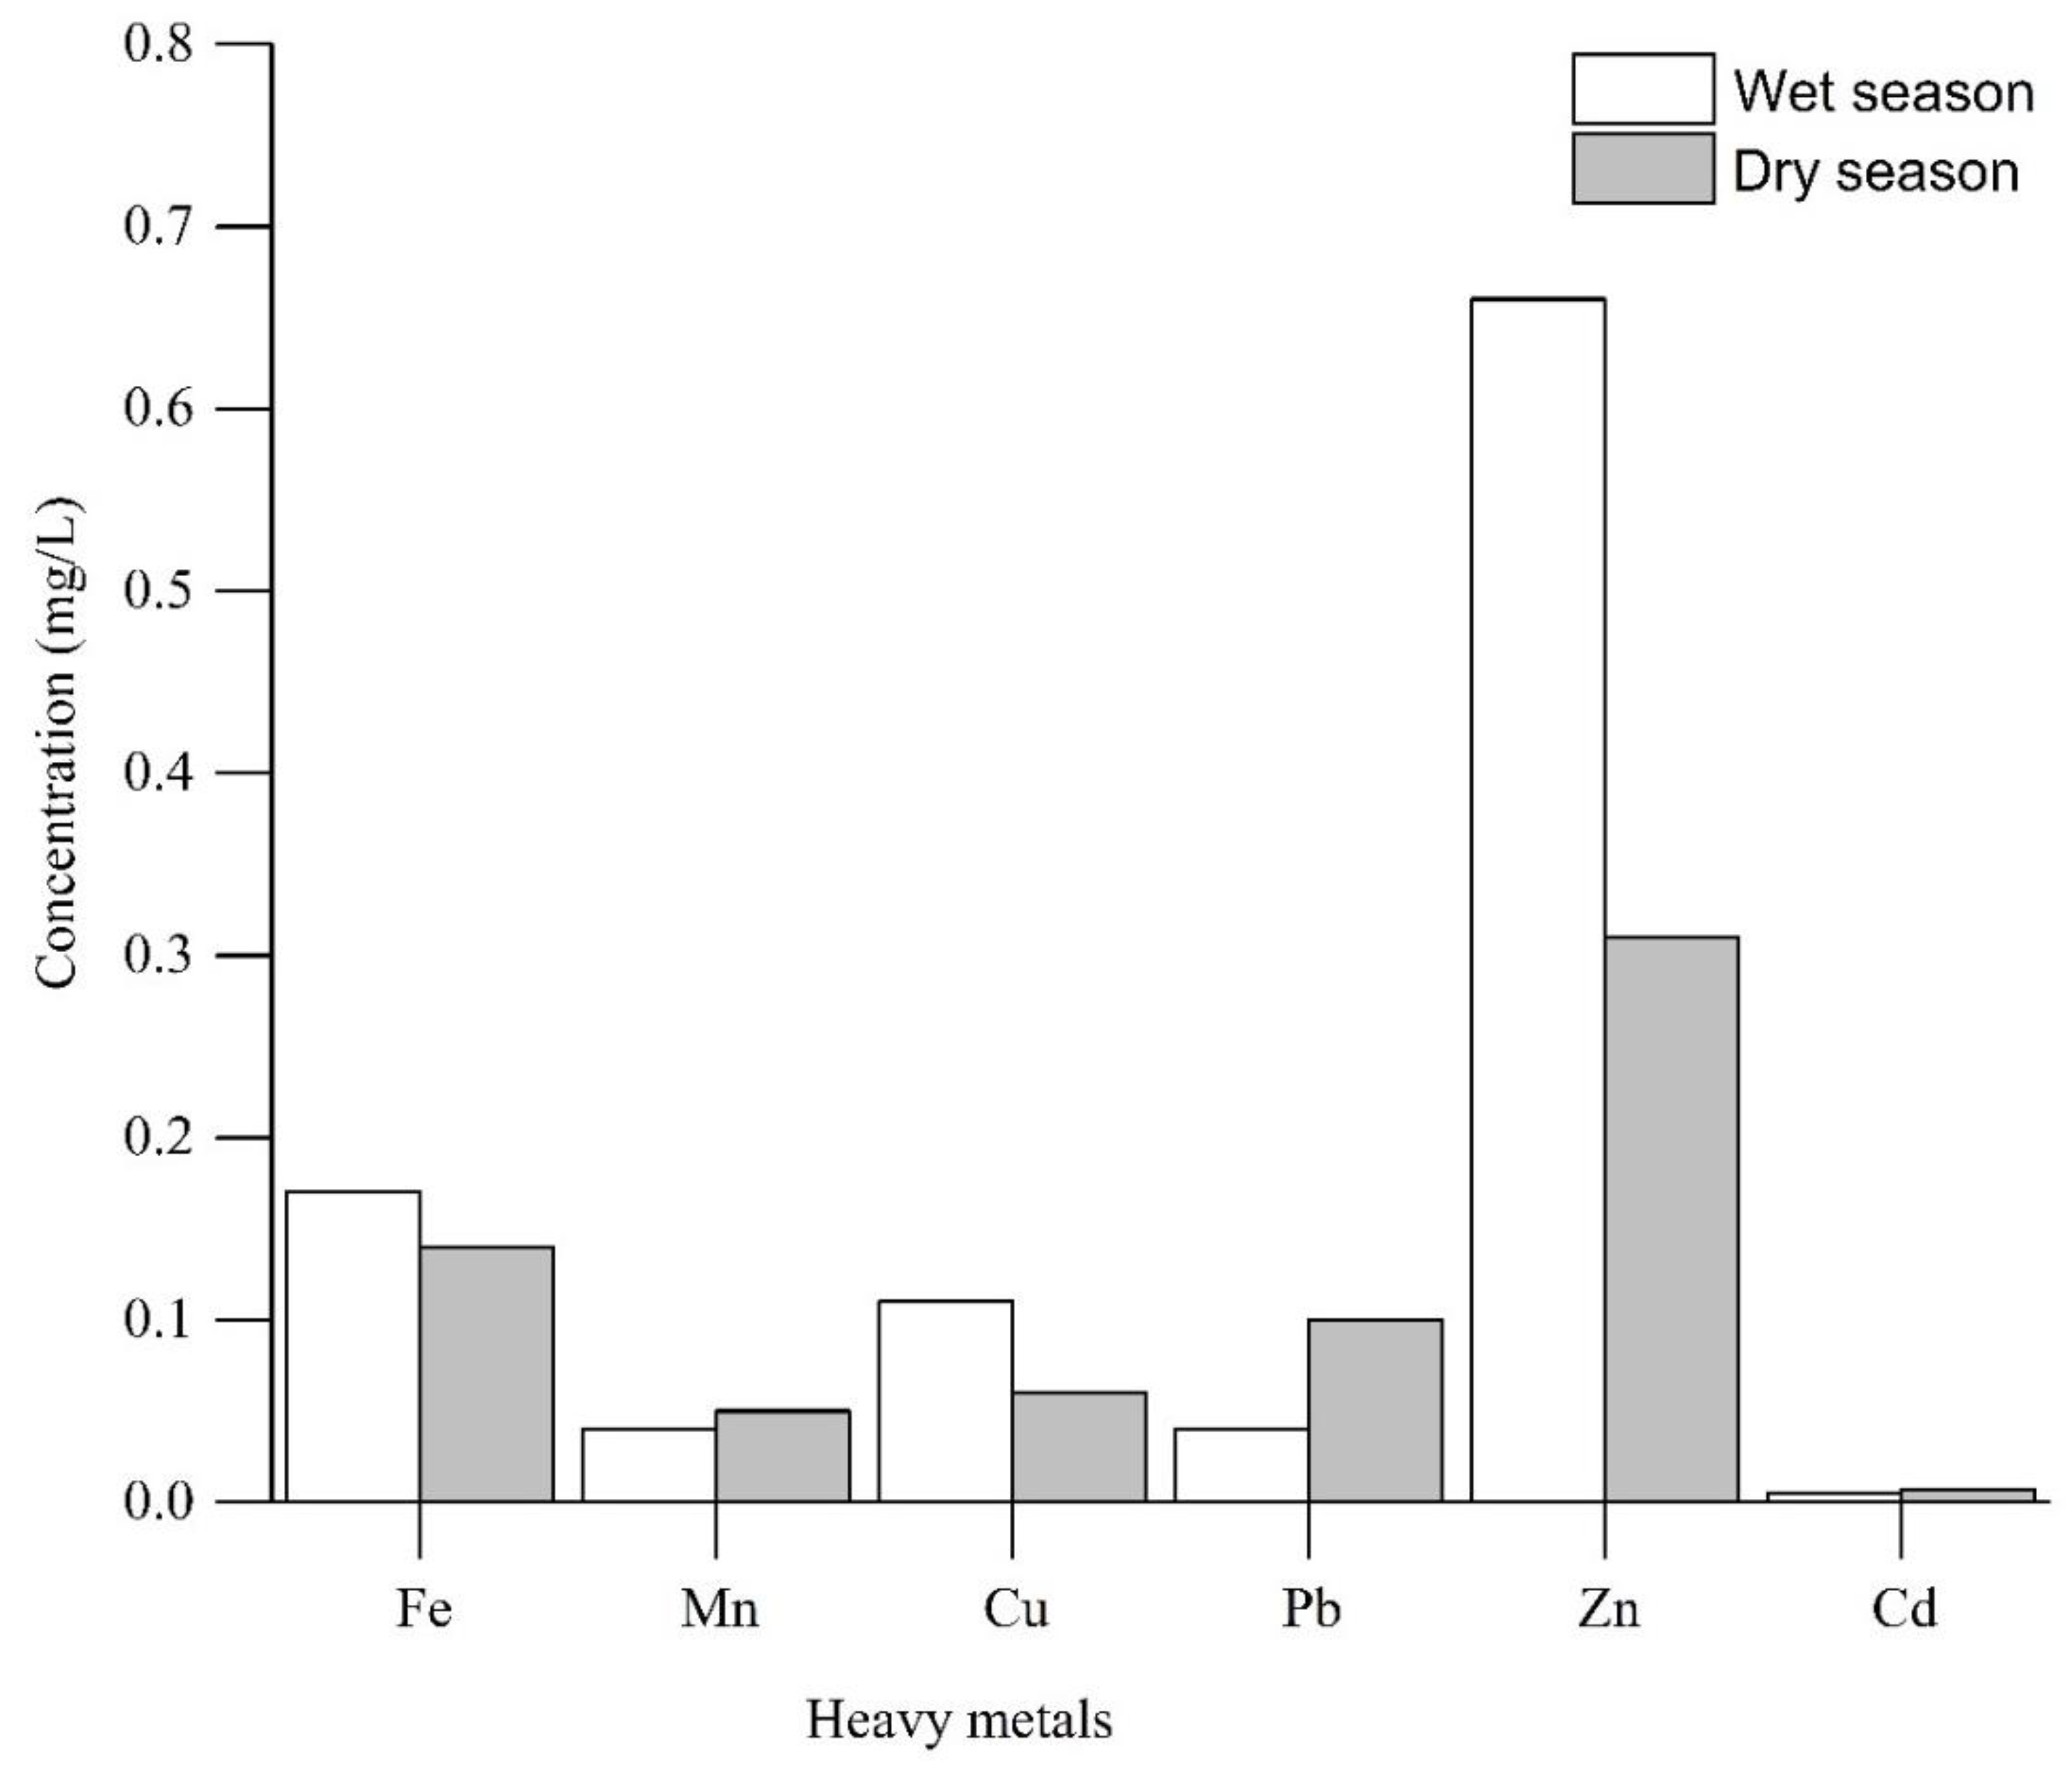
3.5. Concentration Level of Heavy Metals in Groundwater
Groundwater was analyzed for the heavy metals Fe, Cu, Zn, Mn, Pb, and Cd in the wet and dry seasons. Significant differences between the wet and dry seasons are summarized in Table 3. The analyzed heavy metals are those that correspond to constituents from different fertilizers used by farmers in the Kahe catchment as derived from a field survey (Table 4). Most of the fertilizers applied were N-fertilizers as used for a sugarcane plantation, paddy rice, onions, watermelon, and tomatoes.
In groundwater, heavy metals can occur naturally due to the dissolution of volcanic rock materials [69], but often in very low concentrations. Heavy metals contamination can also occur, however, from anthropogenic activities such as inappropriate disposal of wastes and industrial effluents, and application of agricultural fertilizers [70]. Either way, if the desirable drinking water concentration is surpassed, the metals can pose a serious human health problem. For example, a high concentration of dissolved iron can cause liver disease (haemosiderosis) [31]. However, Fe is essential for the growth of animals and plants, and a shortage of Fe can lead to anemia [20]. Fe often occurs naturally in groundwater; high concentrations can be associated with the presence of igneous rock minerals. High concentrations can also result from the dissociation of the ferrous components of the borehole and hand pump [15]. Within the Kahe catchment, in both wet and dry season, the Cluster D (S22, S23, S24, and S25) in the west and sites of the Cluster B (S13) and Cluster C (S19) in the east had elevated levels of Fe, greater than 0.3 mg/L. Twenty out of twenty-five measured water samples (~80%) were within the allowable limits for drinking water as recommended by WHO [24]. Fe concentration varied seasonally, during the wet season with values higher than in the dry season (Figure 8). The high level of Fe in wet season is possibly influenced by rainfall infiltration and dissociation of iron mineral in rocks and soil which are leached into groundwater. A similar study found an excess of Fe in groundwater about 35% (wet season) and 7.7% (dry season) in Nigeria [71]. Also, Singhal and Gupta [72] found that in different parts of India with high rainfall, the Fe content was higher compared with low rainfall in groundwater.
Lead (Pb) is among the hazardous elements and in a human body causes problems such as anemia, hearing problems, kidney disfunction and blood pressure for both children and adults [24]. Lead concentrations in groundwater may occur from agricultural effluents with the excessive use of phosphate fertilizers [12,73]. About 24% of water samples (6 out of 25) were above the WHO permissible limits of 0.01 mg/L for Pb in drinking water [24]. Elevated Pb was noticed more in the dry season than in the wet season (Figure 8). In the dry season, Kahe catchment had intensive irrigation with the use of fertilizers for crop production. Phosphate fertilizers, e.g., DAP, are predominantly applied nearby TPC sugarcane plantation farm. The likely source of Pb in groundwater in the dry season was through irrigation return in the study area. In a similar study, in Keko (Tanzania), Mkude [18] found a maximum value of 0.35 mg/L (dry season) and 0.075 mg/L (wet season). Most of these shallow wells and deep boreholes were located within the agricultural field especially west–east zone as characterized by a concentration of large and small-scale irrigators. The maximum Pb value is obtained from the shallow well at site S23 near the TPC sugarcane plantation farm.
Zinc and copper are among the essential elements needed for plant and animal metabolism [74]. However, if available in excess then they become toxic to the human body. Zinc and copper in groundwater can originate from mining activities, metal plating and industrial effluents [3,75]. In the study area, maximum Cu concentrations were 0.53 and 0.15 mg/L in a wet and dry season, respectively, while Zn was 1.57 mg/L in a wet season and 0.66 mg/L in a dry season (Table 1). Elevated values in the wet season may be from the dissociation of minerals and penetrate to groundwater during the rainfall events, but the source of Zn and Cu continue unrecognized in the area. However, Cu and Zn were within the recommended standard for drinking water guidelines [24,55]. Also, low concentration was likely due to the absence of the large industrial activities around the sampled groundwater sites. The Cu and Zn present were attributed to natural sources rather than anthropogenic activities. Generally, this study agrees with the results reported in different parts of the world [5,18,76,77] that show the lowest value of Cu and Zn in groundwater around agricultural fields.
Manganese has an average value of 0.04 ± 0.01 mg/L and 0.05 ± 0.02 mg/L in the wet and dry season, respectively. About 16% of Mn surpassed the recommended WHO guideline value (0.1 mg/L) (Table 1). There was a significant positive correlation between Mn with Zn r (25) = 0.56, p = 0.005 and with Cu r (25) = 0.58, p = 0.002 (Table A3). However, the water samples of cluster C (S15, S19, and S22) show the maximum value of Mn in both seasons. The low concentration of manganese is possibly due to the absence of the large of industries in the area.
Cadmium (Cd) can be available in groundwater if an area was located around steel, plastic, and battery industries and through interaction with dissolved rocks and minerals [78]. The excess contents in drinking water cause kidney damage [24]. In studied groundwater, ANOVA at the 0.05 level does not show significant difference (F = 1.84, p = 0.183) in both the seasons (Table 3). However, elevated levels of Cd were recorded during the wet season at site S23. Generally, the shallow wells (<30 m) show higher concentrations of Cd than in deep boreholes (>100 m) for the sampled groundwater. The geological materials formation are alluvium deposits (Figure 2a,b), that are not possibly causing the occurrence of the Cd. Thus, the likely source of cadmium may be attributed to intensive use of fertilizers in the area through rainfall infiltration process. A study by Nouri et al. [5] reported the relation between the Cd and applied fertilizer (super phosphate) in Andimeshk aquifers, Iran. In the Kahe catchment, among the areas that use the phosphate fertilizer is especially the nearby sugar cane plantation farm in the western part.
3.6. Pesticide Residues
The analyzed pesticides residues are those that correspond to constituents from different types of pesticides used by farmers in the Kahe catchment as derived from a field survey (Table A5). Pesticide concentrations in the groundwater were below the detection limit (<1 part per trillion of Agilent 7800 ICP-MS). The undetected values of pesticides are presumably due to the small amount applied in the study area. Morris et al. [79] reported that high pesticide contents will arise from double or triple cropping and substantial applications of the same compound of pesticides. From the field survey, farmers reported that different types of pesticides were applied during crop growing period which reduces the threat of the contamination in groundwater. However, Leistra and Boesten [80] reported that the volatilization process may also contribute to the decline of the pesticides from the plant leaves especially if it is applied during daylight hours. Also, most of the pesticides can be attached to the soil particles as they are only slightly soluble in water and therefore are less likely to be found in the groundwater [24]. The rapid degradation of pesticide molecules is among the factors which contribute to reduced contamination of groundwater in the area. Sundaram [81] reported that for sub-surface soils, most of the pesticides get degraded within 14 days. For example, chlorpyrifos is degraded within approximately 10 days in a 0–15 cm and 40–60 cm clayey sandy soil. However, Rani et al. [82] found that pesticides exist in the top 10 cm of soil. For example, chlorpyriphos and cypermethrin were found distributed to a depth of 35 and 15 cm of soil, respectively. Their results indicate a low movement of pesticides under saturated moisture condition and hence may not contaminate groundwater.
4. Conclusion
Groundwater quality for drinking purposes in the Kahe catchment is generally good; however, in some areas it is considered undesirable for drinking purposes with elevated concentrations. Groundwater chemistry was dominated with magnesium-sodium-bicarbonate water type. However, the major cation and anion concentration across all sampling depths was not significantly different in the study area. The agricultural practices likely had impacted on groundwater quality through the intensive use of fertilizers. For instance, elevated values of nitrate, phosphate, sulphate, and ammonium in sampled groundwater were found nearby Tanganyika Planting Company (TPC) sugarcane farm where the area had application of intensive fertilizers in the west zone of the Kahe catchment. Generally, shallow wells had higher values than deep boreholes. Pesticide molecules were below the detection limit in all the sampled groundwater, possibly due to the minimal amount applied or to degradation of molecules in the topsoil before reaching the groundwater.
Author Contributions
Conceptualization, Z.D.L. and H.C.K.; Methodology, Z.D.L.; Software, Z.D.L.; Validation, Z.D.L.; H.C.K., and A.N.M.; Formal Analysis, Z.D.L.; Investigation, Z.D.L.; Resources, A.N.M.; Data Curation, Z.D.L.; Writing-Original Draft Preparation, Z.D.L.; Writing-Review & Editing, Z.D.L.; Visualization, A.N.M.; Supervision, H.C.K.; Project Administration, H.C.K.; Funding Acquisition, A.N.M.
Funding
The research work funded by the Centre for Water Infrastructure and Sustainable Energy Futures (WISE- Futures), one of the East and Southern African Centres of Excellence initiated by the World Bank.
Acknowledgments
The authors appreciate the contribution of the late Alfred N.N. Muzuka during the manuscript development. Also, the authors acknowledge the support offered by the Pangani Basin Water Board office and Moshi district councils during fieldwork for data collection.
Conflicts of Interest
The authors declare that they have no conflict of interest.
Appendix A

Table A1.
Water quality parameter of groundwater for the wet season.
| ID | Depth | PH | DO | EC | TDS | Temp | N03− | SO42− | Cl− | F− | HC03− | P043− | NH4+ | Na+ | K+ | Mg2+ | Ca2+ | Fe2+ | Mn | Cu2+ | Pb2+ | Zn2+ | Cd |
|---|---|---|---|---|---|---|---|---|---|---|---|---|---|---|---|---|---|---|---|---|---|---|---|
| S01 | 120 | 6.57 | 4.74 | 378 | 245 | 24.3 | 3.5 | 1 | 9.13 | 0.22 | 90 | 0.43 | 0.01 | 2.11 | 0.21 | 17.8 | 2.40 | 0.08 | 0.02 | 0.03 | 0.02 | 0.31 | 0.002 |
| S02 | 125 | 7.16 | 1.71 | 297 | 236 | 24.7 | 3.9 | 0 | 3.13 | 0.20 | 35 | 0.56 | 0.01 | 5 | 1.22 | 2.2 | 3.6 | 0.05 | 0.01 | 0.19 | 0.01 | 0.45 | 0.011 |
| S03 | 118 | 6.72 | 4.13 | 382 | 249 | 24.7 | 9.2 | 0 | 6.78 | 0.24 | 55 | 0.47 | 0.03 | 6.7 | 1.7 | 6.4 | 4.1 | 0.17 | 0.02 | 0.05 | 0.01 | 0.92 | 0.004 |
| S04 | 12.6 | 8.41 | 3.71 | 1290 | 781 | 24.1 | 43.1 | 51 | 76.42 | 0.87 | 84 | 0.51 | 0.11 | 115 | 8.1 | 57 | 29.4 | 0.11 | 0.03 | 0.01 | 0.02 | 0.58 | <0.01 |
| S05 | 115 | 7.21 | 1.17 | 664 | 357 | 23.2 | 4 | 1 | 3.91 | 0.33 | 85 | 0.35 | 0.16 | 5.3 | 1.9 | 12.6 | 3 | 0.10 | 0.02 | 0.06 | 0.04 | 0.17 | 0.002 |
| S06 | 7.3 | 7.98 | 2.15 | 1687 | 735 | 25.1 | 4.1 | 48 | 30.78 | 0.71 | 1550 | 0.7 | 0.04 | 80.6 | 9.6 | 315 | 18.9 | 0.21 | 0.01 | 0.01 | 0.02 | 0.41 | 0.003 |
| S07 | 6.8 | 7.82 | 3.46 | 1992 | 1186 | 25.4 | 6.2 | 32 | 13.30 | 1.57 | 544 | 0.93 | 0.09 | 75.5 | 22.7 | 74.2 | 19.1 | 0.15 | 0.05 | 0.04 | 0.03 | 0.39 | <0.01 |
| S08 | 6.2 | 7.28 | 4.11 | 903 | 471 | 23.1 | 13.8 | 5 | 6.26 | 0.32 | 100 | 0.43 | 0.31 | 11.2 | 3.6 | 15.2 | 5.3 | 0.13 | 0.02 | 0.18 | 0.02 | 0.83 | 0.003 |
| S09 | 14.5 | 7.19 | 3.56 | 1344 | 845 | 23.7 | 31.1 | 0 | 11.74 | 0.41 | 206 | 0.6 | 0.07 | 28.4 | 1.5 | 119 | 8.3 | 0.12 | 0.03 | 0.01 | 0.04 | 0.74 | <0.01 |
| S10 | 8.2 | 7.91 | 2.86 | 509 | 327 | 24.3 | 4.5 | 4 | 6.78 | 1.03 | 192 | 0.68 | 0.32 | 21.6 | 5 | 2.6 | 6.7 | 0.17 | 0.05 | 0.21 | 0.02 | 0.63 | 0.001 |
| S11 | 11.8 | 8.11 | 1.77 | 861 | 423 | 24.7 | 4.6 | 27 | 8.87 | 0.78 | 256 | 0.63 | 0.22 | 32.6 | 15.1 | 46.6 | 8.3 | 0.10 | 0.04 | 0.01 | 0.01 | 0.75 | <0.01 |
| S12 | 9.3 | 6.71 | 3.92 | 422 | 291 | 24.2 | 1.4 | 2 | 1.83 | 0.78 | 86 | 0.68 | 0.05 | 5.6 | 8.1 | 52.8 | 2.1 | 0.08 | 0.01 | 0.08 | 0.05 | 0.80 | <0.01 |
| S13 | 16.9 | 8.05 | 2.6 | 1196 | 719 | 26 | 89.9 | 12 | 111.5 | 0.59 | 334 | 0.89 | 0.14 | 130 | 13.9 | 53.6 | 32.6 | 0.37 | 0.02 | 0.10 | 0.08 | 0.33 | 0.012 |
| S14 | 10.9 | 7.83 | 2.28 | 850 | 509 | 24.8 | 19.34 | 14 | 7.23 | 0.45 | 383 | 0.29 | 0.09 | 83.6 | 8.9 | 34.4 | 20.9 | 0.05 | 0.01 | 0.06 | 0.05 | 0.19 | 0.001 |
| S15 | 13.8 | 8.02 | 7.35 | 158.6 | 113 | 23.5 | 7.6 | 2 | 6.1 | 0.38 | 625 | 0.09 | 0.13 | 121 | 12.9 | 49.7 | 30.2 | 0.07 | 0.02 | 0.09 | 0.07 | 0.29 | 0.002 |
| S16 | 8.7 | 7.39 | 1.63 | 235 | 54 | 25.3 | 4.53 | 7 | 3.64 | 0.23 | 851 | 0.65 | 0.18 | 167 | 17.8 | 68.9 | 41.9 | 0.09 | 0.03 | 0.13 | 0.10 | 0.43 | 0.003 |
| S17 | 10.3 | 6.69 | 1.88 | 949 | 216 | 24.6 | 51.7 | 0 | 30.51 | 0.57 | 1600 | 0.53 | 0.07 | 52.3 | 1.5 | 55.4 | 13.8 | 0.07 | 0.02 | 0.01 | 0.02 | 0.25 | <0.01 |
| S18 | 8.6 | 7.72 | 3.2 | 860 | 559 | 26 | 11.75 | 18 | 9.44 | 0.59 | 1261 | 0.68 | 0.06 | 24.1 | 0.7 | 256 | 6.4 | 0.03 | 0.01 | 0.04 | 0.01 | 0.12 | <0.01 |
| S19 | 9.7 | 7.41 | 5.2 | 291 | 68 | 27.8 | 27.7 | 55 | 21.39 | 1.30 | 270 | 0.82 | 0.13 | 93.7 | 12.9 | 14.2 | 22.8 | 0.32 | 0.13 | 0.02 | 0.01 | 1.91 | 0.001 |
| S20 | 13.1 | 7.12 | 3.02 | 356 | 247 | 26.8 | 7.4 | 51 | 108.2 | 1.61 | 484 | 1.03 | 0.21 | 122 | 20.3 | 103 | 28.9 | 0.12 | 0.07 | 0.07 | 0.04 | 0.26 | <0.01 |
| S21 | 22.6 | 6.87 | 5.32 | 632 | 621 | 26.5 | 6.3 | 10 | 4.96 | 1.43 | 341 | 0.8 | 0.03 | 42.8 | 5.6 | 49 | 11.2 | 0.13 | 0.02 | 0.10 | 0.01 | 1.59 | 0.001 |
| S22 | 15.6 | 7.8 | 1.36 | 527 | 371 | 21.9 | 20.11 | 31 | 16.09 | 1.04 | 896 | 1.86 | 0.28 | 114 | 14.9 | 131 | 29.8 | 0.23 | 0.19 | 0.27 | 0.03 | 2.57 | 0.003 |
| S23 | 17.7 | 7.96 | 4.17 | 831 | 412 | 25.6 | 15.4 | 24 | 12.33 | 0.77 | 210 | 0.19 | 0.24 | 16.7 | 2.8 | 40.2 | 5.9 | 0.34 | 0.12 | 0.53 | 0.13 | 0.66 | 0.019 |
| S24 | 8.1 | 6.97 | 3.91 | 1692 | 936 | 25.2 | 33.1 | 0 | 7.04 | 0.30 | 32 | 1.45 | 0.31 | 4.2 | 0.5 | 10.1 | 1.5 | 0.31 | 0.08 | 0.13 | 0.03 | 0.16 | 0.005 |
| S25 | 18.9 | 7.48 | 1.54 | 628 | 523 | 22.8 | 27.84 | 40 | 22.29 | 0.36 | 464 | 0.37 | 0.17 | 70.9 | 8.5 | 70.8 | 25.1 | 0.59 | 0.03 | 0.25 | 0.01 | 0.80 | 0.007 |
All units are in mg/l except pH (unitless), EC (μS/cm), temperature (°C) and Depth (m).
Table A2.
Water quality parameter of groundwater for the dry season.
| ID | Depth | PH | DO | EC | TDS | Temp | N03− | SO42− | Cl− | F− | HC03− | P043− | NH4+ | Na+ | K+ | Mg2+ | Ca2+ | Fe2+ | Mn | Cu2+ | Pb2+ | Zn2+ | Cd |
|---|---|---|---|---|---|---|---|---|---|---|---|---|---|---|---|---|---|---|---|---|---|---|---|
| S01 | 120 | 6.82 | 1.16 | 381 | 503 | 23.5 | 6.2 | 0 | 11.88 | 0.15 | 400 | 0.68 | 0.05 | 2 | 2.1 | 24.8 | 2.9 | 0.07 | 0.03 | 0.01 | 0.03 | 0.11 | 0.001 |
| S02 | 125 | 7.27 | 1.68 | 367 | 485 | 26.4 | 4.2 | 2 | 10.55 | 0.16 | 282 | 0.16 | 0.04 | 4.6 | 1.7 | 5.6 | 2.8 | 0.08 | 0.01 | 0.11 | 0.02 | 0.12 | 0.002 |
| S03 | 118 | 7.23 | 1.80 | 375 | 495 | 23.1 | 5.3 | 0 | 19.21 | 0.10 | 500 | 0.35 | 0.02 | 6.6 | 4 | 6.2 | 4 | 0.03 | 0.02 | 0.03 | 0.01 | 0.32 | 0.003 |
| S04 | 12.6 | 7.48 | 2.60 | 103.4 | 636 | 24.9 | 40.5 | 39 | 7.92 | 0.13 | 708 | 0.20 | 0.01 | 34 | 6.4 | 165 | 8.2 | 0.12 | 0.02 | 0.02 | 0.02 | 0.51 | <0.01 |
| S05 | 115 | 7.52 | 1.91 | 342 | 453 | 22.3 | 4 | 0 | 5.27 | 0.21 | 230 | 0.10 | 0.07 | 13.3 | 2.9 | 39.8 | 4.1 | 0.08 | 0.01 | 0.04 | 0.05 | 0.60 | 0.011 |
| S06 | 7.3 | 7.64 | 4.53 | 130.6 | 672 | 26.7 | 3.5 | 3 | 18.47 | 0.70 | 365 | 0.18 | 0.03 | 38.1 | 6.2 | 41.8 | 9.8 | 0.07 | 0.03 | 0.09 | 0.03 | 0.42 | 0.005 |
| S07 | 6.8 | 7.46 | 1.13 | 1225 | 1097 | 25.2 | 2 | 42 | 6.59 | 1.51 | 548 | 0.47 | 0.02 | 54.4 | 4 | 110 | 13.7 | 0.08 | 0.02 | 0.01 | 0.08 | 0.35 | <0.01 |
| S08 | 6.2 | 7.68 | 1.16 | 231.6 | 305 | 25.9 | 2.1 | 43 | 6.78 | 0.63 | 803 | 0.48 | 0.22 | 56 | 4.1 | 113 | 14.1 | 0.18 | 0.02 | 0.02 | 0.80 | 0.36 | 0.016 |
| S09 | 14.5 | 6.79 | 1.03 | 1205 | 971 | 22.3 | 1.8 | 38 | 5.9 | 0.56 | 506 | 0.43 | 0.01 | 49.5 | 3.6 | 99.7 | 12.4 | 0.07 | 0.18 | 0.11 | 0.72 | 0.32 | 0.001 |
| S10 | 8.2 | 6.69 | 1.96 | 468 | 318 | 26.2 | 3.3 | 0 | 11.87 | 0.91 | 86 | 0.28 | 0.14 | 16.1 | 3.7 | 4.4 | 6.8 | 0.13 | 0.02 | 0.04 | 0.01 | 0.27 | 0.011 |
| S11 | 11.8 | 7.43 | 4.38 | 688 | 408 | 24.6 | 3.1 | 1 | 8.57 | 0.34 | 186 | 0.10 | 0.21 | 18.6 | 11 | 25.2 | 6.7 | 0.07 | 0.02 | 0.11 | 0.02 | 0.13 | 0.002 |
| S12 | 9.3 | 7.68 | 4.53 | 711.6 | 239 | 25.4 | 3.2 | 9 | 9.23 | 0.56 | 252 | 0.60 | 0.06 | 4.3 | 8.1 | 31.6 | 3.5 | 0.08 | 0.03 | 0.01 | 0.01 | 0.30 | <0.01 |
| S13 | 16.9 | 6.41 | 3.78 | 1294 | 784 | 23.6 | 10.9 | 7 | 9.89 | 1.12 | 510 | 0.61 | 0.01 | 137 | 14.1 | 28.6 | 37.5 | 0.32 | 0.04 | 0.32 | 0.13 | 0.54 | 0.004 |
| S14 | 10.9 | 7.61 | 1.49 | 705.2 | 630 | 25 | 5.9 | 8 | 7.74 | 0.14 | 305 | 0.09 | 0.11 | 62.7 | 6.7 | 33.9 | 4.5 | 0.06 | 0.05 | 0.06 | 0.15 | 0.04 | 0.005 |
| S15 | 13.8 | 7.12 | 1.21 | 659.7 | 273 | 26.2 | 12.1 | 17 | 10.99 | 0.29 | 102 | 0.90 | 0.23 | 12.2 | 5.6 | 11.7 | 11.6 | 0.09 | 0.14 | 0.01 | 0.04 | 0.16 | 0.014 |
| S16 | 8.7 | 7.83 | 2.62 | 725.5 | 257 | 24.8 | 13.3 | 9 | 12.08 | 0.18 | 504 | 0.19 | 0.01 | 67.4 | 17.2 | 44.9 | 45.8 | 0.13 | 0.03 | 0.02 | 0.16 | 0.66 | 0.001 |
| S17 | 10.3 | 6.92 | 2.60 | 270 | 356 | 26.7 | 4.2 | 1 | 9.89 | 0.26 | 542 | 0.42 | 0.15 | 93.5 | 3.9 | 58.2 | 23.5 | 0.03 | 0.02 | 0.14 | 0.01 | 0.24 | <0.01 |
| S18 | 8.6 | 7.52 | 2.83 | 293.4 | 386 | 25 | 4.5 | 2 | 10.75 | 0.28 | 597 | 0.46 | 0.06 | 102 | 4.2 | 60.6 | 25.5 | 0.10 | 0.01 | 0.15 | 0.01 | 0.26 | <0.01 |
| S19 | 9.7 | 7.13 | 4.21 | 661.5 | 473 | 25.3 | 20.2 | 2 | 15.83 | 0.12 | 0 | 1.05 | 0.26 | 126 | 22.8 | 5.2 | 33.9 | 0.39 | 0.17 | 0.06 | 0.01 | 0.19 | 0.001 |
| S20 | 13.1 | 6.57 | 3.40 | 577.8 | 263 | 24.9 | 3.6 | 4 | 17.07 | 1.54 | 134 | 0.93 | 0.21 | 42.5 | 3.4 | 9.6 | 12 | 0.09 | 0.02 | 0.03 | 0.02 | 0.42 | <0.01 |
| S21 | 22.6 | 7.3 | 3.78 | 642 | 548 | 27.7 | 5.3 | 8 | 13.19 | 1.14 | 223 | 0.12 | 0.13 | 39.2 | 5.6 | 16.2 | 13.5 | 0.08 | 0.01 | 0.01 | 0.01 | 0.32 | 0.021 |
| S22 | 15.6 | 7.38 | 3.82 | 649 | 357 | 23 | 15.3 | 6 | 17.33 | 1.15 | 120 | 1.02 | 0.31 | 49.6 | 7.9 | 6.38 | 3.6 | 0.31 | 0.11 | 0.04 | 0.01 | 0.12 | 0.001 |
| S23 | 17.7 | 7.12 | 3.69 | 626.2 | 427 | 27 | 25.1 | 9 | 22.86 | 0.11 | 116 | 0.12 | 0.13 | 28.2 | 3.1 | 15.8 | 13.1 | 0.29 | 0.09 | 0.02 | 0.11 | 0.21 | 0.022 |
| S24 | 8.1 | 7.19 | 3.72 | 1032 | 835 | 23.2 | 16.2 | 16 | 12.99 | 1.12 | 95 | 1.17 | 0.41 | 38.6 | 7.2 | 5.9 | 8.3 | 0.33 | 0.11 | 0.01 | 0.03 | 0.32 | 0.003 |
| S25 | 18.9 | 6.78 | 3.51 | 596.2 | 187 | 25.7 | 14.9 | 12 | 19.25 | 0.06 | 110 | 0.11 | 0.23 | 16.4 | 6.8 | 15 | 12.5 | 0.17 | 0.04 | 0.03 | 0.06 | 0.43 | 0.012 |
All units are in mg/l except pH (unitless), EC (μS/cm), temperature (°C) and Depth (m).
Table A3.
Pearson correlation matrix of groundwater for the wet season.
| pH | DO | EC | TDS | Temp | N03− | SO42− | Cl− | F− | HC03− | C032− | P043− | NH4+ | Na+ | K+ | Mg2+ | Ca2+ | Fe2+ | Mn | Cu2+ | Pb2+ | Zn2+ | Cd | |
|---|---|---|---|---|---|---|---|---|---|---|---|---|---|---|---|---|---|---|---|---|---|---|---|
| pH | 1 | ||||||||||||||||||||||
| DO | 0.12 | 1 | |||||||||||||||||||||
| EC | 0.29 | 0.52 | 1 | ||||||||||||||||||||
| TDS | 0.28 | 0.37 | 0.92 | 1 | |||||||||||||||||||
| Temp | −0.05 | −0.34 | 0.04 | 0.00 | 1 | ||||||||||||||||||
| N03− | 0.19 | −0.23 | 0.34 | 0.28 | 0.09 | 1 | |||||||||||||||||
| SO42− | 0.49 | −0.07 | 0.18 | 0.16 | 0.30 | 0.07 | 1 | ||||||||||||||||
| Cl− | 0.27 | −0.30 | 0.17 | 0.16 | 0.31 | 0.61 | 0.49 | 1 | |||||||||||||||
| F− | 0.20 | −0.25 | 0.13 | 0.20 | 0.46 | −0.07 | 0.60 | 0.34 | 1 | ||||||||||||||
| HC03− | 0.11 | −0.29 | 0.22 | 0.09 | 0.52 | 0.26 | 0.61 | 0.33 | 0.63 | 1 | |||||||||||||
| C032− | 0.26 | 0.24 | −0.07 | −0.04 | −0.28 | 0.02 | 0.21 | 0.10 | 0.12 | 0.13 | 1 | ||||||||||||
| P043− | −0.54 | −0.01 | 0.23 | 0.27 | 0.08 | 0.16 | 0.22 | 0.20 | 0.42 | 0.22 | 0.46 | 1 | |||||||||||
| NH4+ | 0.31 | 0.07 | 0.03 | 0.00 | −0.22 | 0.06 | 0.09 | 0.05 | 0.10 | 0.04 | 0.24 | 0.33 | 1 | ||||||||||
| Na+ | 0.47 | 0.23 | −0.05 | −0.08 | 0.16 | 0.32 | 0.50 | 0.54 | 0.29 | 0.53 | 0.23 | 0.20 | 0.09 | 1 | |||||||||
| K+ | 0.43 | 0.09 | 0.03 | 0.04 | 0.21 | −0.01 | 0.56 | 0.39 | 0.57 | 0.41 | 0.14 | 0.31 | 0.18 | 0.77 | 1 | ||||||||
| Mg2+ | −0.07 | −0.33 | 0.27 | 0.03 | 0.03 | 0.24 | 0.09 | 0.14 | 0.05 | 0.33 | 0.25 | 0.06 | −0.25 | 0.13 | −0.08 | 1 | |||||||
| Ca2+ | 0.47 | 0.31 | −0.08 | −0.08 | 0.08 | 0.33 | 0.50 | 0.52 | 0.24 | 0.67 | 0.24 | 0.17 | 0.10 | 0.99 | 0.74 | 0.10 | 1 | ||||||
| Fe2+ | 0.17 | 0.23 | 0.16 | 0.20 | 0.01 | 0.42 | 0.38 | 0.23 | 0.05 | 0.41 | 0.08 | 0.18 | 0.35 | 0.13 | 0.10 | −0.15 | 0.21 | 1 | |||||
| Mn | 0.19 | 0.20 | −0.56 | −0.07 | 0.03 | 0.07 | 0.41 | 0.05 | 0.43 | 0.47 | 0.61 | 0.61 | 0.55 | 0.22 | 0.29 | −0.11 | 0.21 | 0.40 | 1 | ||||
| Cu2+ | 0.24 | 0.36 | −0.03 | 0.01 | −0.10 | 0.10 | 0.12 | 0.08 | 0.01 | 0.14 | 0.47 | 0.05 | 0.37 | 0.10 | 0.01 | −0.10 | 0.15 | 0.57 | 0.56 | 1 | |||
| Pb2+ | 0.40 | 0.17 | −0.01 | −0.09 | 0.11 | 0.21 | −0.68 | 0.06 | 0.16 | 0.01 | 0.14 | −0.18 | 0.25 | 0.39 | 0.20 | −0.50 | 0.39 | 0.21 | 0.20 | 0.68 | 1 | ||
| Zn2+ | 0.05 | 0.28 | −0.23 | −0.15 | −0.36 | −0.06 | 0.22 | 0.16 | 0.19 | 0.09 | 0.41 | 0.33 | 0.25 | 0.02 | 0.14 | −0.19 | 0.06 | 0.31 | 0.58 | 0.27 | −0.12 | 1 | |
| Cd | 0.04 | 0.43 | −0.07 | 0.04 | −0.28 | 0.09 | 0.24 | 0.02 | 0.18 | 0.10 | 0.08 | −0.20 | 0.14 | 0.02 | −0.03 | −0.06 | 0.13 | 0.75 | 0.04 | 0.49 | 0.05 | 0.18 | 1 |
Negative correlation (r < −0.5); Deep pink, and positive correlation (r > 0.5); cyan colour.
Table A4.
Pearson correlation matrix of groundwater for the dry season.
| PH | DO | EC | TDS | Temp | N03− | SO42− | Cl− | F− | HC03− | C032− | P043− | NH4+ | Na+ | K+ | Mg2+ | Ca2+ | Fe2+ | Mn | Cu2+ | Pb2+ | Zn2+ | Cd | |
|---|---|---|---|---|---|---|---|---|---|---|---|---|---|---|---|---|---|---|---|---|---|---|---|
| PH | 1 | ||||||||||||||||||||||
| DO | −0.05 | 1 | |||||||||||||||||||||
| EC | −0.30 | −0.36 | 1 | ||||||||||||||||||||
| TDS | −0.06 | −0.18 | 0.54 | 1 | |||||||||||||||||||
| Temp | 0.11 | −0.09 | −0.33 | −0.31 | 1 | ||||||||||||||||||
| N03− | 0.10 | 0.06 | −0.18 | 0.01 | −0.08 | 1 | |||||||||||||||||
| SO42− | 0.17 | −0.60 | 0.26 | 0.45 | −0.05 | 0.22 | 1 | ||||||||||||||||
| Cl− | −0.23 | 0.16 | −0.16 | −0.31 | 0.24 | 0.00 | −0.43 | 1 | |||||||||||||||
| F− | −0.23 | −0.36 | 0.47 | 0.35 | −0.04 | −0.22 | 0.21 | −0.03 | 1 | ||||||||||||||
| HC03− | −0.25 | 0.13 | 0.13 | 0.26 | −0.23 | −0.22 | −0.08 | 0.15 | 0.50 | 1 | |||||||||||||
| C032− | −0.39 | −0.20 | 0.55 | 0.13 | 0.03 | 0.00 | −0.13 | 0.20 | 0.39 | 0.11 | 1 | ||||||||||||
| P043− | −0.28 | −0.19 | 0.30 | 0.04 | −0.31 | 0.15 | 0.03 | 0.12 | 0.41 | 0.02 | 0.25 | 1 | |||||||||||
| NH4+ | −0.13 | −0.13 | 0.08 | −0.28 | 0.03 | −0.02 | −0.08 | 0.28 | 0.22 | −0.31 | 0.24 | 0.57 | 1 | ||||||||||
| Na+ | −0.13 | −0.43 | 0.28 | 0.22 | −0.01 | 0.20 | 0.03 | −0.10 | 0.15 | −0.12 | 0.49 | 0.26 | 0.01 | 1 | |||||||||
| K+ | 0.10 | −0.14 | 0.30 | −0.06 | −0.07 | 0.41 | −0.13 | 0.09 | 0.58 | 0.40 | −0.44 | 0.25 | 0.16 | 0.57 | 1 | ||||||||
| Mg2+ | 0.31 | −0.48 | −0.09 | 0.38 | −0.06 | 0.35 | 0.80 | −0.57 | −0.02 | 0.65 | −0.36 | −0.23 | −0.41 | 0.16 | −0.15 | 1 | |||||||
| Ca2+ | −0.08 | −0.47 | 0.26 | −0.02 | 0.10 | 0.20 | −0.01 | 0.02 | −0.02 | 0.58 | 0.43 | 0.10 | −0.12 | 0.79 | 0.68 | 0.08 | 1 | ||||||
| Fe2+ | −0.20 | −0.15 | 0.33 | 0.06 | −0.16 | 0.32 | −0.01 | 0.39 | 0.15 | −0.20 | 0.62 | 0.52 | 0.52 | 0.44 | 0.55 | −0.26 | 0.35 | 1 | |||||
| Mn | −0.21 | −0.23 | 0.44 | 0.21 | −0.26 | 0.19 | 0.19 | 0.13 | −0.05 | −0.44 | 0.24 | 0.54 | 0.40 | 0.20 | 0.33 | −0.14 | 0.12 | 0.51 | 1 | ||||
| Cu2+ | −0.18 | −0.33 | −0.01 | 0.00 | −0.01 | −0.05 | −0.04 | −0.15 | −0.14 | −0.27 | −0.13 | 0.08 | −0.02 | 0.55 | 0.01 | 0.19 | 0.33 | 0.09 | 0.20 | 1 | |||
| Pb2+ | 0.11 | −0.62 | 0.39 | 0.48 | −0.10 | −0.25 | 0.81 | −0.43 | 0.27 | −0.01 | −0.08 | −0.04 | −0.17 | 0.15 | −0.14 | 0.61 | 0.09 | −0.07 | 0.15 | 0.06 | 1 | ||
| Zn2+ | 0.05 | −0.31 | 0.04 | 0.06 | −0.18 | 0.19 | 0.22 | −0.09 | 0.15 | 0.29 | 0.15 | −0.20 | −0.33 | 0.15 | 0.18 | 0.34 | 0.43 | 0.02 | −0.27 | −0.20 | 0.12 | 1 | |
| Cd | −0.06 | −0.17 | −0.09 | −0.28 | 0.56 | −0.15 | 0.11 | 0.27 | −0.02 | −0.16 | 0.18 | −0.20 | 0.21 | −0.04 | −0.22 | −0.09 | 0.05 | 0.13 | −0.01 | 0.02 | 0.07 | −0.10 | 1 |
Negative correlation (r < − 0.5); Deep pink and positive correlation (r > 0.5); cyan colour.
Table A5.
Types of Pesticides used in the Kahe catchment in Lower plain Moshi.
| INSECTICIDES | |||
|---|---|---|---|
| S/No | Trade Name | Common Name | Target |
| 01 | Dasba 40EC | Chloropyrifos | For against tomatoes |
| 02 | Duduba 450EC | Cypermethrin10% + Chlorpyrifos 35% | Control of insect pests in roses |
| 03 | Dkdime | Dimethoate | Insect pests in tomatoes and roses |
| 04 | Ninja Plus 5EC | Lambda−cyhalothrin | Insect pests in roses and tomatoes |
| 06 | Tarantula 1.8 EC | Abamectin | Control of maize stalk Borers |
| 07 | Marshal 250 EC | Carbosulfan | Roses against aphids and mites |
| 08 | Profecron 720 EC | Profenofos | Control of diamondback moth in cabbages |
| 09 | Sapa Cypermethrin 2.5%ULV | Cypermethrin | Coffee, tobacco, rice, Sugarcane against chewing and sucking pests. |
| 10 | Thiodan 35 EC | Endosulfan | Various crops against Chewing and sucking Pests. |
| 11 | Avaunt 150SC (Du−Pont) | Indoxacarb | On cotton, brassicae, tomatoes, beans and vegetables against catepillars. |
| 12 | Dudu−Acelamectin 5% EC | Abamectin 2% + Acetamiprid 3% and inert 95% | Various crops against Insect pests. |
| 13 | Dudumectin | Emamectin 4.8% + Acetameprid 6.4% | |
| 14 | AQUAWET 15 SL | Ethoxylate 15% | |
| 15 | Agro Cron 720EC | Profenofos 725 | |
| 16 | Prosper 720EC | Profenofos 60% + Cypermethrin 12% | |
| 17 | Wiltigo Plus 50 EC | Emamectin Benzoate 5% | |
| HERBICIDES | |||
| 01 | Atranex 50 SC | Atrazine | Weeds in sugarcane plantations |
| 02 | Boxyfan 240 EC | Oxyfluorfen | Weeds in sugarcane plantations |
| 03 | Parastar 200SL | Paraquat dichloride | In maize, coffee, tea, sisal, cotton,, bananas, sugarcane against common leaves and annual weeds |
| 04 | Dk Gly 480SL | Glyphosate | Pre-plant application for control of weeds in coffee, tea, cashew and cereals |
| 05 | Wildbees 720 SL | 2,4 D Amine | Control of weeds in sugarcane plantations |
| 06 | Glypro 4l SL | Phosphonomethly Glycine 48% | |
| 07 | Oxyfen 24% EC | −−− | |
| 08 | Super Round | −−− | |
| FUNGICIDES | |||
| 01 | Ebony 72 WP | Mancozeb 64% + Metalaxyl 8% WP | Against late blight disease in potatoes, tomatoes and grapes. |
| 02 | Sapa Copper Oxychloride | Copper oxychloride | Control of late blight on tomatoes |
References
- Foster, S.; Cherlet, J. The Links between Land Use and Groundwater—Governance Provisions and Management Strategies to Secure a ‘Sustainable Harvest’; Global Water Partnership: Stockholm, Sweden, 2014; p. 20. [Google Scholar]
- Foster, S.; Tuinhof, A.; Garduño, H. Groundwater Development in Sub−Saharan Africa; The World Bank: Washington, DC, USA, 2006; p. 12. [Google Scholar]
- Reddy, T.B.; Ramana, C.V.; Bhaskar, C.; Chandrababu, P.J. Assessment of heavy metal study on ground water in and around Kapuluppada MSW site, Visakhapatnam, AP. Int. J. Sci. Nat. 2012, 3, 468–471. [Google Scholar]
- Hallberg, G.R. The impacts of agricultural chemicals on ground water quality. GeoJournal 1987, 15, 283–295. [Google Scholar] [CrossRef]
- Nouri, J.; Mahvi, A.H.; Jahed, G.R.; Babaei, A.A. Regional distribution pattern of groundwater heavy metals resulting from agricultural activities. Environ. Geol. 2008, 55, 1337–1343. [Google Scholar] [CrossRef]
- Lema, E.; Machunda, R.; Njau, K. Agrochemicals use in horticulture industry in Tanzania and their potential impact to water resources. Int. J. Boil. Chem. Sci. 2014, 8, 831–842. [Google Scholar] [CrossRef]
- Al-Zarah, A.; Hussain, G.; Alquwaizany, A. Guidelines for Irrigation Water Quality and Water Management in The Kingdom of Saudi Arabia: An Overview. J. Appl. Sci. 2010, 10, 79–96. [Google Scholar]
- Bank, W. Agribusiness Indicators: Tanzania; The World Bank: Washington, DC, USA, 2012. [Google Scholar]
- Yang, T.; Li, F.; Zhou, X.; Xu, C.; Feng, J.; Fang, F. Impact of nitrogen fertilizer, greenhouse, and crop species on yield−scaled nitrous oxide emission from vegetable crops: A meta−analysis. Ecol. Indicators 2019, 105, 717–726. [Google Scholar] [CrossRef]
- Mahvi, A.H.; Nouri, J.; Babaei, A.A.; Nabizadeh, R. Agricultural activities impact on groundwater nitrate pollution. Int. J. Environ. Sci. Technol. 2005, 2, 41–47. [Google Scholar] [CrossRef] [Green Version]
- EPA. National Recommended Water Quality Criteria; United States Environmental Protection Agency, Office of Water, Office of Science and Technology: Washington, DC, USA, 2009. [Google Scholar]
- Keskin, T.E. Nitrate and heavy metal pollution resulting from agricultural activity: A case study from Eskipazar (Karabuk, Turkey). Environ. Earth Sci. 2010, 61, 703–721. [Google Scholar] [CrossRef]
- Sekhon, G. Fertilizer-N use efficiency and nitrate pollution of groundwater in developing countries. J. Contam. Hydrol. 1995, 20, 167–184. [Google Scholar]
- Rui, Y.-K.; Shen, J.-B.; Zhang, F.-S. Application of ICP-MS to determination of heavy metal content of heavy metals in two kinds of N fertilizer. Environmentalist 2008, 28, 2425–2427. [Google Scholar]
- Malassa, H.; Al-Qutob, M.; Al-Khatib, M.; Al-Rimawi, F. Determination of Different Trace Heavy Metals in Ground Water of South West Bank/Palestine by ICP/MS. J. Environ. Prot. 2013, 4, 818–827. [Google Scholar] [CrossRef] [Green Version]
- Awofolu, O.R. Elemental contaminants in groundwater: A study of trace metals from residential area in the vicinity of an industrial area in Lagos, Nigeria. Environmentalist 2006, 26, 285. [Google Scholar] [CrossRef]
- Abdel-Satar, A.M.; Al-Khabbas, M.H.; Alahmad, W.R.; Yousef, W.M.; Alsomadi, R.H.; Iqbal, T. Quality assessment of groundwater and agricultural soil in Hail region, Saudi Arabia. Egypt. J. Aquat. Res. 2017, 43, 55–64. [Google Scholar] [CrossRef]
- Mkude, I.T. Comparative Analysis of Heavy Metals from Groundwater Sources Situated in Keko and Kigogo Residential Areas Dares Salaam. J. Water Resour. Ocean Chanies 2015, 4, 1–5. [Google Scholar] [CrossRef]
- Zalidis, G.; Stamatiadis, S.; Takavakoglou, V.; Eskridge, K.; Misopolinos, N. Impacts of agricultural practices on soil and water quality in the Mediterranean region and proposed assessment methodology. Agric. Ecosyst. Environ. 2002, 88, 137–146. [Google Scholar] [CrossRef]
- Rajappa, B.; Manjappa, S.; Puttaiah, E. Monitoring of heavy metal concentration in groundwater of Hakinaka Taluk, India. Contemp. Eng. Sci. 2010, 3, 183–190. [Google Scholar]
- Malidareh, H.B.; Mahvi, A.H.; Yunesian, M.; Alimohammadi, M.; Nazmara, S. Effect of fertilizer application on paddy soil heavy metals concentration and groundwater in north of Iran. Middle−East J. Sci. Res. 2014, 20, 1721–1727. [Google Scholar]
- McCauley, A.; Jones, C.; Jacobsen, J. Commercial Fertilizers and Soil Amendments; Nutrient Management Module No. 10; A Self−study Course from MSU Extension Continuing Education Series; Montana State University Extension: Bozeman, MT, USA, 2009. [Google Scholar]
- Suthar, S.; Bishnoi, P.; Singh, S.; Mutiyar, P.K.; Nema, A.K.; Patil, N.S. Nitrate contamination in groundwater of some rural areas of Rajasthan, India. J. Hazard. Mater. 2009, 171, 189–199. [Google Scholar] [CrossRef]
- WHO. Guidelines for Drinking Water Quality. WHO Chron. 2011, 38, 104–108. [Google Scholar]
- McKenzie, J.M.; Mark, B.G.; Thompson, L.G.; Schotterer, U.; Lin, P.-N. A hydrogeochemical survey of Kilimanjaro (Tanzania): Implications for water sources and ages. Hydrogeol. J. 2010, 18, 985–995. [Google Scholar] [CrossRef]
- GITEC, W. Groundwater Assessment of the Pangani Basin, Tanzania; The Pangani Basin Water Board (PBWB) and Internation Union for Conservation of Nature (IUCN): Moshi, Tanzania, 2011; p. 151. [Google Scholar]
- Soini, E. Changing Landscapes on the Southern Slopes of Mt. Kilimanjaro, Tanzania. An Aerial Photo Interpretation bewtween 1990 and 2000; International Centre for Research in Agroforestry (ICRAF): Nairobi, Kenya, 2002; p. 113. [Google Scholar]
- Mbonile, M.J.; Misana, S.; Sokoni, C. Land Use Change Patterns and Root Causes of Land Use Change on the Southern Slopes of Mount Kilimanjaro, Tanzania; ILRI: Nairobi, Kenya, 2003; p. 44. [Google Scholar]
- Grossmann, M. The Kilimanjaro Aquifer: A case study for the research project “Transboundary groundwater management in Africa”—Conceptualizing cooperation on Africa’s transboundary groundwater resources. DIE Stud. DIE Bonn Ger. 2008, 11, 87–124. [Google Scholar]
- Hallberg, G.R. Pesticides pollution of groundwater in the humid United States. Agric. Ecosyst. Environ. 1989, 26, 299–367. [Google Scholar] [CrossRef]
- Vrba, J. The impact of aquifer intensive use on groundwater quality. In Intensive Use of Groundwater. Challenges and Opportunities; International Association of Hydrogeologists (IAH): Prague, The Czech Republic, 2003; pp. 113–132. [Google Scholar]
- Mihale, M.; Kishimba, M. Contamination of water and sediments by obsolete pesticides at Vikuge farm, Kibaha distric, Tanzania. Tanzan. J. Sci. 2004, 30, 21–32. [Google Scholar] [CrossRef]
- Arias-Estévez, M.; López-Periago, E.; Martínez-Carballo, E.; Simal-Gandara, J.; Mejuto, J.-C.; Garcia-Rio, L. The mobility and degradation of pesticides in soils and the pollution of groundwater resources. Agric. Ecosyst. Environ. 2008, 123, 247–260. [Google Scholar] [CrossRef]
- Ngowi, A.V.; Mbise, T.J.; Ijani, A.S.; London, L.; Ajayi, O.C. Smallholder vegetable farmers in Northern Tanzania: Pesticides use practices, perceptions, cost and health effects. Crop Prot. 2007, 26, 1617–1624. [Google Scholar] [CrossRef] [Green Version]
- Henry, L.; Kishimba, M. Levels of pesticide residues in water, soil and sediments from southern Lake Victoria and its basin. Tanzan. J. Sci. 2003, 29, 77–90. [Google Scholar] [CrossRef]
- Rwetabula, J.; De Smedt, F.; Rebhun, M.; Mwanuzi, F. Transport of micropollutants and phosphates in the Simiyu river (tributary of Lake Victoria), Tanzania. In Proceedings of the 1st International Conference on Environmental Science and Technology, New Orleans, LA, USA, 23−26 January 2005. [Google Scholar]
- Kihampa, C.; Mato, R.R.; Mohamed, H. Residues of Organochlorinated Pesticides in Soil from Tomato Fields, Ngarenanyuki, Tanzania. J. Appl. Sci. Environ. Manag. 2010, 14. [Google Scholar] [CrossRef]
- Hellar-Kihampa, H. Organochlorine pesticide residues in soil from sugarcane plantations in Kilimanjaro, Tanzania. Int. J. Boil. Chem. Sci. 2011, 5, 247–257. [Google Scholar] [CrossRef]
- Hellar, H.; Kishimba, M. Pesticide residues in water from TPC sugarcane plantations and environs, Kilimanjaro region, Tanzania. Tanzan. J. Sci. 2005, 31, 13–22. [Google Scholar] [CrossRef]
- Røhr, P.C. Killingtveit, Ånund Rainfall distribution on the slopes of Mt Kilimanjaro. Hydrol. Sci. J. 2003, 48, 65–77. [Google Scholar] [CrossRef]
- Hemp, A. Ecology of the pteridophytes on the southern slopes of Mt. Kilimanjaro. Part II: Habitat selection. Plant Biol. 2001, 3, 493–523. [Google Scholar] [CrossRef]
- Røhr, P.C. A Hydrological Study Concerning the Southern Slopes of Mt Kilimanjaro, Tanzania. Ph.D. Thesis, Norwegian University of Science and Technology, Trondheim, Norway, 2003. [Google Scholar]
- Groves, D.I. Geological Atlas of Africa, with Notes on Stratigraphy, Tectonics, Economic Geology, Geohazards, Geosites and Geoscientific Education of Each Country. Thomas Schluter. Pp 308, with CD−ROM. Springer−Verlag, Berlin, Germany. 2008. ISBN 9787−3−540−76324−6. Price USD249. 00. Econ. Geol. 2008, 103, 1379. [Google Scholar]
- Chacha, N.; Njau, K.N.; Lugomela, G.V.; Muzuka, A.N.N. Hydrogeochemical characteristics and spatial distribution of groundwater quality in Arusha well fields, Northern Tanzania. Appl. Water Sci. 2018, 8, 118. [Google Scholar] [CrossRef] [Green Version]
- Instruments, H. HI 9828 Multiparameter Instruction Manual; HANNA Instruments: Ann Arbor, MI, USA, 2006. [Google Scholar]
- Sundaram, B.; Feitz, A.; de Caritat, P.; Plazinska, A.; Brodie, R.; Coram, J.; Ransley, T. Groundwater sampling and analysis—A field guide. Geosci. Aust. Rec. 2009, 27, 104. [Google Scholar]
- APHA, A. WPCF, Standard Methods for the Examination of Water and Wastewater; American Public Health Association: Washington, DC, USA, 1995. [Google Scholar]
- Liška, I. Pesticides in Water: Sampling, Sample Preparation, Preservation. In Encyclopedia of Analytical Chemistry: Applications, Theory and Instrumentation; John Wiley & Sons: Hoboken, NJ, USA, 2006. [Google Scholar]
- Hach, D. 2800 Spectrophotometer: Procedures Manual; Hach Company: Duesseldorf, Germany, 2007. [Google Scholar]
- Akerblom, M. Environmental Monitoring of Pesticide Residues—Guidelines for the SADC Region; Monitoring Technique Series 3; SADC/ELMS: Maseru, Lesotho, 1995. [Google Scholar]
- Utom, A.U.; Odoh, B.I.; Egboka, B.C. Assessment of hydrogeochemical characteristics of groundwater quality in the vicinity of Okpara coal and Obwetti fireclay mines, near Enugu town, Nigeria. Appl. Water Sci. 2013, 3, 271–283. [Google Scholar] [CrossRef] [Green Version]
- Hammer, Ø.; Harper, D.A.; Ryan, P.D. PAST: Paleontological statistics software package for education and data analysis. Palaeontol. Electron. 2001, 4, 9. [Google Scholar]
- Davidson, I.; Ravi, S. Clustering with constraints: Feasibility issues and the k−means algorithm. In Proceedings of the 2005 SIAM International Conference on Data Mining, Newport Beach, CA, USA, 21–23 April 2005. [Google Scholar]
- Piper, A.M. A graphic procedure in the geochemical interpretation of water-analyses. Trans. Am. Geophys. Union 1944, 25, 914–928. [Google Scholar] [CrossRef]
- TBS. Potable Water−Specification: 2016; East Africa Community (EAC), Tanzania Bureau of Standard: Dar es Salaam, Tanzania, 2016. [Google Scholar]
- WHO. Guidelines for Drinking-Water Quality: Second Addendum. Vol. 1, Recommendations; World Health Organization: Geneva, Switzerland, 2008. [Google Scholar]
- Kumar, S.K.; Rammohan, V.; Sahayam, J.D.; Jeevanandam, M. Assessment of groundwater quality and hydrogeochemistry of Manimuktha River basin, Tamil Nadu, India. Environ. Monit. Assess. 2009, 159, 341. [Google Scholar] [CrossRef]
- Bhardwaj, V.; Singh, D.S. Surface and groundwater quality characterization of Deoria District, Ganga plain, India. Environ. Earth Sci. 2011, 63, 383–395. [Google Scholar] [CrossRef]
- Brindha, K.; Kavitha, R. Hydrochemical assessment of surface water and groundwater quality along Uyyakondan channel, south India. Environ. Earth Sci. 2015, 73, 5383–5393. [Google Scholar] [CrossRef]
- Ghiglieri, G.; Pittalis, D.; Cerri, G.; Oggiano, G. Hydrogeology and hydrogeochemistry of an alkaline volcanic area: The NE Mt. Meru slope (East African Rift—Northern Tanzania). Hydrol. Earth Syst. Sci. 2012, 16, 529–541. [Google Scholar] [CrossRef]
- Rajesh, R. Hydrogeology and Hydrogeochemical Characterisation of Groundwater of a Part of Nalgonda District Andhra Pradesh India; Anna University: Chennai, India, 2014; p. 121. [Google Scholar]
- Guo, H.; Zhang, Y.; Xing, L.; Jia, Y. Spatial variation in arsenic and fluoride concentrations of shallow groundwater from the town of Shahai in the Hetao basin, Inner Mongolia. Appl. Geochem. 2012, 27, 2187–2196. [Google Scholar] [CrossRef]
- Chae, G.; Yun, S.; Mayer, B.; Kim, S.; Kwon, J.; Kim, K.; Koh, Y. Fluorine geochemistry in bedrock groundwater of South Korea. Sci. Total Environ. 2007, 385, 272–283. [Google Scholar] [CrossRef] [PubMed]
- Ju, X.; Kou, C.; Zhang, F.; Christie, P. Nitrogen balance and groundwater nitrate contamination: Comparison among three intensive cropping systems on the North China Plain. Environ. Pollut. 2006, 143, 117–125. [Google Scholar] [CrossRef] [PubMed] [Green Version]
- Egboka, B. Nitrate contamination of shallow groundwaters in Ontario, Canada. Sci. Total Environ. 1984, 35, 53–70. [Google Scholar] [CrossRef]
- Scheytt, T. Seasonal Variations in Groundwater Chemisty Near Lake Belau, Schleswig-Holstein, Northern Germany. Hydrogeol. J. 1997, 5, 86–95. [Google Scholar] [CrossRef]
- Patil, V.T.; Patil, P.R. Physicochemical Analysis of Selected Groundwater Samples of Amalner Town inJalgaon District, Maharashtra, India. J. Chem. 2010, 7, 111–116. [Google Scholar] [CrossRef] [Green Version]
- Degryse, F.; Ajiboye, B.; Baird, R.; Da Silva, R.C.; McLaughlin, M.J. Availability of fertiliser sulphate and elemental sulphur to canola in two consecutive crops. Plant Soil 2016, 398, 313–325. [Google Scholar] [CrossRef]
- Adepoju-Bello, A.; Ojomolade, O.O.; Ayoola, G.A.; Coker, H.A.B. Quantitative analysis of some toxic metals in domestic water obtained from Lagos metropolis. Nig. J. Pharm. 2009, 42, 57–60. [Google Scholar]
- Marcovecchio, J.E.; Botté, S.E.; Freije, R.H. Heavy metals, major metals, trace elements. Handb. Water Anal. 2007, 2, 275–311. [Google Scholar]
- Idoko, O.M. Seasonal Variation in Iron in Rural Groundwater of Benue State, Middle Belt, Nigeria. Pak. J. Nutr. 2010, 9, 892–895. [Google Scholar] [CrossRef]
- Singhal, B.; Gupta, R. Applied Hydrogeology of Fractured Rocks; Springer Science and Business Media LLC: Berlin/Heidelberg, Germany, 2010. [Google Scholar]
- Sirajudeen, J.; Abdul Jameel, A. Studies on heavy metal pollution of Groundwater sources between Tamilnadu and Pondicherry India. J. Ecotoxicol. Environ. Monit. 2006, 16, 443–446. [Google Scholar]
- Hem, J.D. Study and Interpretation of the Chemical Characteristics of Natural Water; Department of the Interior, US Geological Survey: Alexandria, VA, USA, 1985; Volume 2254.
- Aggarwal, T.; Singh, K.; Gupta, A. Impact of sewage containing domestic wastes and heavy metals on the chemistry of Varuna river water. Pollut. Res. 2000, 19, 491–494. [Google Scholar]
- Amori, A.; Oduntan, O.O.; Okeyode, I.C.; Ojo, S.O. Heavy metal concentration of groundwater deposits in odeda region, Ogun state, Nigeria. E3 J. Environ. Res. Manag. 2013, 4, 253–259. [Google Scholar]
- Ghanem, M.; Samhan, S.; Carlier, E.; Ali, W. Groundwater pollution due to pesticides and heavy metals in North West Bank. J. Environ. Prot. 2010, 2, 429–434. [Google Scholar] [CrossRef]
- Buragohain, M.; Bhuyan, B.; Sarma, H.P. Seasonal variations of lead, arsenic, cadmium and aluminium contamination of groundwater in Dhemaji district, Assam, India. Environ. Monit. Assess. 2010, 170, 345–351. [Google Scholar] [CrossRef]
- Morris, B.L.; Lawrence, A.R.; Chilton, P.J.C.; Adams, B.; Calow, R.C.; Klinck, B.A. Groundwater and Its Susceptibility to Degradation: A Global Assessment of the Problem and Options for Management; United Nations Environment Programme: Nairobi, Kenya, 2003; Volume 3. [Google Scholar]
- Leistra, M.; Boesten, J.J.T.I. Pesticide Leaching from Agricultural Fields with Ridges and Furrows. Water Air Soil Pollut. 2010, 213, 341–352. [Google Scholar] [CrossRef] [Green Version]
- Sundaram, A. Journal of Environmental Science and Health. Part B, Pesticides, Food Contaminants, and Agricultural Wastes. J. Environ. Sci. Health Part B Pestic. Food Contam. Agric. Wastes 1990, 25, 309. [Google Scholar] [CrossRef]
- Rani, M.; Saini, S.; Kumari, B. Leaching behaviour of chlorpyriphos and cypermethrin in sandy loam soil. Environ. Monit. Assess. 2014, 186, 175–182. [Google Scholar] [CrossRef]
Figure 1.
Study area map of Kahe catchment.

Figure 2.
(a) Hydrogeological map of Kahe Catchment; (b) hydrogeological cross-section A–A along the north–south direction.
Figure 2.
(a) Hydrogeological map of Kahe Catchment; (b) hydrogeological cross-section A–A along the north–south direction.


Figure 3.
Dendrogram showing clustering of sampled groundwater.

Figure 4.
Relationship between total dissolved solids (TDS) and EC.

Figure 5.
Piper diagram for the chemical composition of groundwater for (a) wet season (b) dry season.
Figure 5.
Piper diagram for the chemical composition of groundwater for (a) wet season (b) dry season.

Figure 6.
Nitrate variation with depth.

Figure 7.
Relationship between phosphate and ammonium.

Figure 8.
Average concentration of heavy metals.

Table 1.
Summary statistics of measured variables in the sampled groundwater compared with drinking water guidelines.
Table 1.
Summary statistics of measured variables in the sampled groundwater compared with drinking water guidelines.
| Wet Season | Dry Season | |||||||||
|---|---|---|---|---|---|---|---|---|---|---|
| Variable | Min | Max | Mean | SD | Min | Max | Mean | SD | TBS (2016) | WHO (2011) |
| PH | 6.57 | 8.41 | 7.46 | 0.11 | 6.12 | 7.83 | 7.22 | 0.08 | 6.5–8.5 | 6.5–8.5 |
| EC | 158.6 | 1992 | 797.38 | 99.25 | 103.40 | 1294 | 598.43 | 64.90 | 1500 | - |
| TDS | 54 | 1186 | 459.76 | 56.91 | 187 | 1097 | 494.32 | 46.78 | 700 | 1000 |
| Temp | 21.9 | 27.8 | 24.7 | 0.27 | 22.3 | 27.7 | 24.9 | 0.30 | - | - |
| NO3− | 1.40 | 89.90 | 18.08 | 4.04 | 1.80 | 40.50 | 7.63 | 1.65 | 45 | 50 |
| SO42− | 0.0 | 55.00 | 17.40 | 3.81 | 0.00 | 43.00 | 11.12 | 2.79 | 400 | 250 |
| Cl− | 1.82 | 111.47 | 21.58 | 6.12 | 5.27 | 22.86 | 12.08 | 0.95 | 250 | 250 |
| F− | 0.20 | 1.61 | 0.68 | 0.09 | 0.06 | 1.54 | 0.54 | 0.10 | 4 | 1.5 |
| HCO3− | 60 | 760 | 250.8 | 36.13 | 0 | 664 | 312.24 | 27.94 | - | - |
| PO43− | 0.09 | 1.86 | 0.66 | 0.08 | 0.09 | 1.17 | 0.45 | 0.07 | 2.2 | - |
| NH4+ | 0.01 | 0.32 | 0.14 | 0.02 | 0.01 | 0.41 | 0.13 | 0.02 | 2 | - |
| Na+ | 2.10 | 167.1 | 57.26 | 9.96 | 2.00 | 137.00 | 44.49 | 7.44 | 200 | 200 |
| K+ | 0.20 | 22.7 | 8.00 | 1.35 | 1.70 | 22.80 | 6.65 | 0.99 | - | - |
| Mg2+ | 2.20 | 256 | 86.21 | 24.59 | 4.40 | 165.40 | 39.16 | 8.32 | 500 | - |
| Ca2+ | 1.50 | 41.90 | 15.29 | 2.39 | 2.80 | 45.80 | 13.37 | 2.28 | 100 | - |
| Fe2+ | 0.03 | 0.59 | 0.17 | 0.03 | 0.03 | 0.39 | 0.14 | 0.02 | 1 | 0.3 |
| Mn2+ | 0.01 | 0.19 | 0.04 | 0.01 | 0.01 | 0.18 | 0.05 | 0.01 | 0.5 | 0.4 |
| Cu2+ | 0.00 | 0.53 | 0.11 | 0.02 | 0.00 | 0.15 | 0.06 | 0.01 | 3 | 5 |
| Pb2+ | 0.00 | 0.13 | 0.04 | 0.01 | 0.00 | 0.80 | 0.10 | 0.05 | 0.1 | 0.05 |
| Zn2+ | 0.12 | 2.57 | 0.66 | 0.07 | 0.04 | 0.66 | 0.31 | 0.03 | 15 | 5 |
| Cd2+ | 0.00 | 0.97 | 0.005 | 0.001 | 0.00 | 0.22 | 0.007 | 0.002 | 0.05 | 0.01 |
All units are in mg/l except pH (unitless), electrical conductivity (μS/cm), temperature (°C), SD—standard deviation.
Table 2.
One-way ANOVA single-factor results comparing major ions in the wet and dry season.
| Parameter | df | F | p-Value |
|---|---|---|---|
| Na+ | 1 a, 48 b | 1.053 | 0.310 |
| K+ | 1 a, 48 b | 0.648 | 0.425 |
| Mg2+ | 1 a, 48 b | 2.506 | 0.120 |
| Ca2+ | 1 a, 48 b | 0.335 | 0.565 |
| HCO3− | 1 a, 48 b | 1.225 | 0.274 |
| Cl− | 1 a, 48 b | 2.353 | 0.132 |
| SO42− | 1 a, 48 b | 1.768 | 0.190 |
a Degree of freedom (df) between groups, b Degree of freedom (df) within groups.
Table 3.
One-way ANOVA, single-factor results comparing the wet and dry season.
| Parameter | df | F | p-Value |
|---|---|---|---|
| Fe | 1 a, 48 b | 0.79 | 0.379 |
| Mn | 1 a, 48 b | 0.31 | 0.579 |
| Cu | 1 a, 48 b | 4.67 | 0.012 |
| Pb | 1 a, 48 b | 3.19 | 0.031 |
| Zn | 1 a, 48 b | 8.50 | 0.005 |
| Cd | 1 a, 48 b | 1.84 | 0.183 |
a Degree of freedom between groups, b Degree of freedom within groups.
Table 4.
Types of fertilizers used in a studied area from field survey from the farmers.
| S/No | Fertilizers | Ingredients | Constituents |
|---|---|---|---|
| 01 | Crop Wonder max | N.P.K (24:24:19) | Fe, Cu, Zn, Mo, Cd, and Mn |
| 02 | SYNERGIZER | N.P.K (8:32:4) | Mg, Fe, Pb, Mn, S, and Zn |
| 03 | BOOSTER | --- | Mn, Fe, Pb, Zn, Cu and Cd |
| 04 | UREA CO(NH2)2. | N.P.K (46:0:0) | Fe, Pb, Zn, Cu |
| 05 | DAP (NH4)2HPO4 | 18% N, 46% P2O5 and 20% P | ---- |
| 06 | CAN | Ca, NH4 and N | ---- |
© 2019 by the authors. Licensee MDPI, Basel, Switzerland. This article is an open access article distributed under the terms and conditions of the Creative Commons Attribution (CC BY) license (http://creativecommons.org/licenses/by/4.0/).
Share and Cite
MDPI and ACS Style
Lwimbo, Z.D.; Komakech, H.C.; Muzuka, A.N. Impacts of Emerging Agricultural Practices on Groundwater Quality in Kahe Catchment, Tanzania. Water 2019, 11, 2263. https://doi.org/10.3390/w11112263
AMA Style
Lwimbo ZD, Komakech HC, Muzuka AN. Impacts of Emerging Agricultural Practices on Groundwater Quality in Kahe Catchment, Tanzania. Water. 2019; 11(11):2263. https://doi.org/10.3390/w11112263
Chicago/Turabian StyleLwimbo, Zuberi D., Hans C. Komakech, and Alfred NN. Muzuka. 2019. "Impacts of Emerging Agricultural Practices on Groundwater Quality in Kahe Catchment, Tanzania" Water 11, no. 11: 2263. https://doi.org/10.3390/w11112263
Note that from the first issue of 2016, this journal uses article numbers instead of page numbers. See further details here.