Numerical and Laboratory Investigations of Closely-Spaced and Joint Infiltration of Precipitation and Treated Waste Water


1
Technische Universität Dresden, Institute of Groundwater Management, Bergstraße 66, 01069 Dresden, Germany
2
Helmholtz-Centre for Environmental Research, Department Monitoring and Exploration Technologies, Permoserstraße 15, 04318 Leipzig, Germany
*
Author to whom correspondence should be addressed.
†
Both authors contributed equally to this study and should be considered as co-first authors.
Water 2019, 11(11), 2262; https://doi.org/10.3390/w11112262
Submission received: 24 September 2019
/
Revised: 15 October 2019
/
Accepted: 24 October 2019
/
Published: 28 October 2019
(This article belongs to the Section Wastewater Treatment and Reuse)
Abstract
:The closely-spaced infiltration of treated waste water and precipitation water may have advantages when compared to the single infiltration, such as reduction of construction costs and space requirements. Recent numerical works showed the theoretical applicability of this approach. A physical tank experiment has been set-up to study the processes in more detail and provide real data on the water flow as well as the purification potential during infiltration. Various scenarios of treated waste water infiltration with and without precipitation events have been technically realized. These data have then been used to implement a numerical model that supported the review of criteria for a proof of the principal applicability. A joint infiltration set-up is proposed and analyzed after successful evaluation of the closely-spaced, but separated infiltration of treated waste water and precipitation water. Again, both the laboratory and numerical works show the principal applicability of the proposed technique.
1. Introduction
The infiltration of treated waste water, often applied at Managed Aquifer Recharge (MAR) sites [1], generally combines both the disposal of this surplus water and improvement of its quality. Preferably, the unsaturated zone is used for water purification [2]. In addition, the infiltrated water might eventually recharge a local or regional groundwater body. From a water management perspective, this process includes significant advantages, such as groundwater level stabilization [3], creating hydraulic barriers against potential seawater intrusion [4], and no need for surface water reservoirs prone to evaporation [5], as well as algae growth [5] or providing breeding ground for mosquitos [6]. Finally, the recharged water can be recovered either on a long-time scale, on a seasonal base, or in case of emergencies [3].
Treated waste water infiltration and subsequent reuse has been realized for decades in the Dan Region, Israel (e.g., [7]). Here, large amounts of water originating from the Tel Aviv treatment facility Shafdan are infiltrated by applying surface spreading methods, more precisely infiltration basins [7]. Water is recovered for agricultural irrigation purposes after percolation through the unsaturated soil zone and a long aquifer residence time [7]. Paul and Blunt [8] studied the possibility of tertiary-treated waste water injection into a Cretaceous chalk and its reuse as an option for the water supply of London, UK. For this, they used feasibility mapping, numerical modeling, and chalk core pumping experiments. Decentralized waste water treatment and disposal for rural regions has been studied, e.g., in the Kingdom of Jordan [9] and at many other areas worldwide.
With regard to quality improvement, the removal of organic carbon, nutrients, and microbial pathogens is observed for a considerable number of MAR sites [6]. In addition, the results of various field and laboratory studies indicate that water quality improvement occurs during percolation through the unsaturated soil zone [10,11,12,13]. However, the infiltration or injection of low-quality waters also includes a risk of further contamination of the subsurface and aquifer [6]. Groundwater is the most important water resource worldwide and also in Germany (approx. 74% of total German drinking water production after [14]). Therefore, every action related to the infiltration of low quality water has to ensure the protection of the groundwater system from the deterioration of its quality, e.g., [15].
Under certain conditions and if in agreement with additional regulations and federal law, German framework legislation also allows for the infiltration of treated waste water into subsurface [16]. The design of infiltration systems for treated waste water, originating from decentralized waste water treatment systems up to 50 population equivalents [17,18], is regulated by guideline DIN 4261-5 [19]. Despite the high value of those guidelines, progressing reconsideration and adaptation to meet new requirements or to transfer new scientific insights into practice is indispensable. Therefore, the aim of the investigations presented here was to provide valid arguments for an enlargement of treated waste water infiltration systems by combination with the infiltration of precipitation waters.
Based on the model concept that was developed by [20], a three-dimensional (3D) laboratory tank experiment was realized for the closely-spaced infiltration of treated waste water and precipitation water. Additionally, numerical works have been realized in the present study to validate the observations in the tank. Next to the closely-spaced infiltration using separated ditches, the influence of joint treated waste water and precipitation water infiltration has also been studied. More precisely, the hydraulic conditions in the unsaturated soil zone, the spatial effects of infiltration, and in addition the purification performance were investigated. With respect to both technical solutions, the principal applicability (i.e., with respect to the conditions studied here) was proven by checking whether the following criteria are met:
- Prevent a significant hydraulic influence on the infiltration of treated waste water in case of simultaneous occurrence of precipitation infiltration.
- Avoid pronounced periods of fully saturated conditions below the adjacent treated waste water infiltration ditch or joint infiltration ditch, respectively, due to the additionally infiltrated precipitation water quantities.
- Allow for sufficient subsurface retention space for infiltration of treated waste water and precipitation water.
- Provide sufficient oxygen supply to reduce influence on the purification of treated waste water also for joint treated waste water and precipitation water infiltration.
Those four criteria are examined and evaluated in the following laboratory and numerical works.
2. Materials and Methods
2.1. Laboratory Tank
2.1.1. Tank Concept, Build-Up, and Instrumentation
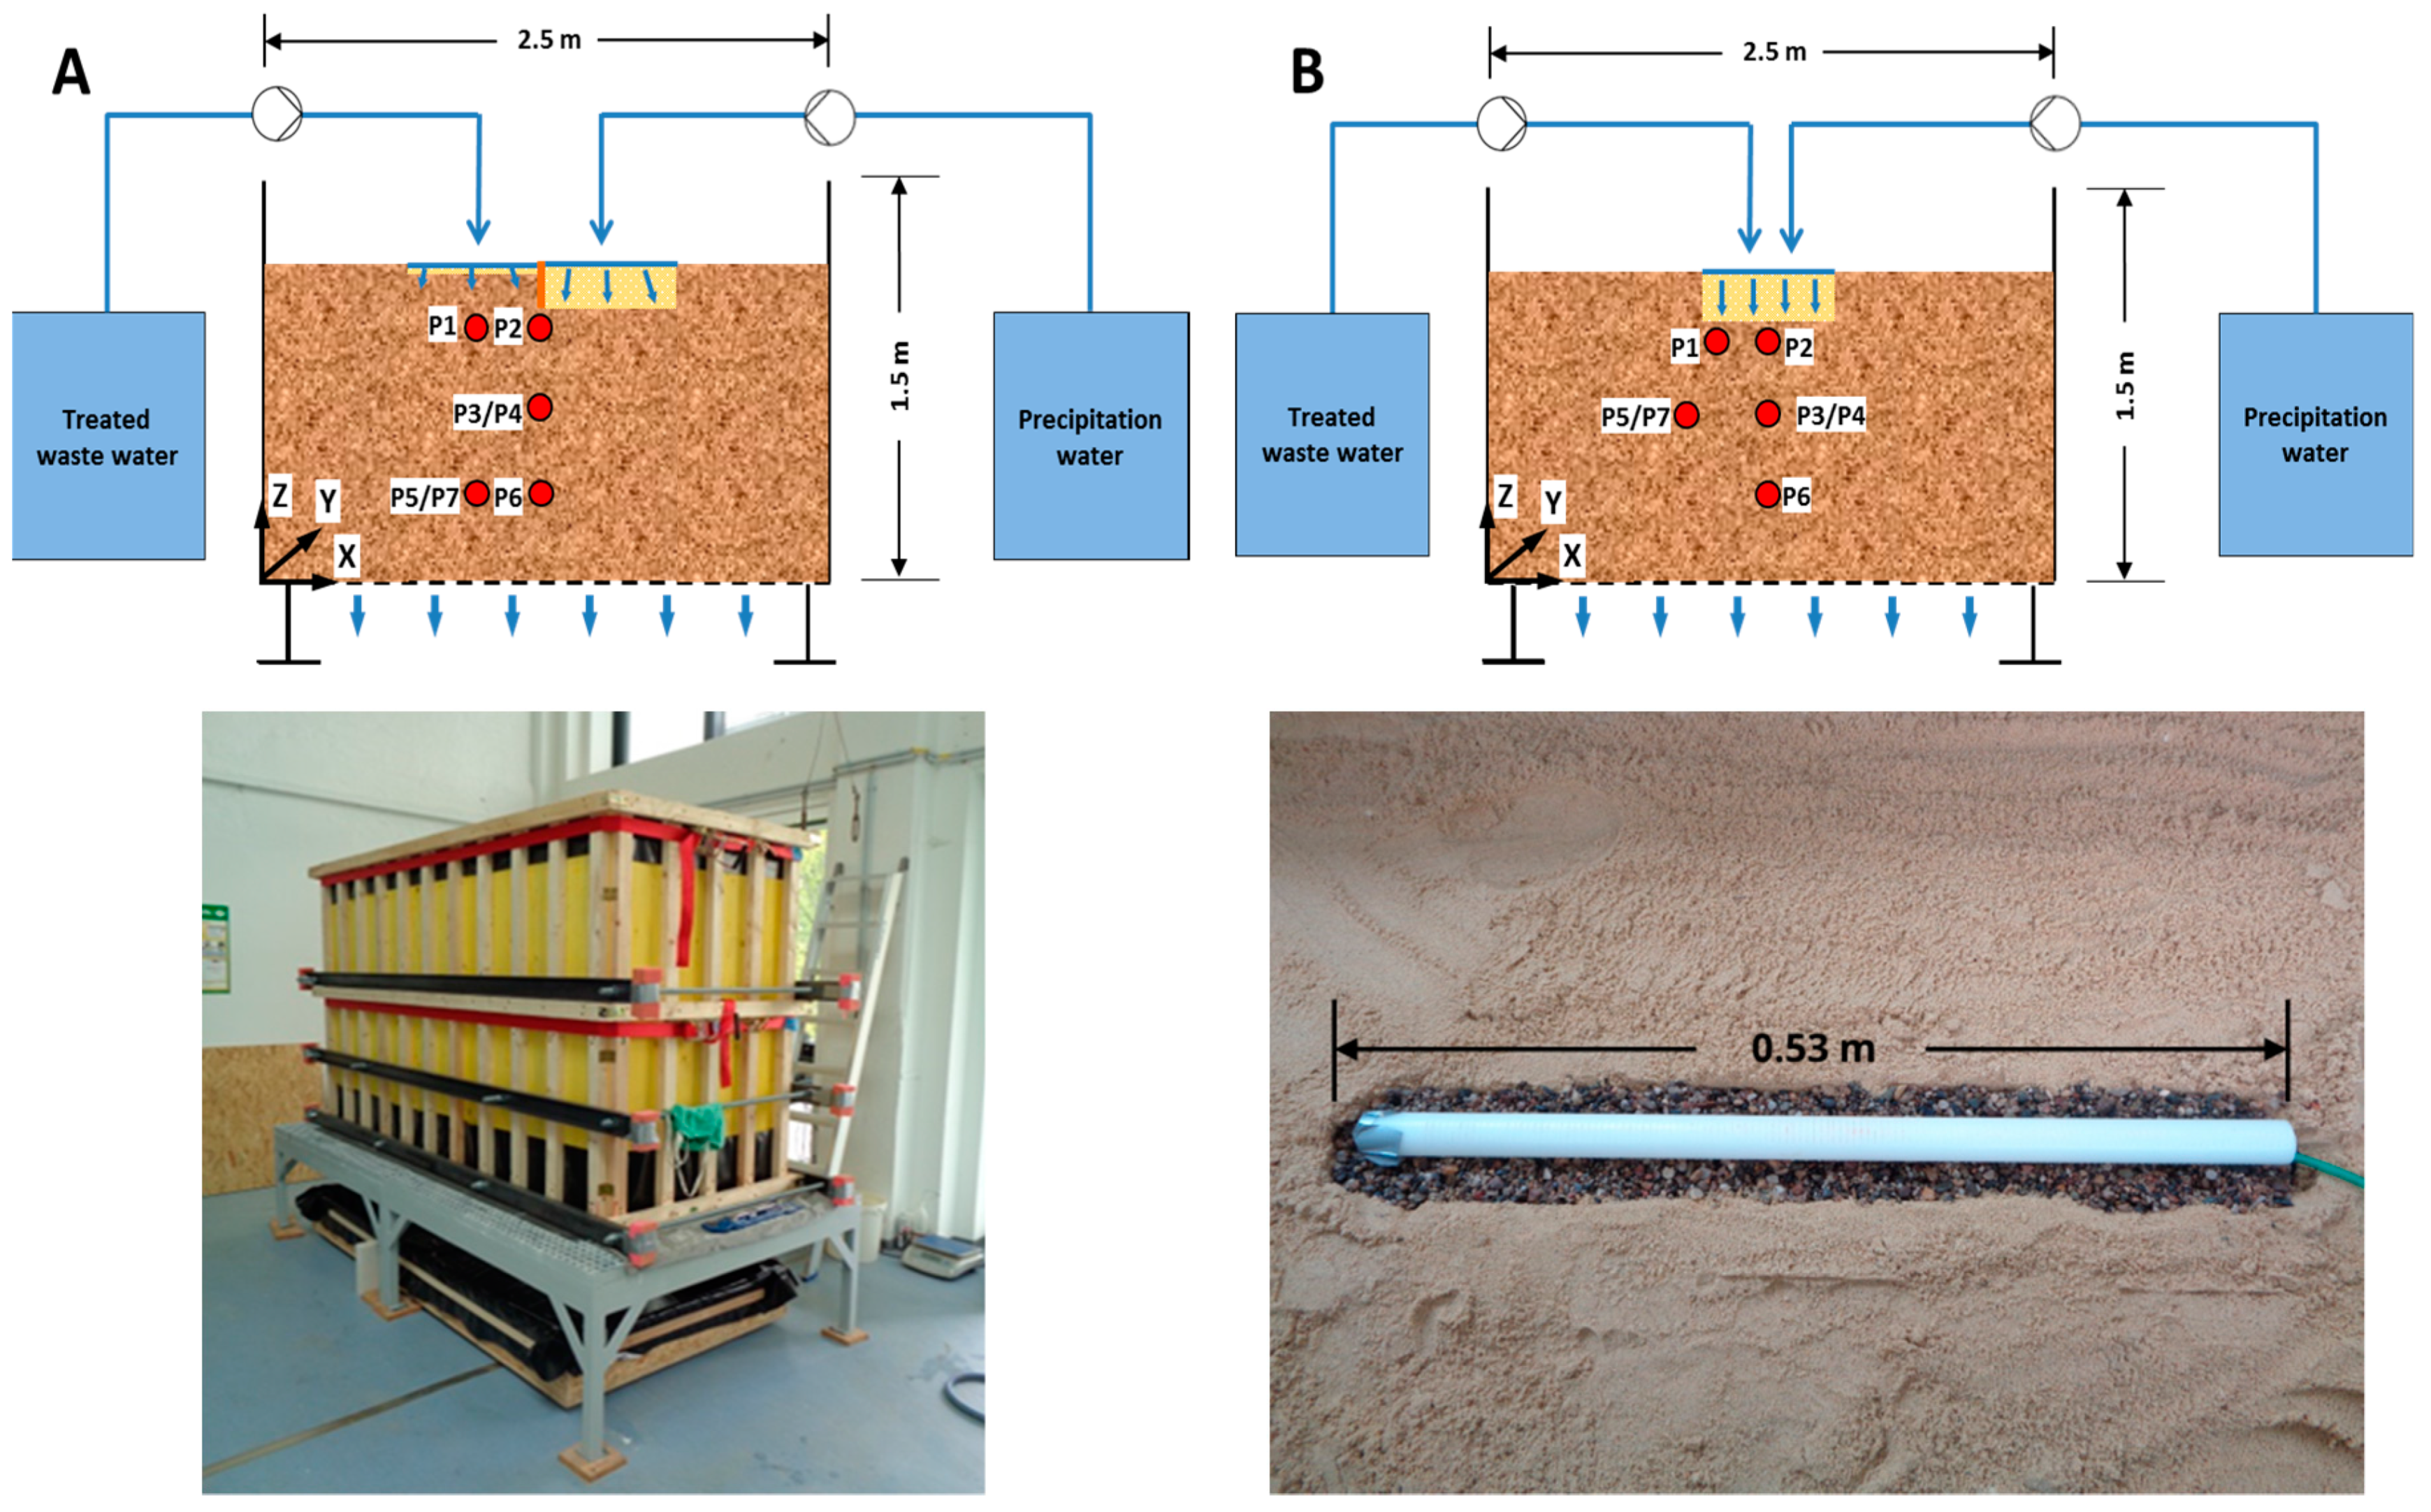
A rectangular-shaped, 3D-tank was constructed with extents to address the study aims (L × W × H) of 2.5 m × 1.0 m × 1.5 m. Two different set-ups of on-site infiltration systems were studied consecutively—side by side arranged ditches for separated, but closely-spaced infiltration (Figure 1A), as well as a single ditch for joint infiltration (Figure 1B) of treated waste water and precipitation water.
The 3D-tank was packed with sandy soil (for characterization see Table 1) to a height of 1.15 m and compacted to a bulk density of approx. 1.6 g cm−3. Three consecutive retention behavior laboratory experiments (Hyprop, Co. METER Group, Munich, Germany [21]) have been realized, providing, among others, data for van Genuchten retention model [22]. Two of them were obtained by core cutting in the laboratory experiments close to observation point P2 in the separated ditches tank experiment (Sample 1 and 2), the third one (Sample 3) was a disturbed sample packed with the highest achievable bulk density. A perforated plate (63 µm mesh size) was installed as a lower boundary condition. Ditches for treated waste water and precipitation infiltration filled with gravel (K value equals to 25,920 cm day−1 as measured while using permeameter test after [23], total porosity equals to approx. 0.38 determined by retention behavior laboratory experiment [21]) were installed in the center of the 3D-Tank in the uppermost sediment layer.
For the estimation of spatial and temporal distribution of soil moisture, the sediment was equipped with FDR-probes (Hydra-probes, Co. Stevenswater, Portland, OR, USA) at three different depths (0.2 m, 0.5 m, and 0.8 m below surface) underneath the ditches (Table 2). Two of the FDR-probes were installed outside the center in order to map the three dimensional spreading of the water front. Furthermore, fiber-oxygen sensors (OXROB3, Co. Pyroscience, Aachen, Germany) were installed to measure oxygen availability in the liquid phase. Suction cups (Rhizon Flex, Co. Rhizosphere, Wageningen, The Netherlands) were placed at close-by positions of the FDR-probes for direct extraction of pore water for water quality analysis (Table 2).
2.1.2. Scenario Design Based on Real-World Downscaling
The simulation of an on-site infiltration system was realized for an average German one-family house with four inhabitants. The volume of treated waste water to be infiltrated per day results from the requirements of the German standard DIN 4261-1 [18]. There it is assumed that the daily produced treated waste water quantity amounts to 150 liters per population equivalent (PE), thus resulting in 600 L day−1 for four persons.
The dimension of the real world ditch for treated waste water based on this water quantity and the specific soil type was calculated according to DIN 4261-5 [19]. While assuming a width of 0.5 m and a depth of the ditch below the distribution pipe of 0.5 m [26], this led to an infiltration ditch volume of 8.0 m × 0.5 m × 0.5 m. In this context, the basic wall area of the ditch calculated according to DIN 4261-5 [19] was increased by a factor of 2 under consideration of the low water-saturated hydraulic conductivity of the sediment material (<432 cm day−1 after [27]). For the simulation of the on-site infiltration system in the 3D laboratory tank, all spatial dimensions (length, width, and height) were downscaled with a factor of approx. 15 (Table 3).
The downscaling of the treated waste water quantity to be infiltrated in the 3D laboratory tank was realized with a factor of 225 (15 × 15). Please note that scaling factor for the infiltration rate was different as compared to the spatial dimensions of the ditches as vertical movement across the ditch bottom is assumed to be the main flow direction. This results in an averaged waste water infiltration rate of 2.7 L day−1, due to the infiltration by the rectangular base area of the ditch. However, the porous medium can hardly be downscaled in the same way as volumes or geometries. Due to that, we assumed that the size of the particles and pores as compared to the studied volume of the porous medium is so small that their size can be ignored.
The treated waste water was intermittently introduced to the infiltration ditch according to the hydrograph of the daily water consumption [17]. Thus, a reality-equivalent infiltration interval with increased waste water accumulation in the morning and evening hours of a day was realized. The treated waste water originates from a real small waste water treatment plant with 20 residents. Table 4 shows the mean values for the most important quality parameters in the outflow of the small waste water treatment plant. The concentrations were only fluctuating in a small range, depending on sampling times from the small waste water treatment plant taken place every four weeks. To ensure stable composition of the treated waste water in the meantime, it was stored at a temperature of 4 °C.
The infiltration of the synthetic precipitation containing 6.86 mg L−1 NaNO3, 1.64 mg L−1 KHCO3, and 26.96 mg L−1 CaSO4 is based on an event of a statistical recurrence interval of five years (rated precipitation according to the German guideline for infiltration [29]). The respective length and intensity is gained while using KOSTRA-DWD [30] data valid for a site in Saxony (Schöneck im Vogtland, same site, as used by [20]). Based on the hydraulic conductivities of the used sediment (see Table 1), an event of statistical recurrence interval of five years has an event period length of 120 min. and an intensity of 51.6 L s−1 ha−1. Together with assumptions for a one-family house [20], the total precipitation volume to be stored and infiltrated in the ditch results to 11,703 L. According to [29], an infiltration ditch with a volume of 6.0 m × 2.0 m × 2.5 m is sufficient for this purpose. As done for the waste water infiltration, downscaling of the precipitation water quantity to be infiltrated in the 3D laboratory tank occurred with a factor of 225 (15 × 15) due to the infiltration of the precipitation water by the rectangular base area of the ditch. This results in 52 L day−1 for the complete event length of 120 min.
Beside events based on guidelines, event duration and intensity were additionally increased to simulate worst case events, such as heavier precipitation events (scenarios WW-RE-24 and WW-RE-Int in Table 5). Between two consecutive rainfall events, only treated waste water was infiltrated for one to two weeks to give sufficient time to the microorganisms for recovering.
The infiltration of only treated waste water at the beginning of the experiment was running for five months in total before additional infiltration of precipitation water was started. This includes two months of treated waste water infiltration with linear scaling factor of 15 to allow for water content fluctuation in all observation points, which provides a very good base for flow calibration. Subsequently, the infiltration of only treated waste water was realized with a factor of 225 (15 × 15) for three months to reach stable conditions with regard to the hydraulics, purification, and sorption. The assumption that the system was in equilibrium with respect to sorption processes was additionally proven by batch sorption experiments. Based on these results, sorption processes regarding COD and NH4-N are assumed to be negligible.
In case of joint infiltration of treated waste water and precipitation water to the same ditch, no guideline exists for the dimensioning. Therefore, the requirements on the minimum volume and effective infiltration area of both separate ditches were combined (Table 3). The decisive factor here was that the areas of the side walls for infiltration of the precipitation in the case of joint infiltration should at least correspond to the total area that is available from the side walls and the bottom of the ditch for precipitation infiltration when separately arranged. This ensures that, in the case of the clogged bottom area, caused by the infiltration of treated waste water, sufficient area is available for infiltration of the precipitation water. Based on these assumptions, the dimension of the ditch for joint infiltration of treated waste water and precipitation water resulted to 8 m × 2 m × 3 m.
The operational conditions were the same as for separate infiltration, treated waste water quantity to be infiltrated was 2.7 L day−1 and the precipitation events simulated are based on an event of statistical recurrence interval of five years (Table 5).
2.1.3. Analytics
Quantitative analysis of the most important quality parameters chemical oxygen demand (COD), ammonium nitrogen, and nitrate nitrogen in the pore water, extracted by the installed suction cups, occurred by spectrophotometric method. Measurements were performed while using UV-VIS spectrophotometer DR 6000 and associated Test Kits LCI 500 (COD), LCK 304 (NH4-N), and LCK 339 (NO3-N) (Co. Hach Lange, Düsseldorf, Germany).
2.2. Numerical Set-Up
The numerical model is conceptualized based on the tank experiment having the same spatial extents. For this, a three-dimensional model has been realized while using Hydrus 3D (Co. PC-Progress, [31]), applying Richards-equation [32] for unsaturated flow and Mualem-van-Genuchten retention and relative hydraulic conductivity model [22,24]. However, the model was cut in half along the longitudinal symmetry axis to reduce the computational efforts. All kinds of infiltration ditches have been realized by the boundary conditions of prescribed time-dependent flow rates. The flow rates have also been extracted from the laboratory experiment. The lower boundary condition is assumed to be a seepage face, having a specified pressure head of −10 cm for triggering flux [33] (see Discussion section). All other boundaries than the ditches and the outflow are assumed to be no-flow. The initial condition, defined as the water content, is first set to be 10% uniformly. Before analyzing the results, every scenario was simulated a second time while using the final water content distribution as initial condition. This should provide a more realistic water content distribution. It can be expected that water content is not evenly distributed in the tank due to previous experiments. The clay barrier for the separated ditches was parameterized after [20]. The ditch gravel has been simulated based on laboratory data and assumptions, among others, made for ditch dimensioning (hydr. conductivity: 25,920 cm day−1, residual water content: 0.01 cm3 cm−3, saturated water content: 0.36 cm3 cm−3, van Genuchten shape parameter n: 3, van Genuchten shape parameter α: 0.5 cm−1, and pore connectivity parameter in the conductivity function l: 0.5). The sandy porous material can be described based on laboratory data (see Laboratory Tank section).
The data set has been incorporated into three reference models for separated and joint ditches (including two scenario periods for the separated ditches: WW-Ref and WW-RE-Ref, see Table 5). At seven observation points (see Laboratory Tank section), a good fit could be observed for the data obtained by the retention behavior experiments (Hyprop, Co. METER Group) with a slight adaption for the separated and joint ditches, respectively. The final data sets calibrated can be seen in Table 6; only noticeable differences in saturated water content and van Genuchten shape parameter α can be identified as compared to the laboratory data.
The total simulation times for scenarios without precipitation event (WW-Ref and WW-Rep) were 14,400 min. and for scenarios with precipitation event 8640 min., the precipitation event in the scenarios was starting between 3450 min. and 3800 min. after the beginning of the numerical experiment, except for WW-RE-24 (using the separated ditches), which started at 1680 min. after the beginning of the numerical experiment. The model with closely-spaced ditches includes 20,885 computational nodes and 67,013 3D elements, the model of the joint ditch includes 21,971 computational nodes and 66,399 3D elements.
3. Results
3.1. Hydraulic Behavior
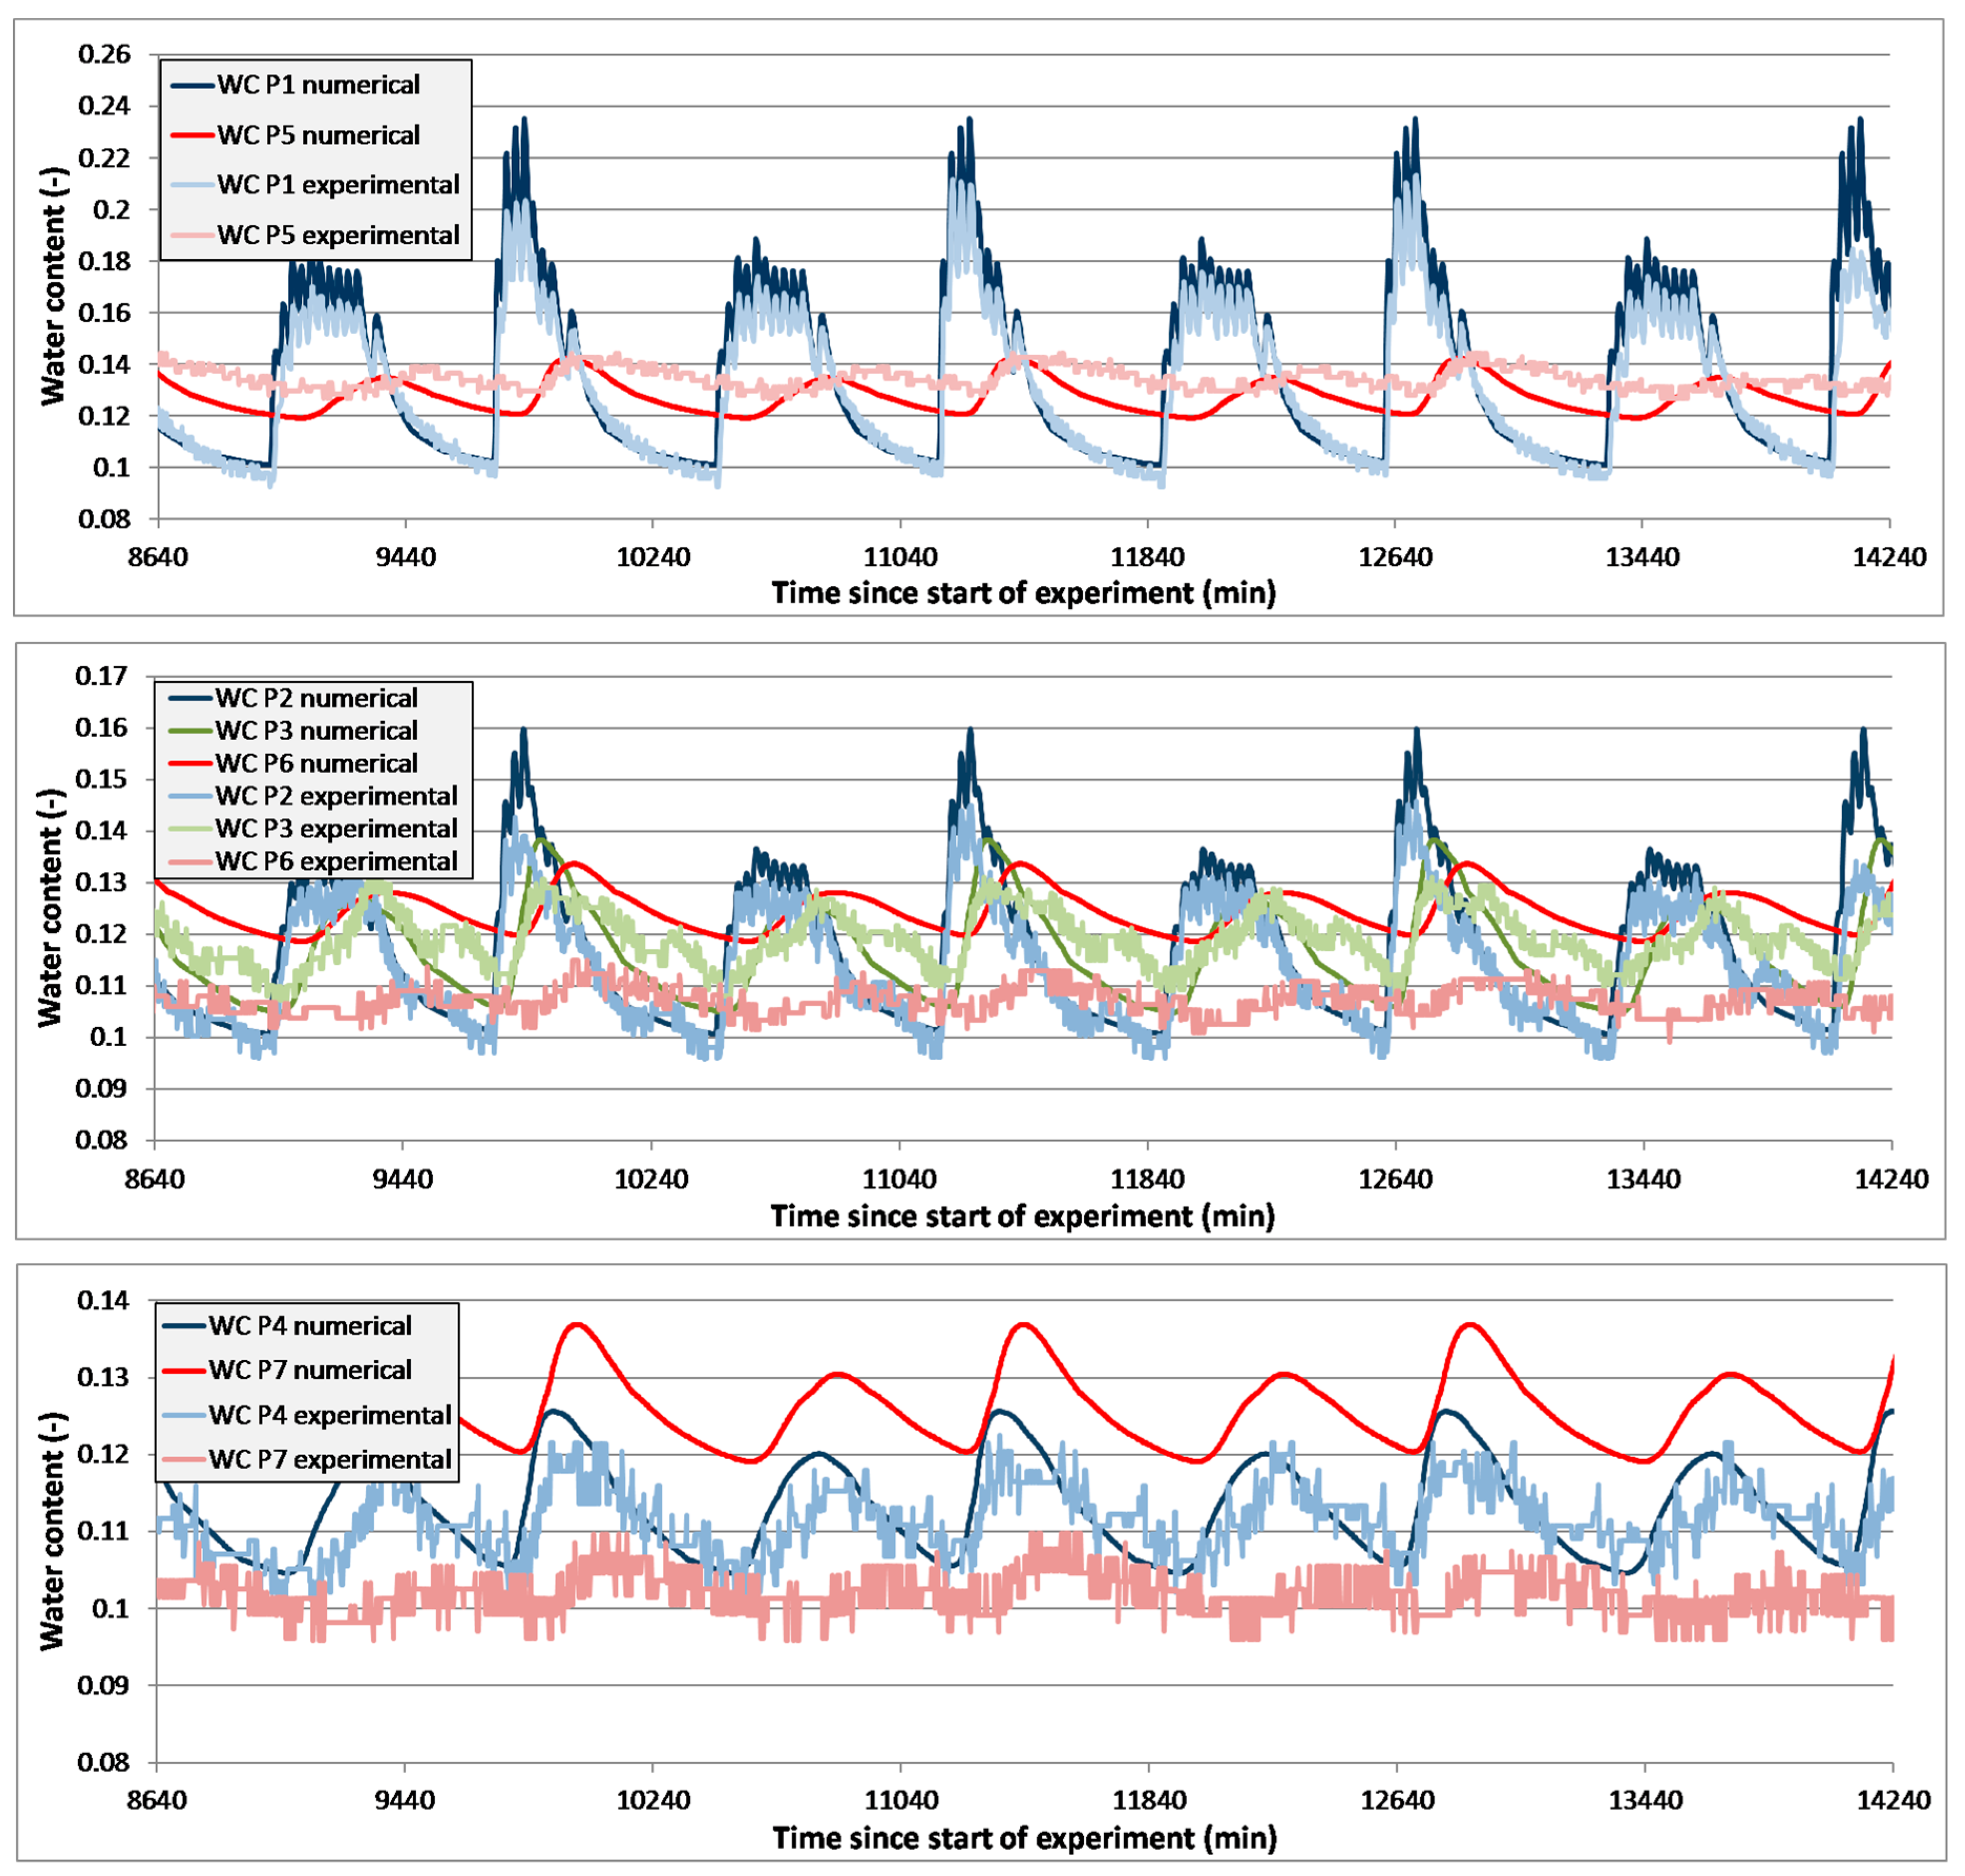
Firstly, the results of the scenarios with pure treated waste water infiltration while using the separated ditch model (abbreviation “sep.” used for indication), including a scaling factor 15, are evaluated. It is highlighted that these were used to put a comparable large stress in form of water flow on all observation points to increase the calibration quality of the numerical model. As shown in Table 5, multiple repetition scenarios have also been realized to ensure laboratory and numerical stability (numerically used as repetition as the numerical set-up has not been changed as compared to reference cases). Figure 2 shows the results of the WW-Ref (sep.) scenario, for an excerpt of the total simulation time.
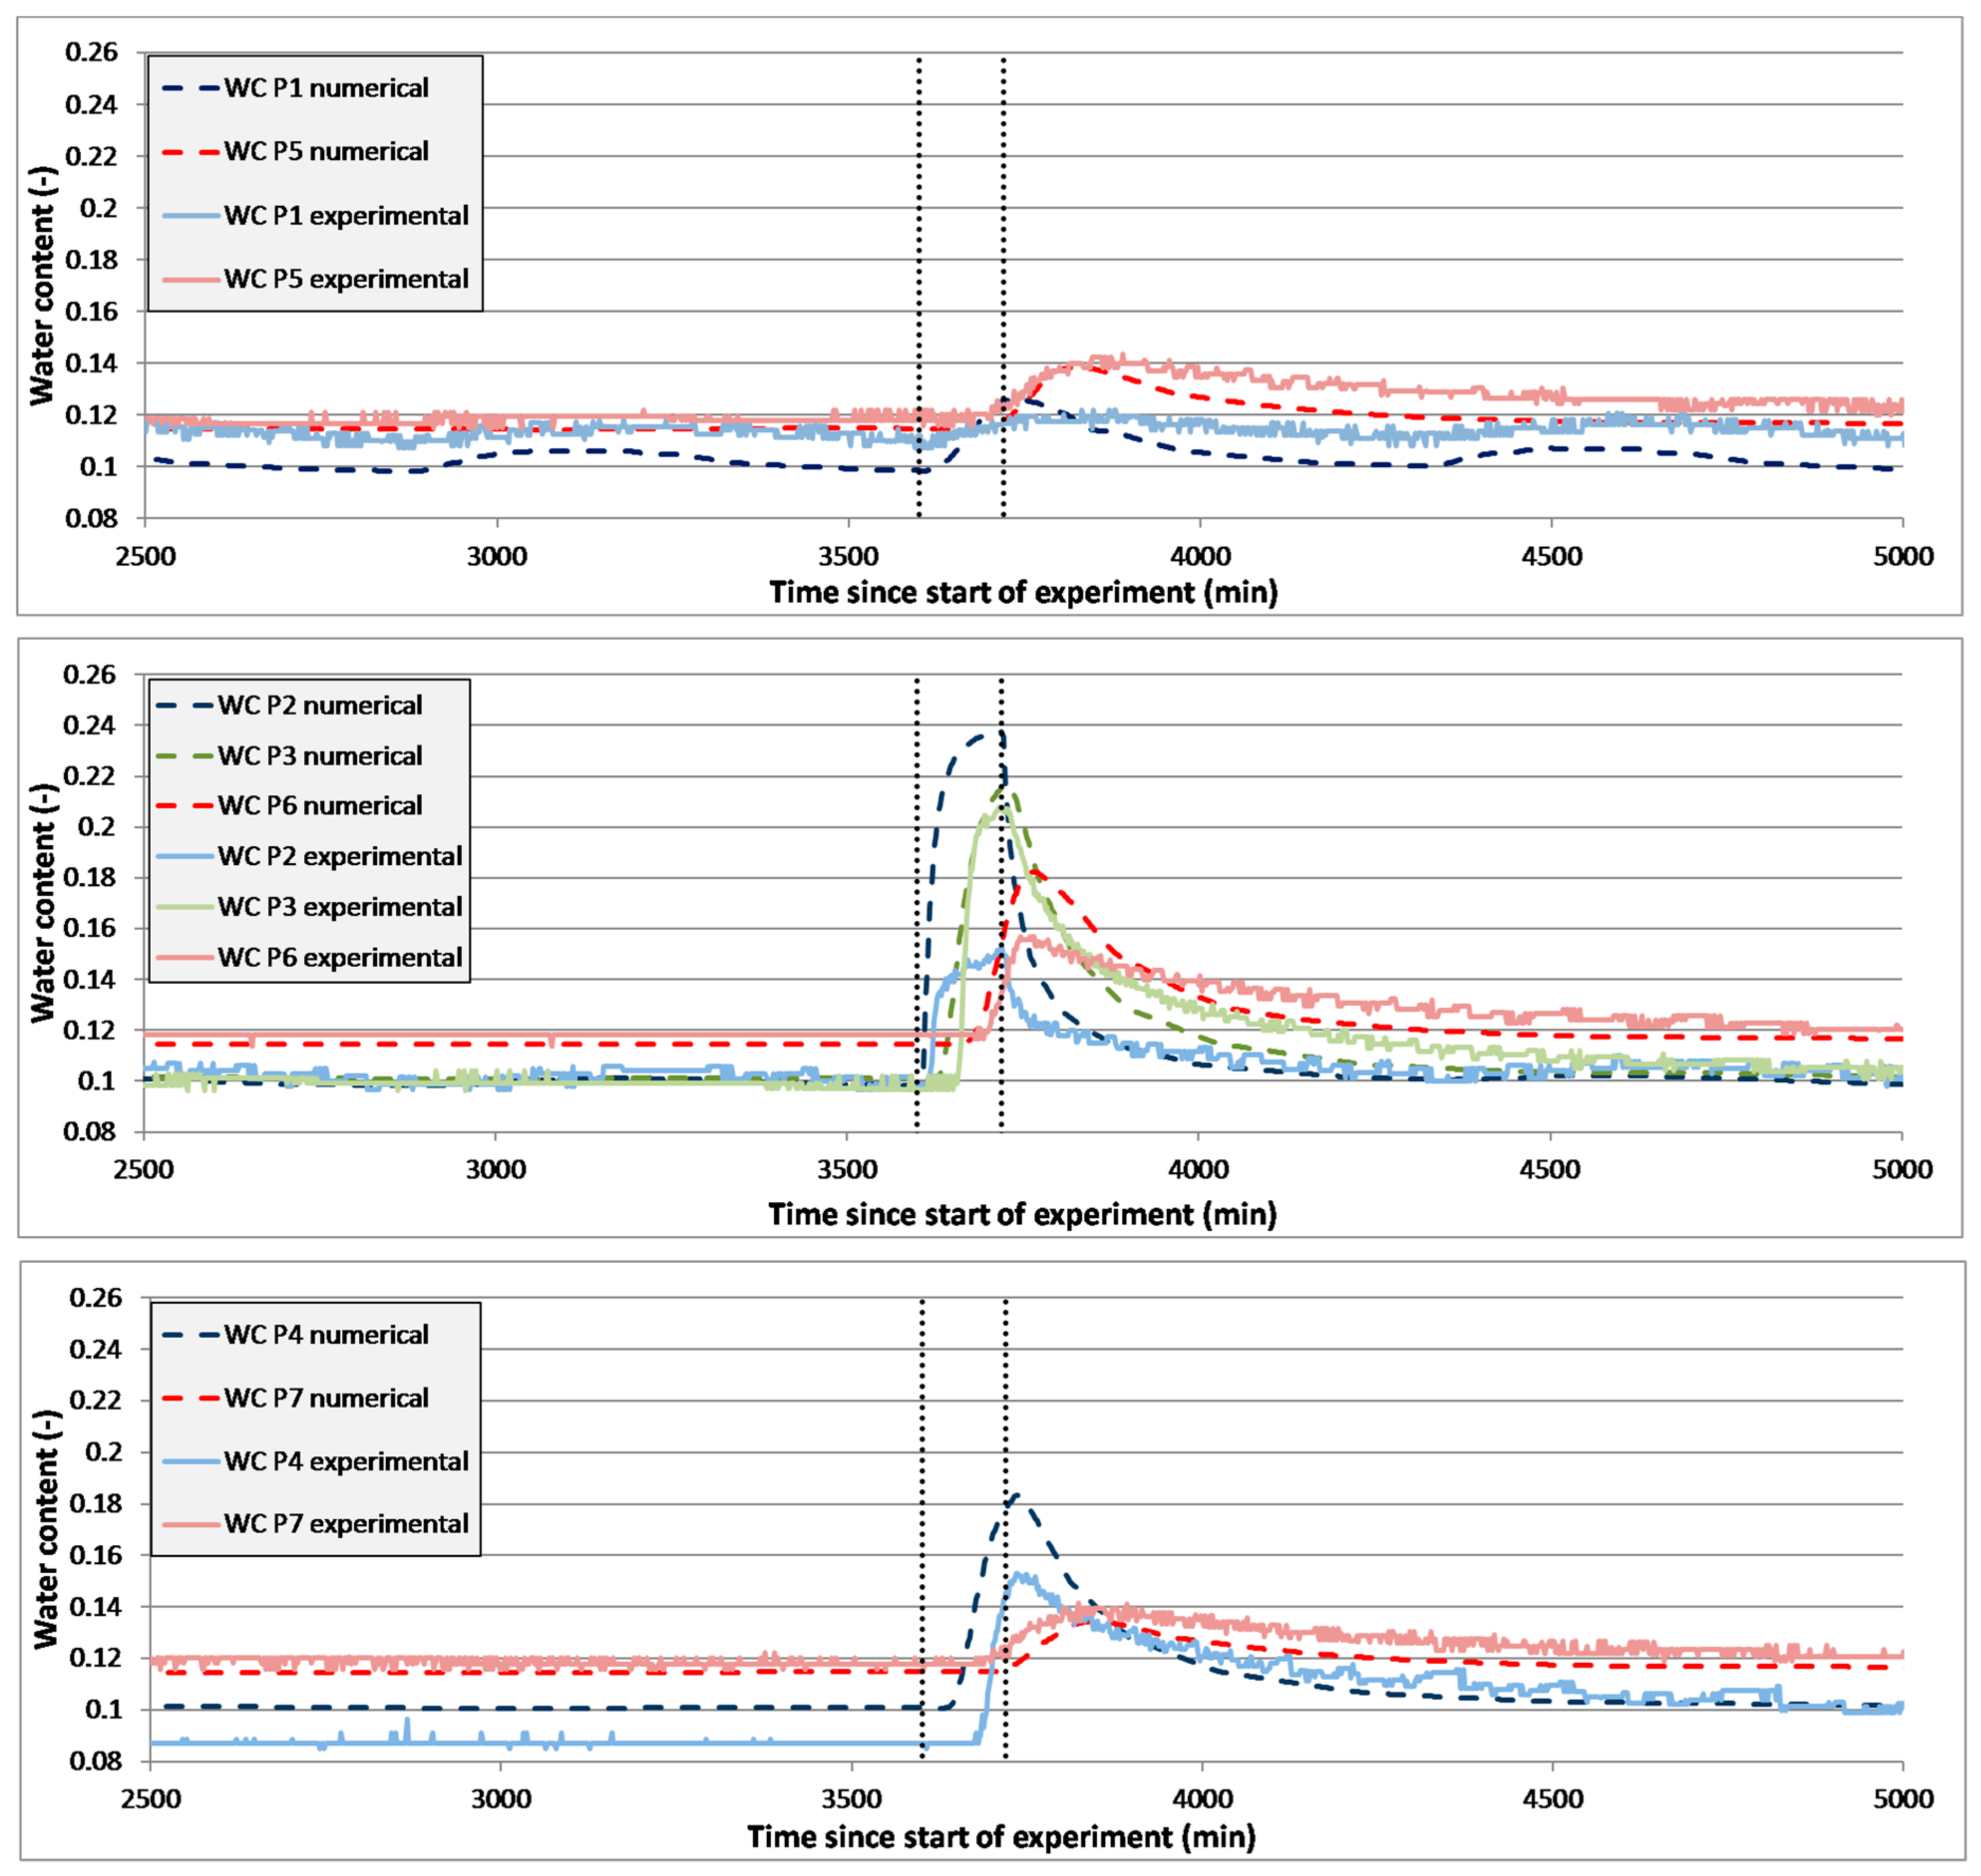
Figure 3 shows results of the WW-RE-Rep-1 (sep.) for the separated ditches, again for an excerpt of the total simulation time.
The results for scenarios WW-Rep (sep.), WW-RE-Ref (sep.), WW-RE-Rep-2 (sep.), WW-RE-24 (sep.), and WW-Re-Int (sep.) can be found in Electronic Supplemental Materials S1.
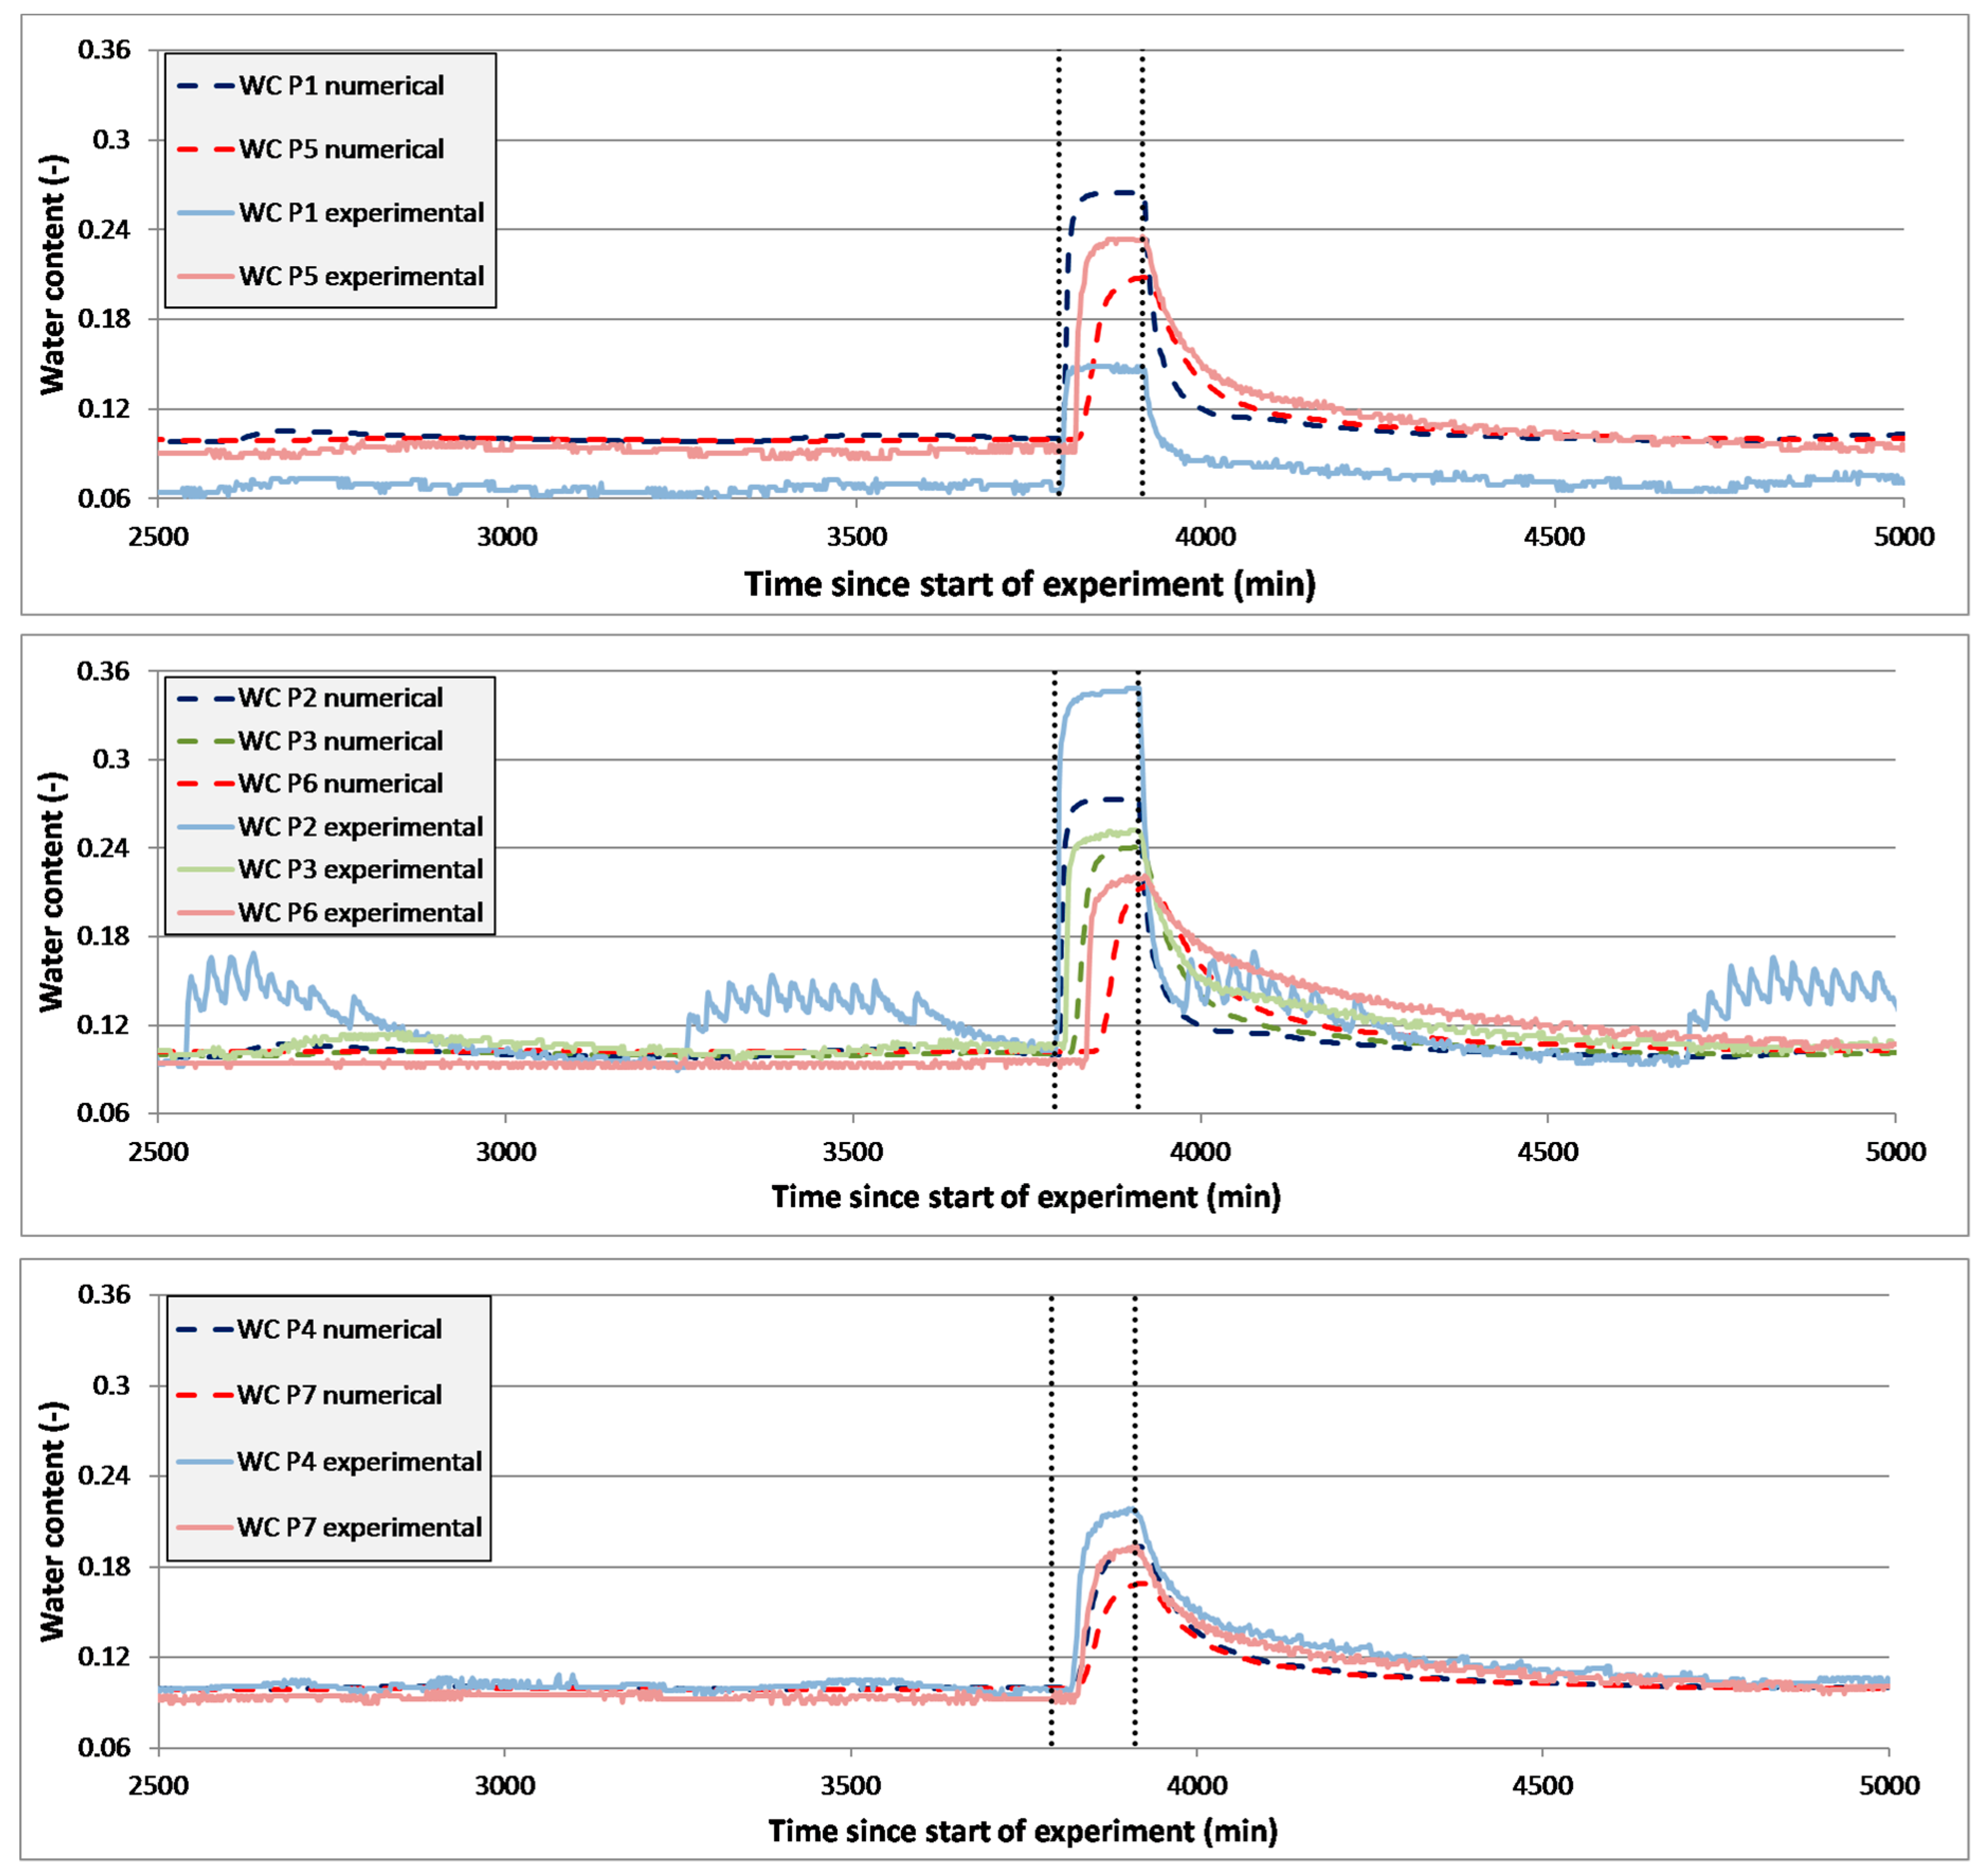
In the Figure 4 and Figure 5, selected results of the joint ditch simulation (abbreviation “jnt.” used for indication) for scenarios WW-RE-Ref (jnt.) and WW-RE-Int (jnt.) are shown. The results for scenarios WW-RE-Rep-1 (jnt.), WW-RE-Rep-2 (jnt.), and WW-RE-24 (jnt.) can be found in Electronic Supplemental Materials S2.
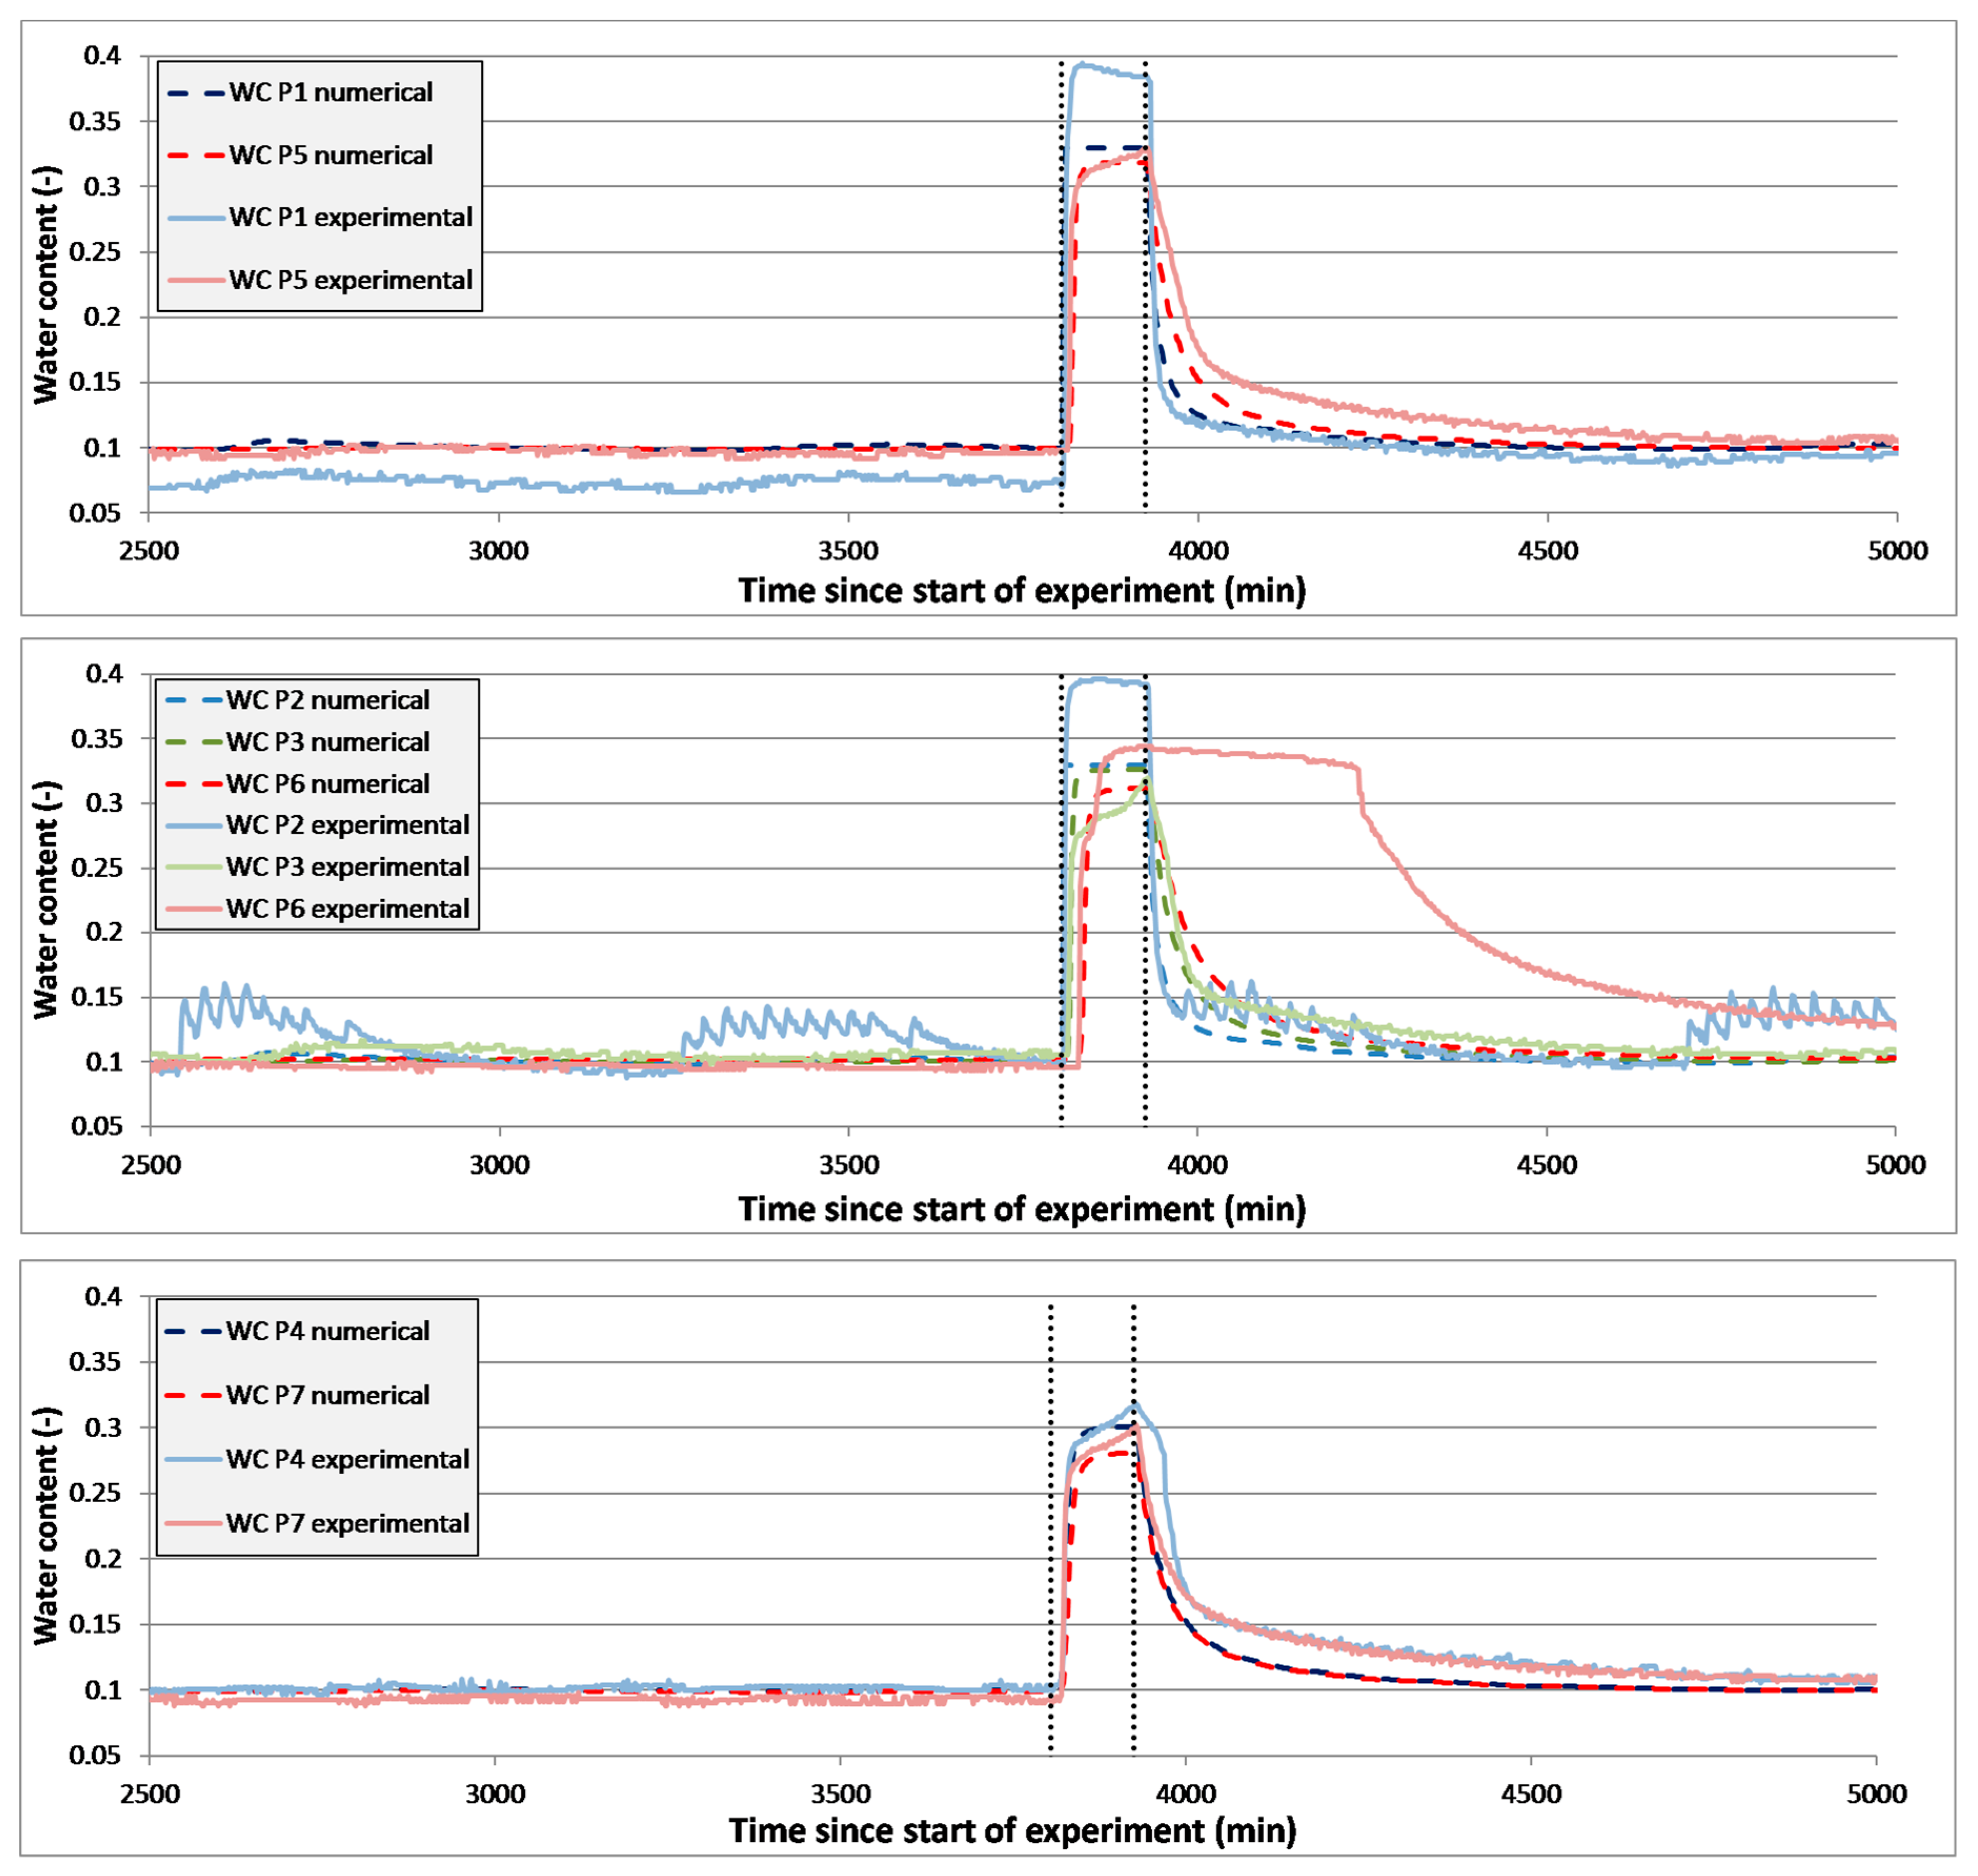
From Figure 2, Figure 3, Figure 4 and Figure 5, as well as Electronic Supplemental Materials S1 and S2, it can be seen that, in general, the temporal behavior of the water contents due to infiltration of both the treated waste water (especially for the scaling factor of 15 in WW-Ref (sep.)) and the precipitation water can be reproduced. Smaller deviations, e.g. of observation point P2 in WW-RE-Int (jnt.) may lead from preferential flow, which could occur in the gravel ditch and sandy material in the tank.
For scenarios WW-Ref (sep.) and WW-Rep (sep.), it can be seen that the numerical model overestimates the water contents of observation points P6 and P7. This is due to the lower boundary condition. Assuming a free drainage at the bottom of the model would reduce this water content to be closer to observation; however, this is not in agreement with mostly higher water contents at observation points at the lower part of the tank, e.g. observation points P6 and P7 in scenarios WW-RE-Ref (sep.), WW-RE-Rep-1 (sep.), and WW-RE-Rep-2 (sep.), and observation point P6 in WW-RE-Int (jnt.) and WW-RE-24 (jnt.). It seems that the actual lower boundary condition in the tank experiment does not behave temporally consistent, but it rather varies between a free drainage and a seepage face (assuming zero pressure head for triggering flux [33]) or even provides more resistance against vertical outflow between the experiments (see observation point P6 in Figure 5).
Another point of discussion is the large discrepancy of observation point P2 in all “sep.” scenarios for additional precipitation infiltration and observation point P1 in most of the “jnt.” models. The numerical models provide much higher water contents, as observed, although the temporal behavior, i.e. begin of rising water contents as well as begin of decreasing water contents, is similar to observation. For the reason of this discrepancy, it can only be speculated, but in “sep.” scenarios, the observation point P2 is closely located below the clay barrier. The integral measured volume by the FDR probe might have led to an average of clay and sand water contents.
Beside visual comparison using water content behavior, Root Mean Square Error (RMSE) and Mean Average Error (MAE) can be calculated for all scenarios (see Table 7 and Table 8). Hereby, for the scenario with precipitation events, it was differentiated between RMSE as well as MAE for the total simulation time and RMSE, as well as MAE for the period most influenced by the precipitation event. For the latter, a period from the beginning of the precipitation event to 800 min. after beginning of the precipitation event for WW-RE-Ref (sep./jnt.), WW-RE-Rep-1 (sep./jnt.), WW-RE-Rep-2 (sep./jnt.), and WW-RE-Int (sep./jnt.) and to 2576 min. after the beginning of the precipitation event for WW-RE-24 (sep./jnt.) was considered.
By comparing the MAE and RMSE values, the fit can be rated as good, when compared to the general accuracy of the FDR probes (±0.025 cm3 cm−3 as given by the manual [35]). Merely, the values for scenarios WW-RE-24 (sep./jnt.) and WW-RE-Int (sep./jnt.) are larger, which can be again explained by the drainage behavior of the tank’s lower boundary (see Discussion section). Some observed water contents indicate a strong temporal retention (e.g., see observation point P6 in Figure 5), which can be seen by the time required before water contents were starting to reduce after stop of precipitation water infiltration.
Finally, it can be seen from Figure 3, Figure 4 and Figure 5, as well as Electronic Supplemental Materials S1 and S2, where water contents are only temporally affected by the additional precipitation infiltration, either in closely-spaced, separated ditches, or a joint ditch.
3.2. Water Quality and Purification Performance
The chemical analysis results of the pore water samples for phases with only treated waste water infiltration indicate that at least 50% of the infiltrated substances described by Chemical Oxygen Demand (COD) concentrations are constantly degraded on the way through the unsaturated soil zone (Figure 6). The degradation took place being evenly distributed over the entire tank depth. A minimum 80% degradation was detected for the infiltrated NH4-N. An increase in nitrate concentrations in the effluent was observed due to the reduction of ammonium in the course of nitrification processes. Denitrification process has hardly been observed due to sufficient available oxygen in the soil pore space.
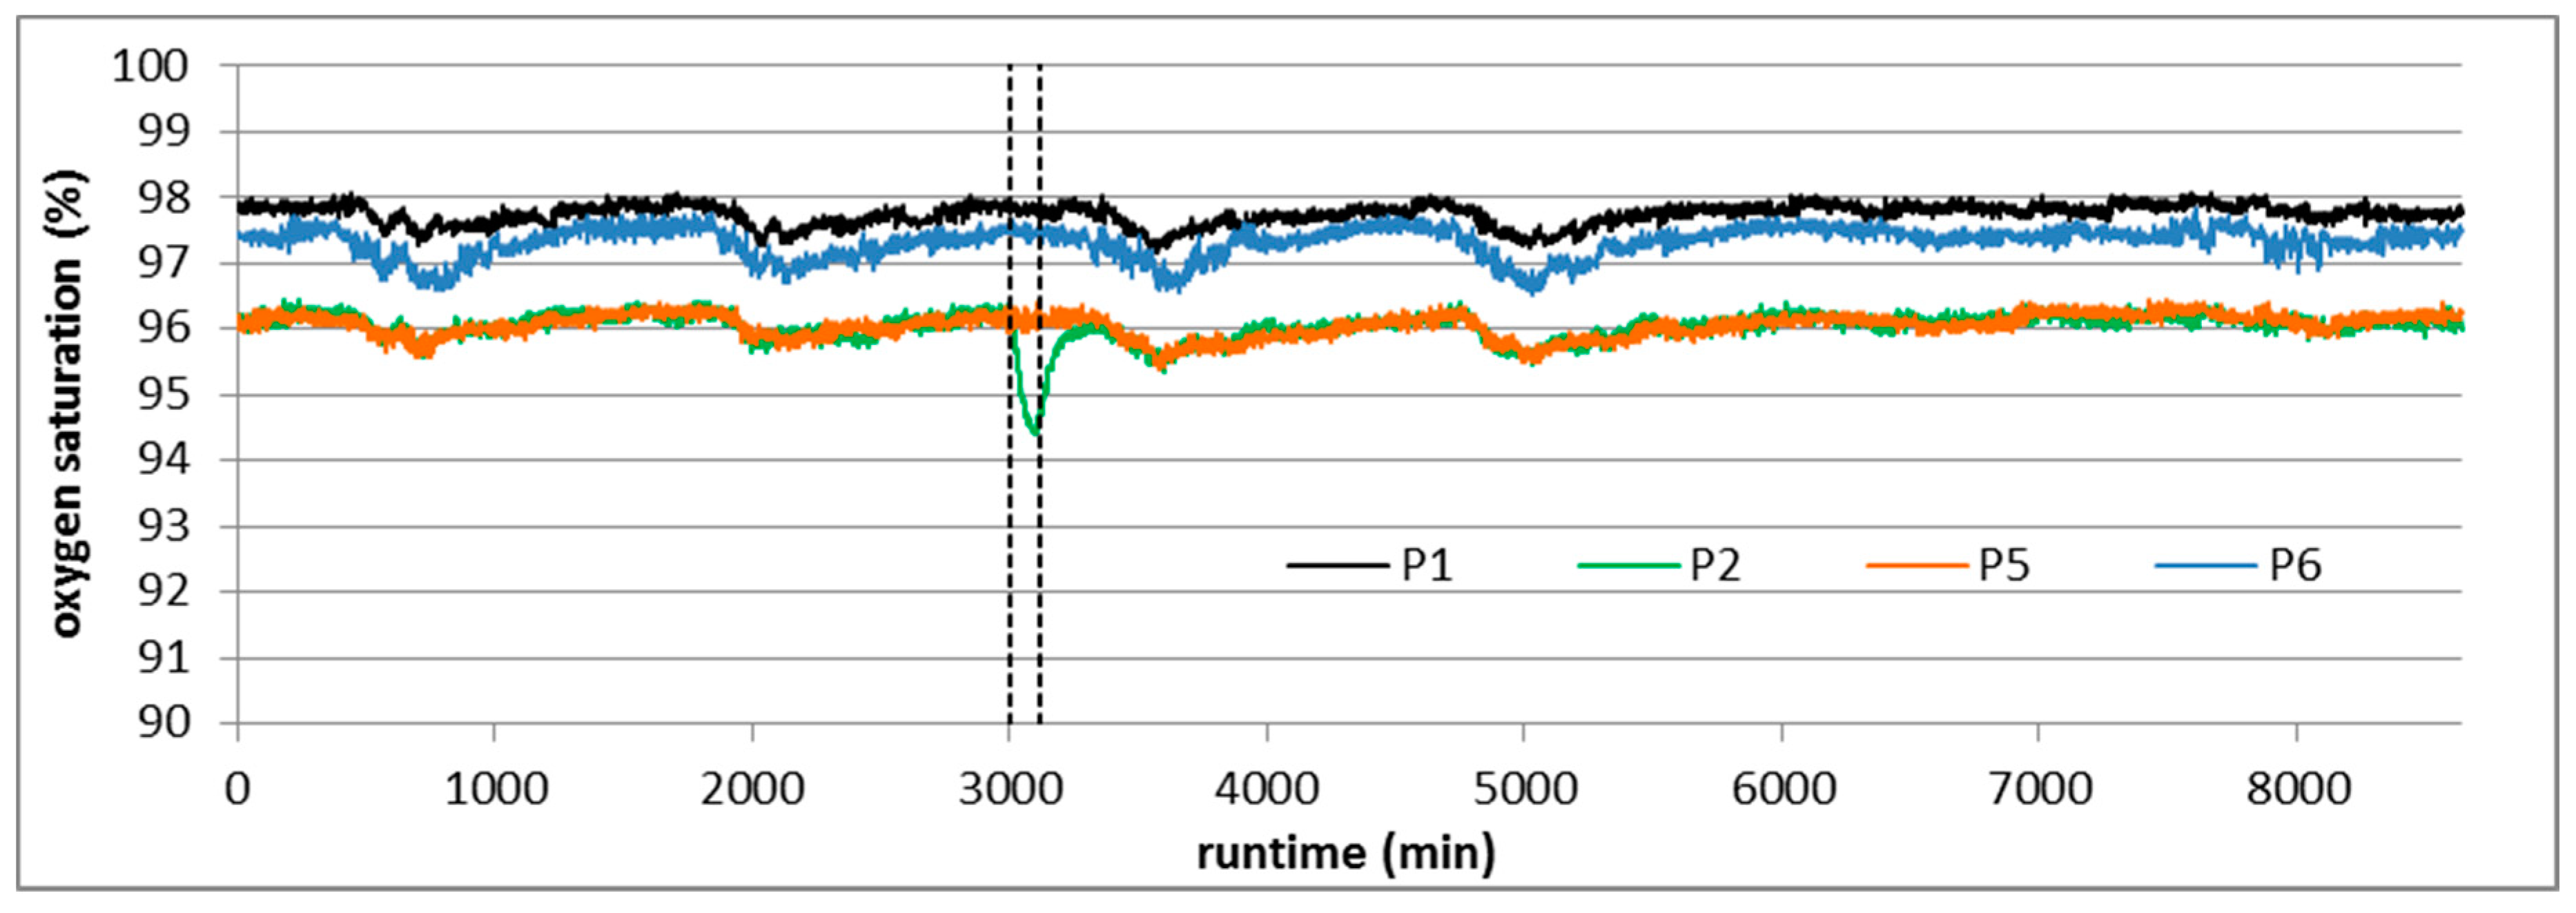
The purification performance for COD and NH4-N is almost unaffected by the additional infiltration of water from precipitation events (Figure 6 as well as Electronic Supplemental Materials S3). The analysis results of samplings after the simulated precipitation events (WW-RE-Ref (sep.), WW-RE-24 (sep.) and WW-RE-Int (sep.)) indicate that the degradation was at least 50% for the COD and almost 100% for NH4-N, as in the phase with only treated waste water infiltration. Additional infiltration of precipitation caused the dilution of COD and NO3−N concentrations in the lower part of the 3D-Tank. With regard to the current problem of increased nitrate concentrations in a large part of the aquifers, this is an interesting point of view. Thus, the infiltration of water from precipitation events leads to an improvement of water quality that fits with the requirements of the EU Water Framework Directive [15]). Oxygen availability is not negatively affected by the daily infiltration of treated waste water or by the additional infiltration of precipitation (Figure 7 as well as Electronic Supplemental Materials S4). The oxygen saturation is continuously nearly 100% due to the sufficient supply over the pores of the uninfluenced, dry soil around the infiltration ditch.
In the case of joint infiltration of treated waste water and precipitation to the same ditch similar results being observed, the purification and oxygen availability was not negatively influenced by the additional infiltration of water from precipitation events (see Electronic Supplemental Materials S3 and S4 for “jnt.”-results).
4. Discussion
A selection of uncertainties becomes obvious during conduction and evaluation in the context of the results from the laboratory and numerical experiments. In detail, the following points are to be discussed:
- (1)
- Lower boundary condition of the tank and its numerical representationAs previously discussed in the Results section, the lower boundary of the tank seems to behave not consistently over time, rather it varies, conceptually speaking, between a free drainage boundary, a seepage face, and a boundary with even more resistance against vertical outflow. When the infiltration rate is increased, the lower boundary creates a resistance that leads to ponding (see water contents in scenarios WW-RE-24 (sep./jnt.) and WW-RE-Int (sep./jnt.). The installed perforated plate (63 µm mesh size) at the lower boundary of the tank is not able to drain the water fast enough, as it is simulated in the model. Numerical consideration of time-variable minimum pressures for outflow, based on measurements, are recommended, which would allow the inclusion of this behavior into calibration process in order to avoid these deviations.
- (2)
- The impact of unknown heterogeneities on the measurements as compared to numerical representationNumerical reproduction of the water contents measured generally shows good agreement (see Table 7 and Table 8). However, numerical reproducibility varies between observation points and also reference and repetition scenarios. The first might be due to small-scale heterogeneities. Although the procedure of packing the tank was done with great care, local compaction might occur. In contrast of a homogenous assumption, the sediment inserted has to be considered to be heterogeneous. This can be the reason for differences between water content measurement and numerical simulation, as e.g., seen at observation point P2 in the “sep.” models with additional precipitation infiltration and observation point P1 in most of the “jnt.” models.
- (3)
- The impact of the maximum variability of measured data to obtaine a good calibrationThe calibration and validation procedure is part of the overall modeling strategy [36]). However, the calibration period should include a sufficiently large variability of the process variable (here: water content / pressure head) in space and time. A simple explanation can be given by inversely estimating minimum and maximum water contents of the van Genuchten retention function [22]. If the water contents at a certain observation point only vary between a small bandwidth, e.g. between 0.15 and 0.25, the inverse parameter estimation procedure is not able, in certainty, quantify whether a maximum water content is 0.32 or 0.38, or will the procedure provide a good result for the residual water content.
5. Conclusions
The objective of this investigation was to reproduce the water flow behavior as well as purification potential in the case of pretreated waste water infiltration and additional infiltration of precipitation water by either closely-spaced, but separated infiltration ditches or a joint infiltration ditch. The observed water contents in case of closely-spaced, separated infiltration of treated waste water and precipitation water indicate that the simulated event of five-year recurrence interval (e.g. WW-RE-Ref (sep.)) and the stronger or longer events, (WW-RE-24 (sep.) and WW-RE-Int (sep.)), respectively, lead to an overlap of the waters’ flow area, mainly in the area of the ditch separation. The area in which the treated waste water percolates and the degradation of the infiltrated substances takes place (observation point P1 in “sep.” models) is almost unaffected by the precipitation events; no prolonged water content rise (or full saturation) can be observed for both the laboratory and numerical results (see criteria I and II in the Introduction section). Significantly higher water contents (up to full saturation for WW-RE-Int) can be registered in the area below the clay barrier (observation points P2, P3, and P6) due to precipitation events. Additionally, in the case of stronger or longer events (WW-RE-24 (sep.) and WW-RE-Int (sep.)), the water contents in the lower part of the tank (observation point P5 and P7) are affected for the time of the precipitation event and for some time after, which is also observable to a certain extent by the numerical results. The higher values in the laboratory experiments are caused by the lower tank boundary (see Discussion section). A rise of water contents can be seen for all observation points in the case of the joint infiltration of treated waste water and precipitation water in a single ditch. However, all precipitation-borne effects at the observation points in “sep.” and “jnt.” scenarios quickly diminished (in both numerical model and laboratory experiment) after the end of the precipitation event (see criteria I and II). Vice versa, the infiltration of treated waste water does not impact retention space of precipitation water in the respective or joint ditch (see criteria III).
The measured oxygen saturations confirm these observations; small fluctuations in oxygen saturation can be detected during the simulated precipitation events for both technical solutions (see criteria IV). Besides that, quality parameters, as measured in the laboratory experiments, do not show a significant negative impact on the purification capacity for both technical solutions (see criteria IV). On the contrary, additional infiltration of precipitation caused the dilution of COD and NO3-N concentrations to a certain degree in the lower part of the tank, which leads to an improvement of the water quality.
Finally, this reveals that, at least for the conditions studied here, a closely-spaced as well as a joint infiltration of both treated waste water and precipitation water seems principally applicable. This is also in agreement with the numerical study that was conducted by [20], where a broad set of scenarios has been investigated and that provided the base of this study.
The results of this study only provide indications of the applicability and purification potential of closely-spaced and joint ditches, which cannot be straightforwardly generalized. Future works should focus on field investigations (combining field characterization, improved quality sampling at different locations and of various substances, as well as accompanying numerical simulation) to confirm the results as real-world conditions include often unknown complex subsurface features. For example, this concerns the representation of sorption and degradation due to the hardly scalable influence of porous medium on these processes. Travel time assessments, especially for shallow and vulnerable aquifers, would support the evaluation of risks coming from infiltration of treated waste and precipitation water.
Supplementary Materials
The following are available online at https://www.mdpi.com/2073-4441/11/11/2262/s1, Electronic Supplementary Materials S1: Figures of “Results for simulation of water contents for scenarios WW-Rep (sep.), WW-RE-Ref (sep.), WW-RE-Rep-2 (sep.), WW-RE-24 (sep.) and WW-RE-Int (sep.) as compared to observed values in the laboratory tank experiment for the separated ditches”, Electronic Supplementary Materials S2: Figures of “Results for simulation of water contents for scenarios WW-RE-Rep-1 (jnt.), WW-RE-Rep-2 (jnt.), WW-RE-24 (jnt.) as compared to observed values in the laboratory tank experiment for the joint ditch”. Electronic Supplementary Materials S3: Figures of “COD, NH4-N and NO3-N concentration profiles in the 3D-Tank before and after the precipitation events for separated, closely-spaced and joint infiltration”, and Electronic Supplementary Materials S4: Figures of “Oxygen saturation before, during and after the precipitation events for separated, closely-spaced and joint infiltration”.
Author Contributions
Conceptualization, T.F., P.-W.G. and F.H.; data curation, T.F.; funding acquisition, P.-W.G. and F.H.; investigation, T.F. and F.H.; methodology, T.F. and F.H.; supervision, P.-W.G.; visualization, F.H. und T.F.; writing—original draft preparation, F.H. and T.F.; writing—review and editing, F.H., T.F., and P.-W.G.
Funding
This work was supported by the Development Bank of Saxony (Grant number 100301390), the European Social Fund of the European Union and the Open Access Funding of the TU Dresden.
Acknowledgments
We thank René Blankenburg and Martin Binder for providing support during numerical simulation and Frieder Hamann for support during the laboratory tank experiment. In addition, Bernd Märtner and Harald Dostmann are acknowledged for providing insights into the practical design of infiltration systems. We thank Claudia Kuke for supporting waste water extraction. We thank two anonymous reviewers for their valuable suggestions for improving this article. Open Access Funding by the Publication Fund of the TU Dresden.
Conflicts of Interest
The authors declare no conflict of interest. The funders had no role in the design of the study; in the collection, analyses, or interpretation of data; in the writing of the manuscript, or in the decision to publish the results.
References
- Stefan, C.; Ansems, N. Web-based global inventory of managed aquifer recharge applications. Sustain. Water Resour. Manag. 2018, 4, 153–162. [Google Scholar] [CrossRef]
- Zheng, F.; Zhai, Y.; Xia, x.; Yin, Z.; Du, Q.; Zuo, R.; Wang, J.; Teng, Y.; Xu, M. Simulation of trinitrogen migration and transformation in the unsaturated zone at a desert contaminant site (NW China) using hydrus-2d. Water 2018, 10, 1363. [Google Scholar] [CrossRef]
- Pyne, R.D.G. Groundwater Recharge and Wells. In A Guide to Aquifer Storage Recovery; CRC Press: Boca Raton, FL, USA, 1995; p. 400. [Google Scholar]
- Ebeling, P.; Händel, F.; Walther, M. Potential of mixed hydraulic barriers to remediate seawater intrusion. Sci. Total. Environ. 2019, 693, 133478. [Google Scholar] [CrossRef] [PubMed]
- Asano, T.; Cotruvo, J.A. Groundwater recharge with reclaimed municipal wastewater: Health and regulatory considerations. Water Res. 2004, 38, 1941–1951. [Google Scholar] [CrossRef] [PubMed]
- Bekele, E.; Page, D.; Vanderzalm, J.; Kaksonen, A.; Gonzalez, D. Water recycling via aquifers for sustainable urban water quality management: Current status, challenges and opportunities. Water 2018, 10, 457. [Google Scholar] [CrossRef]
- Elkayam, R.; Sopliniak, A.; Gasser, G.; Pankratov, I.; Lev, O. Oxidizer demand in the unsaturated zone of a surface–spreading soil aquifer treatment system. Vadose Zone J. 2015, 14. [Google Scholar] [CrossRef]
- Paul, J.D.; Blunt, M.J. Wastewater filtration and re-use: An alternative water source for London. Sci. Total. Environ. 2012, 437, 173–184. [Google Scholar] [CrossRef] [PubMed]
- Van Afferden, M.; Cardona, J.A.; Lee, M.Y.; Subah, A.; Müller, R.A. A new approach to implementing decentralized waste water treatment concepts. Water Sci. Technol. 2015, 72, 1923–1930. [Google Scholar] [CrossRef] [PubMed]
- Quanrud, D.M.; Arnold, R.G.; Wilson, L.G.; Conklin, M.H. Effect of soil type on water quality improvement during soil aquifer treatment. Water Sci. Technol. 1996, 33, 419–431. [Google Scholar] [CrossRef]
- Martins, T.; Leitao, T.E.; Carvalho, M.R. Assessment of wastewater contaminants retention for a soil-aquifer treatment system using soil-column experiments. Procedia Earth Planet. Sci. 2017, 17, 332–335. [Google Scholar] [CrossRef]
- Reemtsma, T.; Gnirb, R.; Jekel, M. Infiltration of combined sewer overflow and tertiary municipal wastewater: An integrated laboratory and field study on nutrients and dissolved organics. Water Res. 2000, 34, 1179–1186. [Google Scholar] [CrossRef]
- Zhang, Z.; Lei, Z.; Zhang, Z.; Sugiura, N.; Xu, x.; Yin, D. Organics removal of combined wastewater through shallow soil infiltration treatment: A field and laboratory study. J. Hazard. Mater. 2007, 149, 657–665. [Google Scholar] [CrossRef] [PubMed]
- German Environment Agency. Available online: https://www.umweltbundesamt.de/themen/wasser/grundwasser (accessed on 25 July 2019).
- Directive, W.F. Directive 2000/60/EC of the European Parliament and of the Council establishing a framework for the Community action in the field of water policy. Off. J. Eur. Communities 2000, 327, 22. [Google Scholar]
- German Federal Ministry of Justice and Consumer Protection. German Federal Water Act; BGBl: Berlin, German, 2018; p. 2254. [Google Scholar]
- BGBI. Small Waste Water Treatment Systems for up to 50 Pt–Part 3: Packaged and/or Site Assembled Domestic Waste Water Treatment Plants; DIN Deutsches Institut für Normung e.V.: Berlin, Germany, 2016; p. 46. [Google Scholar]
- BGBI. DIN 4261-1. Small Sewage Treatment Plants—Part 1: Plants for Waste Water Pretreatment; DIN Deutsches Institut für Normung e.V.: Berlin, Germany, 2010; p. 15. [Google Scholar]
- BGBI. DIN 4261-5. Small Sewage Treatment Plants—Part 5: Infiltration of Aerobic Biologically Treated Domestic Waste Water; DIN Deutsches Institut für Normung e.V.: Berlin, Germany, 2012; p. 10. [Google Scholar]
- Händel, F.; Engelmann, C.; Klotzsch, S.; Fichtner, T.; Binder, M.; Graeber, P.W. Evaluation of decentralized, closely-spaced precipitation water and treated waste water infiltration. Water 2018, 10, 1460. [Google Scholar] [CrossRef]
- Hyprop System. Available online: https://www.metergroup.com/environment/products/hyprop-2/ (accessed on 24 April 2019).
- Van Genuchten, M.T. A closed-form equation for predicting the hydraulic conductivity of unsaturated soils 1. Soil Sci. Soc. Am. J. 1980, 44, 892–898. [Google Scholar] [CrossRef]
- BGBI. DIN EN ISO 17892-11. Geotechnical Investigation and Testing—Laboratory Testing of Soil—Part 11: Permeability Tests; DIN Deutsches Institut für Normung e.V.: Berlin, Germany, 2019; p. 20. [Google Scholar]
- Mualem, Y. A new model for predicting the hydraulic conductivity of unsaturated porous media. Water Resour. Res. 1976, 12, 513–522. [Google Scholar] [CrossRef] [Green Version]
- BGBI. DIN EN ISO 11272. Soil Quality–Determination of Dry Bulk Density; DIN Deutsches Institut für Normung e.V.: Berlin, Germany, 2017; p. 14. [Google Scholar]
- Dostmann, H.; M & S Umweltprojekt GmbH, Plauen, Germany. Personal communication, 2018.
- Märtner, B.; Gräber, P.W.; Bergmann Sen, M. Verbundprojekt RESS-199-016 ESEK Ganzheitliches System zur Errichtung von Kleinkläranlagen; M & S Umweltprojekt GmbH: Plauen, Germany, 2013; p. 74. [Google Scholar]
- German Federal Ministry for the Environment Conservation Construction and Nuclear Safety. German Groundwater Ordinance; German Federal Ministry for the Environment Conservation Construction and Nuclear Safety: Berlin Germany, 2017; p. 1044.
- DWA-A 138. Planning, Construction and Operation Ofrainwater Infiltration Systems; DWA German Association for Water, Wastewater and Waste: Hennef, Germany, 2005; p. 62. [Google Scholar]
- KOSTRA-DWD; Version 3.1; Coordinated Heavy Precipitation Regionalization Evaluations; German Weather Service (DWD): Offenbach, Germany, 2010.
- Šimůnek, J.; Van Genuchten, M.T.; Šejna, M. Recent developments and applications of the HYDRUS computer software packages. Vadose Zone J. 2016, 15, 25. [Google Scholar] [CrossRef]
- Richards, L.A. Capillary conduction of liquids through porous mediums. J. Appl. Phys. 1931, 1, 318–333. [Google Scholar] [CrossRef]
- Šejna, M.; Šimůnek, J.; Van Genuchten, M.T. The HYDRUS Software Package for Simulating the Two- and Three-Dimensional Movement of Water, Heat, and Multiple Solutes in Variably-Saturated Porous Media; User Manual Version 3.01; PC-Progress: Prague, Czech Republic; Riverside, CA, USA; Rio de Janeiro, Brazil; Utrecht, The Netherlands, 2018; p. 324. [Google Scholar]
- Šimůnek, J.; PC-Progress, Prague, Czech Republic. Personal communication, 2018.
- Stevens Water Monitoring Systems, Inc. HydraProbe Soil Sensor, User’s Manual; Stevens Water Monitoring Systems, Inc.: Portland, OR, USA, 2018; p. 63. [Google Scholar]
- Anderson, M.P.; Woessner, W.W.; Hunt, R.J. Applied Groundwater Modelling: Simulation of Flow and Advective Transport; Academic Press: Cambridge, MA, USA, 2015; p. 630. [Google Scholar]
Figure 1.
Set-up of three-dimensional (3D)-Tank with separated, closely-spaced (A) as well as joint infiltration (B) of treated waste water and precipitation with positions of observation points as listed in Table 2 (please note that observation points P4 and P7 are out-centered from points P3 and P5, respectively), left photo shows the tank, right photo shows realization of the treated waste water ditch using a slotted plastic pipe.

Figure 2.
Results for water content simulation for scenario WW-Ref (sep.) as compared to observed values in the laboratory tank experiment for the time of 8640 to 14,240 min. after the onset of numerical experiment.
Figure 2.
Results for water content simulation for scenario WW-Ref (sep.) as compared to observed values in the laboratory tank experiment for the time of 8640 to 14,240 min. after the onset of numerical experiment.

Figure 3.
Results for water content simulation for scenario WW-RE-Rep-1 (sep.) as compared to observed values in the laboratory tank experiment for the time 2500 to 5000 min. after onset of the numerical experiment, black dotted line indicates duration of precipitation event.
Figure 3.
Results for water content simulation for scenario WW-RE-Rep-1 (sep.) as compared to observed values in the laboratory tank experiment for the time 2500 to 5000 min. after onset of the numerical experiment, black dotted line indicates duration of precipitation event.

Figure 4.
Results for simulation of water contents for scenario WW-RE-Ref (jnt.) as compared to observed values in the laboratory tank experiment for the time 2500 to 5000 min. after onset of the numerical experiment, black dotted line indicates duration of precipitation event.
Figure 4.
Results for simulation of water contents for scenario WW-RE-Ref (jnt.) as compared to observed values in the laboratory tank experiment for the time 2500 to 5000 min. after onset of the numerical experiment, black dotted line indicates duration of precipitation event.

Figure 5.
Results for simulation of water contents for scenario WW-RE-Int (jnt.) as compared to observed values in the laboratory tank experiment for the time 2500 to 5000 min. after onset of the numerical experiment, black dotted line indicates duration of precipitation event.
Figure 5.
Results for simulation of water contents for scenario WW-RE-Int (jnt.) as compared to observed values in the laboratory tank experiment for the time 2500 to 5000 min. after onset of the numerical experiment, black dotted line indicates duration of precipitation event.

Figure 6.
COD (A), NH4-N (B), and NO3-N (C) concentration profiles in the 3D-Tank (sampling points: inflow, P1 and P5) before and 24 h/48 h/72 h after the precipitation event of statistical recurrence interval of 5 years (WW-RE-Ref (sep.)).
Figure 6.
COD (A), NH4-N (B), and NO3-N (C) concentration profiles in the 3D-Tank (sampling points: inflow, P1 and P5) before and 24 h/48 h/72 h after the precipitation event of statistical recurrence interval of 5 years (WW-RE-Ref (sep.)).

Figure 7.
Oxygen saturation in the 3D-Tank (observation points: P1, P2, P5, and P6) before, during and after the precipitation event of statistical recurrence interval of five years (WW-RE-Ref (sep.)), black dashed line indicates duration of precipitation event.
Figure 7.
Oxygen saturation in the 3D-Tank (observation points: P1, P2, P5, and P6) before, during and after the precipitation event of statistical recurrence interval of five years (WW-RE-Ref (sep.)), black dashed line indicates duration of precipitation event.


Table 1.
Results obtained for van Genuchten retention model (Mualem model-based saturated hydraulic conductivity [24] and pore connectivity were not estimated) by analysis of the retention behavior laboratory data (software: Hyprop data evaluation software 2.0, Co. METER Group, Munich, Germany); hydraulic conductivity estimated using permeameter test after [23]; bulk density estimated by [25].
| Parameter | Sample 1 | Sample 2 | Sample 3 |
|---|---|---|---|
| Van Genuchten shape parameter α (cm−1) | 0.0402 | 0.0326 | 0.0272 |
| Van Genuchten shape parameter n (−) | 4.124 | 4.055 | 4.256 |
| Residual water content θr (cm3 cm−3) | 0.123 | 0.1 | 0.094 |
| Saturated water content θs (cm3 cm−3) | 0.394 | 0.355 | 0.363 |
| Bulk density ρb (g cm−3) | 1.59 | 1.68 | 1.67 |
| Saturated hydraulic conductivity K (cm day−1) | 363 | ||
Table 2.
Location of observation points for both set-ups using a local coordinate system having point of origin (0;0;0) at the lower left corner of the tank, WC is water content, O2 is oxygen, SC is suction cup.
Table 2.
Location of observation points for both set-ups using a local coordinate system having point of origin (0;0;0) at the lower left corner of the tank, WC is water content, O2 is oxygen, SC is suction cup.
| Observation Point | Closely Spaced, Separated Ditches (X;Y;Z) | Equipped with | Joint Ditches (X;Y;Z) | Equipped with |
|---|---|---|---|---|
| P1 | 96; 49; 95 | WC, O2, SC | 1105; 49; 90 | WC, SC |
| P2 | 1255; 49; 95 | WC, O2, SC | 1255; 49; 90 | WC, O2, SC |
| P3 | 1255; 49; 65 | WC, SC | 1255; 49; 65 | WC, O2, SC |
| P4 | 1255; 25; 65 | WC | 1255; 25; 65 | WC |
| P5 | 96; 49; 35 | WC, O2, SC | 1005; 49; 65 | WC, O2, SC |
| P6 | 1255; 49; 35 | WC, O2, SC | 1255; 49; 35 | WC, O2, SC |
| P7 | 96; 25; 35 | WC | 1005; 25; 65 | WC |
Table 3.
Dimensions of the real world and downscaled 3D-Tank infiltration ditches.
| Infiltration System | Type of Ditch | Real World | 3D-Tank |
|---|---|---|---|
| Separate Infiltration | Treated waste water ditch (L × W × H) (m) | 8 × 0.5 × 0.5 | 0.53 × 0.035 × 0.035 |
| Precipitation ditch (L × W × H) (m) | 6 × 2 × 2.5 | 0.40 × 0.135 × 0.17 | |
| Joint Infiltration | Treated waste water + Precipitation Ditch (L × W × H) (m) | 8 × 2 × 3 | 0.53 × 0.135 × 0.20 |
Table 4.
Quality of the used treated waste water (TWW) and precipitation water (PW), n.d. not detectable, n.a. not available.
Table 4.
Quality of the used treated waste water (TWW) and precipitation water (PW), n.d. not detectable, n.a. not available.
| Type of Water | pH (−) | EC (µS cm−1) | COD | NO2-N | NO3-N | NH4-N | Total P | SO42− | Cl− |
|---|---|---|---|---|---|---|---|---|---|
| (mg L−1) | |||||||||
| TWW | 7.45 | 1174 | 45.5 | 0.67 | 52 | 12.4 | 29 | 80 | 110 |
| PW | 6.2 | 58 | n.d. | n.d. | 2 | n.d. | n.d. | 5.3 | 3.6 |
| Limit Value acc. to [28] | 6.5–9.5 | 2790 | n.a. | 0.15 | 11.3 | 0.39 | n.a. | 250 | 250 |
Table 5.
Scenarios analyzed in the tank experiment (WW denotes a scenario applying only the waste water infiltration ditch, WW-RE denotes a scenario applying both the waste water and the precipitation water infiltration ditch), scaling factors refer to a real-world ditch.
Table 5.
Scenarios analyzed in the tank experiment (WW denotes a scenario applying only the waste water infiltration ditch, WW-RE denotes a scenario applying both the waste water and the precipitation water infiltration ditch), scaling factors refer to a real-world ditch.
| Scenario | Abbreviation | Description | Ditch Arrangement |
|---|---|---|---|
| Reference scenario only waste water infiltration | WW-Ref | Waste water is infiltrated by a rate of 39.9 L day−1 (0.3 L min−1) which includes a scaling factor of 15. | separated |
| Repetition scenario for waste water infiltration | WW-Rep | Same as for WW-Ref | separated |
| Reference scenario waste water and precipitation water infiltration | WW-RE-Ref | Waste water is infiltrated by a rate of 2.7 L day−1 (0.02 L min−1). Precipitation water is infiltrated at a rate of 0.425 L min−1 for 120 min., both including a scaling factor of 225. | separated and joint |
| Repetition scenario 1 for waste water and precipitation water infiltration | WW-RE-Rep-1 | Same as for WW-RE-Ref | separated and joint |
| Repetition scenario 2 for waste water and precipitation water infiltration | WW-RE-Rep-2 | Same as for WW-RE-Ref | separated and joint |
| Scenario waste water and precipitation water infiltration for 24 h | WW-RE-24 | Waste water is infiltrated by a rate of 2.7 L day−1 (0.02 L min−1). Precipitation water is infiltrated at a rate of 0.425 L min−1 for 1440 min. | separated and joint |
| Scenario waste water and precipitation water infiltration with 5 times higher intensity | WW-RE-Int | Waste water is infiltrated by a rate of 2.7 L day−1 (0.02 L min−1). Precipitation water is infiltrated at a rate of 2.125 L min−1 for 120 min. | separated and joint |
Table 6.
Final data set for sandy tank material based on calibration using scenarios WW-Ref and WW-RE-Ref, the value for the pore connectivity parameter in the conductivity function, here −1 was selected after [34].
Table 6.
Final data set for sandy tank material based on calibration using scenarios WW-Ref and WW-RE-Ref, the value for the pore connectivity parameter in the conductivity function, here −1 was selected after [34].
| Parameter | Separated Ditches | Joint Ditch |
|---|---|---|
| Van Genuchten shape parameter α (cm−1) | 0.05 | 0.1 |
| Van Genuchten shape parameter n (−) | 4.0 | 3.5 |
| Residual water content θr (cm3 cm−3) | 0.095 | 0.095 |
| Saturated water content θs (cm3 cm−3) | 0.33 | 0.33 |
| Pore connectivity parameter in the conductivity function l (−) | −1.0 | −1.0 |
| Saturated hydraulic conductivity K (cm day−1) | 360 | 720 |
Table 7.
Model fit to observation regarding water content (cm3 cm−3), jointly calculated over the total simulation time and the time most influenced by the precipitation event over all observation points P1–P7, respectively, for separated ditches scenarios “sep.”
Table 7.
Model fit to observation regarding water content (cm3 cm−3), jointly calculated over the total simulation time and the time most influenced by the precipitation event over all observation points P1–P7, respectively, for separated ditches scenarios “sep.”
| Scenario | RMSE | MAE | RMSE (Precipitation Event) | MAE (Precipitation Event) |
|---|---|---|---|---|
| WW-Ref | 0.0131 | 0.0116 | - | - |
| WW-Rep | 0.0121 | 0.0111 | - | - |
| WW-RE-Ref | 0.0125 | 0.0067 | 0.0120 | 0.0080 |
| WW-RE-Rep-1 | 0.0120 | 0.0067 | 0.0139 | 0.0100 |
| WW-RE-Rep-2 | 0.0124 | 0.0065 | 0.0146 | 0.0094 |
| WW-RE-24 | 0.0324 | 0.0190 | 0.0455 | 0.0452 |
| WW-RE-Int | 0.0222 | 0.0100 | 0.0609 | 0.0447 |
Table 8.
Model fit to observation regarding water content (cm3 cm−3), jointly calculated over the total simulation time and the time most influenced by the precipitation event and over all observation points P1–P7 for joint ditch scenarios “jnt.”.
Table 8.
Model fit to observation regarding water content (cm3 cm−3), jointly calculated over the total simulation time and the time most influenced by the precipitation event and over all observation points P1–P7 for joint ditch scenarios “jnt.”.
| Scenario | RMSE | MAE | RMSE (Precipitation Event) | MAE (Precipitation Event) |
|---|---|---|---|---|
| WW-RE-Ref | 0.0149 | 0.0119 | 0.0271 | 0.0199 |
| WW-RE-Rep-1 | 0.0167 | 0.0135 | 0.0273 | 0.0185 |
| WW-RE-Rep-2 | 0.0129 | 0.0102 | 0.0254 | 0.0187 |
| WW-RE-24 | 0.0220 | 0.0138 | 0.0365 | 0.0285 |
| WW-RE-Int | 0.0168 | 0.0108 | 0.0392 | 0.0315 |
© 2019 by the authors. Licensee MDPI, Basel, Switzerland. This article is an open access article distributed under the terms and conditions of the Creative Commons Attribution (CC BY) license (http://creativecommons.org/licenses/by/4.0/).
Share and Cite
MDPI and ACS Style
Händel, F.; Fichtner, T.; Graeber, P.-W. Numerical and Laboratory Investigations of Closely-Spaced and Joint Infiltration of Precipitation and Treated Waste Water. Water 2019, 11, 2262. https://doi.org/10.3390/w11112262
AMA Style
Händel F, Fichtner T, Graeber P-W. Numerical and Laboratory Investigations of Closely-Spaced and Joint Infiltration of Precipitation and Treated Waste Water. Water. 2019; 11(11):2262. https://doi.org/10.3390/w11112262
Chicago/Turabian StyleHändel, Falk, Thomas Fichtner, and Peter-Wolfgang Graeber. 2019. "Numerical and Laboratory Investigations of Closely-Spaced and Joint Infiltration of Precipitation and Treated Waste Water" Water 11, no. 11: 2262. https://doi.org/10.3390/w11112262
Note that from the first issue of 2016, this journal uses article numbers instead of page numbers. See further details here.