Influences of Plateau Zokor Burrowing on Soil Erosion and Nutrient Loss in Alpine Meadows in the Yellow River Source Zone of West China

Abstract
:1. Introduction
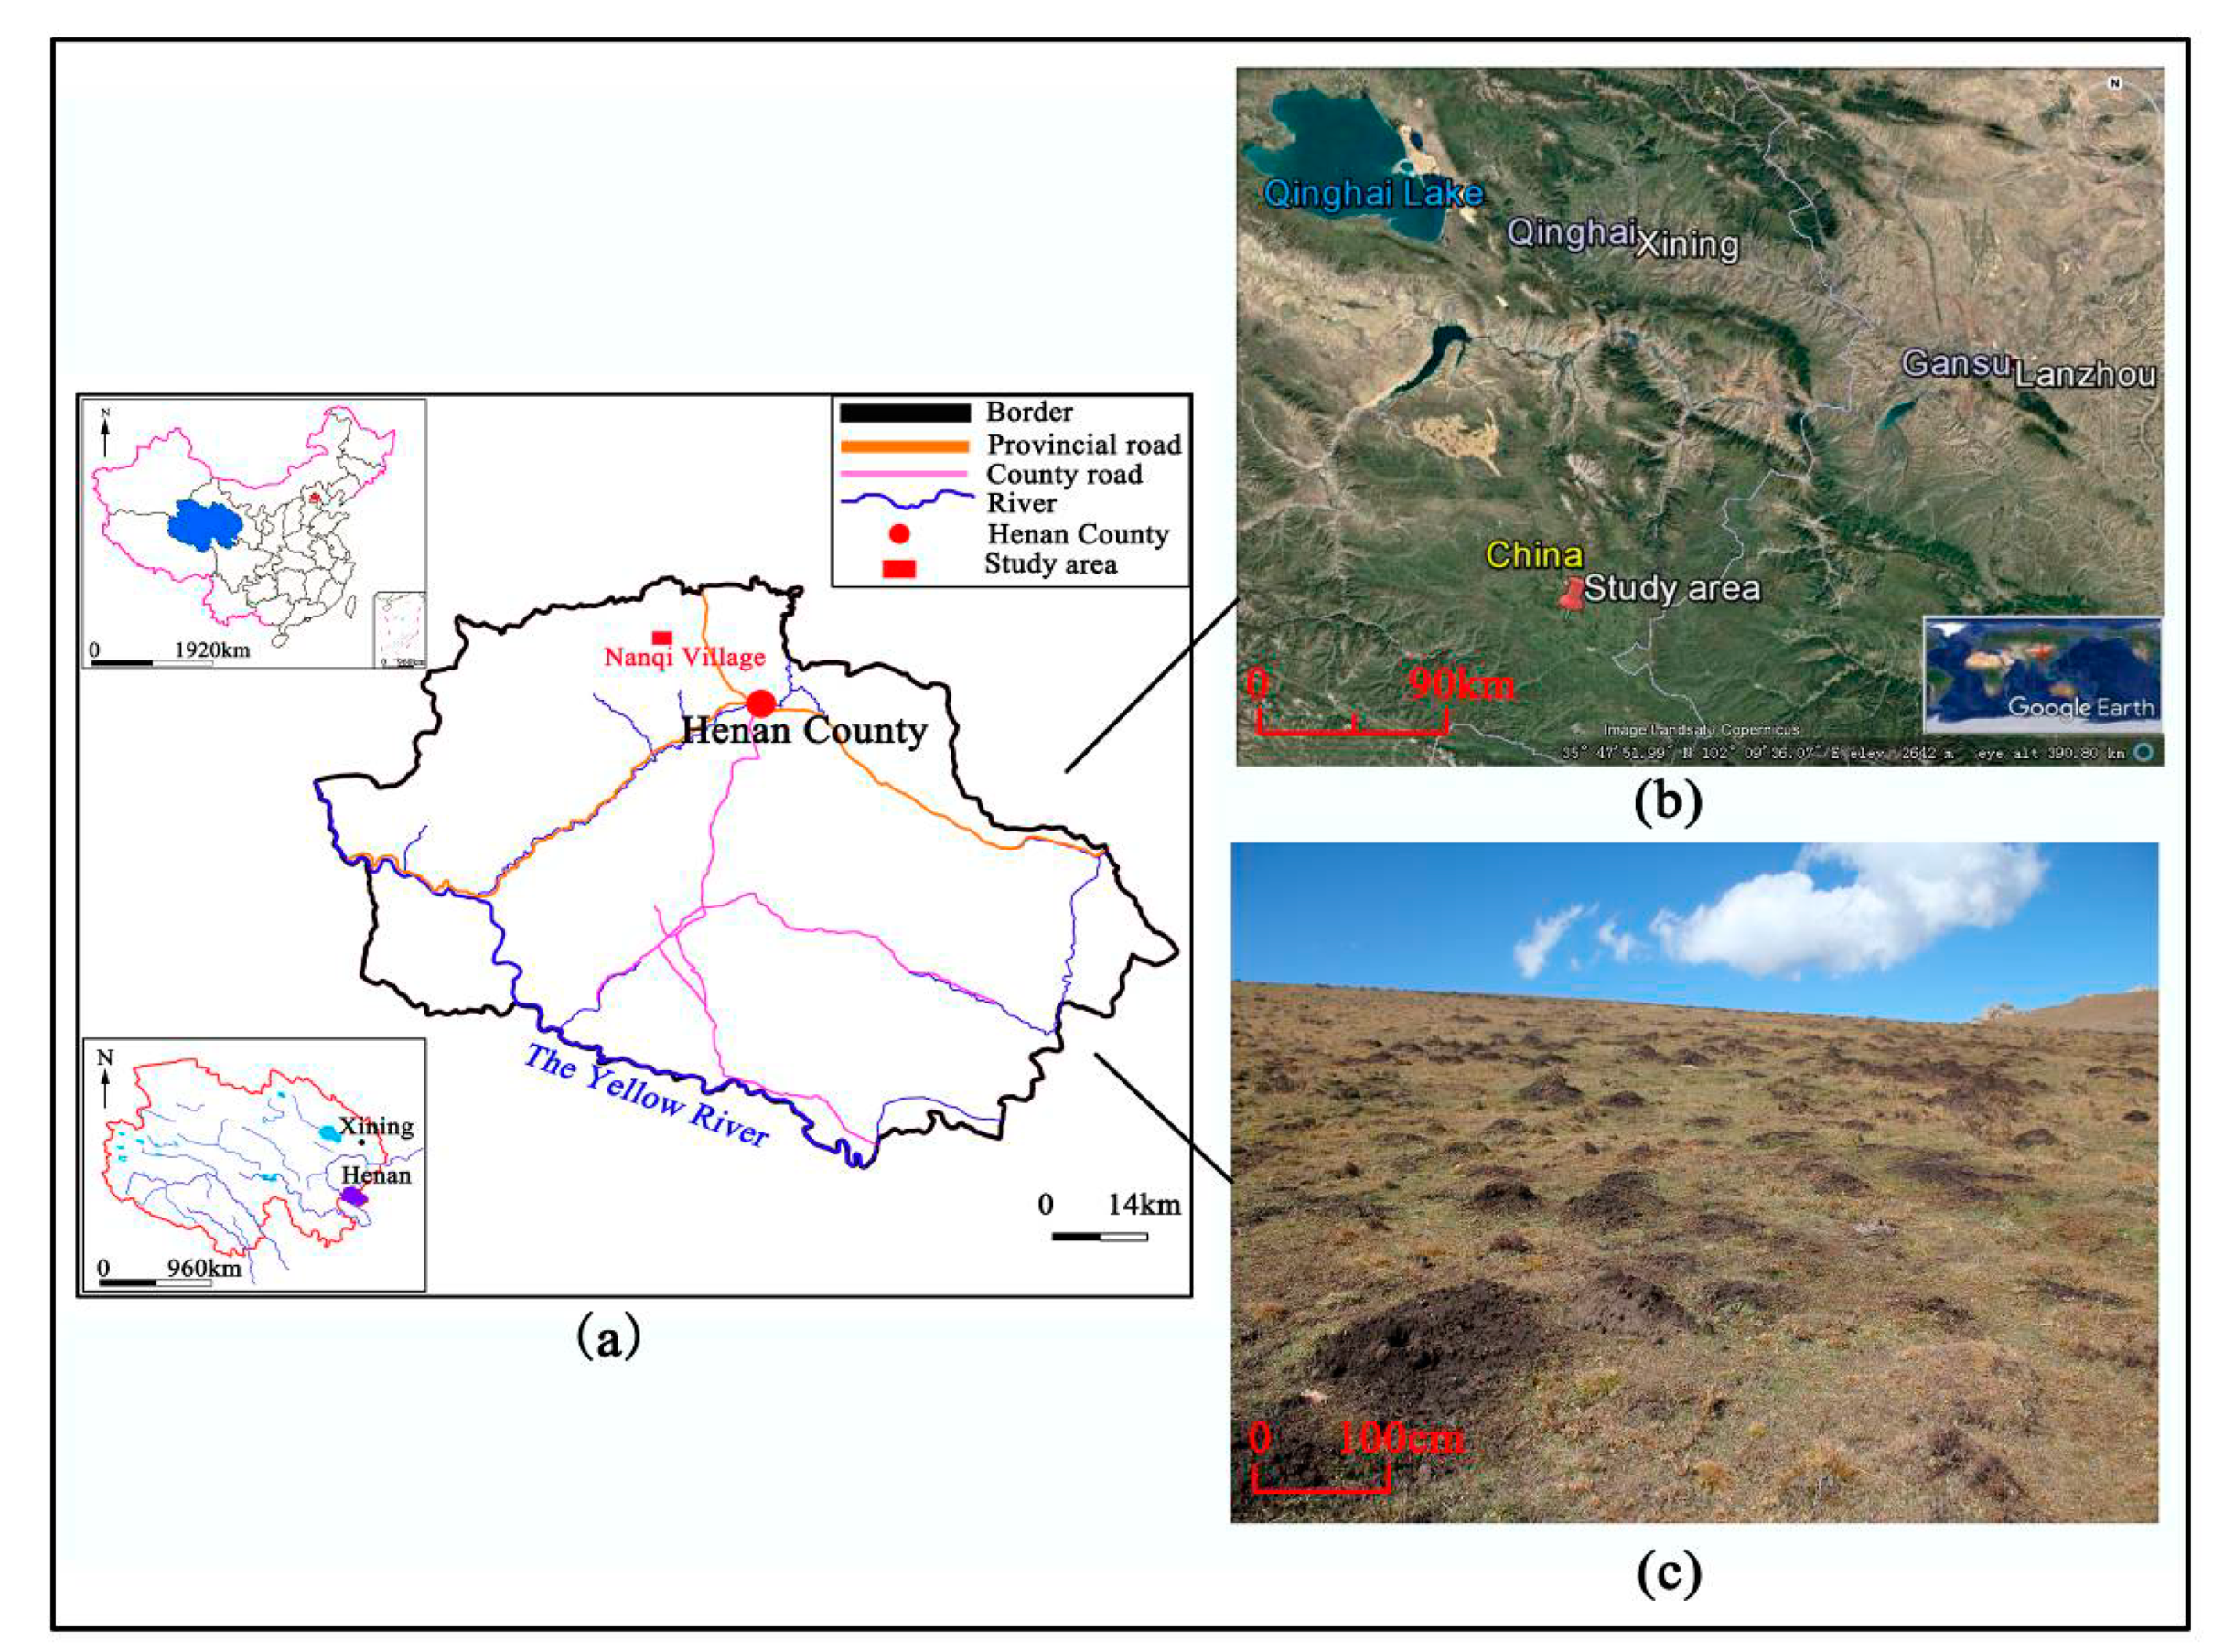
2. Study Area
3. Methodology
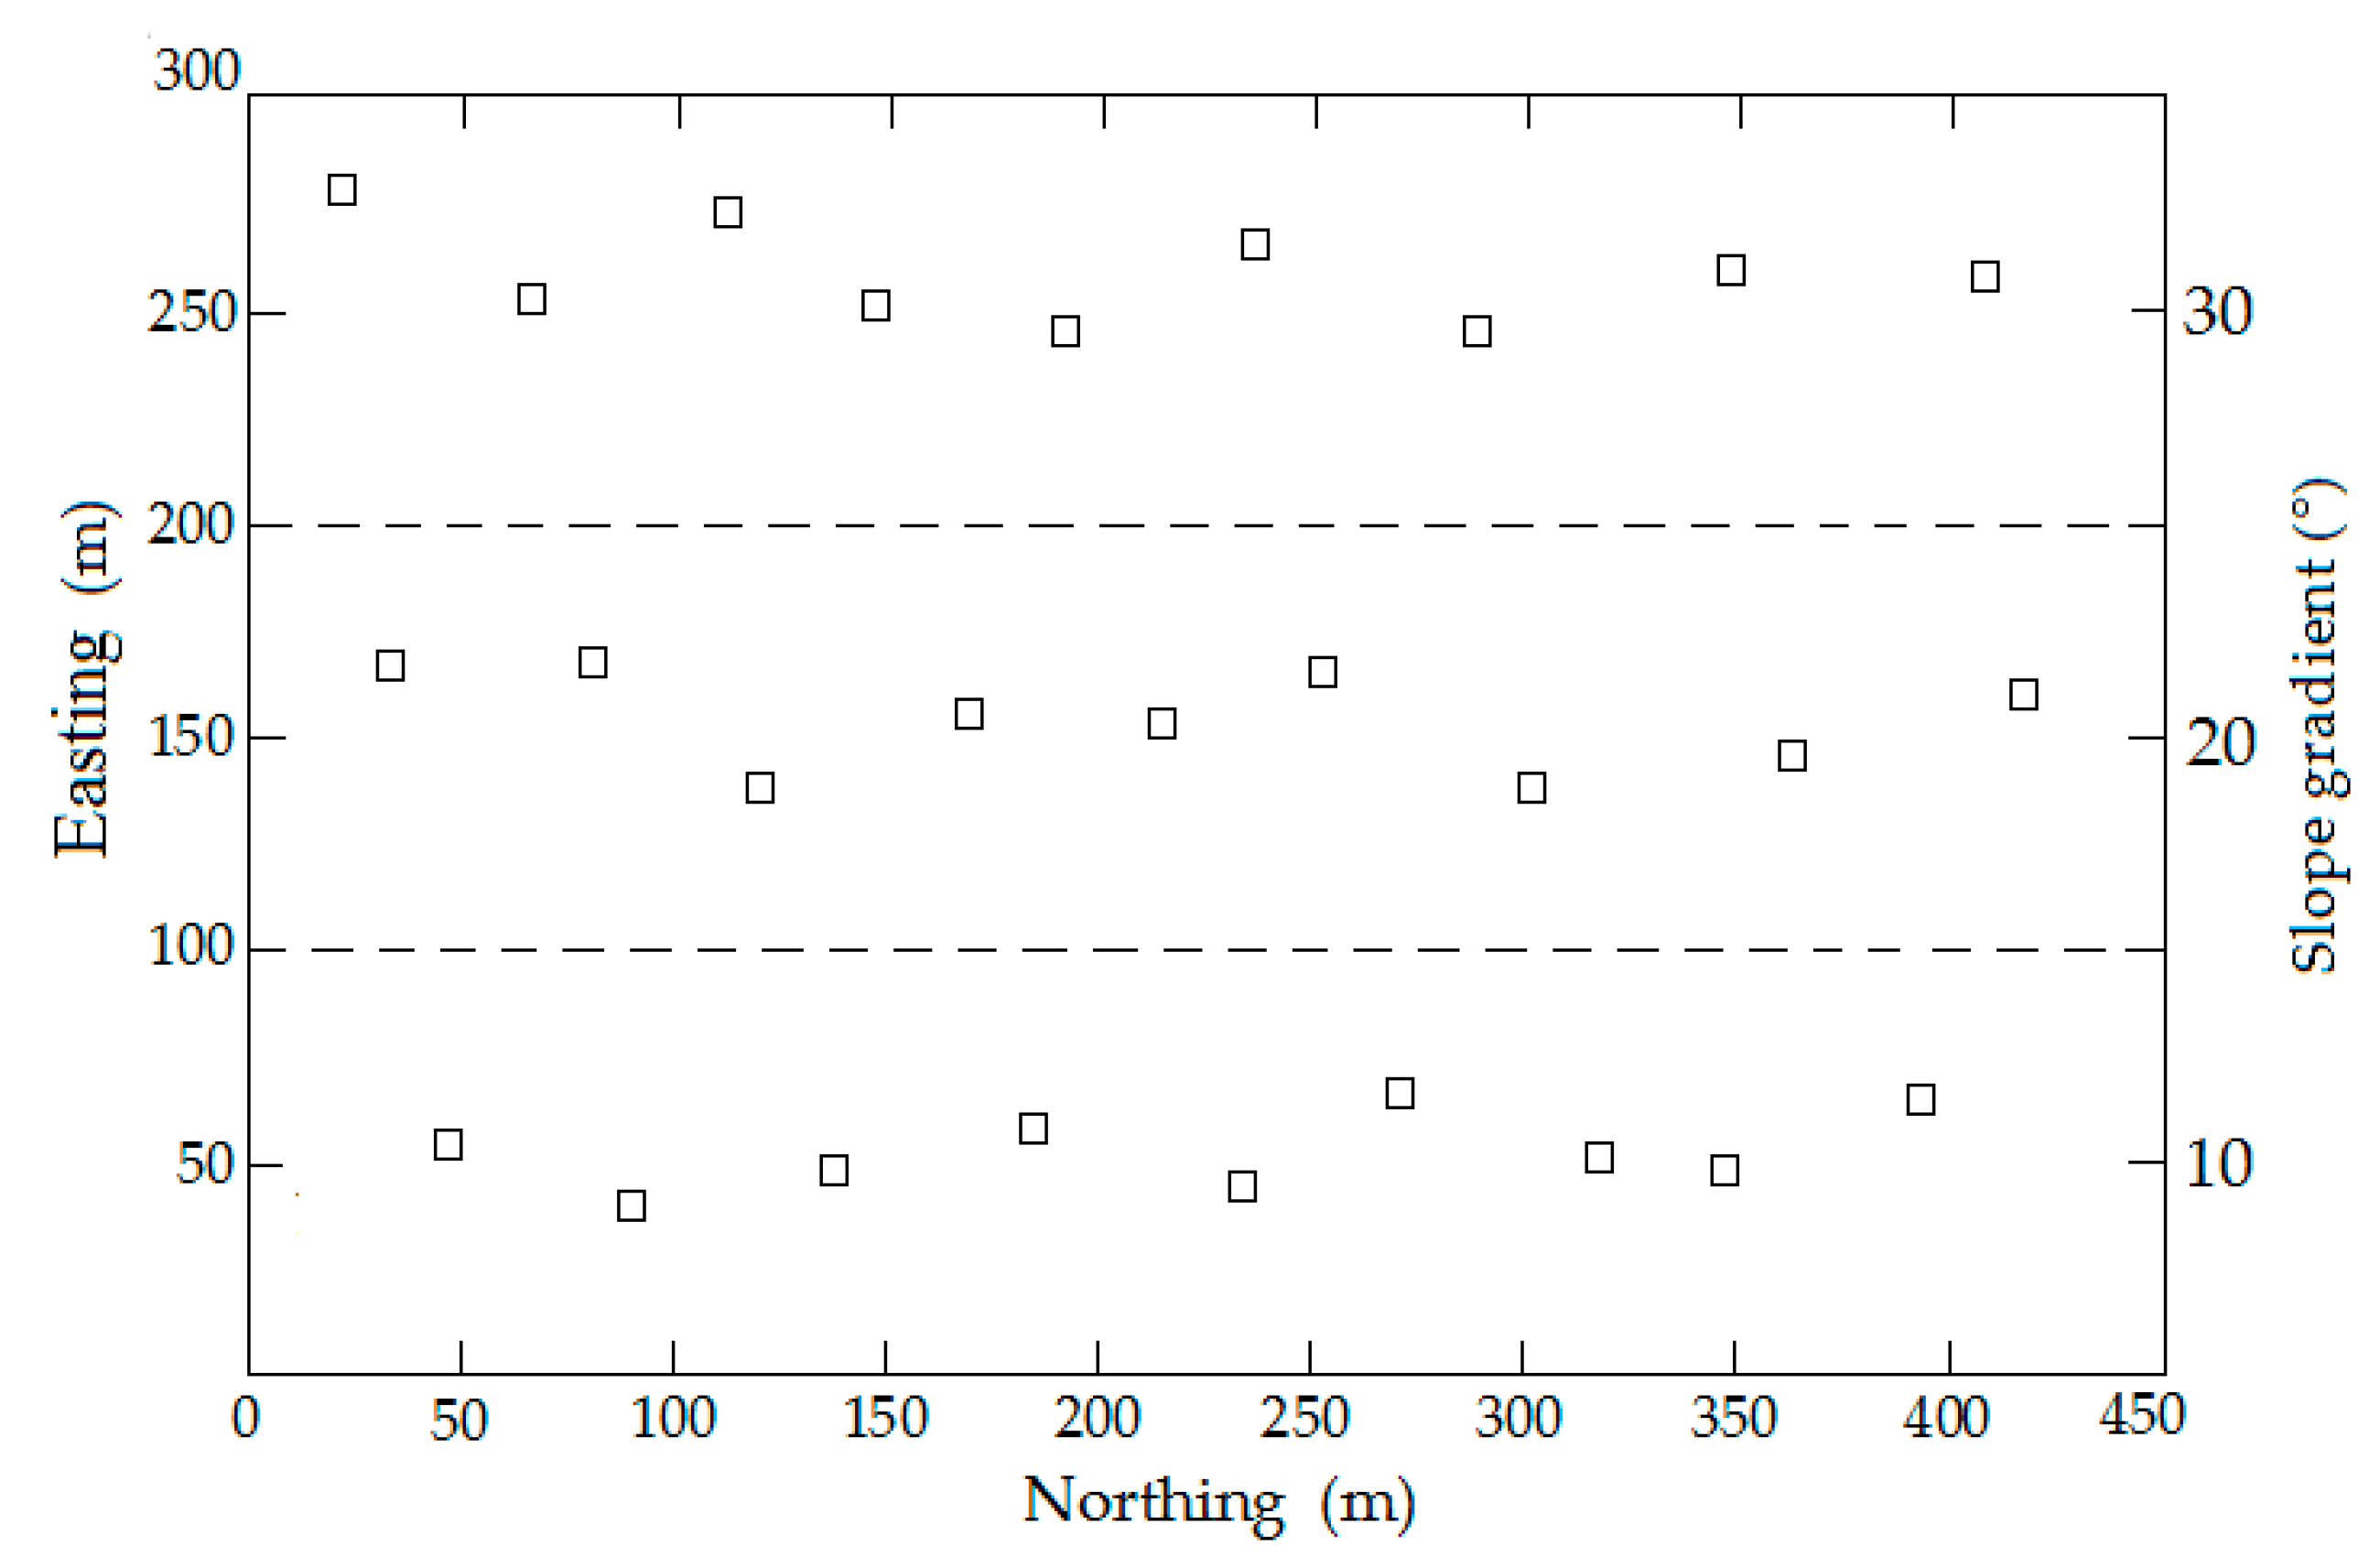
3.1. Site Selection
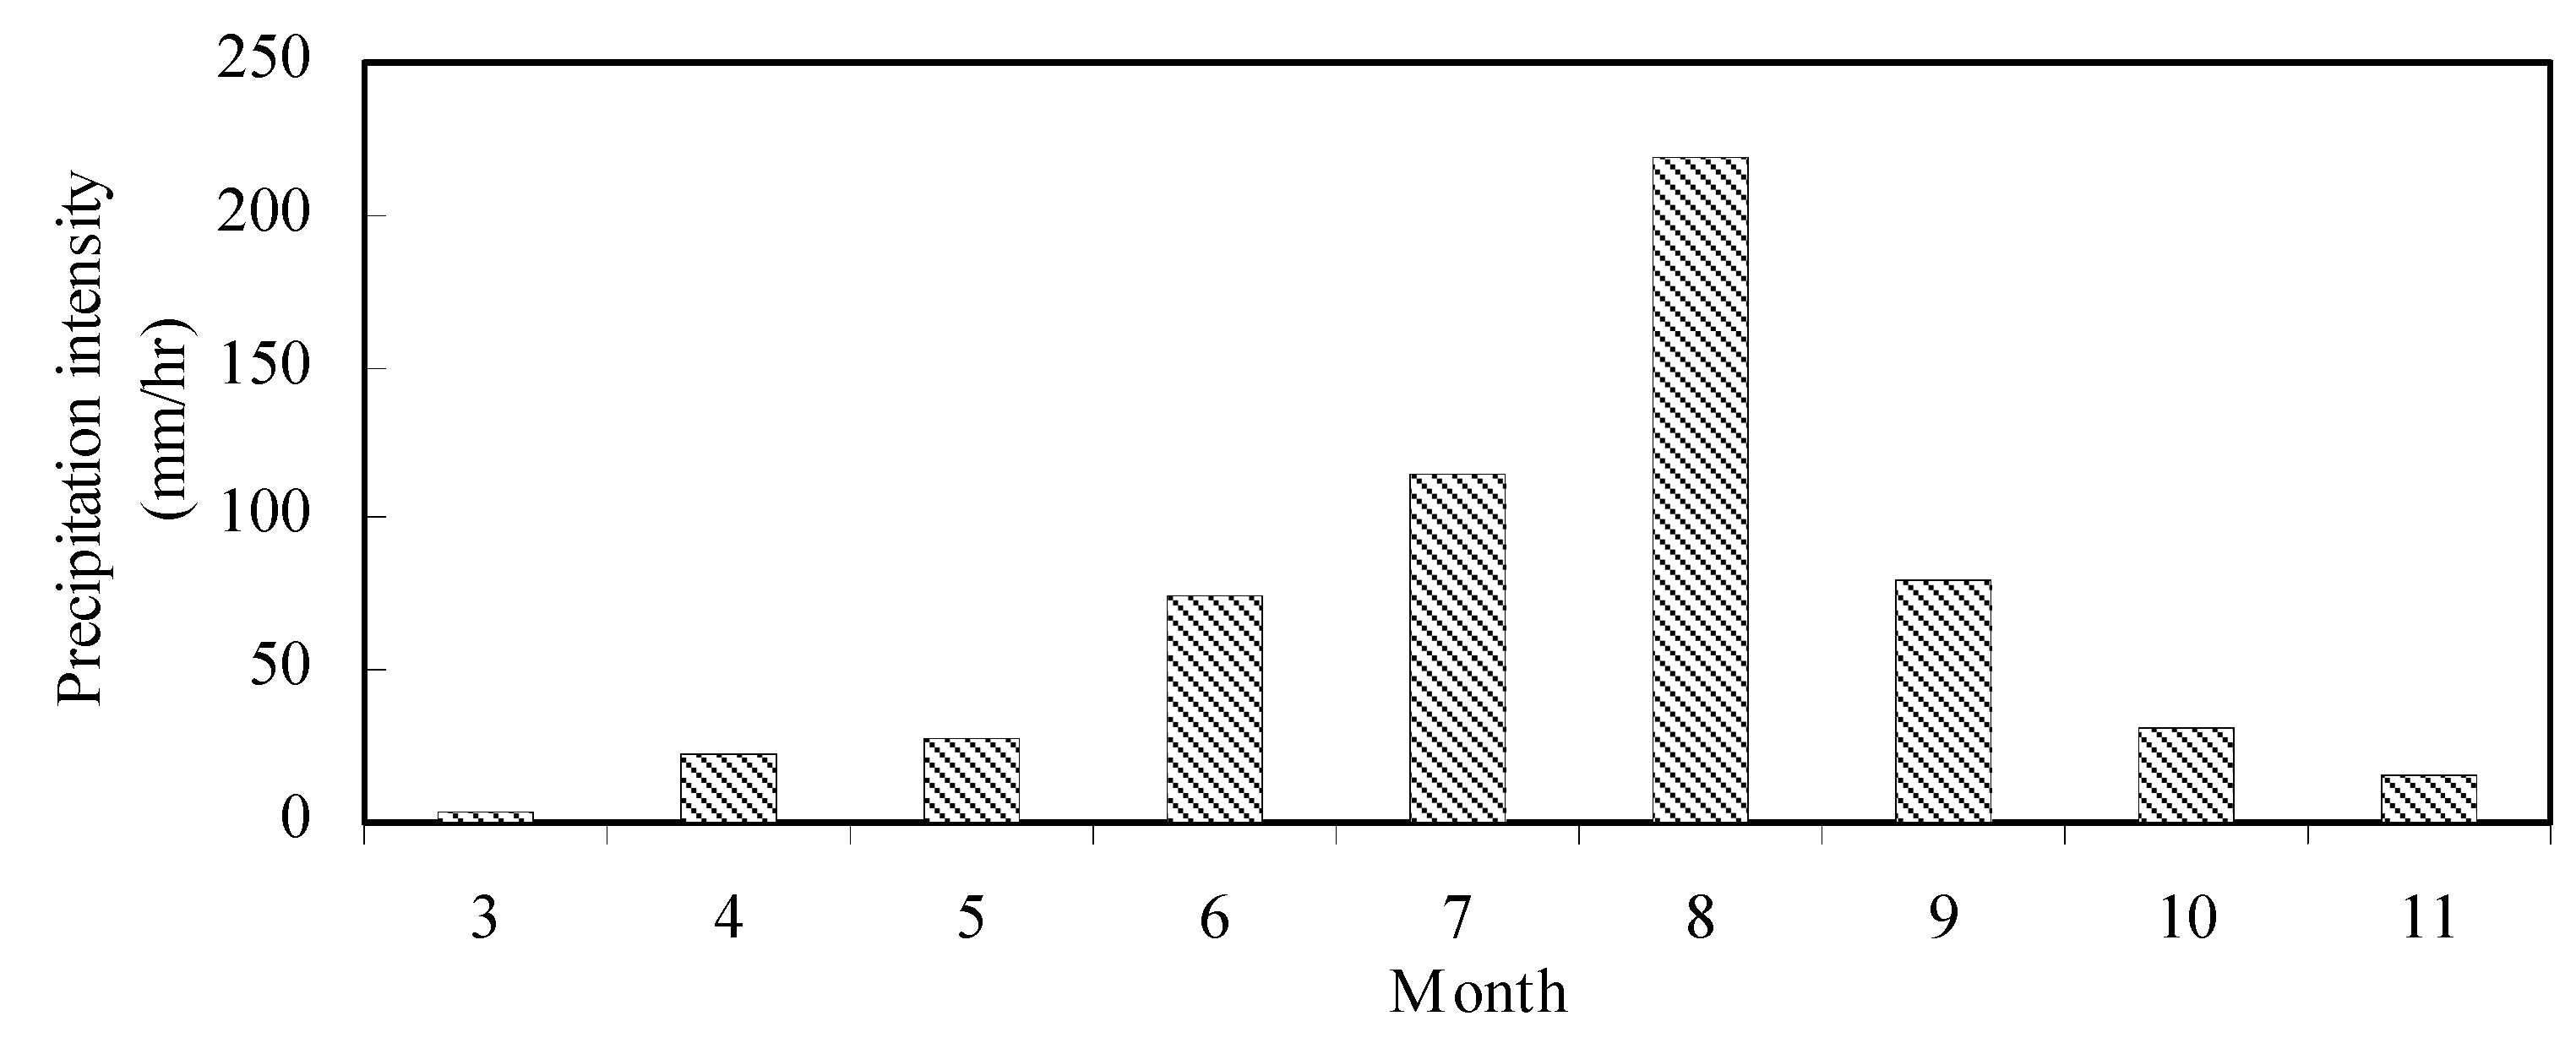
3.2. Precipitation Intensity
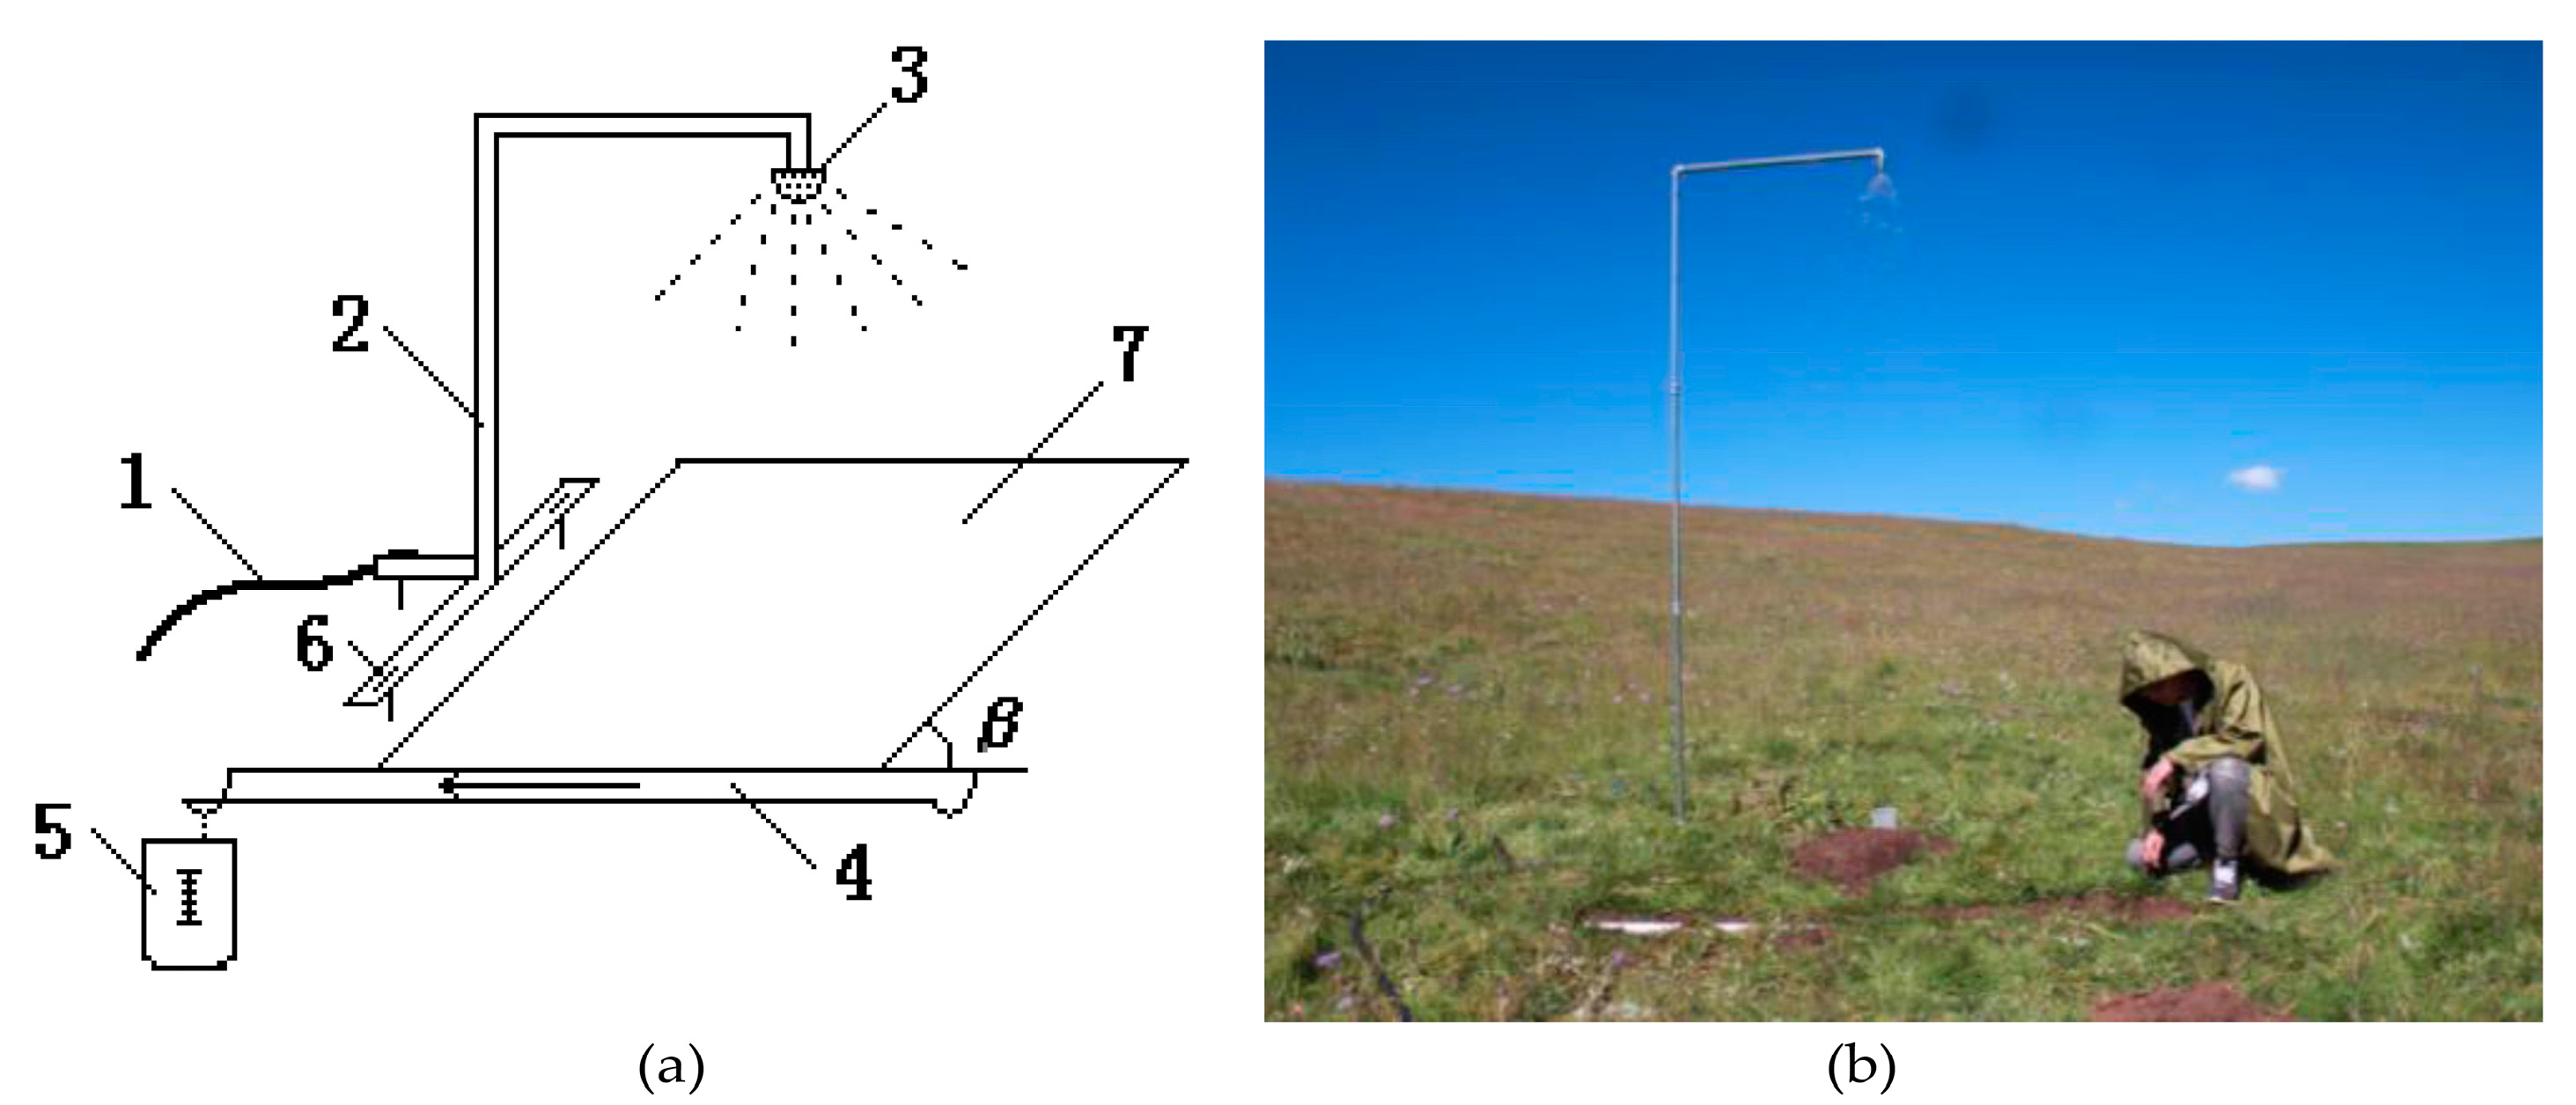
3.3. Rainfall Simulation
4. Results
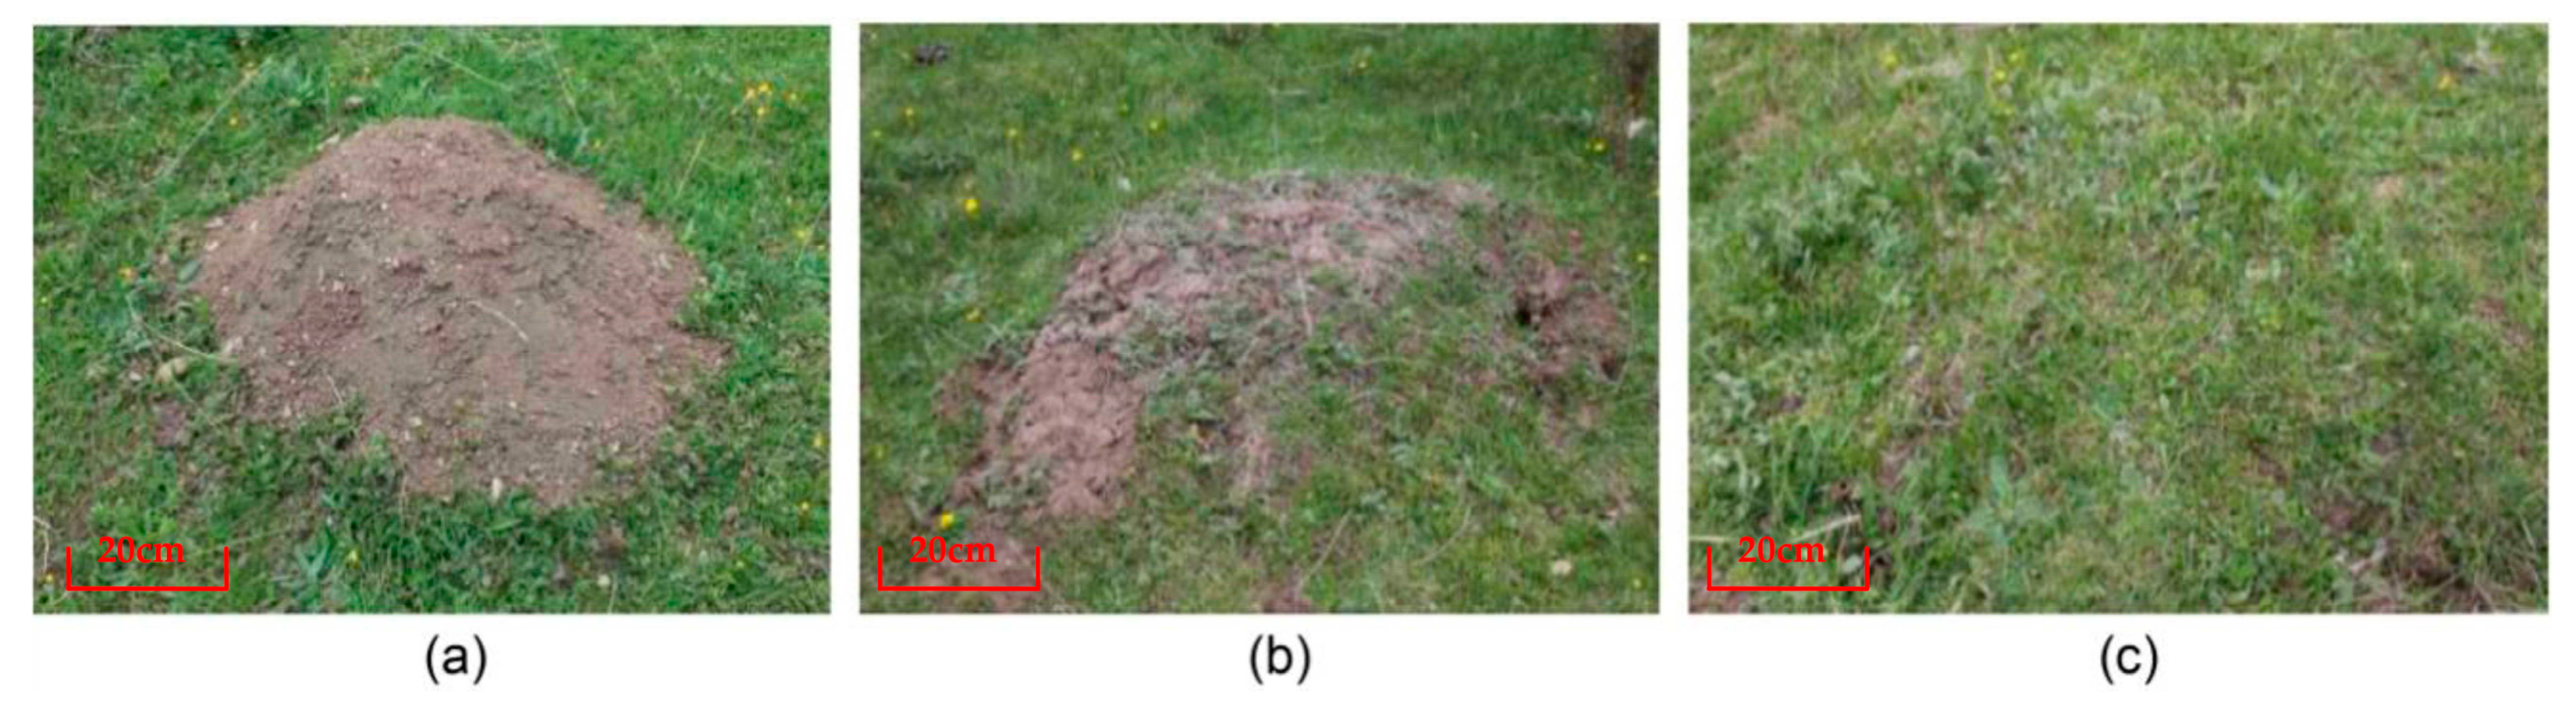
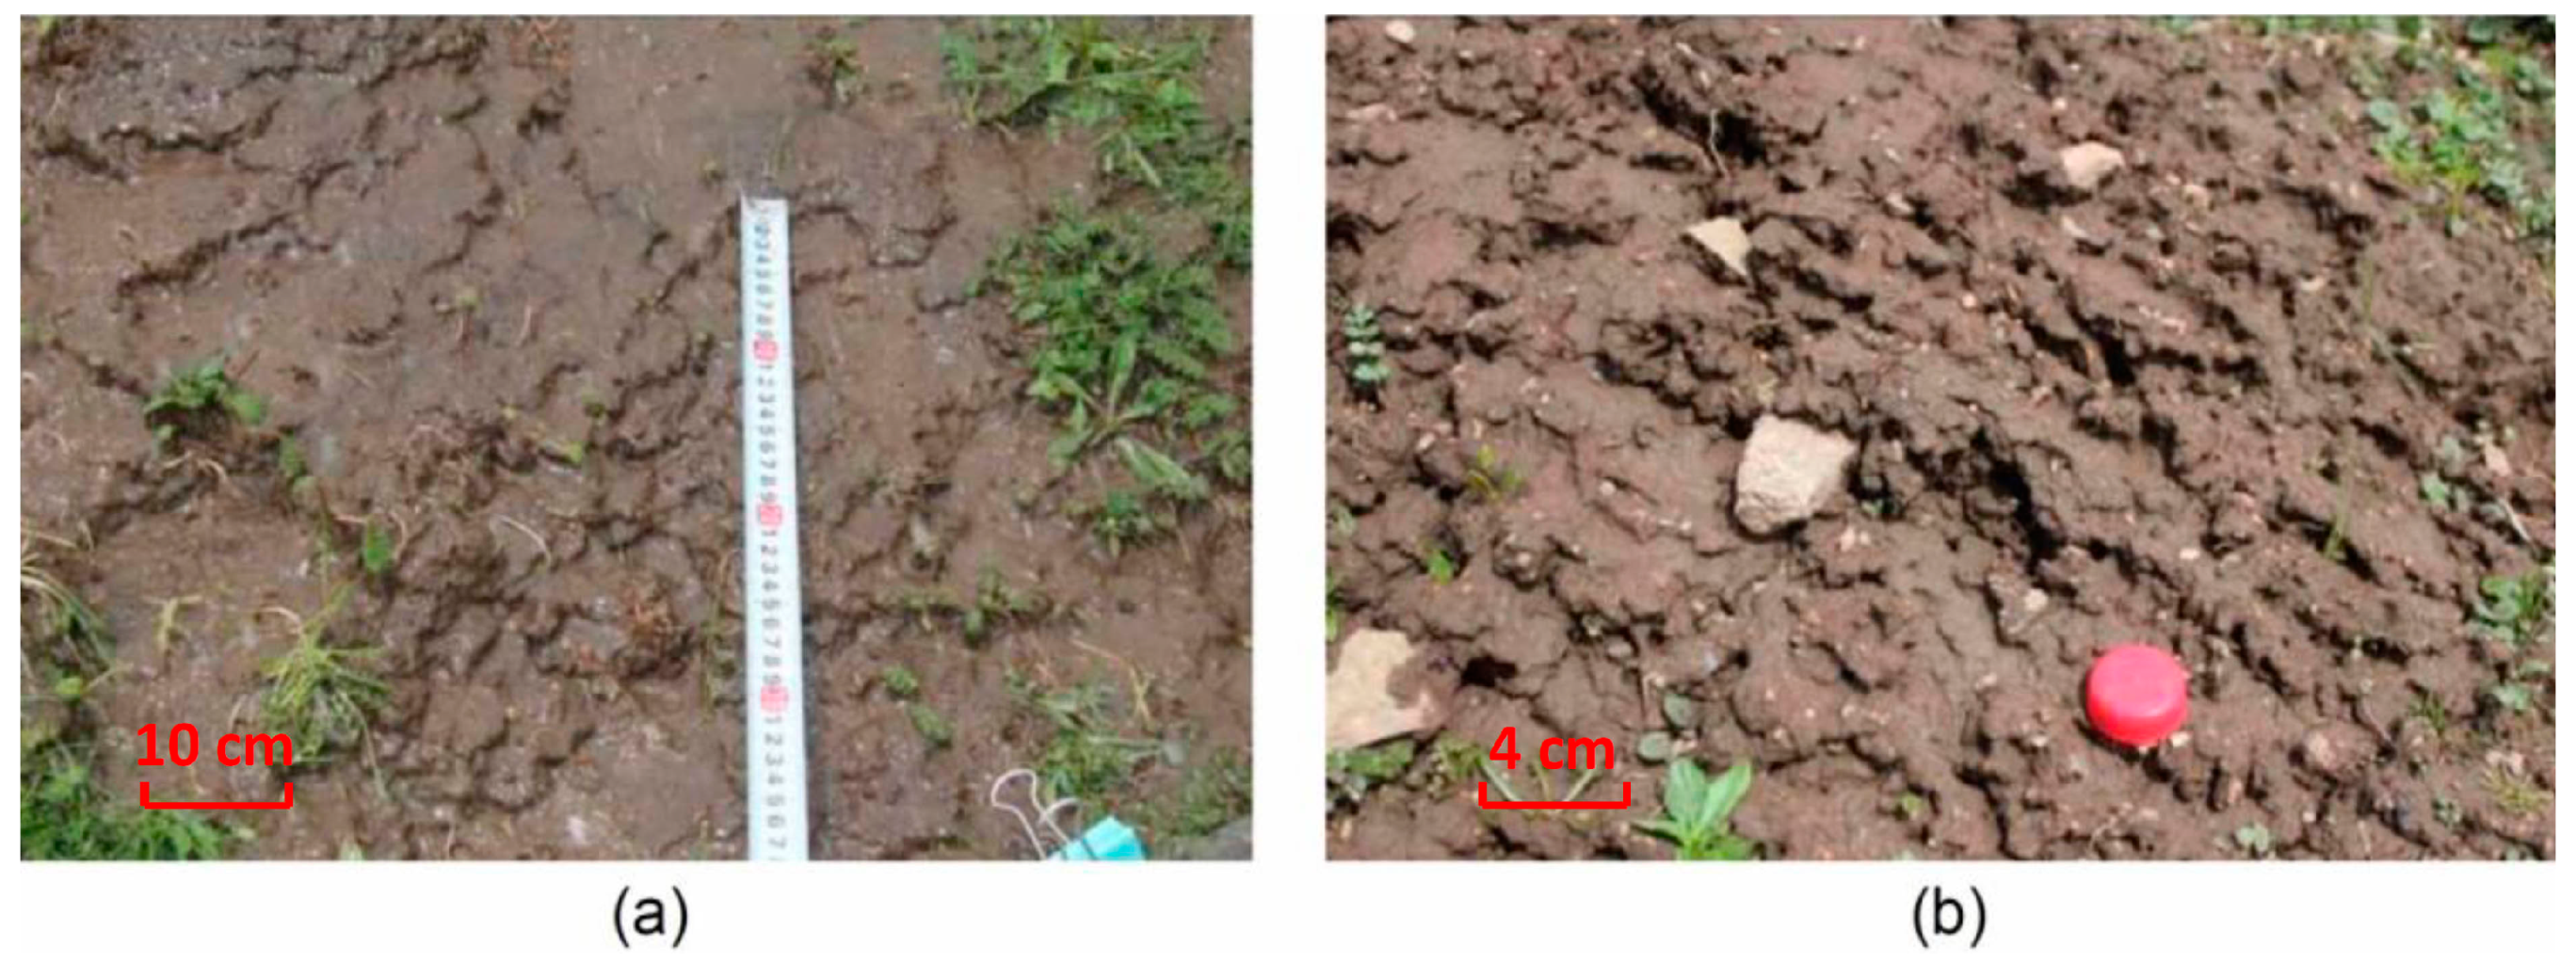
4.1. Change in Mound Surface Morphology
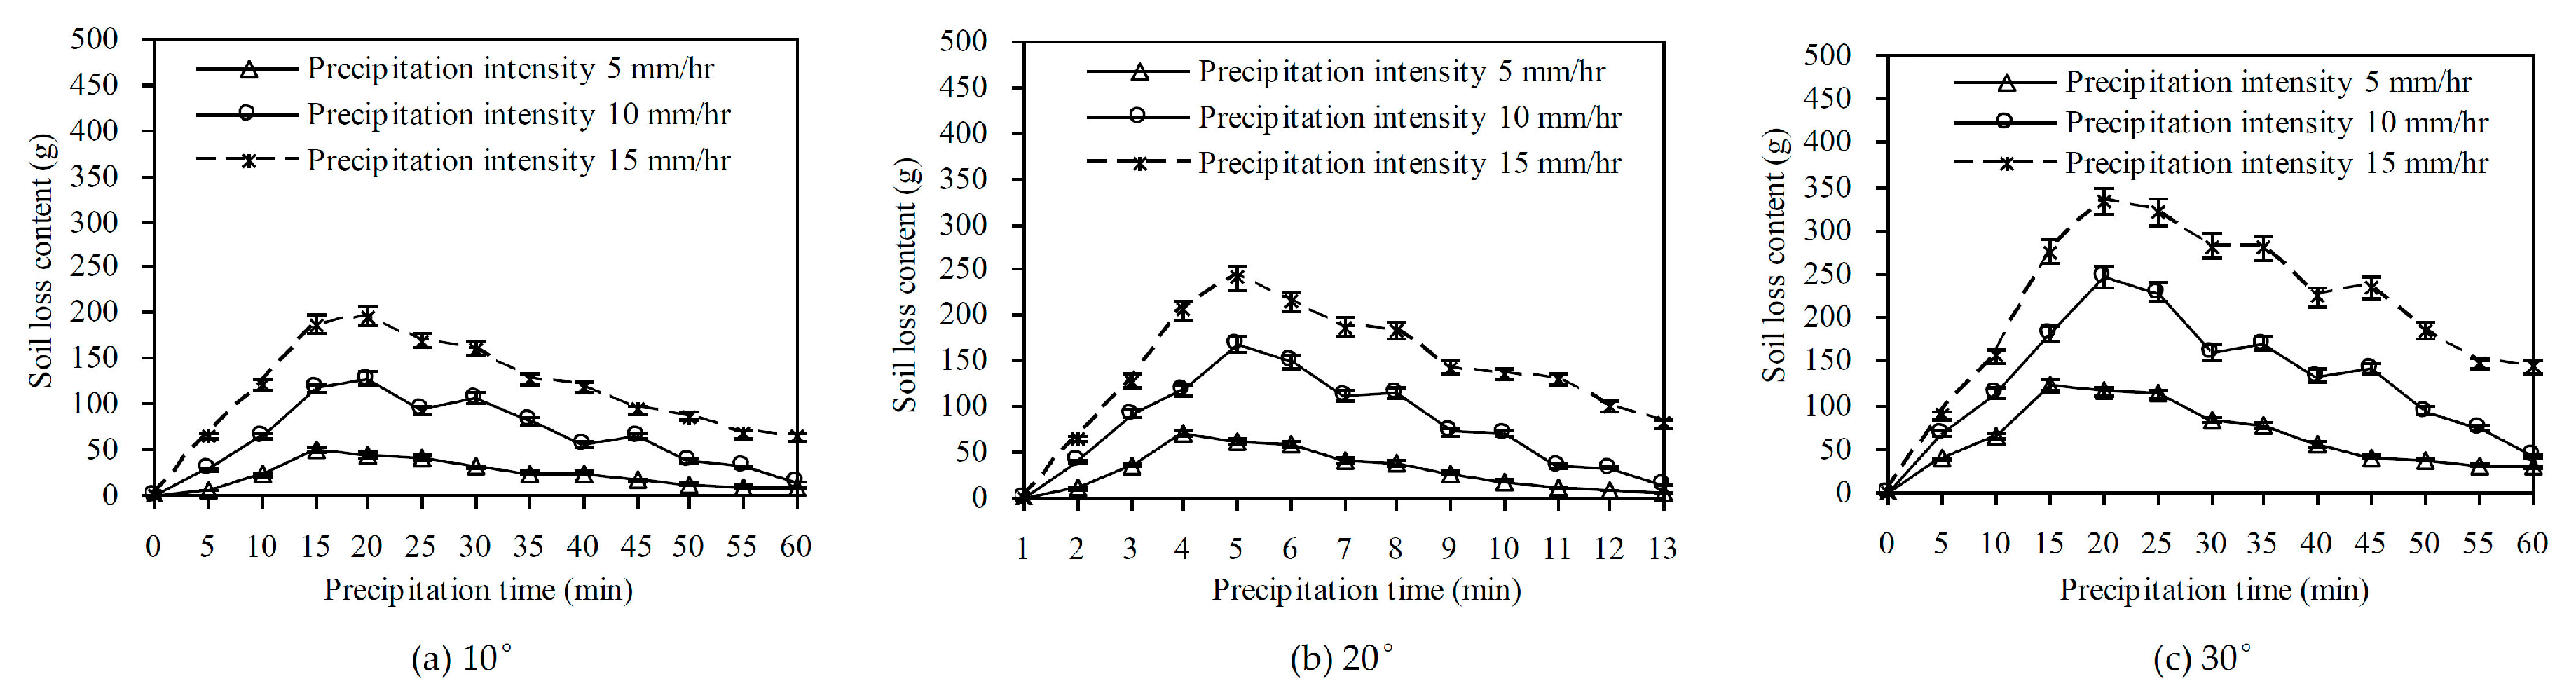
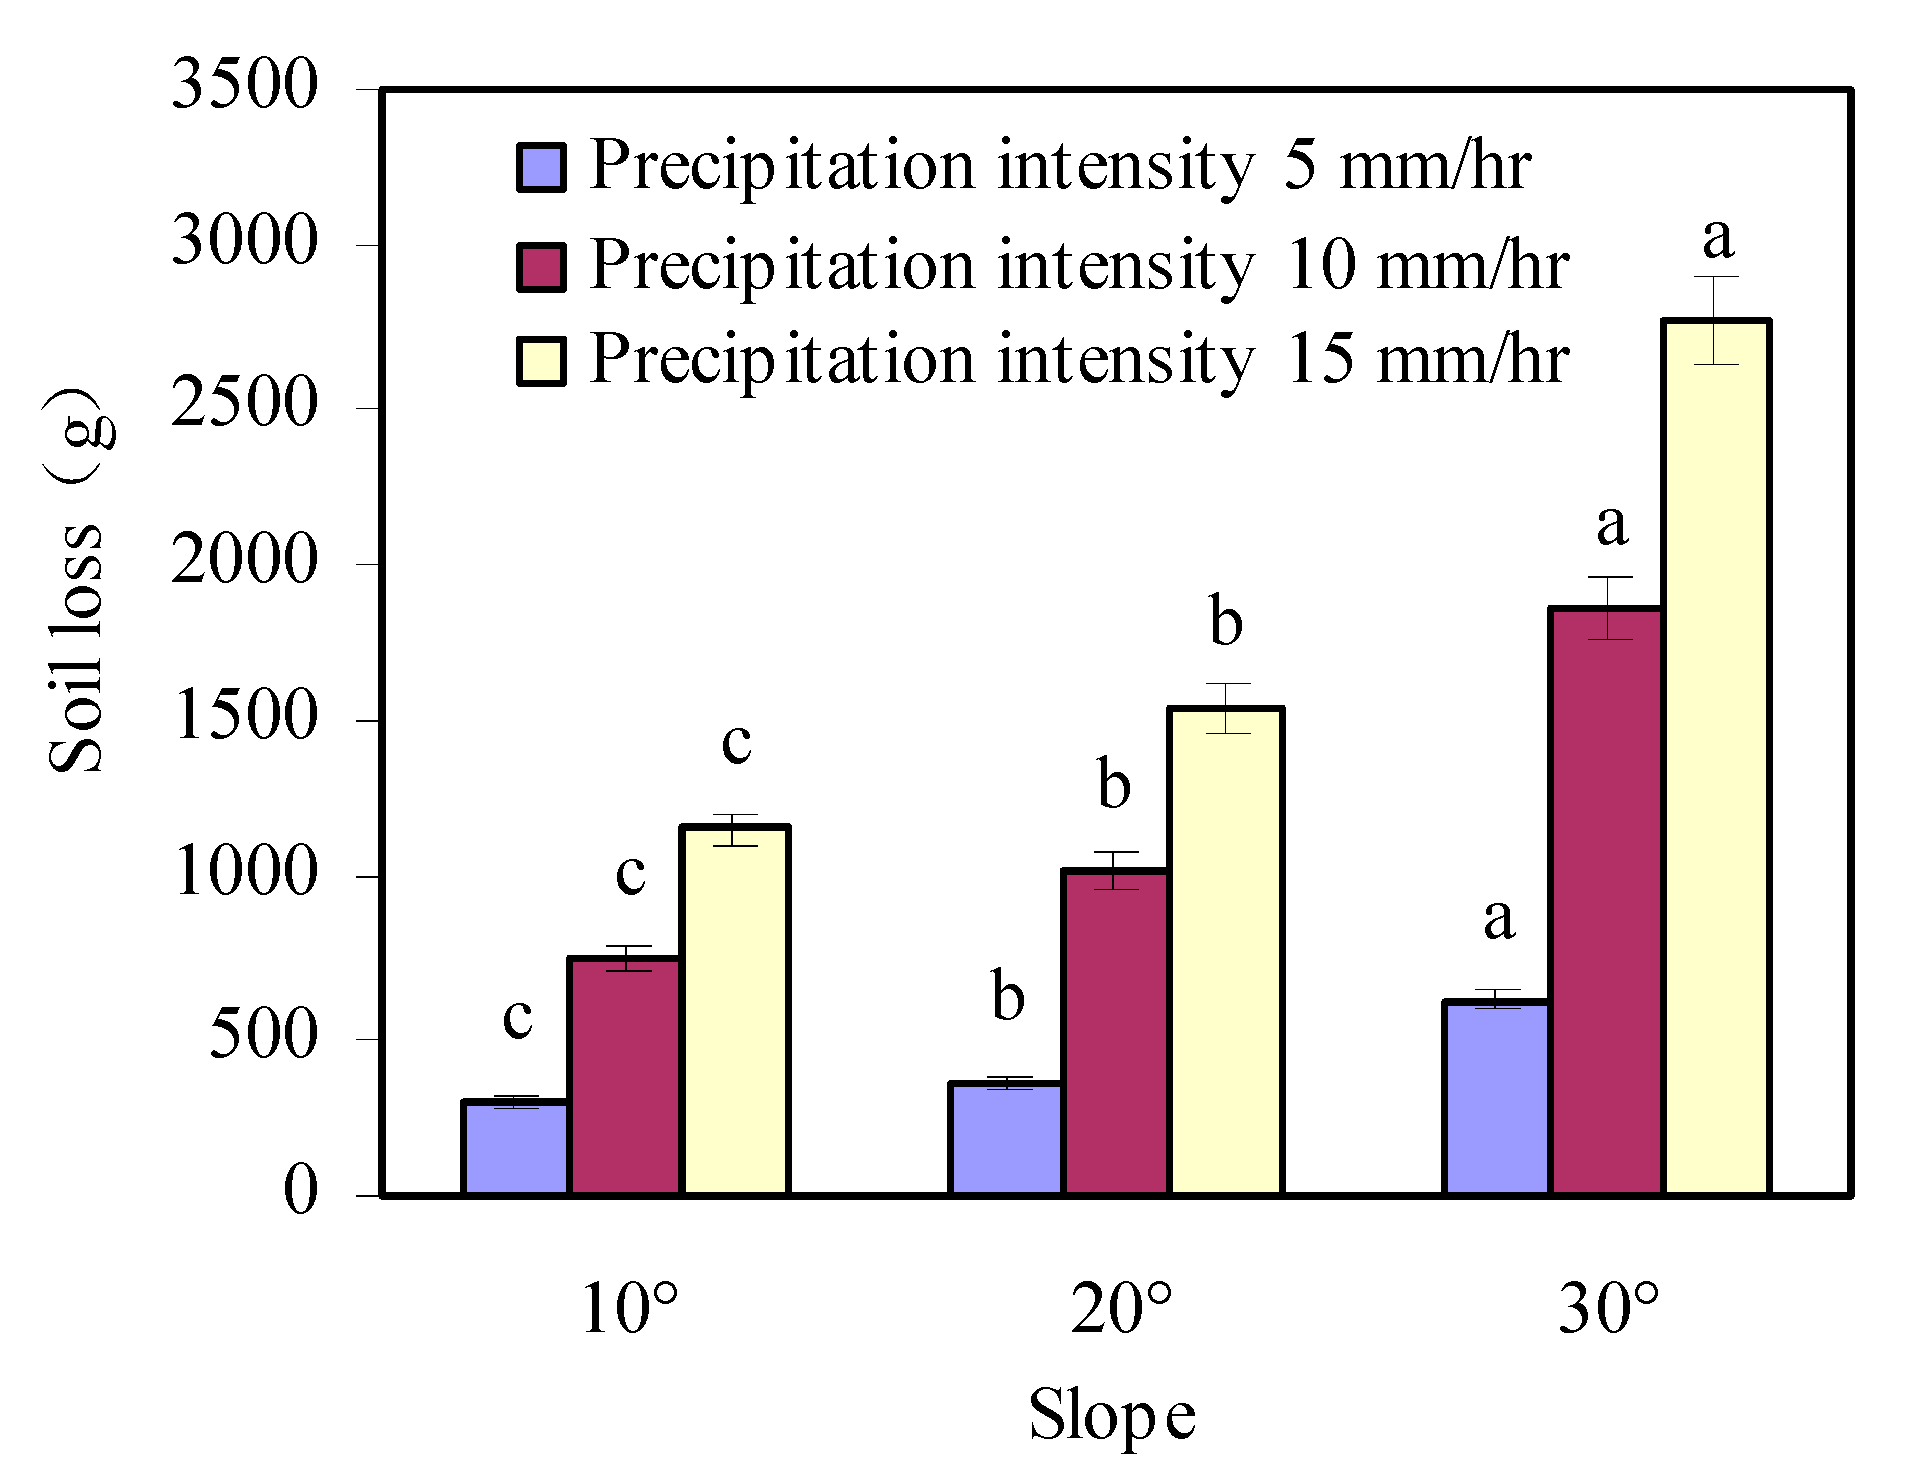
4.2. Impact of Surface Gradient and Precipitation Intensity
4.3. Loss of Soil Nutrients
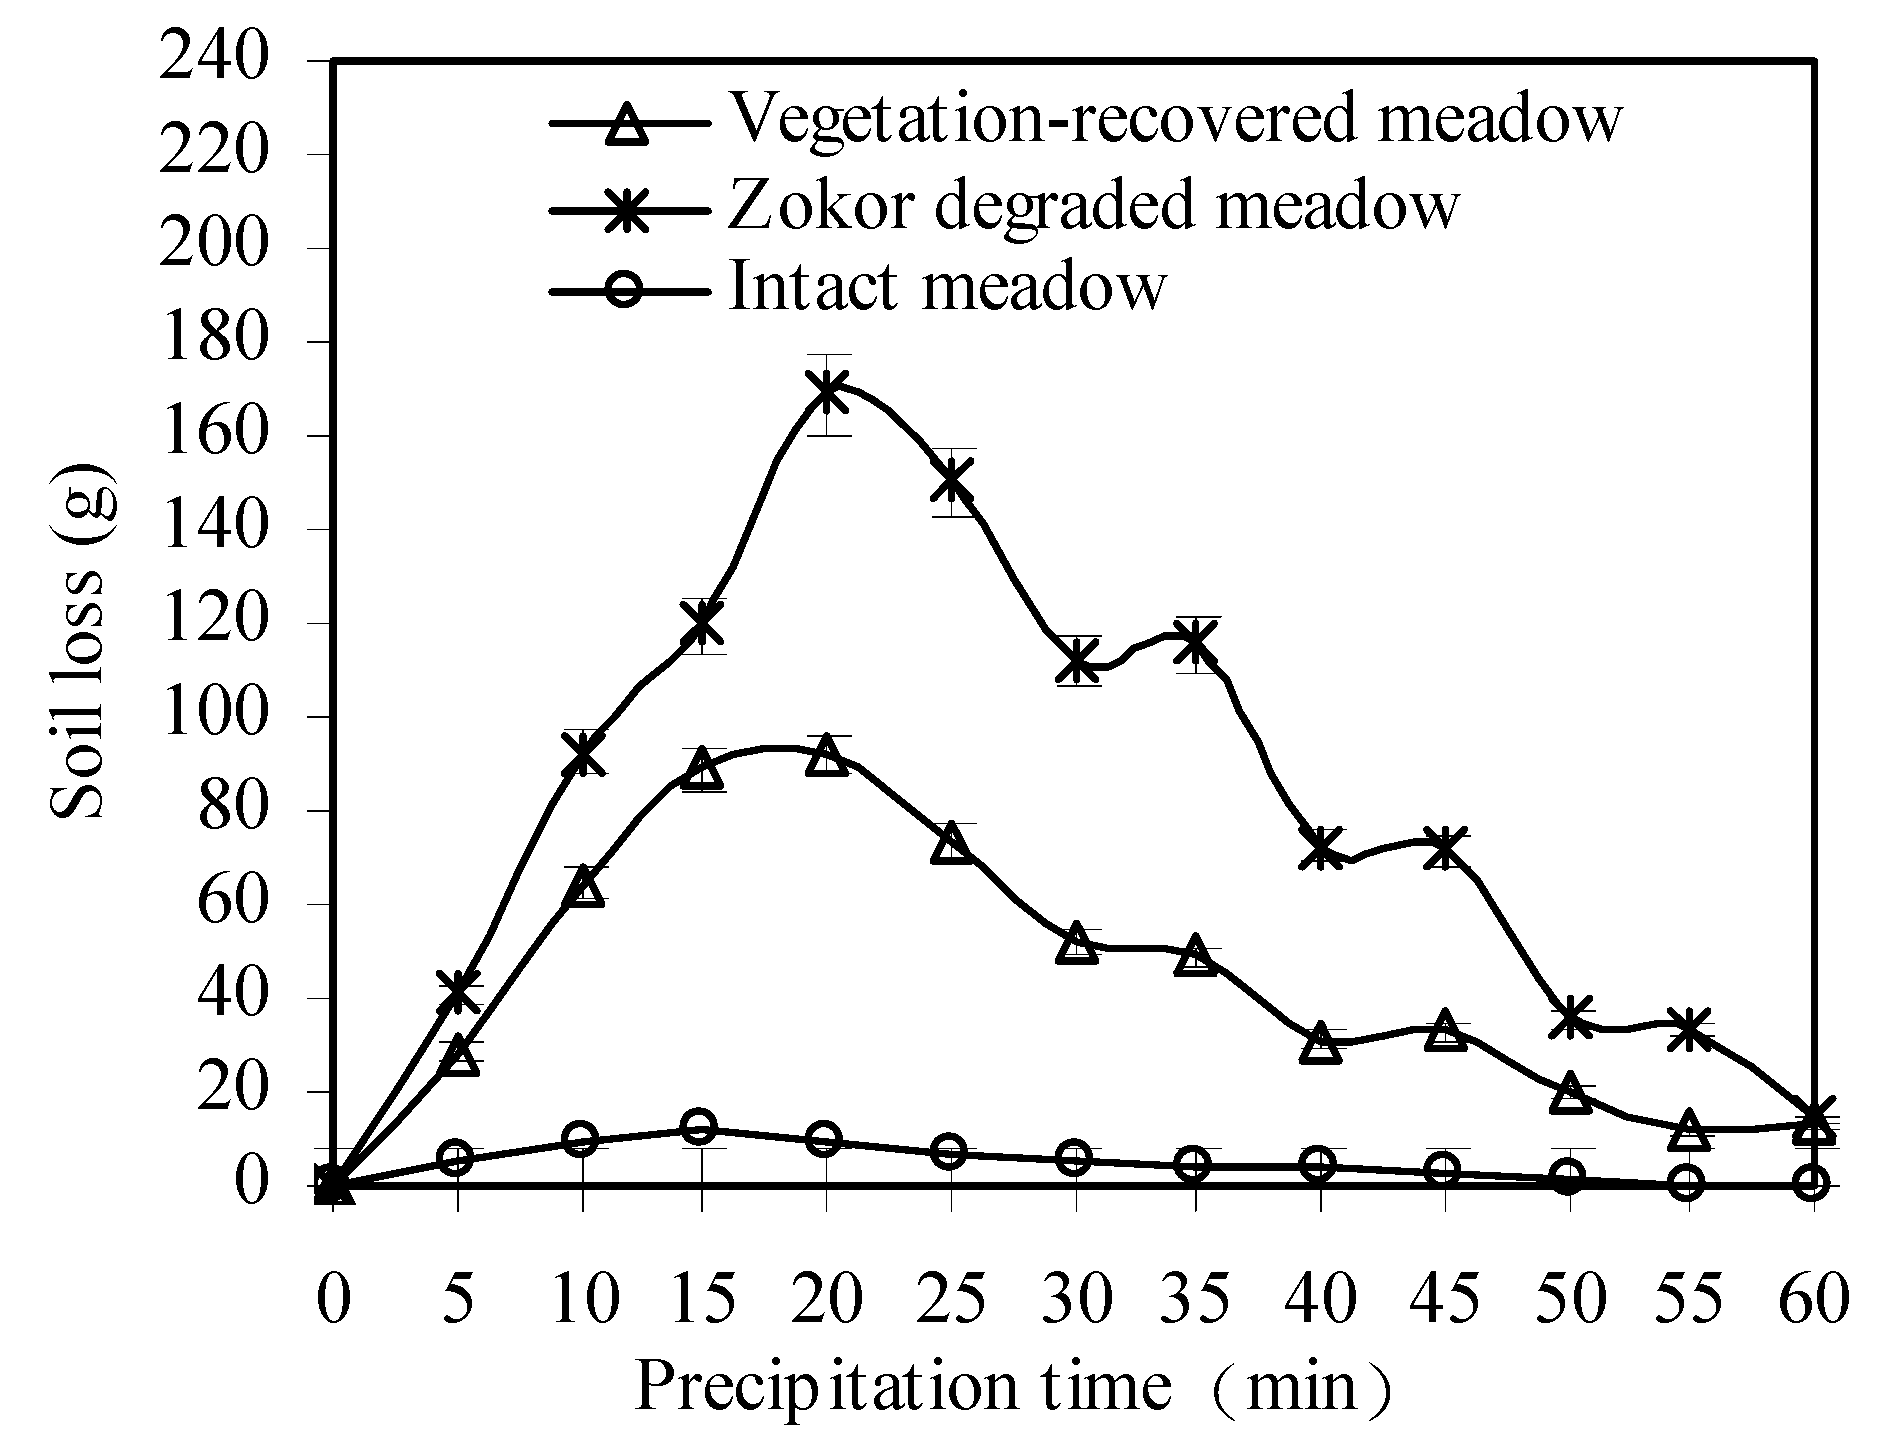
4.4. Contribution of Zokor Destruction to Soil Erosion
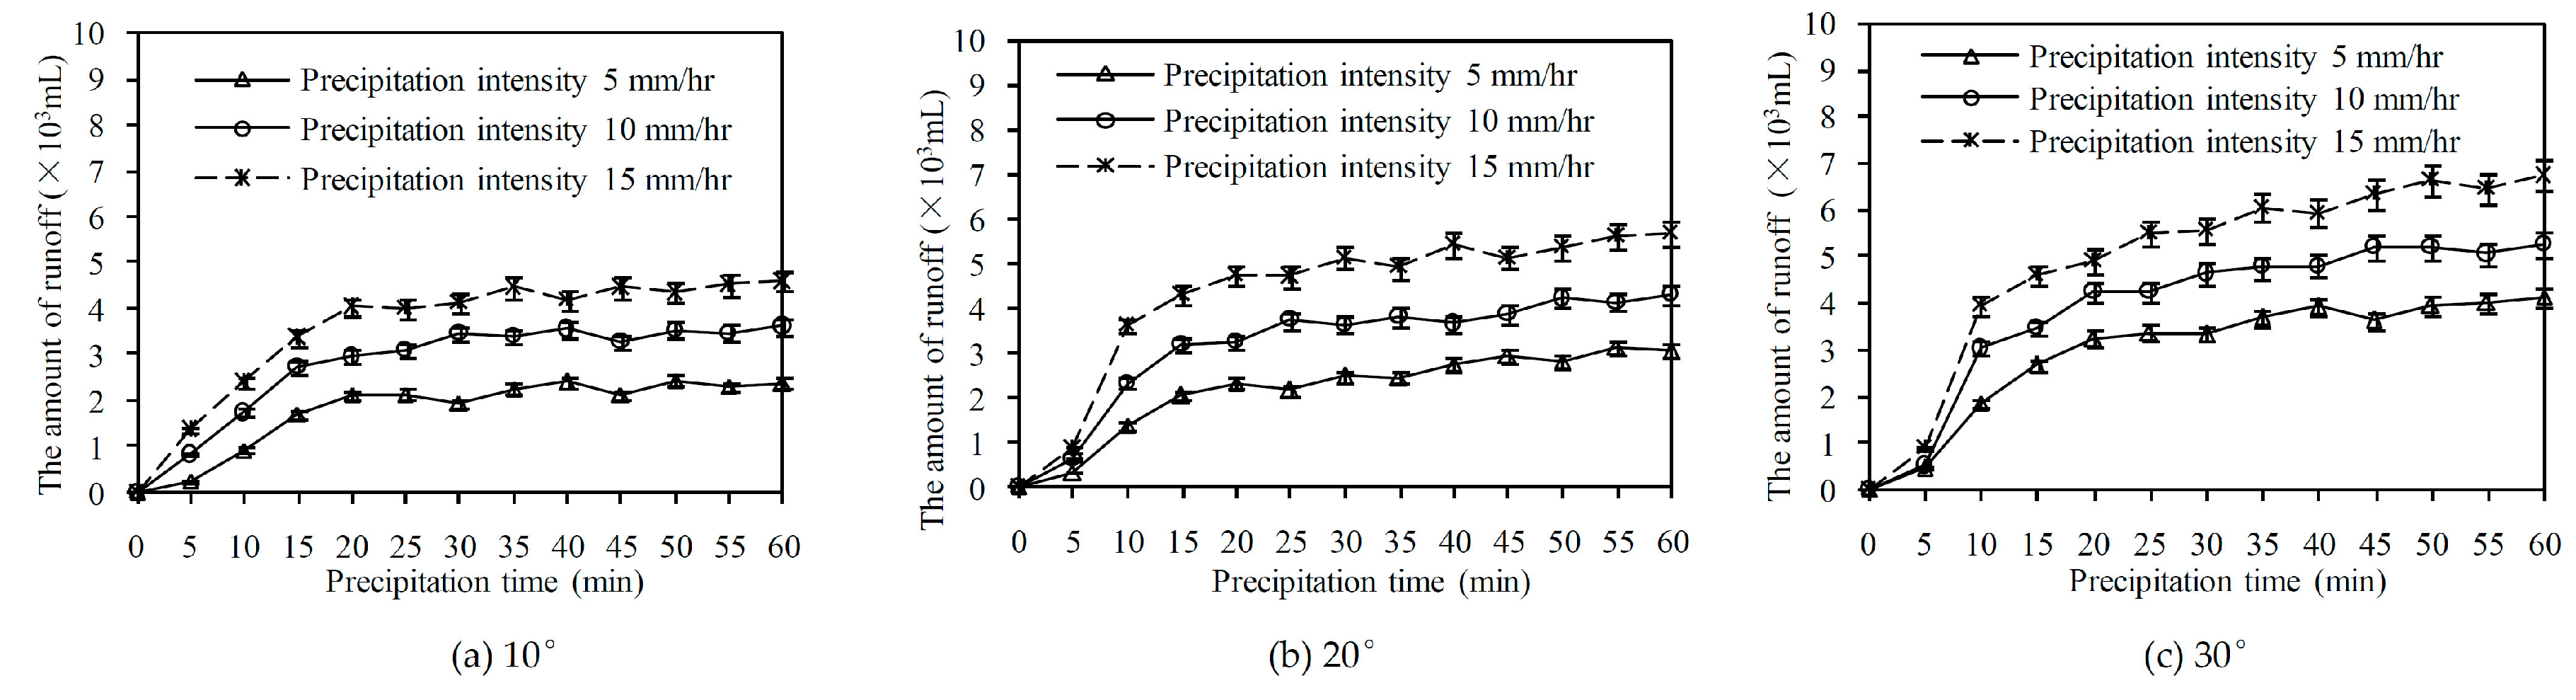
4.5. Soil Loss vs. Surface Runoff
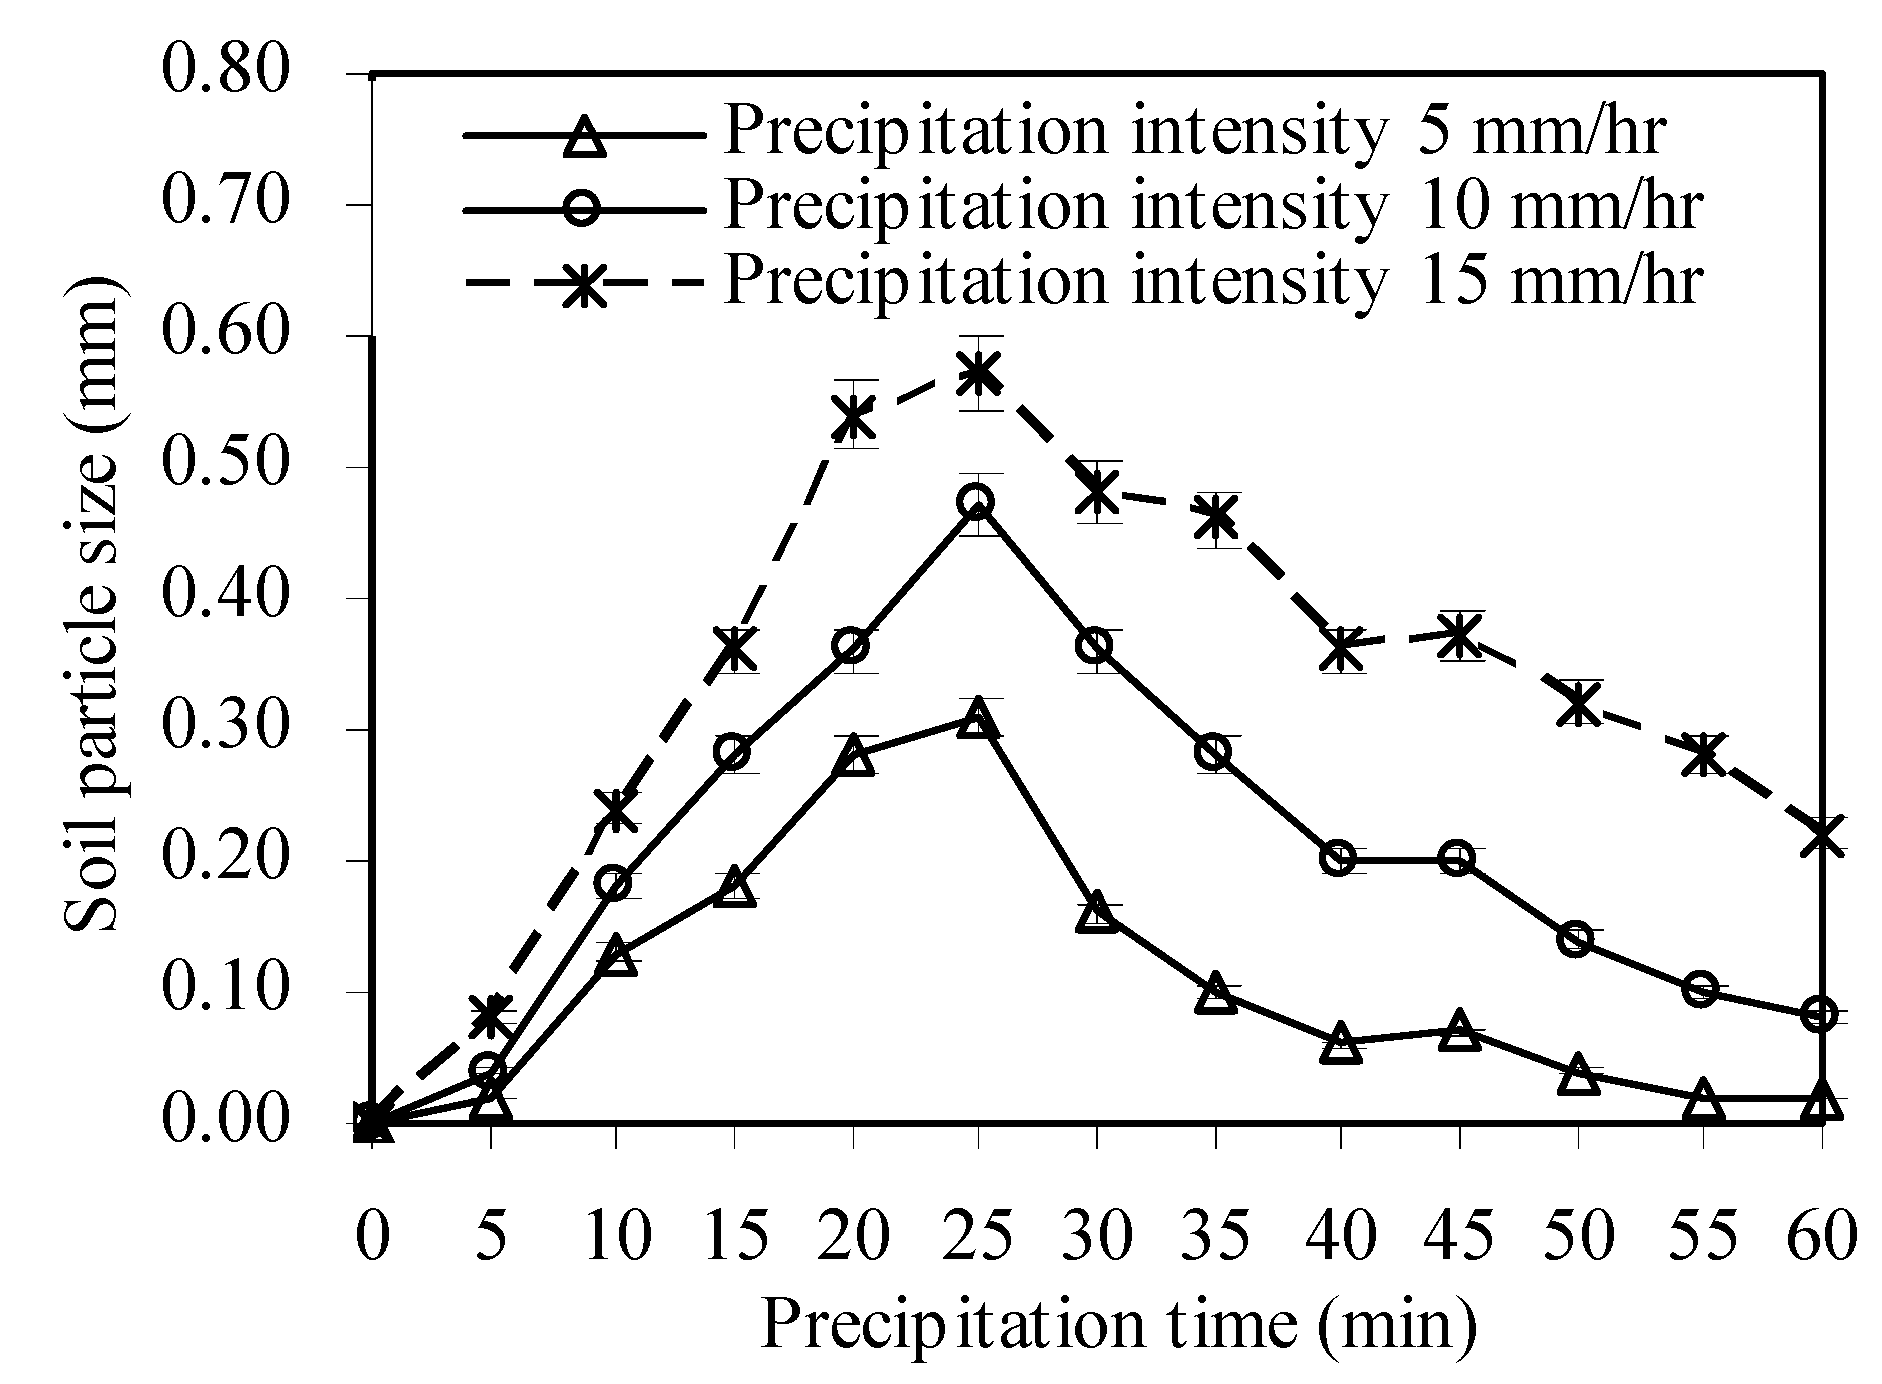
4.6. Soil loss vs. Particle Size
5. Discussion
5.1. Importance of Vegetation Cover
5.2. Comparison with Other Studies
5.3. Effects of Plateau Zokor on Soil Nutrients
5.4. Implications for Zokor Control and Soil Nutrients Restoration
6. Conclusions
Author Contributions
Funding
Acknowledgments
Conflicts of Interest
References
- Hu, G.Y.; Dong, Z.B.; Lu, J.F.; Yan, C.Z. Spatial and temporal changes of desertification land and its influence factors in source region of the Yellow River from 1975 to 2005. J. Desert Res. 2011, 31, 1079–1086. (In Chinese) [Google Scholar]
- Li, X.L.; Gao, J.; Brierley, G.J. Rangeland degradation on the Qinghai-Tibet Plateau: Implications for rehabilitation. Land Degrad. Dev. 2013, 24, 72–80. [Google Scholar] [CrossRef]
- Liu, Y.S.; Fan, J.W.; Shi, Z.J.; Yang, X.H.; Harris, W. Relationships between plateau pika (Ochotona curzoniae) densities and biomass and biodiversity indices of alpine meadow steppe on the Qinghai—Tibet Plateau China. Ecol. Eng. 2017, 102, 509–518. [Google Scholar] [CrossRef]
- Fan, J.W.; Shao, Q.Q.; Liu, J.Y.; Wang, J.B.; Harris, W.; Chen, Z.Q.; Zhong, H.P.; Xu, X.L.; Liu, R.G. Assessment of effects of climate change and grazing activity on grassland yield in the Three Rivers Headwaters Region of Qinghai–Tibet Plateau, China. Environ. Monit. Assess. 2010, 170, 571–584. [Google Scholar] [CrossRef] [PubMed]
- Yi, X.S.; Li, G.S.; Yin, Y.Y.; Wang, B.L. Preliminary study for the influences of grassland degradation on soil water retention in the source region of the Yellow River. J. Nat. Resour. 2012, 27, 1708–1719. (In Chinese) [Google Scholar]
- Brierlye, G.; Li, X.L. Editorial: Geomorphology and environmental management of the Yellow River source zone. J. Mt. Sci. 2013, 10, 628–631. [Google Scholar] [CrossRef]
- Wang, Q.J.; Shi, H.L.; Jing, Z.C.; Wang, C.T.; Wang, F.G. Recovery and benefit analysis of ecology on degraded natural grassland of the source region of Yangze and Yellow rivers. Pratacultural Sci. 2004, 21, 37–41, (In Chinese with English abstract). [Google Scholar]
- White, R.; Murray, S.; Rohweder, M. Pilot Analysis of Global Ecosystems: Grassland Ecosystems; World Resour. Institute: Washington, DC, USA, 2000; ISBN 1-56973-461-5. [Google Scholar]
- Pang, X.P.; Guo, Z.G. Plateau pika disturbances alter plant productivity and soil nutrients in alpine meadows of the Qinghai-Tibetan Plateau, China. Rangel. J. 2017, 39, 133–144. [Google Scholar] [CrossRef]
- Wu, R.X.; Chai, Q.; Zhang, J.Q.; Zhong, M.Y.; Liu, Y.H.; Wei, X.T.; Pan, D.; Shao, X.Q. Impacts of burrows and mounds formed by plateau rodents on plant species diversity on the Qinghai-Tibetan Plateau. Rangel. J. 2015, 37, 117–123. [Google Scholar] [CrossRef]
- Pech, R.P.; Jiebu Arthur, A.D.; Zhang, Y.M.; Lin, H. Population dynamics and responses to management of plateau pikas. Ochotona curzoniae. J. Appl. Ecol. 2007, 44, 615–624. [Google Scholar] [CrossRef]
- Sun, D.; Zheng, J.H.; Ma, T.; Chen, J.J.; Li, X. The analysis of burrows recognition accuracy in Xinjiang’s pasture area based on UAV visible images with different spatial resolution. Int. Arch. Photogramm. Remote Sens. Spat. Inf. Sci. 2018, 42, 1575–1579. [Google Scholar] [CrossRef]
- Chen, J.J.; Yi, S.H.; Qin, Y. The contribution of plateau pika disturbance and erosion on patchy alpine grassland soil on the Qinghai-Tibetan Plateau: Implications for grassland restoration. Geoderma 2017, 297, 1–9. [Google Scholar] [CrossRef]
- Zhou, L.Z.; Li, D.Q.; Wang, X.L.; Ma, Q. Sanjiangyuan Reserve’s rodent pests, their damage to frigid meadows and the control strategies. J. Anhui Univ. 2002, 26, 87–96, (In Chinese with English abstract). [Google Scholar]
- Ma, Y.; Lang, B.; Shi, D. Establishing pratacultural system: A strategy for rehabilitation of ‘black soil type’ deteriorated grassland on the Qinghai-Tibetan Plateau. In Formation and Evolution, Environment Changes and Sustainable Development on the Tibetan Plateau; Zheng, D., Zhu, L.P., Eds.; Academy Press: Beijing, China, 2000; pp. 334–339, (In Chinese with English abstract). [Google Scholar]
- Zhang, Y.M. Influence of Plateau Zokors (Eospalax fontanierii) on Alpine Meadows. In Subterranean Rodents; Springer: Berlin, Germany, 2007; pp. 301–308. [Google Scholar]
- Walker, L.R.; Vrooman, S.S.; Thompson, D.B. Rodent mounds facilitate shrubs and shrubs inhibit seedlings in the Mojave Desert, USA. J. Arid Environ. 2015, 113, 95–101. [Google Scholar] [CrossRef]
- Yu, C.; Zhang, J.; Pang, X.P.; Wang, Q.; Zhou, Y.P.; Guo, Z.G. Soil disturbance and disturbance intensity: Response of soil nutrient concentrations of alpine meadow to plateau pika bioturbation in the Qinghai-Tibetan Plateau, China. Geoderma 2017, 307, 98–106. [Google Scholar] [CrossRef]
- Yu, C.; Pang, X.P.; Wang, Q.; Jin, S.H.; Shu, C.C.; Guo, Z.G. Soil nutrient changes induced by the presence and intensity of plateau pika (Ochotona curzoniae) disturbances in the Qinghai-Tibet Plateau, China. Ecol. Eng. 2017, 106, 1–9. [Google Scholar] [CrossRef]
- Limbach, W.; Davis, J. The introduction of sustainable development practices of the Qinghai livestock development project. In Formation and Evolution, Environment Changes and Sustainable Development on the Tibetan Plateau; Zheng, D., Zhu, L.P., Eds.; Academy Press: Beijing, China, 2000; pp. 509–522. [Google Scholar]
- Zhou, H.K.; Zhao, X.Q.; Tang, Y.H.; Gu, S.; Zhou, L. Alpine grassland degradation and its control in the source region of the Yangtze and Yellow Rivers, China. Grassl. Sci. 2005, 51, 191–203. [Google Scholar] [CrossRef]
- Miehe, G.; Miehe, S.; Kaiser, K.; Liu, J.Q. Status and dynamics of the Kobresia pygmaea ecosystem on the Tibetan Plateau. AMBIO 2008, 37, 272–279. [Google Scholar] [CrossRef]
- Wu, H.L.; Liu, S.M. Ecological environment situation in the Yellow River Source Zone. Pratacultural Anim. Husb. 2011, 7, 42–43. (In Chinese) [Google Scholar]
- Erpul, G.; Gabriels, D.; Norton, L.D.; Flanagan, D.C.; Huang, C.H.; Visser, S.M. Mechanics of interrill erosion with wind-driven rain. Earth Surf. Process. Landf. 2013, 38, 160–168. [Google Scholar] [CrossRef]
- Meshesha, D.T.; Tsunekawa, A.; Tsubo, M.; Haregeweyn, N.; Adgo, E. Evaluation of kinetic energy and erosivity potential of simulated rainfall using Laser Precipitation Monitor. Catena 2016, 37, 237–243. [Google Scholar] [CrossRef]
- Wang, B.; Steiner, J.; Zheng, F.L.; Gowda, P.H. Impact of rainfall pattern on interrill erosion Process. Earth Surf. Process. Landf. 2017, 42, 1833–1846. [Google Scholar] [CrossRef]
- Nearing, M.A.; Simanton, J.R.; Darrell, N.L.; Bulygin, S.J.; Stone, J. Soil erosion by surface water flow on a stony, Semiarid hillslope. Earth Surf. Process. Landf. 1999, 24, 677–686. [Google Scholar] [CrossRef]
- Berger, C.; Schulze, M.; Rieke-Zapp, D.; Schlunegger, F. Rill development and soil erosion: A laboratory study of slope and rainfall intensity. Earth Surf. Process. Landf. 2010, 35, 1456–1467. [Google Scholar] [CrossRef]
- Palmer, R.C.; Smith, R.P. Soil structural degradation in SW England and its impact on surface-water runoff generation. Soil Use Manag. 2013, 29, 567–575. [Google Scholar] [CrossRef]
- Carollo, F.G.; Stefano, C.D.; Ferro, V.; Pampalone, V.; Sanzone, F. Testing a new sampler for measuring plot soil loss. Earth Surf. Process. Landf. 2016, 41, 867–874. [Google Scholar] [CrossRef]
- Zhao, L.S.; Huang, C.H.; Wu, F.Q. Effect of microrelief on water erosion and their changes during rainfall. Earth Surf. Process. Landf. 2016, 41, 579–586. [Google Scholar] [CrossRef]
- Aksoy, H.; Eris, E.; Tayfur, G. Empirical sediment transport models based on indoor rainfall simulation and erosion flume experimental data. Land Degrad. Dev. 2017, 28, 1320–1328. [Google Scholar] [CrossRef]
- Momm, H.G.; Wells, R.R.; Bennett, S.J. Disaggregating soil erosion processes within an evolving experimental landscape. Earth Surf. Process. Landf. 2018, 43, 543–552. [Google Scholar] [CrossRef]
- Fullen, M.A. A comparison of runoff and erosion rates on bare and grassed loamy sand soils. Soil Use Manag. 1991, 7, 136–139. [Google Scholar] [CrossRef]
- Morvan, X.; Naisse, C.; Issa, O.M.; Desprats, J.F.; Combaud, A.; Cerdan, O. Effect of ground-cover type on surface runoff and subsequent soil erosion in Champagne vineyards in France. Soil Use Manag. 2014, 30, 372–381. [Google Scholar] [CrossRef]
- Gessesse, B.; Bewket, W.; Bräuning, A. Model-based characterization and monitoring of runoff and soil erosion in response to land use/land cover changes in the Modjo Watershed, Ethiopia. Land Degrad. Dev. 2015, 26, 711–724. [Google Scholar] [CrossRef]
- Arthur, A.D.; Pech, R.P.; Jiebu, Z.Y.; Lin, H. Grassland degradation on the Tibetan Plateau: The role of small mammals and methods of control. Aust. Cent. Int. Agric. Res. Tech. Rep. 2007, 67, 1–35. [Google Scholar]
- Li, X.L.; Perry, G.L.W.; Brierley, G.; Gao, J.; Zhang, J.; Yang, Y.W. Restoration prospects for Heitutan degraded grassland in the Sanjiangyuan. J. Mt. Sci. 2013, 10, 687–698. [Google Scholar] [CrossRef] [Green Version]
- Auerswald, K.; Fiener, P.; Dikau, R. Rates of sheet and rill erosion in Germany—Ameta—Analysis. Geomorphology 2009, 111, 182–193. [Google Scholar] [CrossRef]
- Wirtz, S.; Seeger, M.; Ries, J.B. Field experiments for understanding and quantification of rill erosion processes. Catena 2012, 91, 21–34. [Google Scholar] [CrossRef]
- Zhou, X.R.; Guo, X.G.; Guo, X.H. The role of plateau pika and plateall zokor in alpine meadow. Pratacultural Sci. 2010, 27, 38–44. (In Chinese) [Google Scholar]
- Liu, Y.S.; Fan, J.W.; Harris, W.; Shao, Q.Q.; Zhou, Y.C.; Wang, N.; Li, Y.Z. Effects of plateau pika (Ochotona curzoniae) on net ecosystem carbon exchange of grassland in the Three Rivers Headwaters region, Qinghai-Tibet, China. Plant Soil 2013, 366, 491–504. [Google Scholar] [CrossRef]
- Sun, F.D.; Long, R.J.; Guo, Z.G.; Liu, W.; Gan, Y.M.; Chen, W.Y. Effects of rodents activities on plant community and soil environment in alpine meadow. Pratacultural Sci. 2011, 28, 146–151. (In Chinese) [Google Scholar]
- Wang, T.C.; Xiong, Y.C.; Ge, J.P.; Wang, S.M.; Li, Y.T.; Yue, D.X.; Wang, T.M.; Wang, G. Four-year dynamic of vegetation on mounds created by zokors (Myospalax baileyi) in a subalpine meadow of the Qinghai-Tibet Plateau. J. Arid Environ. 2008, 72, 84–96. [Google Scholar] [CrossRef]
- Harris, R.B. Rangeland degradation on the Qinghai-Tibetan Plateau: A review of the evidence of its magnitude and causes. J. Arid Environ. 2010, 74, 1–12. [Google Scholar] [CrossRef]
- Zhang, W.H.; Miao, Y.J.; Zhao, Y.H.; Wang, X.T.; Xu, Y.M.; Wei, X.H.; Sun, L. Effects of plateau pika (Ochotona curzoniae) on alpine meadow in Tibet. Acta Prataculturae Sin. 2018, 27, 115–122. (In Chinese) [Google Scholar]
- Bao, S.D. Soil and Agricultural Chemistry Analysis; China Agricultural Press: Beijing, China, 2000; ISBN 9787109066441. (In Chinese) [Google Scholar]
- Pan, C.Z.; Shangguan, Z.P. Runoff hydraulic characteristics and sediment generation in sloped grassplots under simulated rainfall conditions. J. Hydrol. 2006, 331, 178–185. [Google Scholar] [CrossRef]
- Fullen, M.A.; Booth, C.A. Grass ley set-aside and soil organic matter dynamics on sandy soils in Shropshire, UK. Earth Surf. Process. Landf. 2006, 31, 570–578. [Google Scholar] [CrossRef]
- Wang, D.D.; Wang, Z.L.; Zhang, Q.W.; Zhang, Q.L.; Tian, N.L.; Liu, J.E. Sheet erosion rates and erosion control on steep rangelands in loess regions. Earth Surf. Process. Landf. 2018, 43, 2926–2934. [Google Scholar] [CrossRef]
- Zhao, X.N.; Wu, P.T.; Chen, X.L.; Helmers, M.J.; Zhou, X.B. Runoff and sediment yield under simulated rainfall on hillslopes in the Loess Plateau of China. Soil Res. 2013, 51, 50–58. [Google Scholar] [CrossRef]
- Zheng, F.L.; Merrill, S.D.; Huang, C.H.; Tanaka, D.L.; Darboux, F.; Liebig, M.A.; Halvorson, A.D. Runoff, soil erosion, and erodibility of conservation reserve program land under crop and hay production. Soil Sci. Soc. Am. J. 2004, 68, 1332–1341. [Google Scholar] [CrossRef]
- Fang, H.Y.; Sun, L.Y.; Tang, Z.H. Effects of rainfall and slope on runoff, soil erosion and rill development: An experimental study using two loess soils. Hydrol. Process. 2015, 29, 2649–2658. [Google Scholar] [CrossRef]
- Bessler, H.; Temperton, V.M.; Roscher, C.; Buchmann, N.; Schmid, B.; Schulze, E.D.; Weisser, W.W.; Engels, C. Aboveground overyielding in grassland mixtures is associated with reduced biomass partitioning to belowground organs. Ecology 2009, 90, 1520–1530. [Google Scholar] [CrossRef] [Green Version]
- Wu, W.Z.; Zhou, Q.; Yu, B.; Ma, C. Characteristics of soil erosion in Three Rivers’ sources natural reserve. J. Mt. Sci. 2009, 27, 683–687. [Google Scholar] [CrossRef]
- Wang, Q.L.; Wang, C.T.; Liu, W.; Cao, G.M.; Long, R.J. Changes in plant communities and soil microbial physiological groups of artificial grasslands established for different years in headwater region of Yangtze River and Yellow River. Chin. J. Appl. Ecol. 2009, 20, 2646–2651. (In Chinese) [Google Scholar]
- Li, G.R.; Li, X.L.; Chen, W.T.; Li, J.F.; Zhu, H.L.; Zhong, L.Z. Influences of rain erosion on soil nutrient contents of the deteriorated grassland. Res. Soil Water Conserv. 2018, 25, 40–45. (In Chinese) [Google Scholar]
- Ruiz-Jaen, M.C.; Aide, T.M. Restoration success: How is it being measured. Restor. Ecol. 2005, 13, 569–577. [Google Scholar] [CrossRef]


| Precipitation Intensity (mm h−1) | Precipitation Type | Number of Samples (n) | Raindrop Diameter (mm) | Impact Intensity on the Soil Surface (Pa) |
|---|---|---|---|---|
| 5 | Natural rainfall | 30 | 3.48 ± 0.26 | 0.46 ± 0.08 |
| Simulated rainfall | 30 | 3.46 ± 0.22 | 0.47 ± 0.12 | |
| 10 | Natural rainfall | 30 | 3.52 ± 0.24 | 1.01 ± 0.16 |
| Simulated rainfall | 30 | 3.48 ± 0.32 | 0.98 ± 0.08 | |
| 15 | Natural rainfall | 30 | 3.56 ± 0.36 | 1.79 ± 0.10 |
| Simulated rainfall | 30 | 3.52 ± 0.28 | 1.81 ± 0.14 |
| Slope | Precipitation Intensity (mm h−1) | Total N (g) | Total P (g) | Total K (g) | Alkali-hydrolyzed N (g) | Available P (mg) | Available K (g) | Organic matter (g) |
|---|---|---|---|---|---|---|---|---|
| 10° | 5 | 1.94 ± 0.28 | 0.85 ± 0.16 | 10.33 ± 0.56 | 0.28 ± 0.08 | 2.91 ± 0.34 | 0.071 ± 0.01 | 32.57 ± 2.34 |
| 10 | 3.54 ± 0.36 | 1.47 ± 0.14 | 19.08 ± 1.65 | 0.31 ± 0.14 | 5.77 ± 0.36 | 0.109 ± 0.05 | 58.56 ± 5.52 | |
| 15 | 5.70 ± 0.32 | 2.38 ± 0.22 | 30.77 ± 2.87 | 0.50 ± 0.22 | 9.33 ± 0.45 | 0.177 ± 0.04 | 94.47 ± 6.22 | |
| 20° | 5 | 2.45 ± 0.35 | 1.02 ± 0.16 | 13.22 ± 1.44 | 0.37 ± 0.10 | 3.91 ± 0.27 | 0.077 ± 0.02 | 40.59 ± 7.65 |
| 10 | 4.59 ± 0.42 | 1.91 ± 0.28 | 24.75 ± 2.56 | 0.40 ± 0.12 | 7.46 ± 0.52 | 0.141 ± 0.01 | 75.98 ± 7.84 | |
| 15 | 7.65 ± 0.38 | 3.19 ± 0.34 | 41.27 ± 5.24 | 0.66 ± 0.18 | 12.47 ± 0.56 | 0.237 ± 0.03 | 126.90 ± 12.54 | |
| 30° | 5 | 3.56 ± 0.41 | 1.52 ± 0.36 | 17.82 ± 2.58 | 0.35 ± 0.12 | 5.32 ± 0.44 | 0.125 ± 0.05 | 57.02 ± 5.26 |
| 10 | 6.21 ± 0.46 | 2.59 ± 0.42 | 33.48 ± 2.43 | 0.64 ± 0.16 | 10.07 ± 0.62 | 0.212 ± 0.07 | 102.80 ± 9.56 | |
| 15 | 11.02 ± 0.54 | 4.58 ± 0.48 | 59.42 ± 4.35 | 0.96 ± 0.22 | 18.06 ± 1.28 | 0.341 ± 0.08 | 182.44 ± 10.36 |
© 2019 by the authors. Licensee MDPI, Basel, Switzerland. This article is an open access article distributed under the terms and conditions of the Creative Commons Attribution (CC BY) license (http://creativecommons.org/licenses/by/4.0/).
Share and Cite
Li, G.; Li, X.; Li, J.; Chen, W.; Zhu, H.; Zhao, J.; Hu, X. Influences of Plateau Zokor Burrowing on Soil Erosion and Nutrient Loss in Alpine Meadows in the Yellow River Source Zone of West China. Water 2019, 11, 2258. https://doi.org/10.3390/w11112258
Li G, Li X, Li J, Chen W, Zhu H, Zhao J, Hu X. Influences of Plateau Zokor Burrowing on Soil Erosion and Nutrient Loss in Alpine Meadows in the Yellow River Source Zone of West China. Water. 2019; 11(11):2258. https://doi.org/10.3390/w11112258
Chicago/Turabian StyleLi, Guorong, Xilai Li, Jinfang Li, Wenting Chen, Haili Zhu, Jianyun Zhao, and Xiasong Hu. 2019. "Influences of Plateau Zokor Burrowing on Soil Erosion and Nutrient Loss in Alpine Meadows in the Yellow River Source Zone of West China" Water 11, no. 11: 2258. https://doi.org/10.3390/w11112258