Snow-Cover Area and Runoff Variation under Climate Change in the West Kunlun Mountains


1
State Key Laboratory of Desert and Oasis Ecology, Xinjiang Institute of Ecology and Geography, Chinese Academy of Sciences, Urumqi 830011, China
2
University of Chinese Academy of Sciences, Beijing 100049, China
3
School of Geographic Sciences, Xinyang Normal University, Xinyang 464000, China
4
School of Geographical Sciences, Nanjing University of Information Science and Technology, Nanjing 210044, China
5
Institute of Agricultural and Forest Environment, Polish Academy of Sciences, 61819 Poznan, Poland
*
Authors to whom correspondence should be addressed.
Water 2019, 11(11), 2246; https://doi.org/10.3390/w11112246
Submission received: 27 July 2019
/
Revised: 24 October 2019
/
Accepted: 24 October 2019
/
Published: 26 October 2019
(This article belongs to the Section Hydrology)
Abstract
:In recent years, the climate in the arid region of Northwest China has become warmer and wetter; however, glaciers in the north slope of the West Kunlun Mountains (NSWKM) show no obvious recession, and river flow is decreasing or stable. This contrasts with the prevalent response of glaciers to climate change, which is recession and initial increase in glacier discharge followed by decline as retreat continues. We comparatively analyzed multi-timescale variation in temperature–precipitation–snow cover-runoff in the Yarkant River Basin (YRK), Karakax River Basin (KRK), Yurungkax River Basin (YUK), and Keriya River Basin (KRY) in the NSWKM. The Mann–Kendall trend and the mutation–detection method were applied to data obtained from an observation station over the last 60 years (1957–2017) and MODIS snow data (2001–2016). NSWKM temperature and precipitation have continued to increase for nearly 60 years at a mean rate of 0.26 °C/decade and 5.50 mm/decade, respectively, with the most obvious trend (R2 > 0.82) attributed to the KRK and YUK. Regarding changes in the average snow-cover fraction (SCF): YUK (SCF = 44.14%) > YRK (SCF = 38.73%) > KRY (SCF = 33.42%) > KRK (SCF = 33.40%). Between them, the YRK and YUK had decreasing SCA values (slope < −15.39), while the KRK and KRY had increasing SCA values (slope > 1.87). In seasonal variation, the SCF of the three of the basins reaches the maximum value in spring, with the most significant performance in YUK (SCF = 26.4%), except for YRK where SCF in spring was lower than that in winter (−2.6%). The runoff depth of all river basins presented an increasing trend, with the greatest value appearing in the YRK (5.78 mm/decade), and the least value in the YUK (1.58 mm/decade). With the runoff response to climate change, temperature was the main influencing factor of annual and monthly (summer) runoff variations in the YRK, which is consistent with the runoff-generation rule of rivers in arid areas, which mainly rely on ice and snow melt for water supply. However, this rule was not consistent for the YUK and KRK, as it was disturbed by other factors (e.g., slope and slope direction) during runoff generation, resulting in disruptions of their relationship with runoff. This research promotes the study of the response of cold and arid alpine regions to global change and thus better serve regional water resources management.

1. Introduction
The water cycle of a basin is affected by regional climate, topography, and human activities [1,2,3,4]. Global warming has accelerated the regional water cycle and has changed the rainfall–runoff process in mountainous areas, resulting in changes in runoff recharge from glacier meltwater and precipitation [5]. For extremely arid areas with sparse precipitation, meltwater is the main recharging source of rivers [6,7,8]. Water from the accelerated melting of snow and ice caused by climate warming can contribute to runoff in a certain period of time, which leads to an increase in runoff [6,9]. However, continued warming also accelerates snow covered area and glacier area loss, leading to changes in runoff processes and water resources [10,11].
In the context of global warming [12], temperature in the Tibetan Plateau (TP) is rising at a rate of 0.28 °C/decade, which leads to permafrost degradation, widespread glacial retreat, intensified snow melting, frequent occurrence of glacial-lake disasters, and the associated deterioration of the ecological environment, so this area can be regarded as sensitive to global climate change [13,14]. As the main glacier distribution area of the TP [15], the North Slope of the West Kunlun Mountains (NSWKM) comprises the Yarkant River Basin (YRK), Karakax River Basin (KRK), Yurungkax River Basin (YUK), and Keriya River Basin (KRY). Between them, the rivers Yarkant, Karakax and Yurungkax are the major tributaries of the longest continental river in China, the Tarim River (TR), and discharge mainly comes from the meltwater of glaciers and seasonal snow in the NSWKM [6,16]. Recent studies have shown that the glacier area of the TR Basin decreased by 3.3% from 1960 to 2000, but different sub-basins had very different decreases in glacier area, ranging from 0.7% to 7.9% [17]. Theoretically, more glacier mass loss is typically associated with more increased stream discharge, which is mainly contributed by glacier meltwater, but the phenomenon that regional runoff changes are not proportional to glacier melt occurs in parts of the Himalayan region [18]. Despite the vital importance of meltwater for water-resource management in these basins, little is known about the hydrological roles of snowmelt runoff under the changing climate [19]. Therefore, it is necessary to accurately understand the controlling factors for flow variability in the past several decades for both practical and scientific needs.
Currently, many studies on spatial- and temporal-variation characteristics, such as the average snow-cover area (SCA) [20,21,22], snow depth [23,24,25], and snow-cover days [26,27], have been carried out in various basins. With the development of remote-sensing technology, snow-cover data have also been developed from site-scale to remote-sensing products on the basis of Landsat, SPOT, and MODIS. From them, MODIS snow products are the most widely used [28]. However, these studies mostly focus on the investigation of snow cover in wet areas and rarely include systematic analysis and quantification of the relationship between alpine snow cover, climate, and runoff in arid areas. In a study of the variation of snow cover and runoff in the West Kunlun Mountains, Yasuda and Furuya [29] found that the annual average of SCA in the YUK increased by 1.4 km2 from 1970 to 1989. However, it decreased by 3.5 km2 from 1989 to 2001. Gardelle et al. [30] found that some basins of the Kunlun Mountains had significantly different SCA values, and most of them had increasing SCA values. With the intensification of global warming, the climate in most parts of arid areas of Northwest China, especially in Xinjiang, is projected to change toward a warmer–wetter state [31,32,33], and runoff is projected to increase significantly in most rivers [31]. However, some basins (such as the YUK and KRK) of the NSWKM experience no significant change in runoff, or may even experience a decreasing trend [32,34]. The difference in snow cover and runoff change in the NSWKM has received much attention by researchers [30,35,36,37,38,39]. In addition, the YRK, YUK, KRK, and KRY sit on the western frontier of China and border Pakistan and India. Historically, however, the allocation of water resources of the Upper Indus River Basin (UIB) is one of the problems leading to intense conflict between India and Pakistan [40,41]. Therefore, the study of the impact of climate change on runoff and snow cover in this region can aide in the regional planning and management of water resources.
The objectives of this study are to (1) improve our understanding of the variation characteristics of the NSWKM climate, (2) quantitatively assess runoff dynamics and snow-cover variation at different altitudes and seasons, and (3) analyze the rule of runoff generation and investigate the controlling factors for runoff changes in the NSWKM under climate change. This research will promote the study of the response of cold and arid alpine regions to global change and thus better serve regional water resources management.
2. Materials and Methods
2.1. Study Area
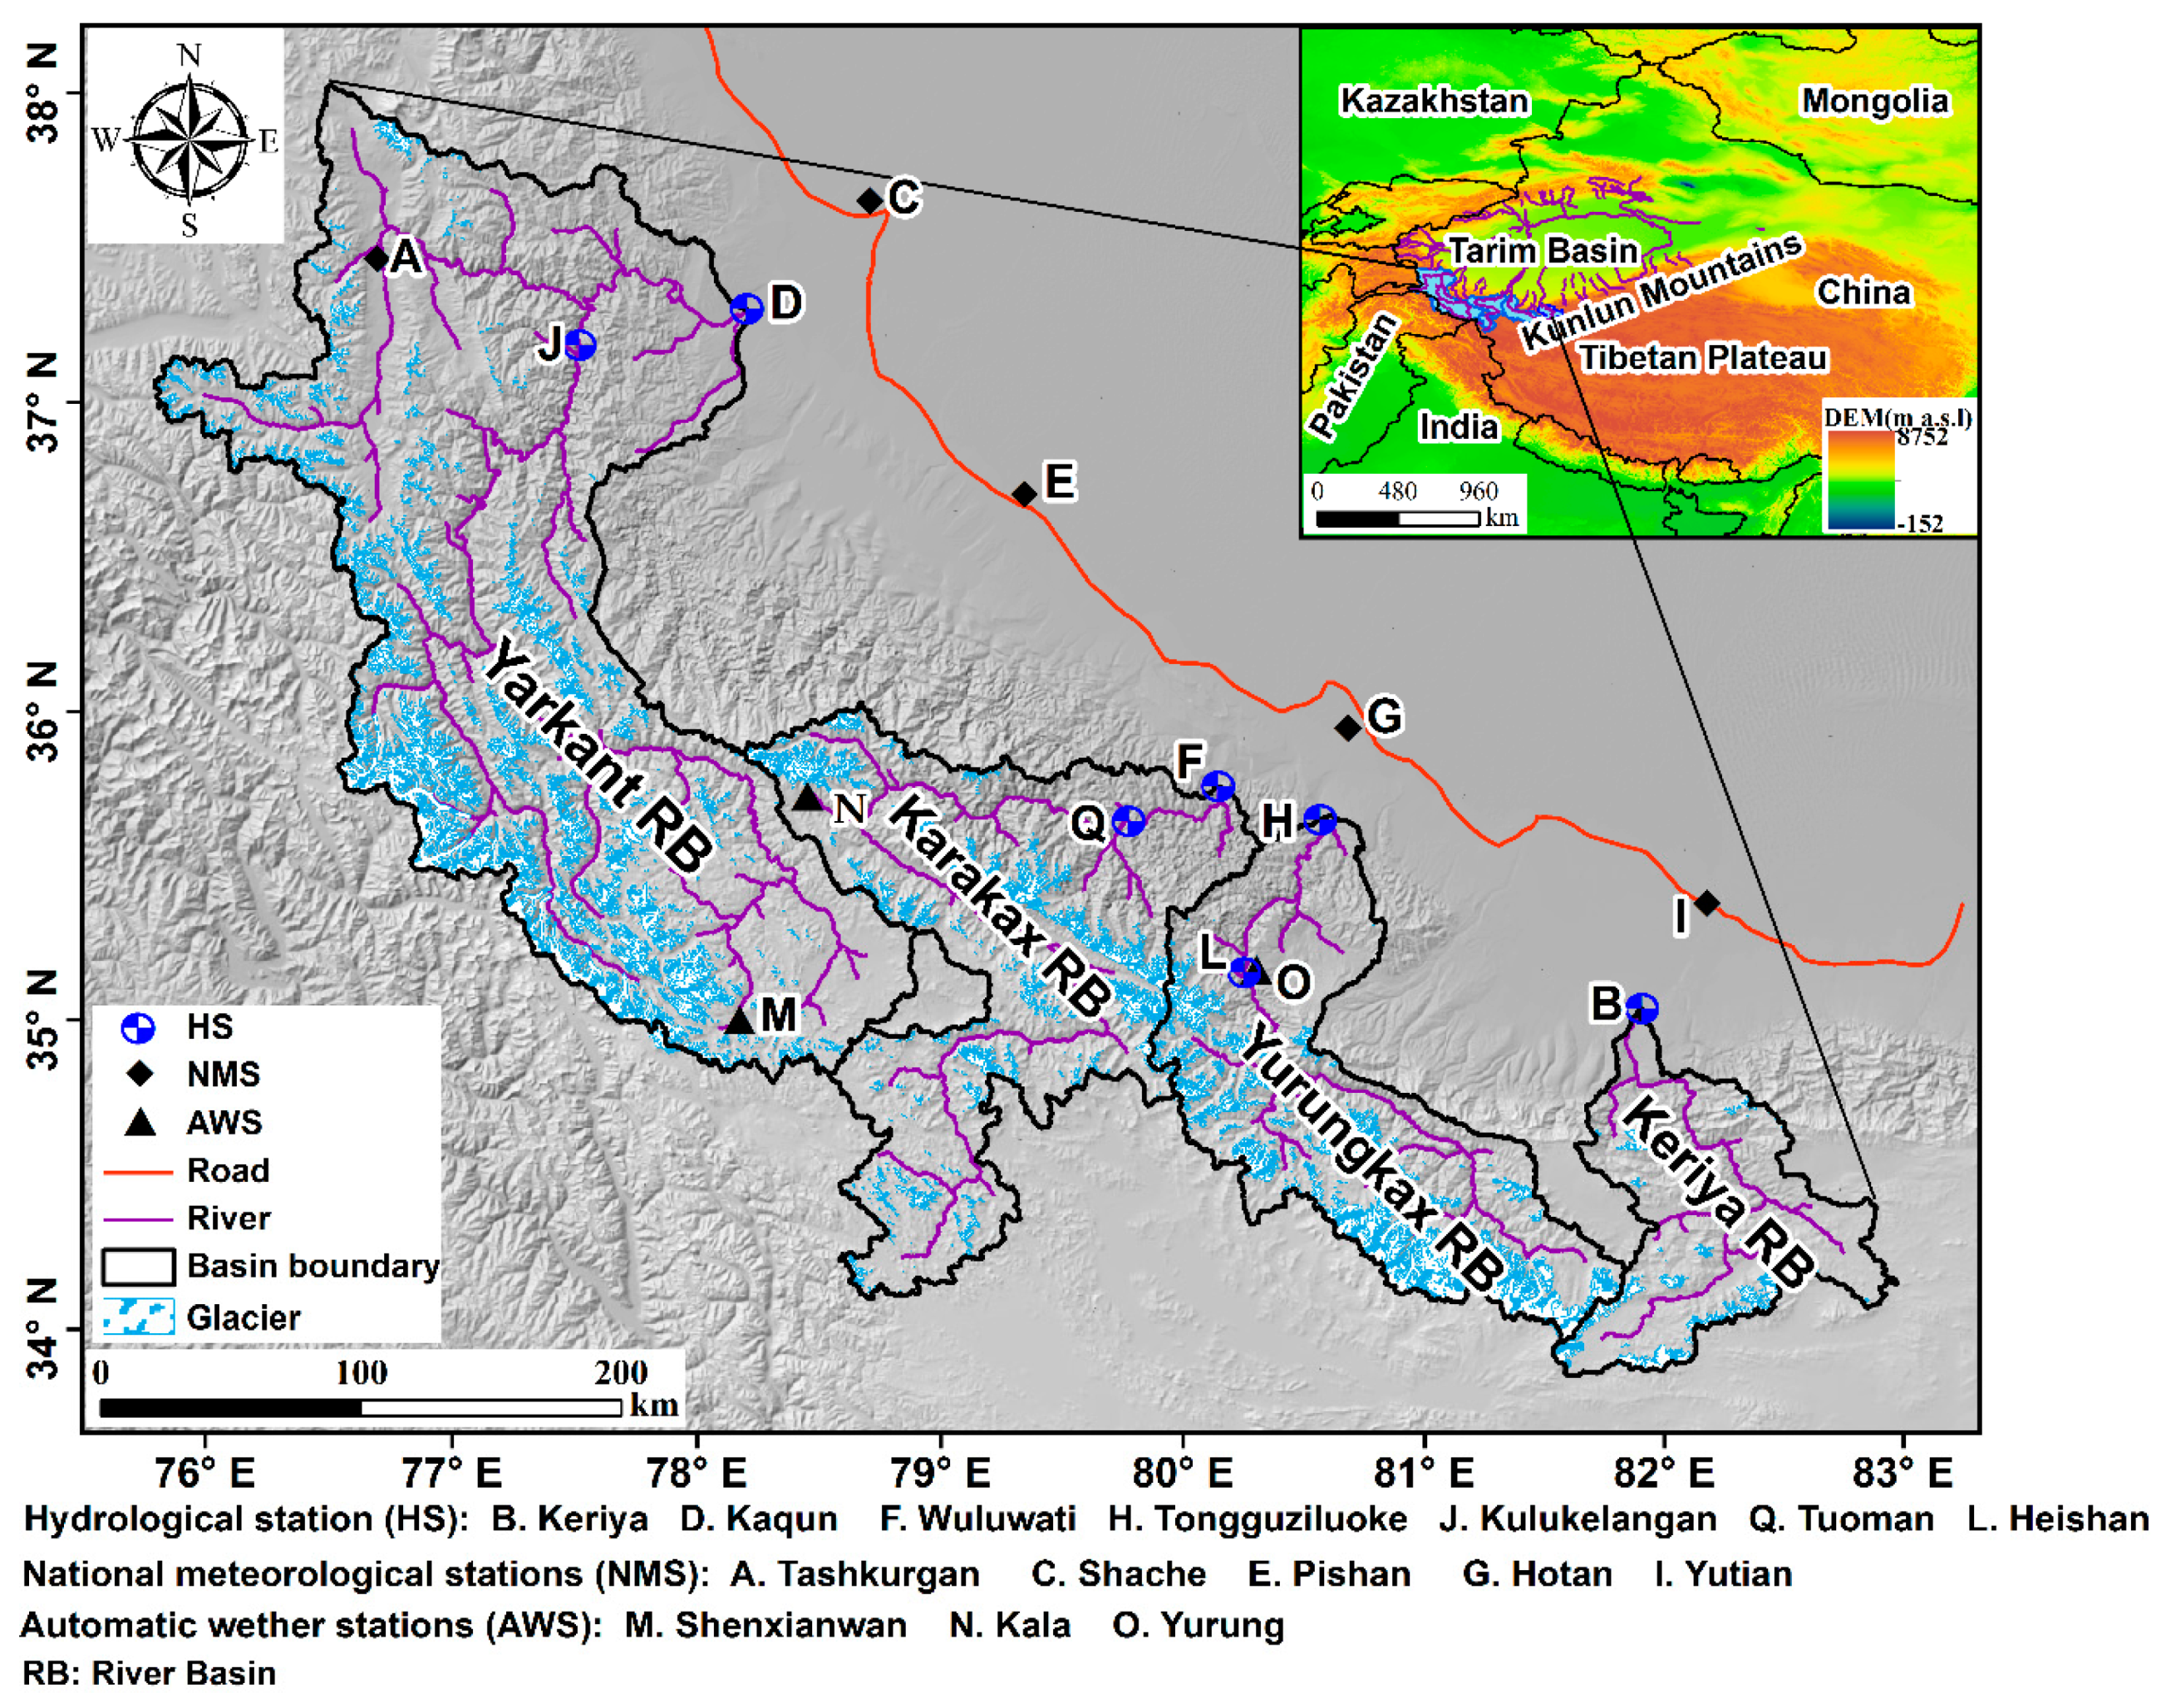
Located in the southwestern margin of the TR Basin, the northern slope (74°20′–83° E, 34°30′–38°30′ N) of the West Kunlun Mountains includes rivers Yarkant, Tiznafu, Pishan, Karakax, Yurungkax, Qira, and Keriya from west to east [42,43,44]. Between them, the Yarkant, Karakax, and Yurungkax are the three largest rivers in the NSWKM [45]. The Keriya is a typical glacial meltwater-recharged river; thus, its water volume directly restricts the economic and social development of the Keriya oasis [16]. In this study, the YRK, KRK, YUK, and KRY were selected as the main basins to be studied. The basic information on these basins is shown in Table 1.
Glacial melt contribution in the runoff components of the YRK, KRK, YUK, and KRY accounts for 53.0%, 45.7%, 59.3%, and 47.3% of the total runoff in each basin, respectively [46,47,48]. The basins, which are typically recharged by glacial-meltwater runoff, have interannual runoff-variation coefficients of 0.18, 0.20, 0.23, and 0.22, respectively, showing relatively stable interannual runoff variation [8,45,48].
2.2. Hydrological and Meteorological Data
Data including runoff, temperature, and precipitation of the YRK, KRK, YUK, and KRY from 1957 to 2017 were collected from hydrological observation stations in each basin (Figure 1, Table 1). The meteorological data, including temperature and precipitation, of 5 meteorological stations at the NSWKM from 1957 to 2017 are mainly from the website of the National Meteorological Information Center of the China Meteorological Administration (http://data.cma.cn/).
In this study, the missing data, including temperature and precipitation data, from some stations (in several years) were mainly interpolated by the data from the nearby stations that had complete data. In turn, the missing runoff data from some hydrological stations in the dry season were mainly interpolated by the recession-curve method [49,50]; and the missing summer runoff data were mainly interpolated by runoff data from upstream and downstream hydrological stations. In addition, the arithmetic average of temperature and precipitation from meteorological and hydrological stations in the same period was used to reflect overall climate conditions in the NSWKM.
2.3. Observation Data
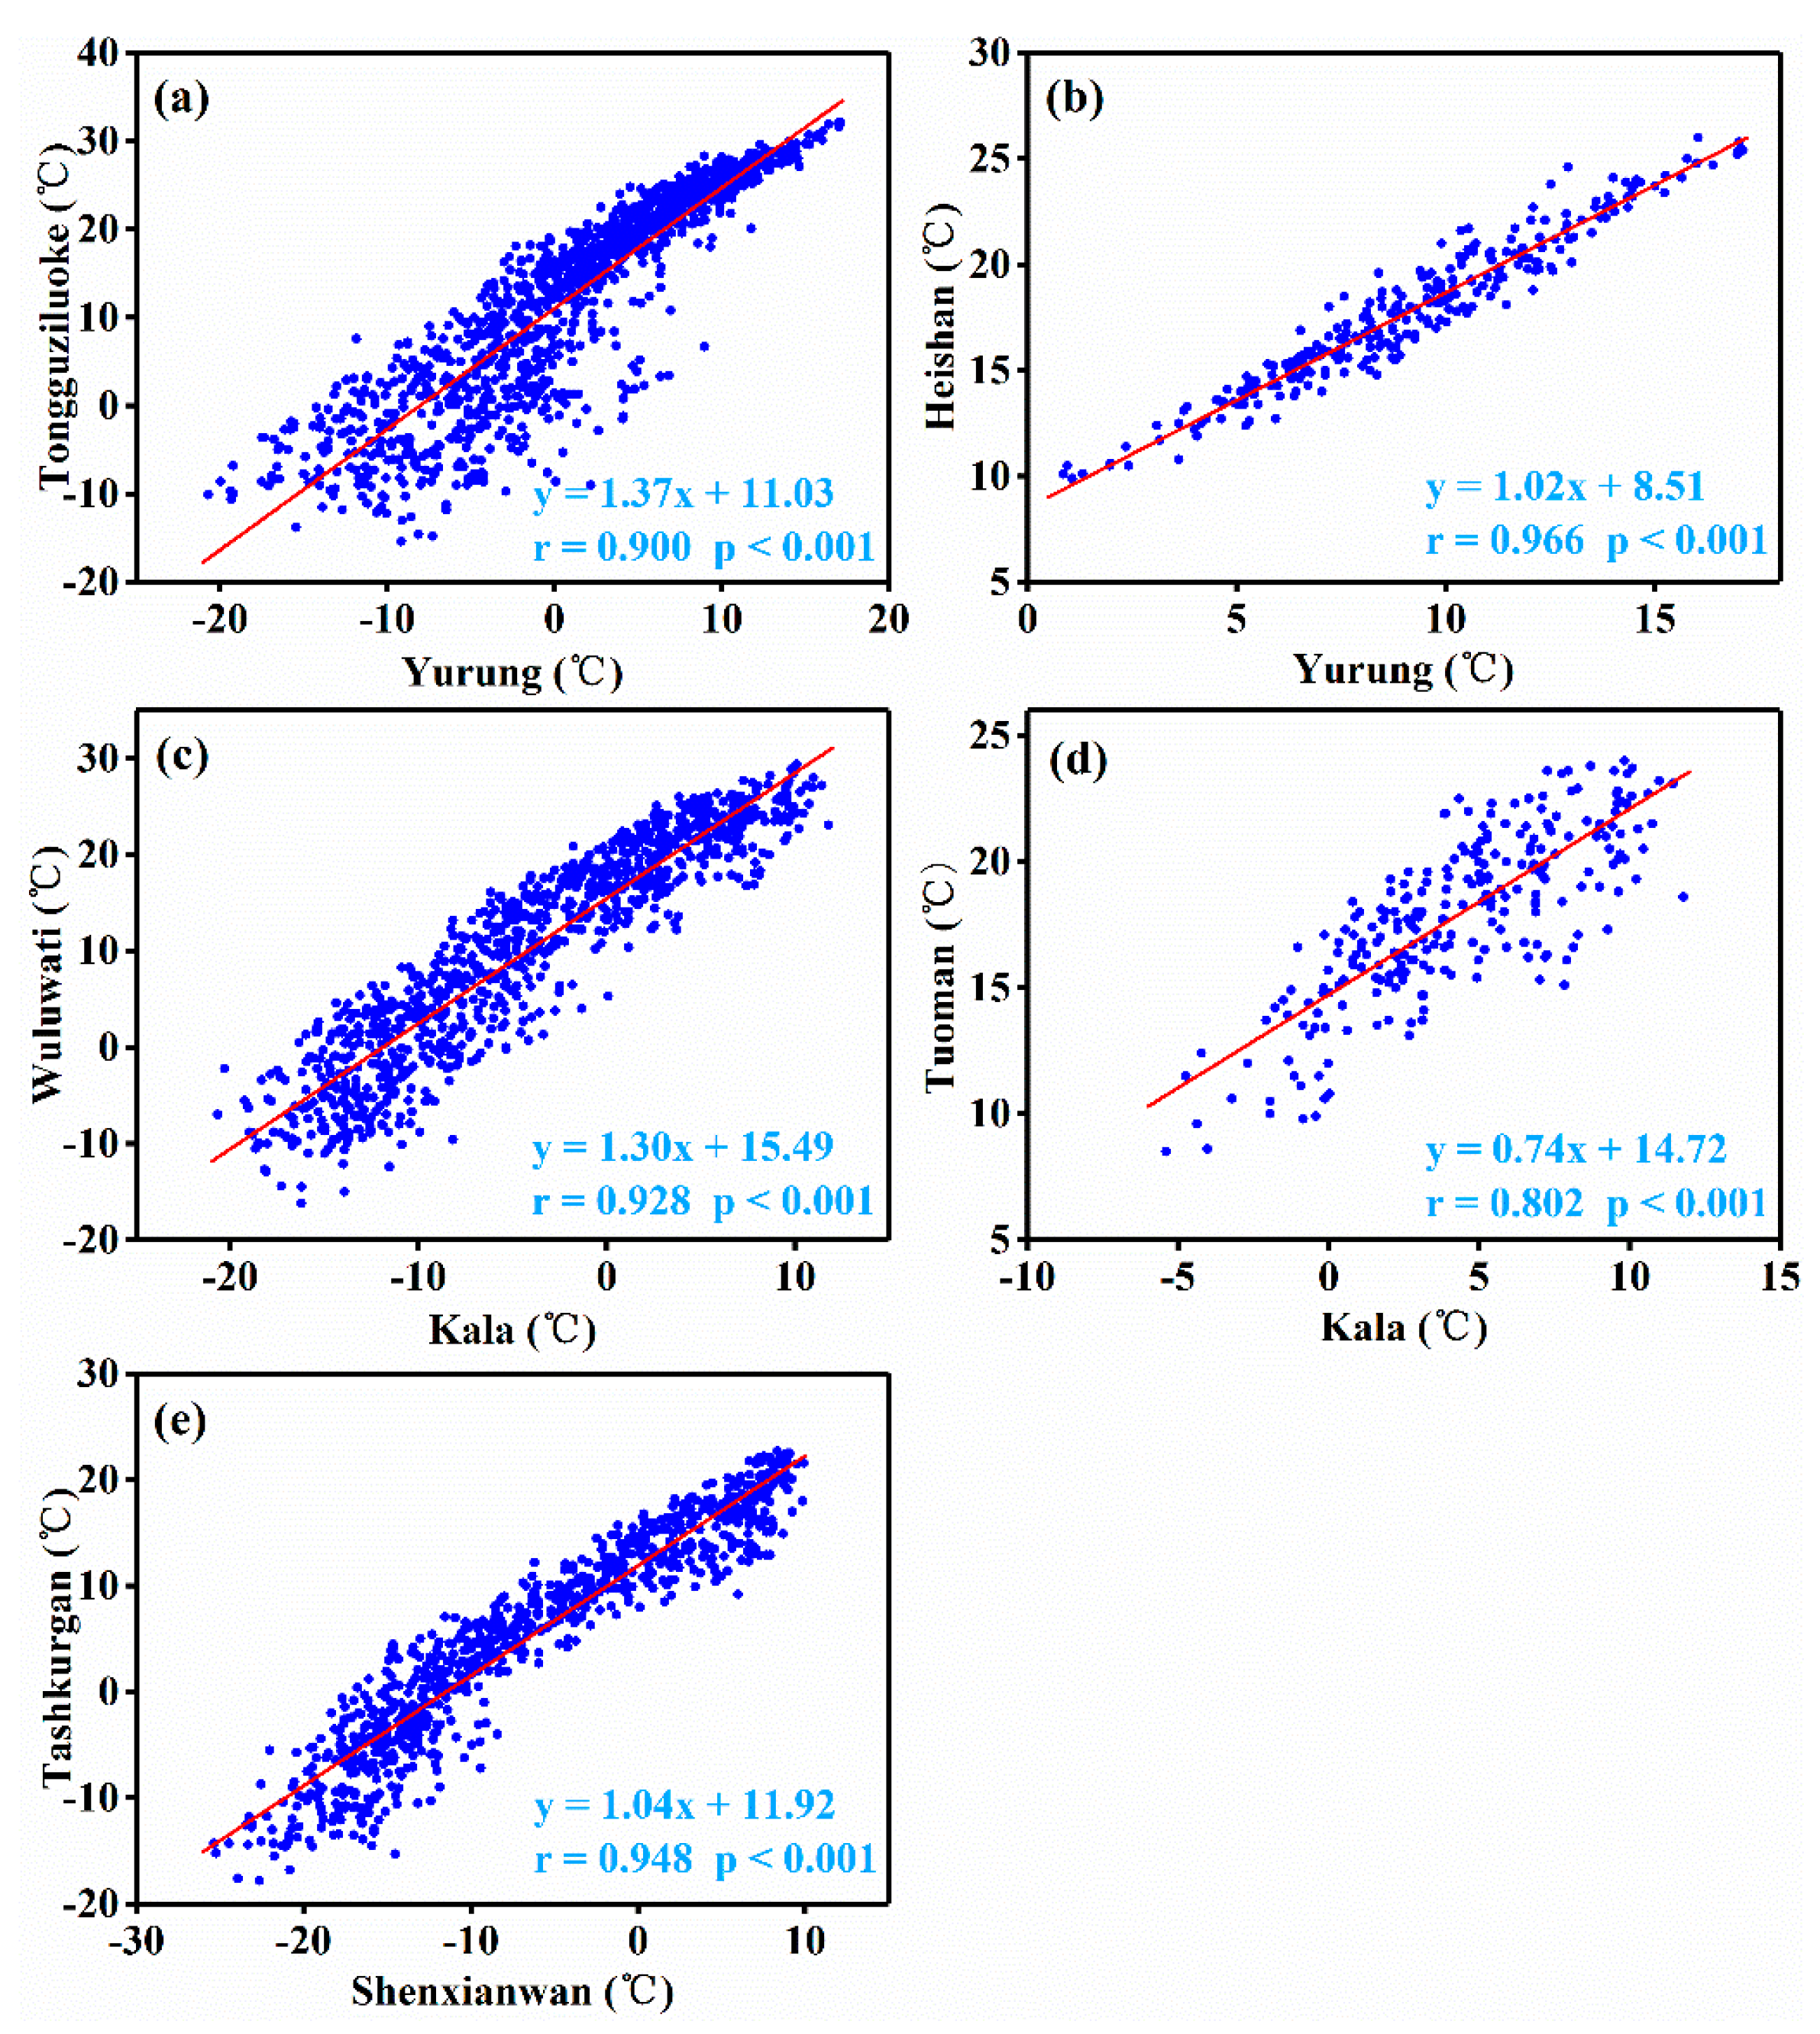
The basic meteorological elements of high-altitude mountainous areas, such as temperature and precipitation, were observed by three Automatic Weather Stations (AWSs) in the study area in 2010–2014 (Figure 1, Table 1). In this study, the daily temperature observed by the AWS was used to test the correlation with daily temperature from adjacent hydrological and meteorological stations in low-altitude mountainous areas (Figure 2). Since the results showed a very significant positive temperature correlation with correlation coefficients between 0.802 and 0.966 at the significant level of 0.001, it can be stated that long-term temperature data of the hydrological and meteorological stations in low-altitude mountainous areas were representative of temperature changes in high-altitude mountainous areas.
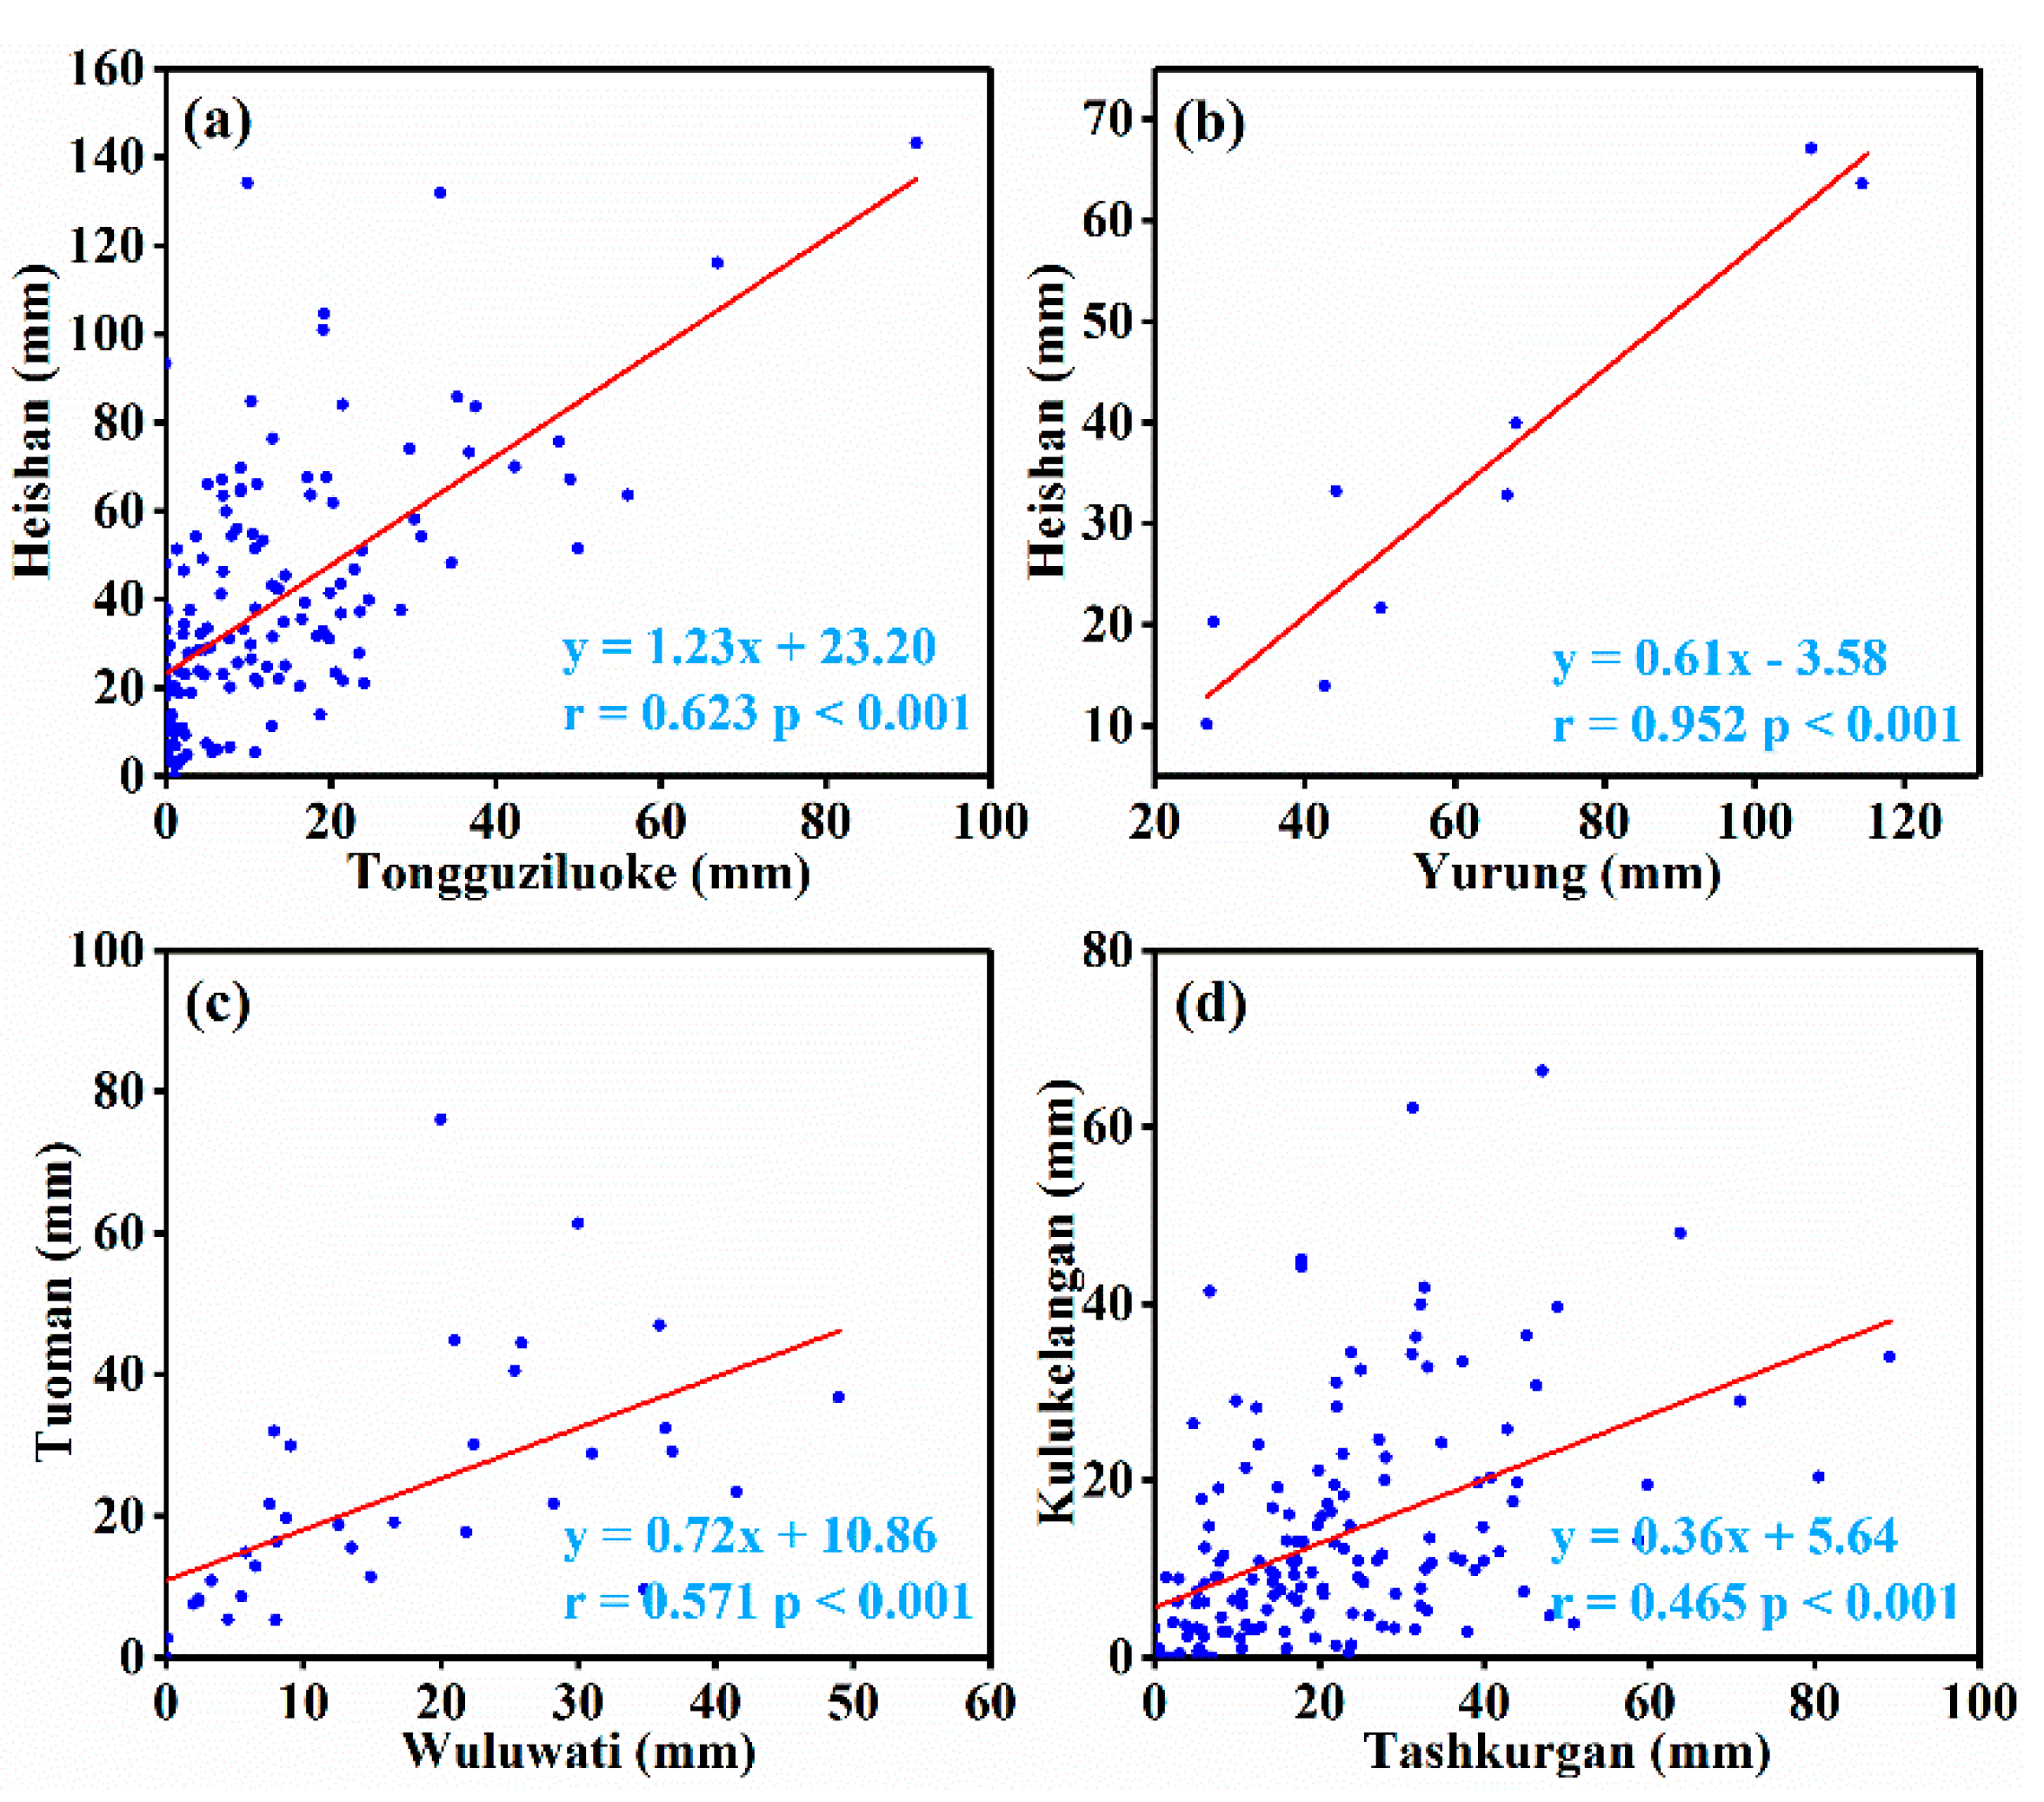
There are few hydrological and meteorological stations in the mountainous study area. However, precipitation is significantly affected by landforms [51]. Therefore, we tested the correlation of monthly precipitation between hydrological and meteorological stations at high and low altitudes in summer (Figure 3). The results showed that, although monthly precipitation had a lower coefficient of correlation between all stations than temperature did (Figure 2), they all passed the 99.99% significance test, showing significant positive correlation, i.e., long-term precipitation data from relatively low-altitude hydrological and meteorological stations could be used as proxy records to study precipitation in the mountainous area of the Tibetan Plateau.
2.4. Snow-Cover Data
Due to 8-day data synthesis, 8-day MODIS composite snow-cover products partly eliminated cloud obscuration, and their accuracy was improved [52]. Therefore, in this work, MOD10A2 (acquired from Terra satellite in 2001–2016) and MYD10A2 (acquired from Aqua satellite in 2002–2016) products were chosen to analyze snow dynamics. As high-runoff and high-precipitation zones in the basin, alpine areas, especially in glacier areas, were much more likely to be disturbed by clouds than those in nonglacial areas despite the remarkable cloud-elimination effect [36,53]. Therefore, we further optimized the cloud-elimination effect by combining the satellite images of the MOD10A2 and MYD10A2 snow products and introducing glacier boundaries to improve the usability of the satellite images [54]. The specific operation process was as follows:
- (1)
- Images of the Terra and Aqua snow covers were projected and formatted by MODIS Reprojection Tool (MRT);
- (2)
- Images of Terra and Aqua in the same period were synthesized by extracting snow-cover images of the basin and recoding the original classification codes [55];
- (3)
- On the basis of the watershed glacier boundary, the cloud pixels of the glacier areas were identified as snow pixels to obtain the final sequence of the snow image data (Figure 4).
In this paper, the method proposed by Paudel and Andersen [20] was used to evaluate the effectiveness of the cloud-elimination method (Table 2). After two-step cloud removal, 77.23% of cloud pixels were eliminated on average. Among them, the two satellite-image synthesis methods eliminated 48.61% of cloud pixels on average, underestimated 3.66% snow-cover pixels, and overestimated 0.89% snow-cover pixels. After the introduction of the glacier-snow-cover area, there was only slight overestimation, but no underestimation. Therefore, it can be seen that the method of removing cloud pixels by introducing a glacier-snow-cover area was effective.
Statistical analysis of the changes in the content of cloud pixels was performed before and after the removal of 648 images. From the original images, 80 images contained more than 16% of cloud pixels, while 56 images contained 10% to 16% of cloud pixels. After synthesis of the two sets of satellite images, there were only 38 images with a cloud-pixel content of more than 16%, and 42 images with a cloud-pixel content of between 10% and 16%. When it was introduced into the glacier area, only 3 of them exceeded 16%, while 14 of them ranged from 10% to 16%. After 2 steps of cloud removal, only 2.6% of the total number of images contained more than 10% of the cloud pixels and most of images contained less than 2% of the cloud pixels. Thus, it was concluded that the method of eliminating cloud pixels in the SCA was very effective in this area [54].
2.5. Statistical Analysis
The Mann–Kendall method, a popular nonparametric test method [56,57], has been widely used to detect changes in meteorological and hydrological time series [47,58,59]. Given a statistical time series Sk from i = 1, 2, …, k, for each variable (xi, xj), if j < i, xi > xj, an upward trend is stated; ri is the total number of dual values with a growth trend.
The mean and variance of Sk are computed as follows:
The sequential values of the UFk statistic are then calculated as
When UF > 0, this indicates that the sequence has an upward trend. In contrast, UF < 0 indicates a decreasing trend. The change point is determined as the intersection point of UF and UB within the confidence interval (value of Zc = ±1.96). Thus, a significant increase or decrease can be identified at a 95% confidence level. UB is the backward trend sequence generated with the reverse data series of UF and can also be calculated by the function of Equation (4). The intersection of UF and UB indicates an abrupt change at the corresponding time [60].
3. Results
3.1. Variation Characteristics of Climate on North Slope of West Kunlun Mountains
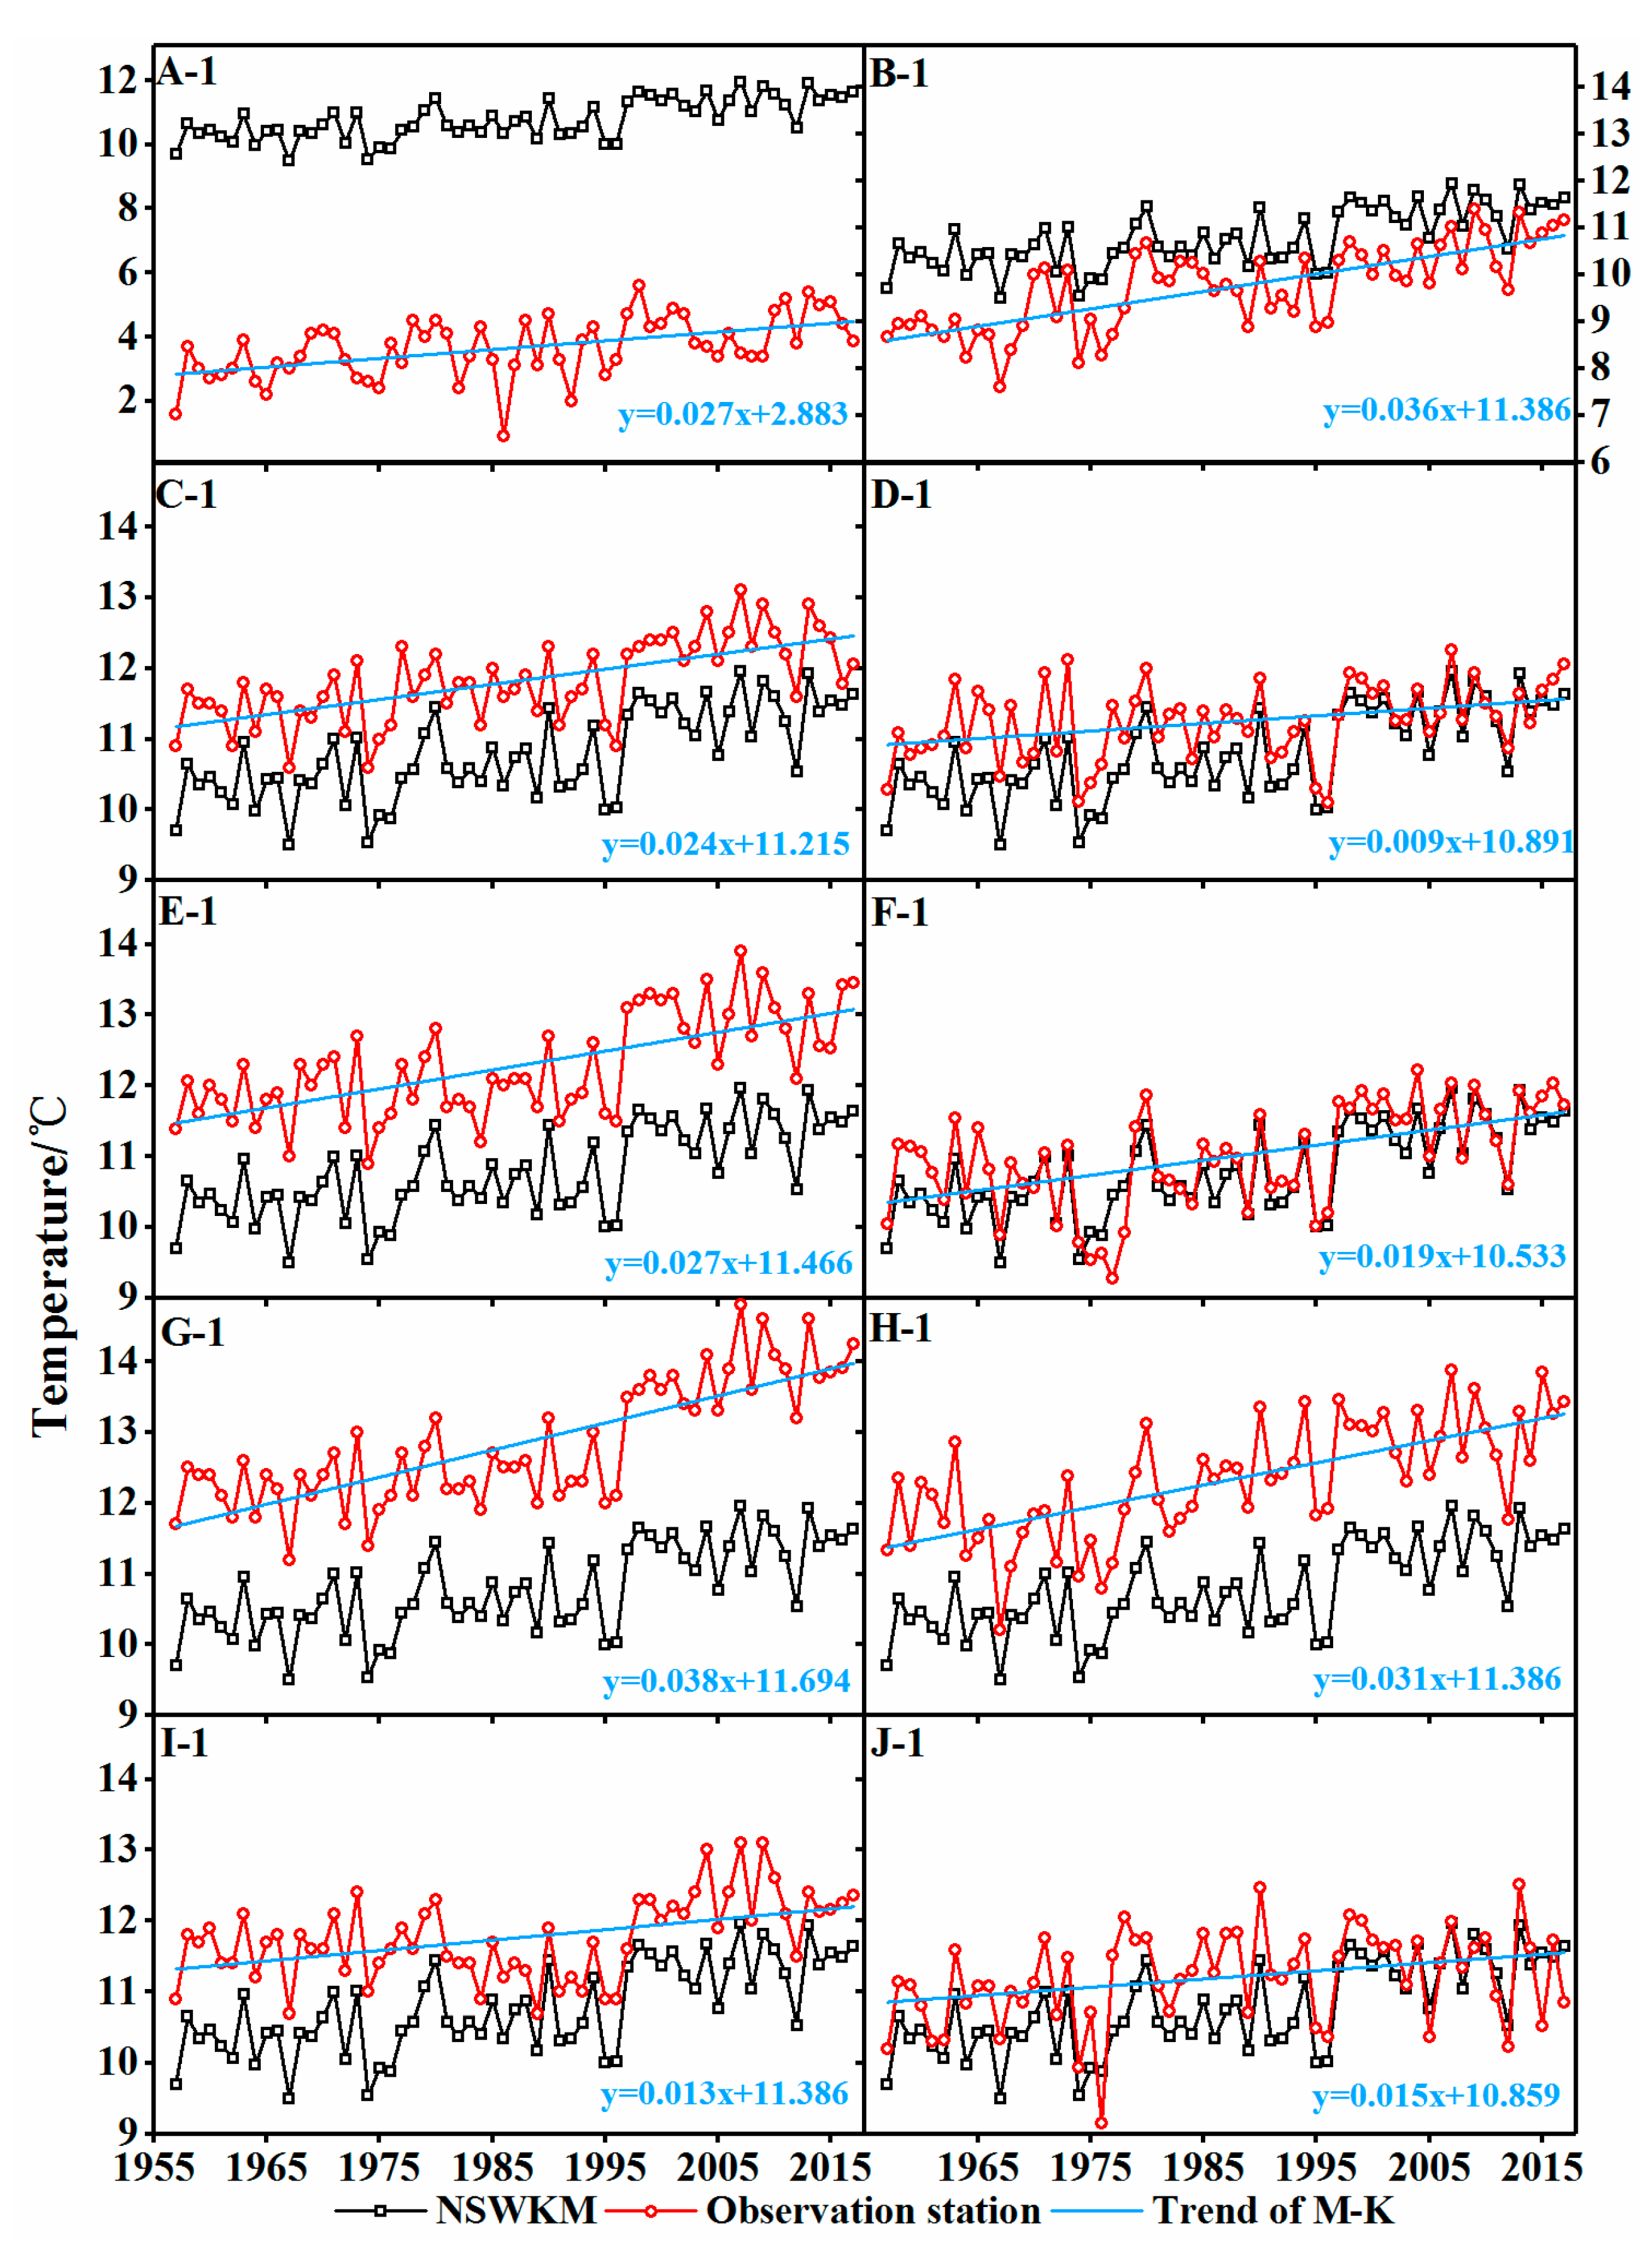
Analysis of the annual average temperature of the NSWKM from 1957 to 2017 (Figure 5) showed that all stations had an increasing annual average temperature. Among them, the Hotan and Kaqun stations had the highest (0.41 °C/decade) and lowest warming rate (0.12 °C/decade), respectively. The NSWKM had a warming rate of 0.26 °C/decade (average for data from meteorological and hydrological stations). Except for Tashkurgan station, which had a lower average annual temperature than the NSWKM, the other stations had a similar average annual temperature to that of the NSWKM. Among them, Wuluwati station had the most significance (R2 = 0.86), and therefore further reflected the characteristics of temperature changes in the entire region.
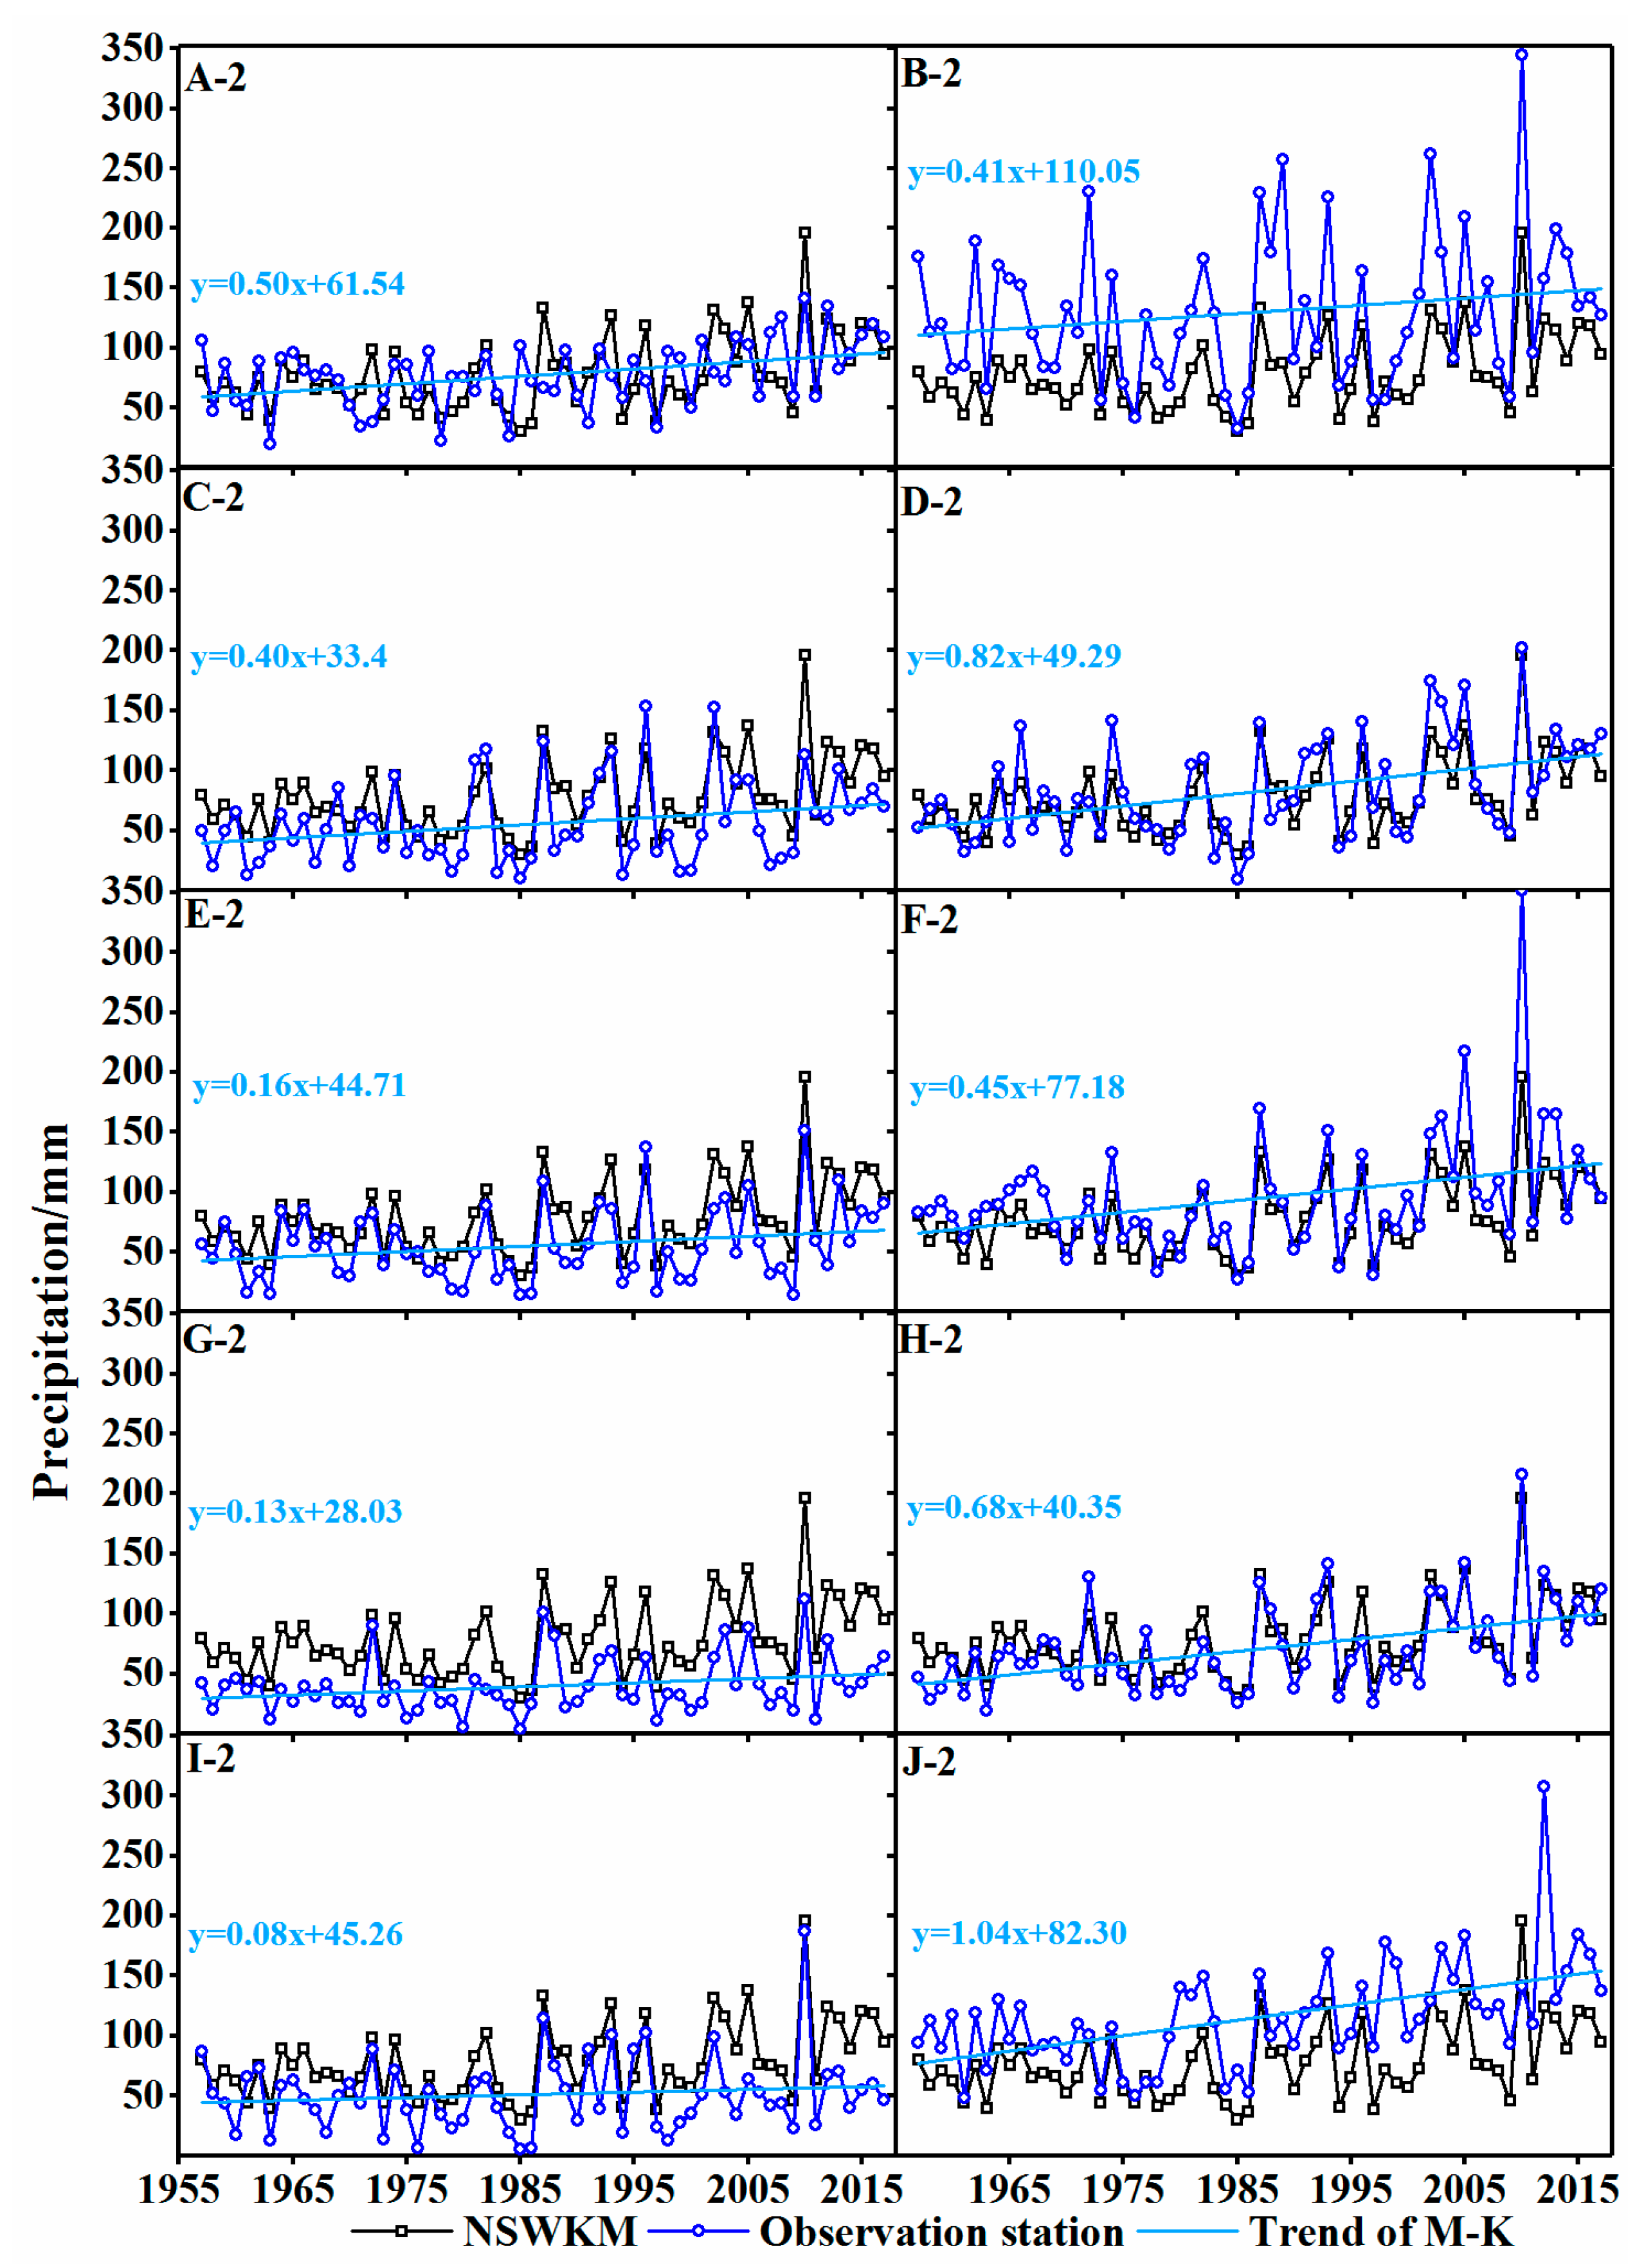
The NSWKM had an average annual precipitation of 77 mm, with a positive trend in time of 5.50 mm/decade (increased by 7.14% per decade). All stations showed increasing annual average precipitation (Figure 6). Kulukelangan station had the most significant increasing average annual precipitation with an increasing rate of 10.5 mm/decade (about 9.15% per decade), while Tongguziluoke station had the most correlative annual average precipitation with the NSWKM (R2 = 0.82) and was therefore considered as representative.
3.2. Variation Characteristics of Snow Cover on North Slope of West Kunlun Mountains
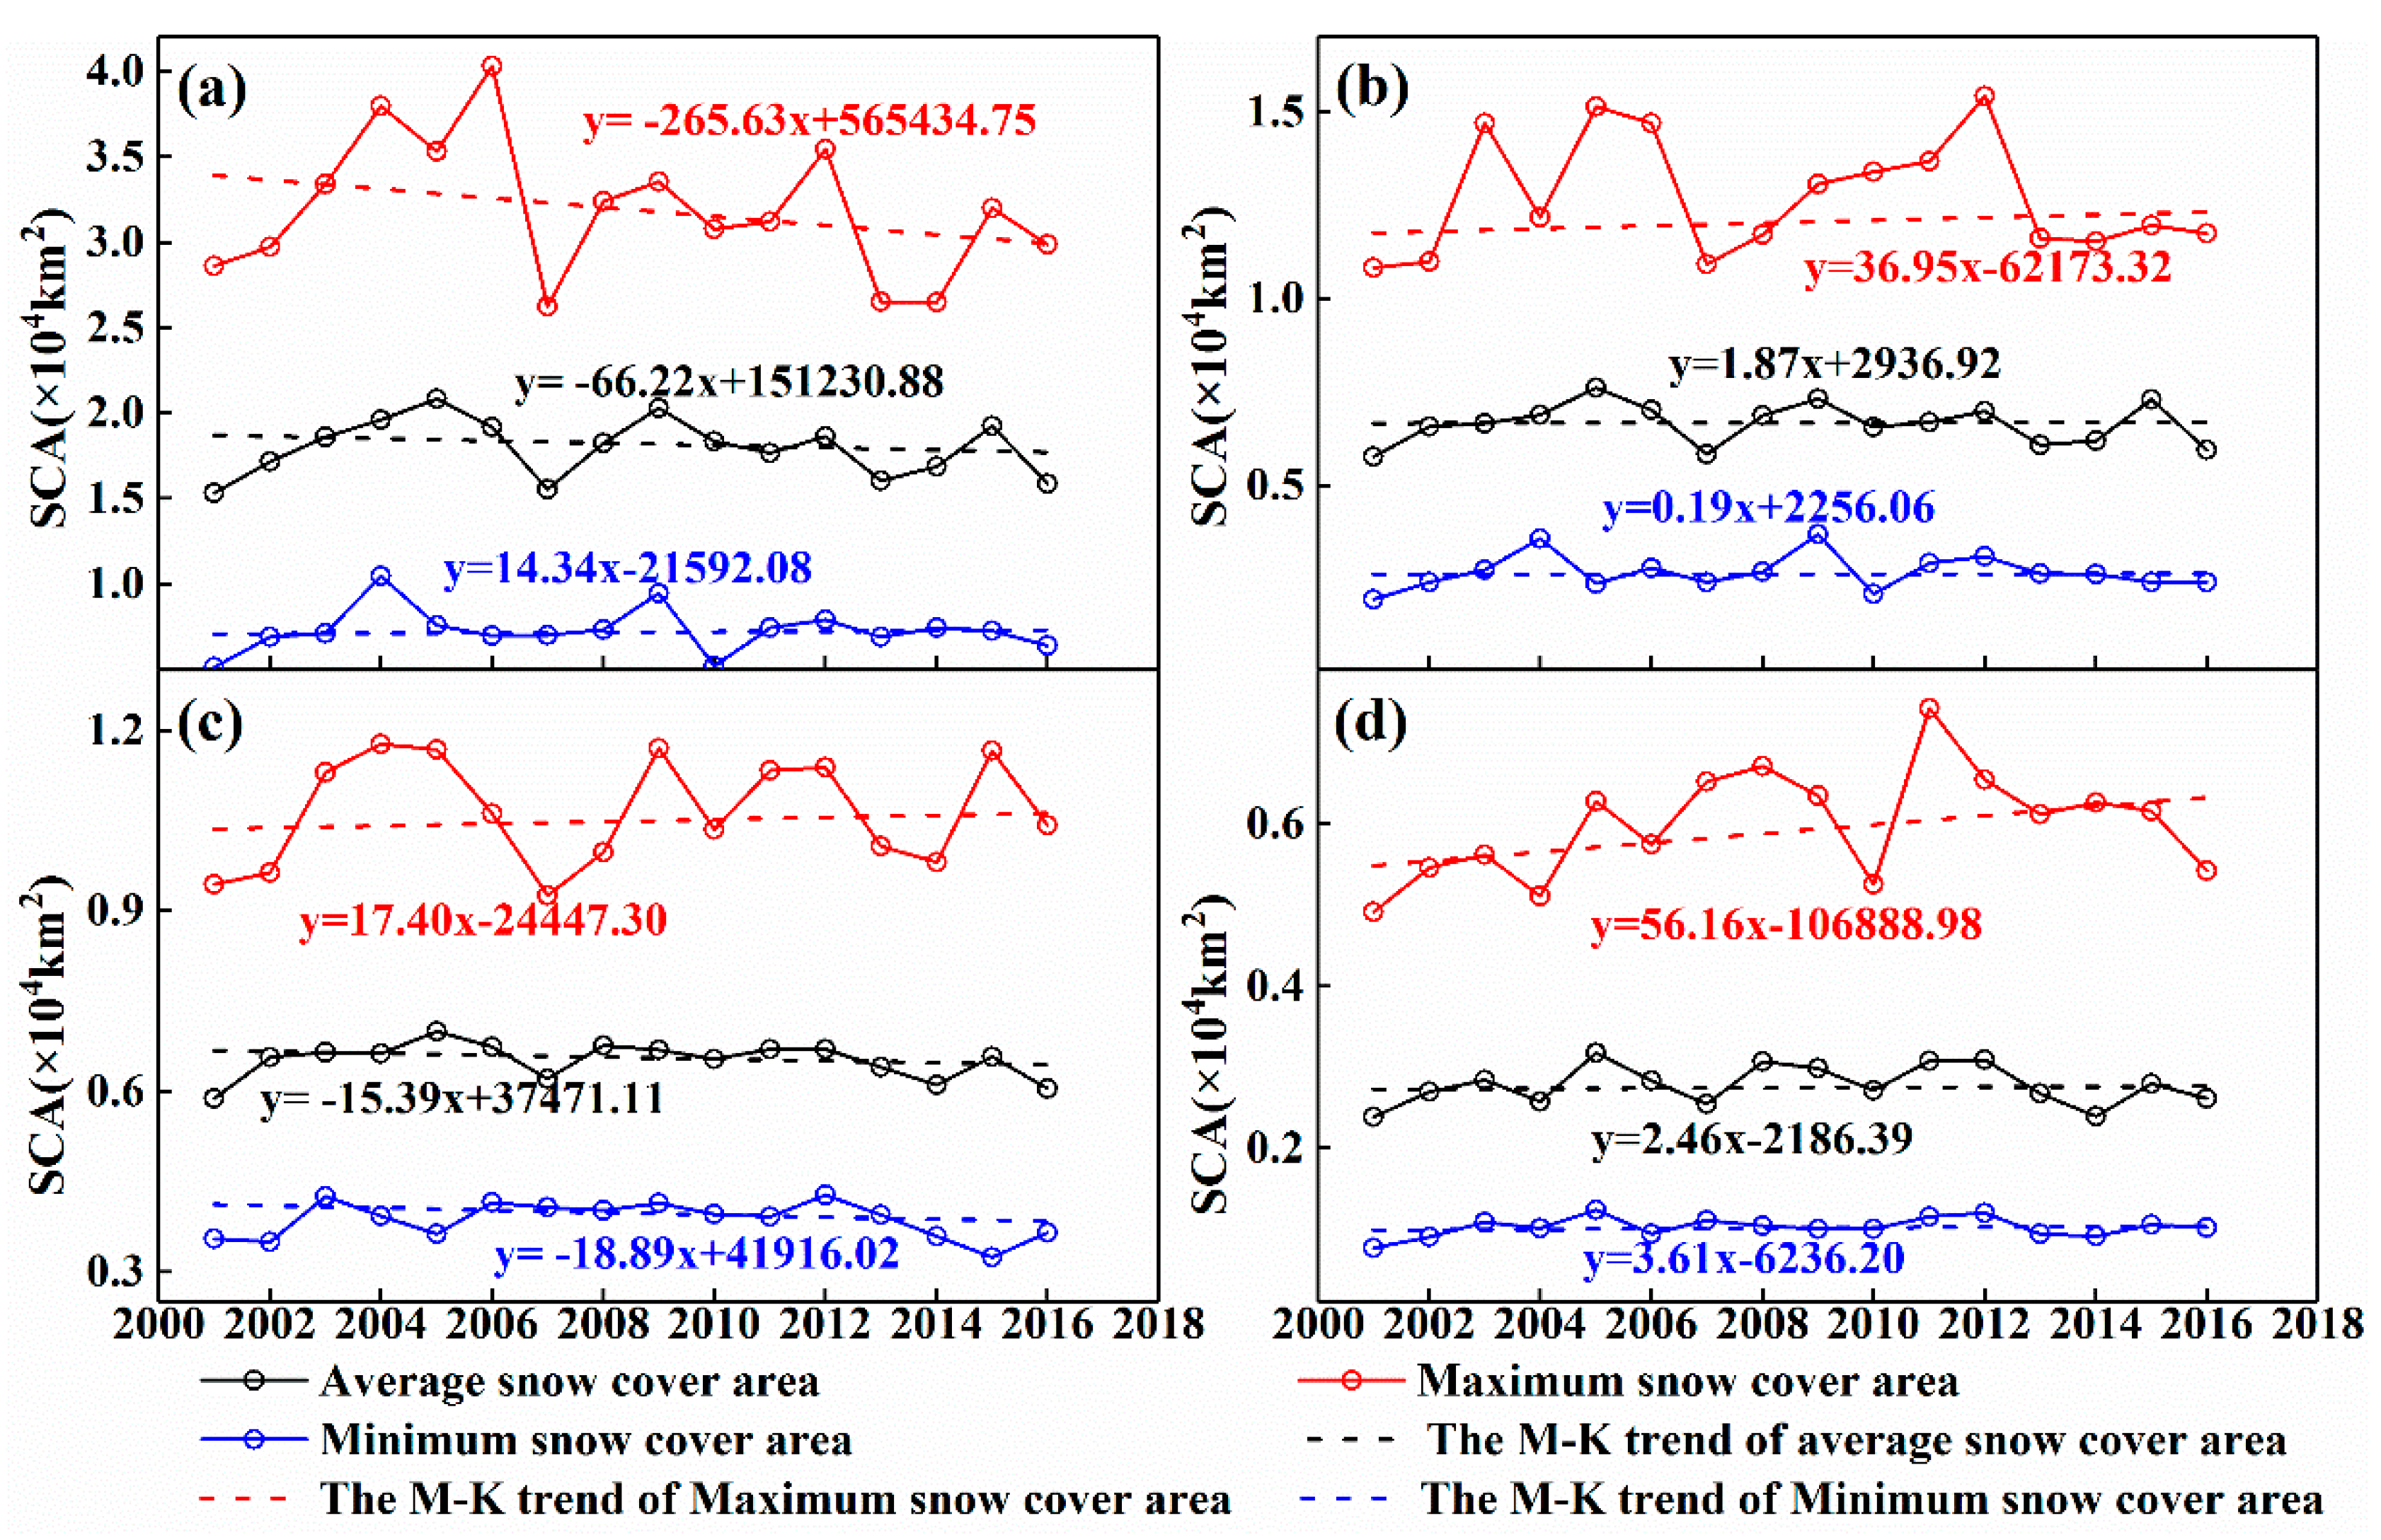
Comparative analysis of the variation characteristics of the average, maximum, and minimum values of SCA in four typical basins on the NSWKM from 2001 to 2016 (Figure 7) indicated that, except for the YUK, the three other basins showed insignificant increase in minimum SCA. The YRK and YUK showed insignificant decrease in annual average SCA, while the KRK and KRY showed insignificant increase in annual average SCA.
The YRK, KRK, and YUK had similar change dynamics in SCA over the years showing a fluctuation change. The period of observation time could be accordingly divided into three stages. In the first stage, from 2001 to 2005, the average SCA increased until 2005, and the YRK, KRK, and YUK had SCAs of 20,854 km2, 7625 km2, and 6995 km2, respectively. In the second stage, from 2005 to 2007, the SCA continuously decreased. In the third stage, from 2007 to 2016, the SCA first increased until 2009, and then undulation decreased. In addition, YRK, KRK, and YUK had the highest SCA in 2005, which was caused by the relatively lower temperature and higher precipitation in that year (Figure 5 and Figure 6). In contrast to the three other basins, the average SCA of the KRY changed very significantly, i.e., first increased until 2004, 2007, 2010, and 2014, respectively, and then decreased.
To study SCA change regulation in the four basins at different altitudes, we divided their altitudes according to elevation difference, using 500 m as a reference, and drew the annual average snow-cover-fraction (SCF) change curves for different altitudes (Figure 8). Results showed that the YRK, KRK, YUK, and KRY had average SCAs of 17,977.8 km2 (SCF = 38.60%), 6652.8 km2 (SCF = 33.39%), 6514.0 km2 (SCF = 43.95%), and 2799.3 km2 (SCF = 33.29%), respectively. During seasonal change, the four basins had maximum SCF values in spring. For the whole basin (Figure 8, black curve), annual change curves were M-shaped, i.e., the largest SCF was in spring and autumn, and the smallest SCF was in summer and midwinter (December–January). The maximum SCF of the different basins occurred in different periods of time and in different forms. From these, the YRK had a maximum SCF mainly in mid-March and mid–late October, the KRK from mid-March to late May and mid-October, the YUK from mid-March to late May and from late September to late October, and the KRY in early May and late September. The four basins showed the same change in annual SCF at each altitude, i.e., a single peak below 4000 m, mainly in winter; a significant double peak between 4000 and 6000 m; and a longer peak duration at higher altitudes; additionally, higher glacier coverage above 6000 m resulted in little change in SCF. This study area showed bimodal change in annual SCF and a smaller SCA in winter than in spring and autumn, possibly because of lower precipitation in winter, smaller snow supply, lower temperature, and higher wind speed in mountainous areas in winter leading to smaller critical wind speeds of wind-blown snow, easier occurrence of wind-blown snow, and snow redistribution and sublimation [61].
3.3. Runoff Variation Characteristics on North Slope of West Kunlun Mountains
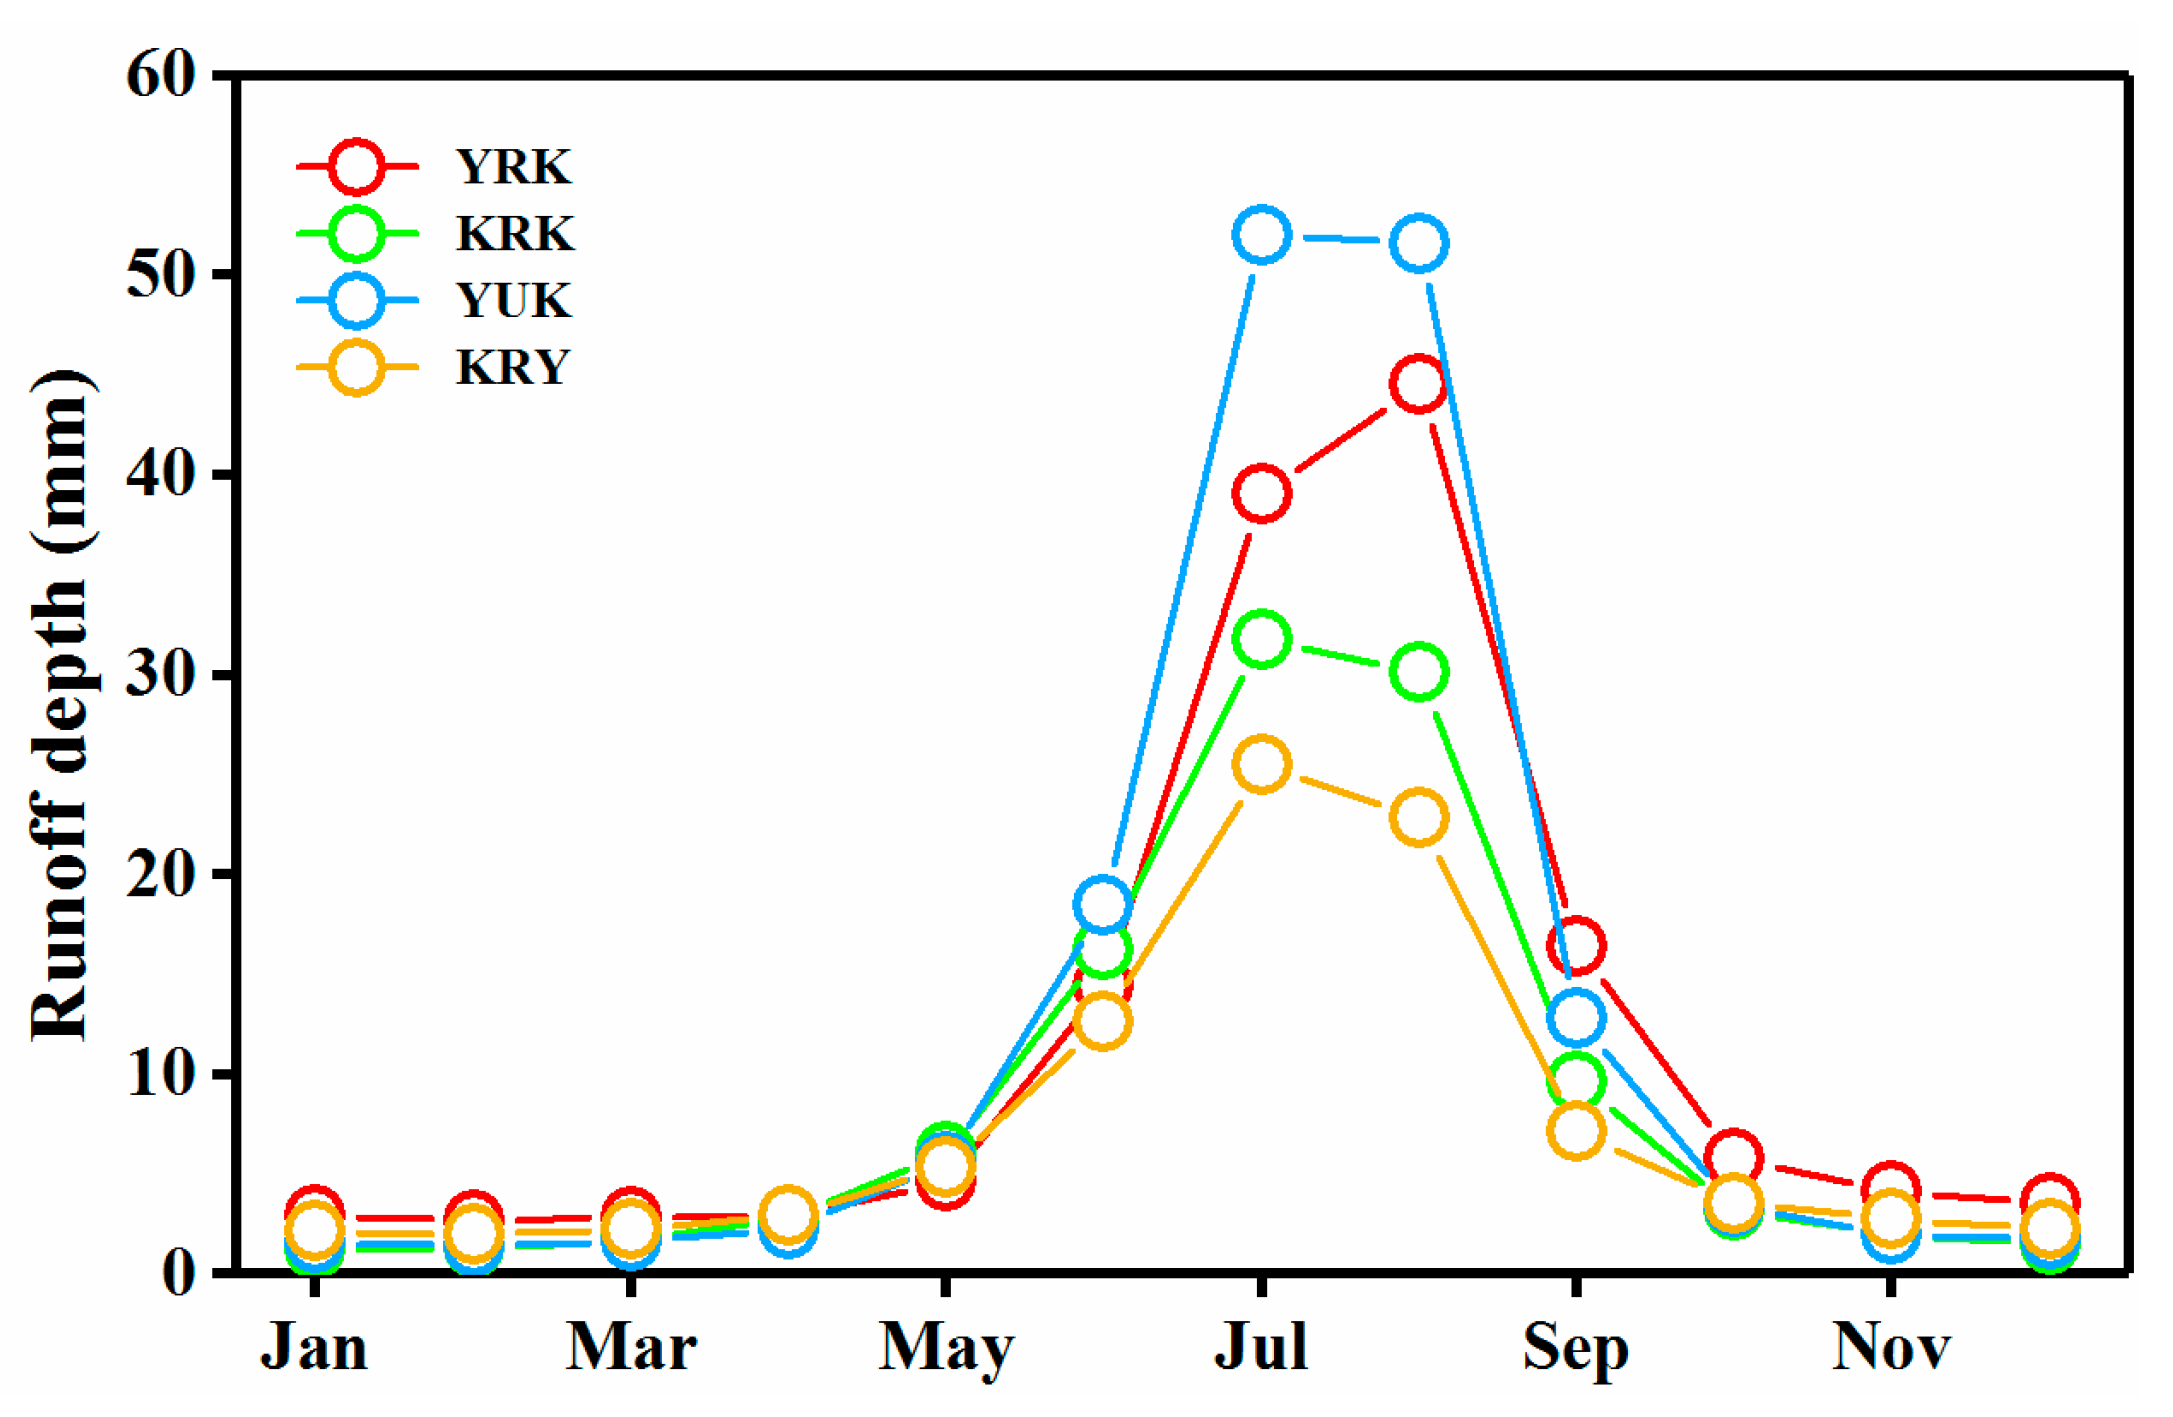
From 1957 to 2017, the four basins of the NSWKM had increasing runoff depth (Figure 9). The YRK had the most significant increasing runoff depth (5.78 mm/decade), while the YUK had the most insignificant (1.58 mm/decade). The four basins had a minimum monthly runoff depth from December to March and, apart from the YRK in August, a maximum monthly runoff depth in July (Figure 10).
Statistical analysis of the probability of minimum and maximum monthly mean runoff occurrence in the four basins (Table 3) also showed that the YRK was very different in terms of its maximum monthly runoff depth compared to the three other basins, possibly because glaciers blocked the lakes upstream of the YRK, and flash floods mainly appeared in August [54].
4. Discussion
4.1. Dynamics of Abrupt Change in Runoff Depth
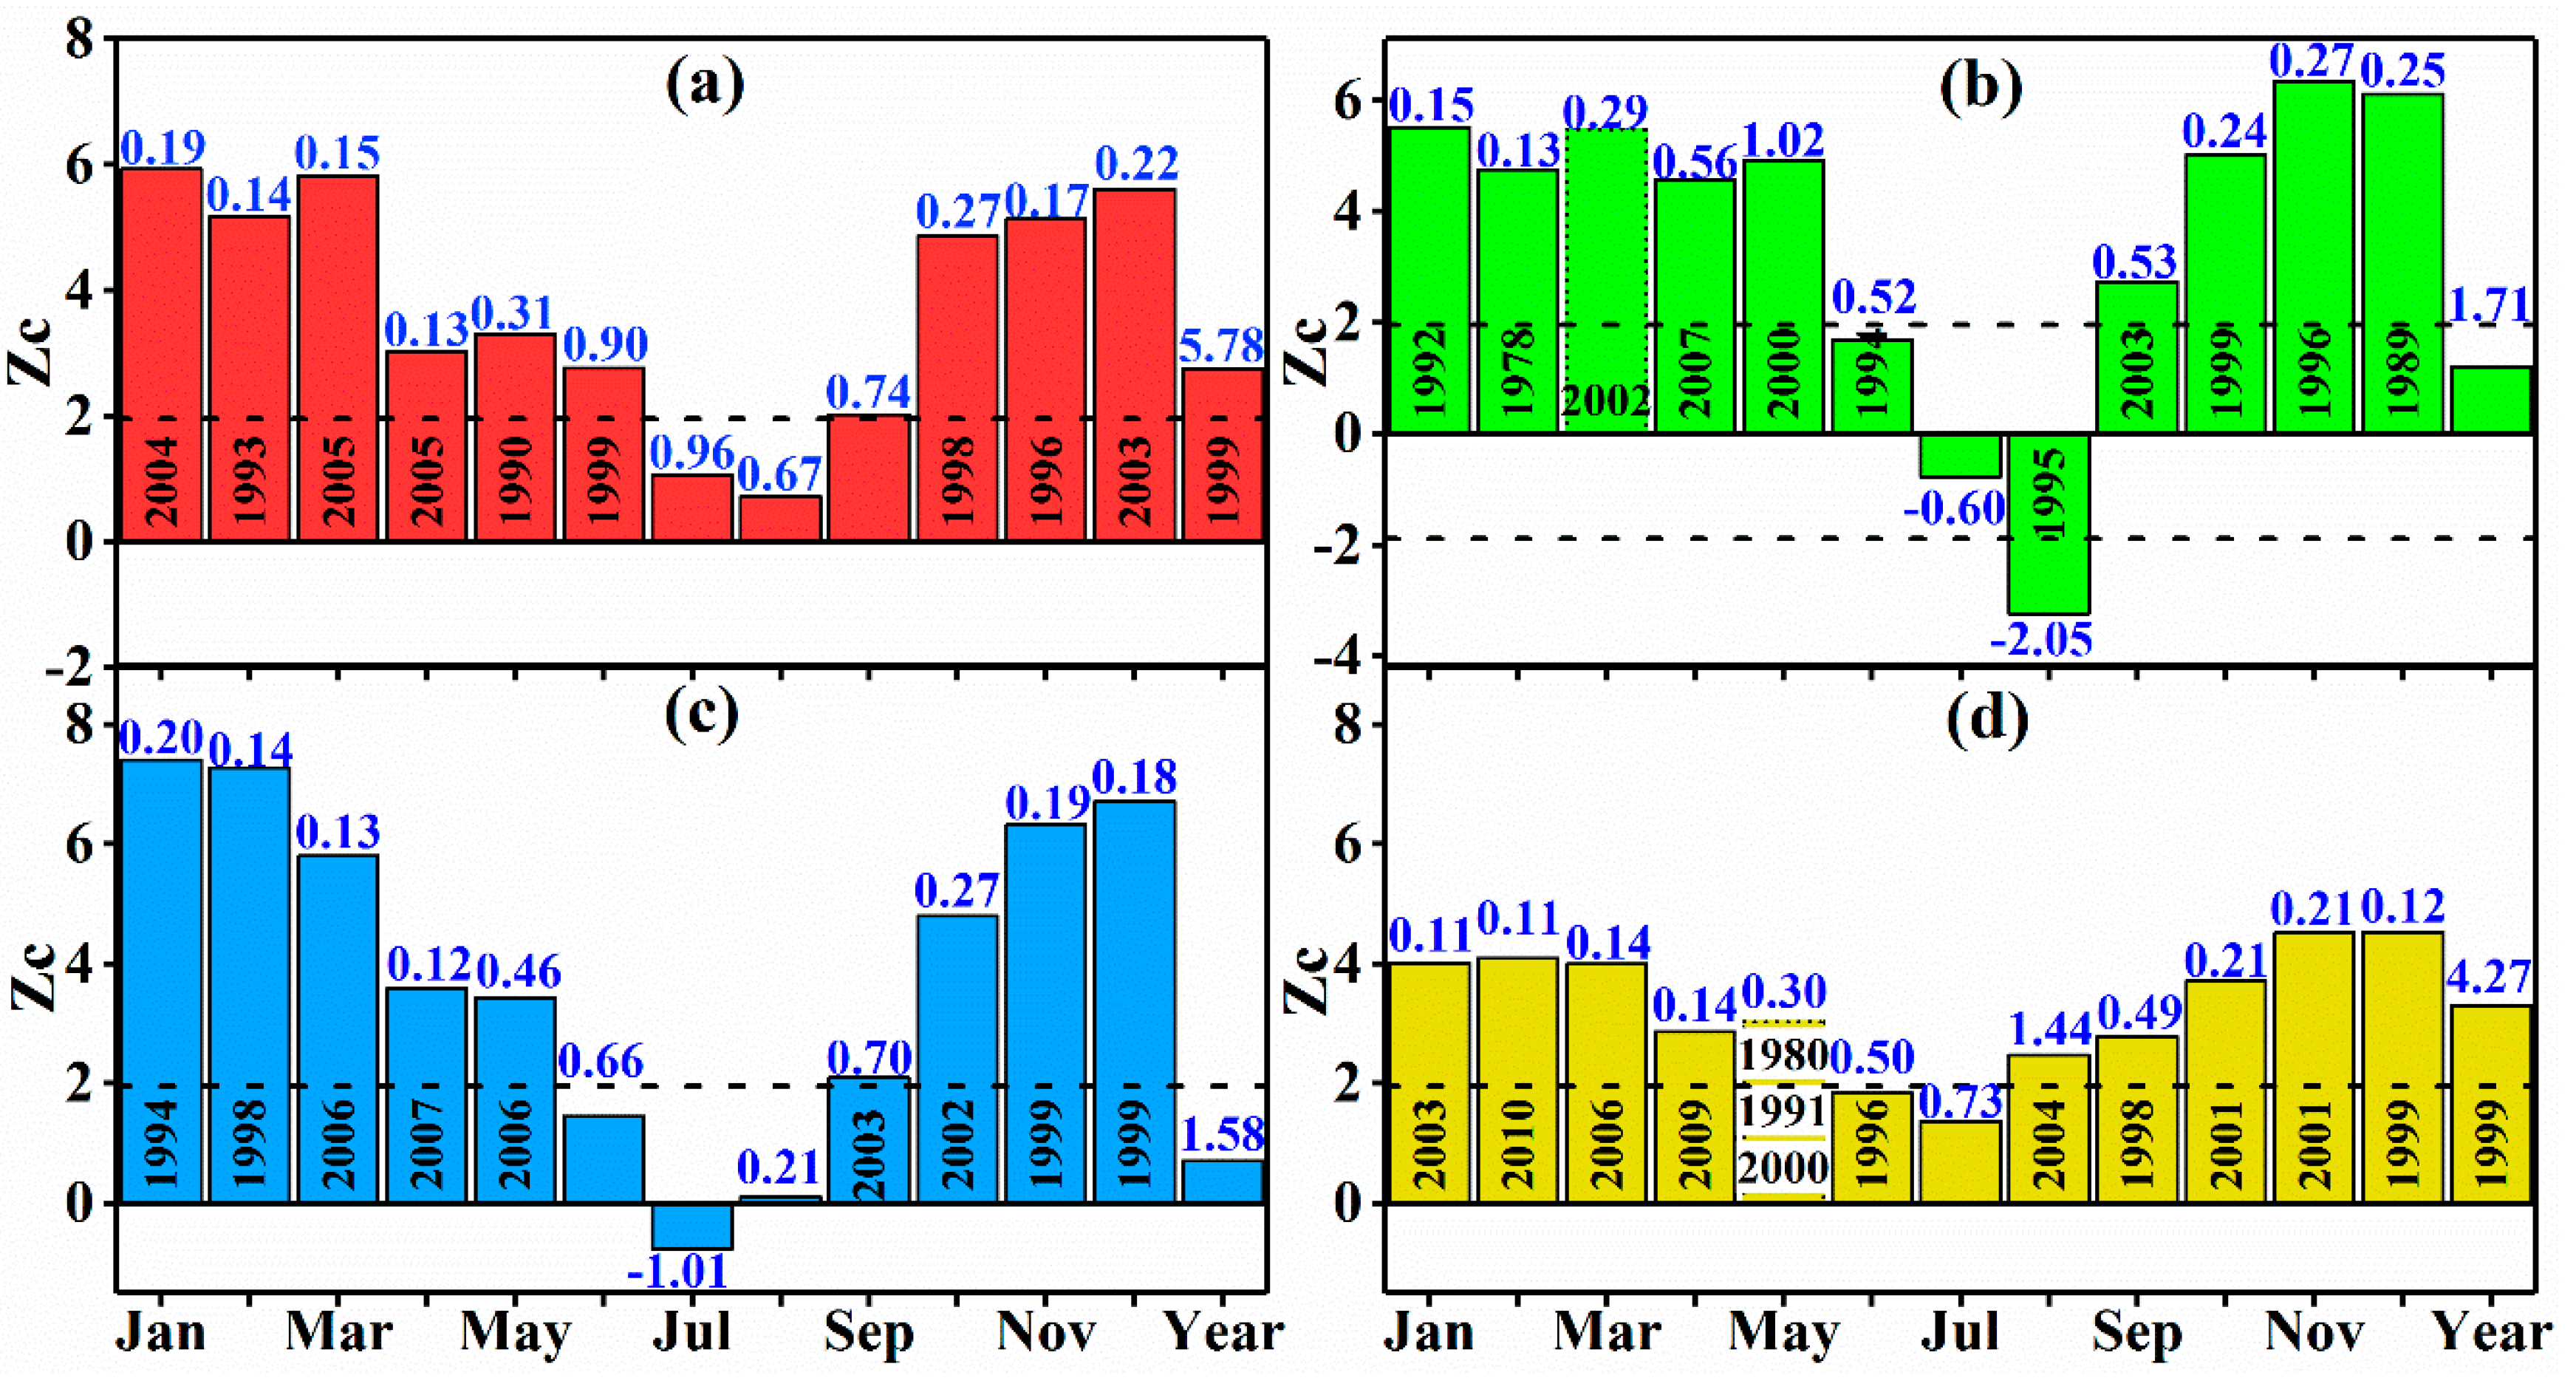
The Mann–Kendall (M–K) trend test of annual runoff depth showed that the Zc values of the annual average runoff depth of the YRK and KRY passed the 0.05 significance level tests and significantly increased (Figure 11) with increasing rates of 5.78 and 4.27 mm/decade, respectively. The annual runoff depth of the KRK and YUK increased insignificantly, with increasing rates of 1.71 and 1.58 mm/decade, respectively. This result was qualitatively consistent with the M–K trend test results obtained by Xu et al. [8], who analyzed the annual runoff changes of the YRK, KRK, and YUK from 1957 to 2008, i.e., showing that the annual runoff of the YRK significantly increased, while that of the KRK and YUK did not. The M–K trend test of monthly runoff depth showed that the monthly runoff depth of the YRK increased; this increase was significant from January to June, and from September to December, but it was insignificant from July to August. The result is due to runoff timing not changing in the main glacier melt months of July and August. Moreover, the runoff depth of the KRY in June and July did not pass the 95% significance tests and, in the other months, significantly increased. Additionally, the runoff depth of the YUK increased significantly from January to May and from September to December, but insignificantly in June and August; however, the average monthly runoff depth of the YUK decreased in July. The KRK had similar interannual change in monthly runoff depth to that in the YUK but a much higher decrease rate of runoff depth in August than that in the YUK. This result might be because the YUK had much larger runoff depth in summer than in the other months, resulting in an insignificant increase in annual runoff depth [62]. However, the runoff depth of the KRK decreased in summer and significantly increased in winter, possibly because of river regulation due to the newly built Wuluwati Reservoir. As a result, the annual runoff depth at the Hydrological Station (HS) of Wuluwati was subject to change [63]. In addition, temperature rising in winter led to the wide degradation of permafrost in the study area, resulting in surface-water infiltration into groundwater in the early stage, an increase in groundwater storage capacity in the basin [64,65], and an increase in basin runoff in winter.
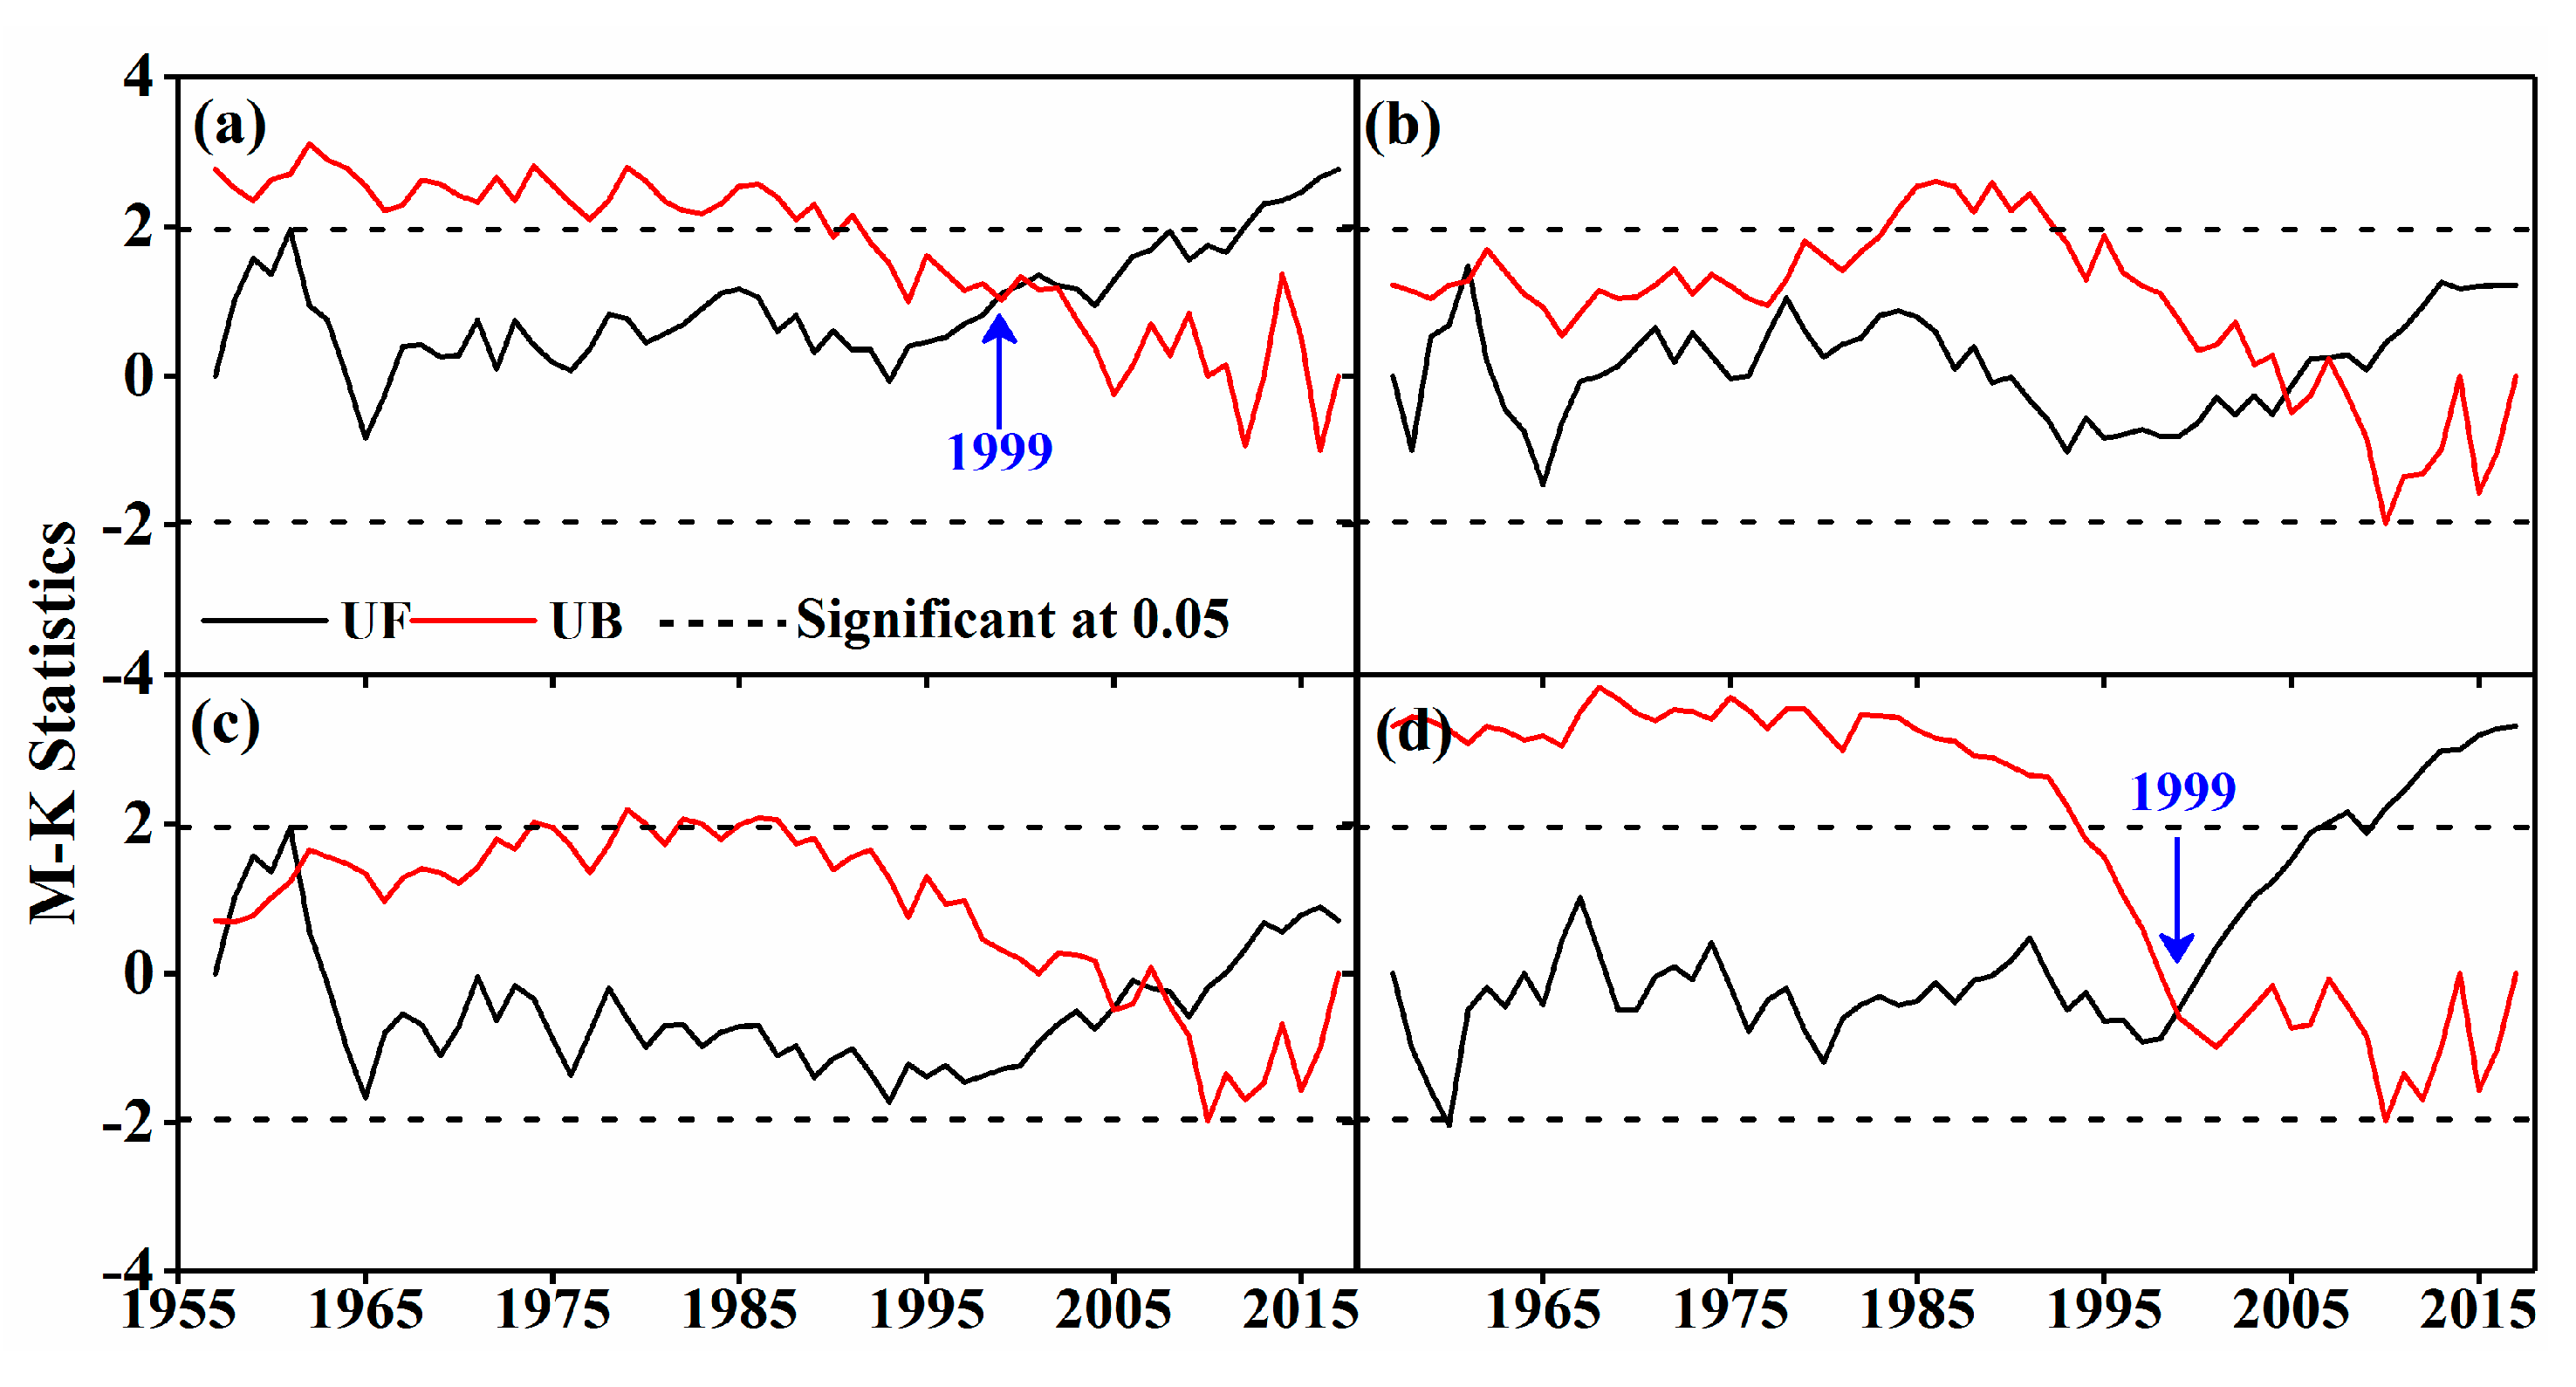
An M–K abrupt runoff change test in the four basins was carried out (Figure 12). Results showed that the annual runoff depth of the YRK and KRY changed abruptly in 1999, which was nearly 10 years later than the M–K abrupt-change results of the annual mean temperature in the two basins obtained by Ling et al. [66]. However, the YUK and KRK had no abrupt change in annual runoff depth. The M–K abrupt change test of monthly runoff change in the four river basins showed that the YRK underwent an abrupt increase of runoff depth in a total of nine months. The abrupt change in runoff depth occurred the earliest in May 1990 and the latest in March and April 2005, and mainly occurred in the other months in the late 1990s. The KRK suffered an abrupt change in months other than July, an abrupt decrease of runoff depth in August, especially in 1995, and an abrupt increase in other months, the earliest of which was in February 1978 and the latest of which was in April 2007. The YUK underwent an abrupt increase in runoff depth from January to May and from September to December, especially in January, February, November, and December in the late 1990s, and in the other months after 2000. The KRY suffered an abrupt change eight months after 2000, i.e., in November and December in 2001 and later from February to April after 2006.
4.2. Climate Change Impact on Runoff Depth
The Pearson correlation of annual runoff depth with the annual average temperature and precipitation in the YRK, KRK, YUK, and KRY was analyzed. Rivers mainly supplied by ice and snow meltwater usually have good correlation between temperature and precipitation. Therefore, we also analyzed the partial correlation between temperature and runoff depth and between precipitation and runoff depth. The analysis results are shown in Table 4. The YRK had a significant positive correlation between the runoff depth and temperature (single correlation coefficient was 0.360, and partial correlation coefficient was 0.356, both of which passed the test of significance at the 0.05 level); however, there was no correlation with the runoff depth and annual precipitation (both the single and partial correlation coefficients were close to 0), which was consistent with the results of Ling et al. [67], who showed that annual average temperature played a dominant role in the influence of annual runoff depth in the YRK. Although the KRK had a significant correlation between the annual runoff depth and annual precipitation (single correlation coefficient was −0.367 and partial correlation coefficient was −0.400, both of which passed the 0.05 test of significance), both the KRK and the YRK had insignificant positive correlation between annual runoff depth and annual average temperature and between annual runoff depth and annual precipitation, which disagreed with the runoff generation law of rivers that are mainly supplied by ice and snow meltwater [6,31]. This result may be due to other factors, such as earthquakes, regional geological structures, and glacier-blocked lakes, generating Glacier Lake Outburst Floods (GLOFs) that affected the impact of climatic elements on runoff [54,68,69]. The annual runoff depth was positively correlated with the annual average temperature and annual precipitation in the KRY. The annual precipitation influenced the annual runoff depth more greatly (single correlation coefficient was 0.411, and partial correlation coefficient was 0.426, both of which passed the 0.01 significance level test) than it influenced the annual average temperature (single correlation coefficient was 0.250, and the partial correlation coefficient was 0.277, both of which passed the 0.1 significance level test), which was in agreement with earlier results of Xu et al. [32], who showed that annual runoff depth was greatly influenced by both annual precipitation and average temperature. However, it was also found in this study that precipitation influenced runoff depth more greatly than temperature did in the KRY. The contribution of glaciers and snow melting to river flow is an important parameter for analysis of the impact of temperature and precipitation changes on river flow [70]. Singh et al. [18], studying the total flow of the Himalayan rivers, found that the contribution of snow cover and glacier melting to the total flow of rivers increased with the increase of altitude. The difference of vertical gradient is the main factor affecting regional snow cover and glacier melting [43,46] because of the relatively low elevation and more precipitation of the Keriya River Basin, and lead to precipitation contributed more to runoff than temperature in the region.
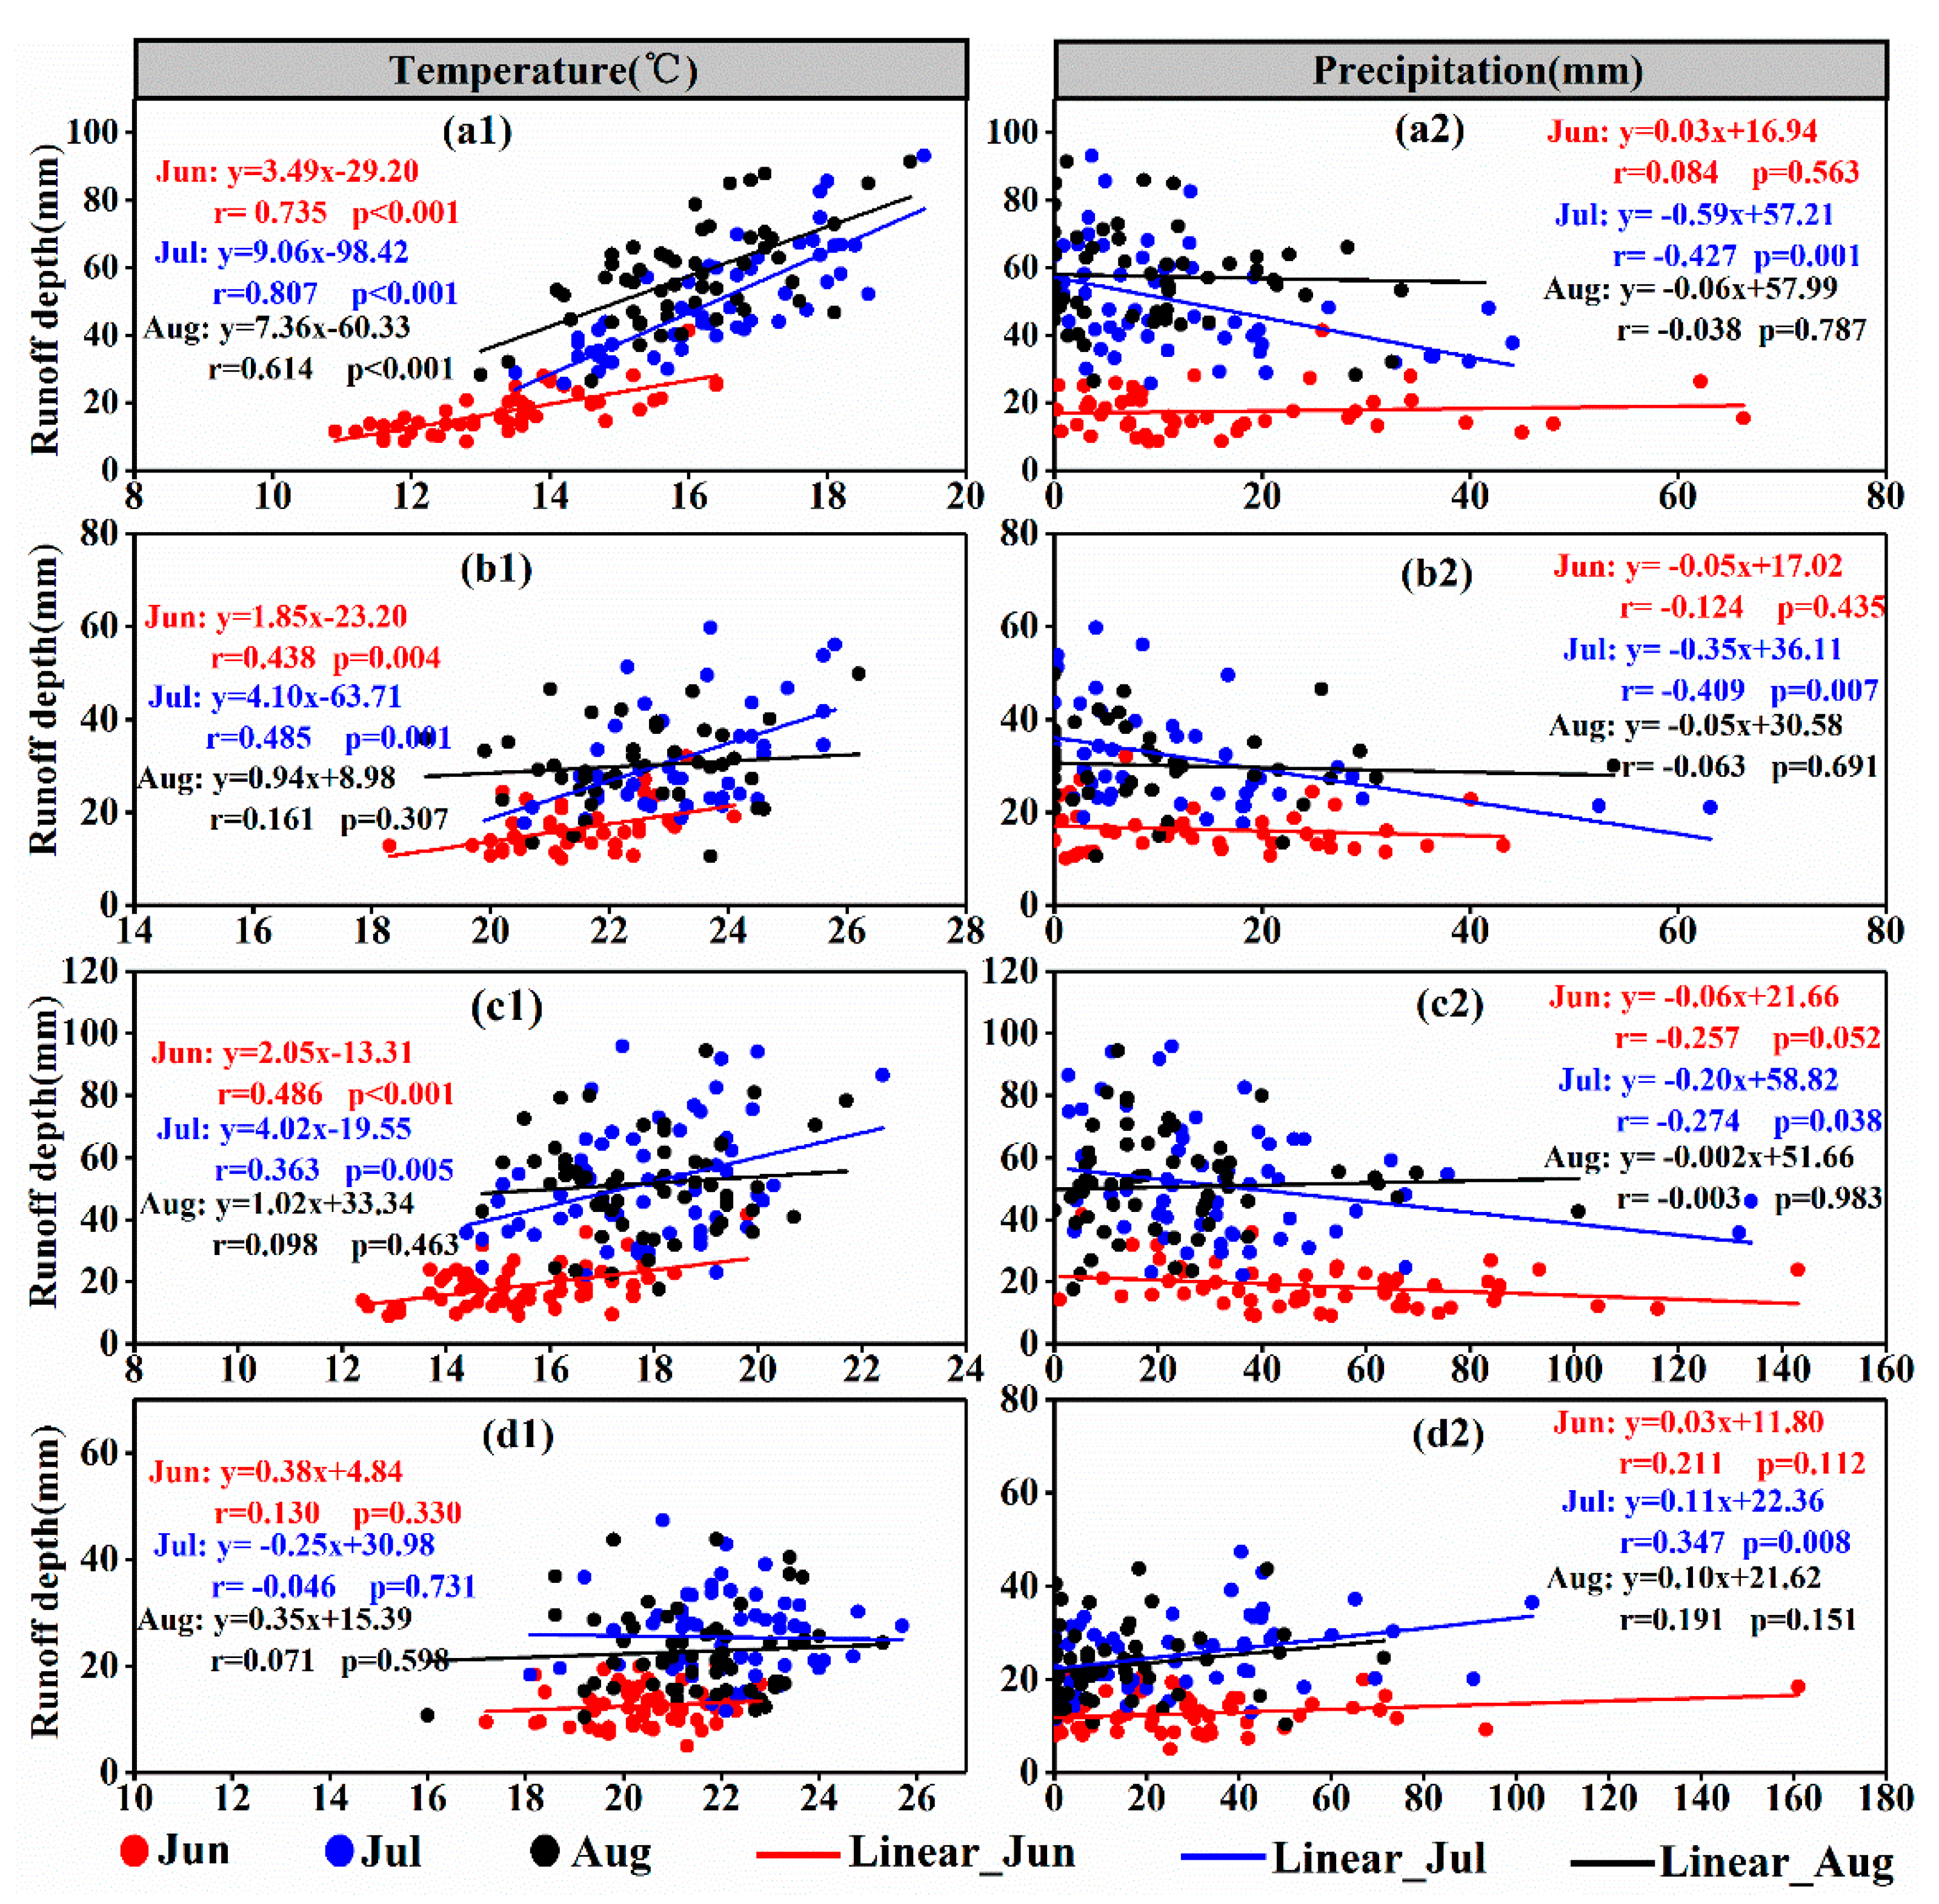
The study area had high temperatures and abundant rainfall in summer (i.e., June, July, and August), and the runoff of the four basins was mainly recharged by ice and snowmelt water. Therefore, we mainly analyzed the relationship between runoff and temperature and between runoff and precipitation in summer (Figure 13). According to the change in SCA (Figure 7 and Figure 8), the YRK, KRK, and YUK had a positive regression coefficient between temperature and runoff depth from June to July, but the KRK and YUK had much smaller regression coefficients between temperature and runoff depth in August than in June and July. On the basis of the main months when peak temperature (Table 3) occurred in the two basins, the average temperature in August was close to that in July and much higher than that in June. Therefore, the two basins should have had significant correlation between runoff depth and temperature in August in principle, but this was not the case. Results also showed that the relationship between runoff depth and temperature in the KRK and YUK in August did not conform to runoff yield and the concentration law of rivers dominated by glacier recharge. In addition, the YRK, KRK, and YUK had a smaller regression coefficient between runoff depth and precipitation than between runoff depth and temperature in summer, showing that temperature greatly influenced runoff depth in the three basins. However, when examining runoff depth, temperature, and precipitation (Figure 13(d1) or Figure 13(d2)), we found that the KRY had a larger regression coefficient between monthly precipitation and runoff depth than with temperature in summer, indicating that monthly runoff depth was mainly influenced by precipitation in the KRY in summer.
Zhao, et al. [71] suggested that the difference between the KRK and YUK might be caused by a decrease in upper air temperature that led to glacier ablation. However, Zhou, et al. [72] argued that the difference in site conditions led to the formation of a microclimate between regions, resulting in the mitigation of ice and snow melt. In this study, not all the different weather stations reflect the importance of microclimates. However, it can provide a reference for better research in this region. Therefore, the effects of topography, sudden disasters, and human activities should also be comprehensively considered for the difference in runoff between the two basins in summer.
4.3. Uncertainty Analysis
This study focused on investigating the annual and interannual snow-cover and runoff-change characteristics of four typical basins of the NSWKM and on analyzing their relationship with temperature and precipitation. However, snow melt was also affected by slope, slope direction, and type of surface cover. Additionally, snow was influenced by the distribution of wind speed and surface temperature. Although the data from ground-observation stations used in this study were representative of different basins, they were still unable to fully reflect the characteristics of climate change at different altitudes (e.g., precipitation was also affected by elevation, slope, and slope direction). In addition, we have not given sufficient consideration to the debris-covered area in our classification of glacier area. Although this area is small, it may affect our final results to some extent. In view of the above problems, we will adopt the new methods for further analysis in the following studies.
5. Conclusions
As one of the key factors that restrict the socioeconomic development of oases in arid areas of Northwest China, water resources mainly come from ice and snow meltwater in high mountains. Understanding the runoff-change law and the runoff-generation mechanism in the arid regions of Northwest China is very significant for understanding the water cycle in cold and arid regions. On the basis of meteorological and hydrological data from the observation stations from the last 60 years (1957–2017) and snow-cover data collected by MODIS (2001–2016) in the study area, we used various mathematical and statistical methods to study the relationship between temperature, precipitation, snow cover, and runoff in typical basins (i.e., the YRK, KRK, YUK, and KRY) on the NSWKM. The NSWKM has had increasing temperature (0.26 °C/decade) and precipitation (5.50 mm/decade) in the past 60 years, especially in the KRK and YUK (R2 > 0.82).
The average SCF of four typical basins in the NSWKM is: YUK (SCF = 44.14%) > YRK (SCF = 38.73%) > KRY (SCF = 33.42%) > KRK (SCF = 33.40%). From them, the YRK and YUK had decreasing SCA values (slope < −15.39), while the KRK and KRY had increasing SCA values (slope > 1.87). In seasonal variation, except for the SCF of YRK in spring being lower than that in winter (−2.6%), the SCF of the three other basins reached the maximum value in spring, with the most significant performance being in the YUK (SCF = 26.4%).
Variation in runoff depth in the four studied basins of the NSWKM showed an increasing trend. Between them, the YRK (5.78 mm/decade) had the most significant runoff depth, and the YUK (1.58 mm/decade) had the most insignificant increasing runoff depth. In the variation of monthly runoff depth, except for the maximum monthly runoff depth of the YRK that appeared in August, the maximum monthly runoff depth of the three other basins appeared in July. The cause was analyzed in combination with climate factors (e.g., temperature, precipitation) and snow-cover change. We found that temperature was the main factor affecting annual and monthly runoff variations in summer in the YRK, which was in agreement with the runoff-generation law for arid areas. However, temperature and precipitation were not the main factors affecting annual and monthly runoff variations in summer in the YUK and KRK. Therefore, runoff in the KRK and YUK is disturbed by other factors (e.g., slope and slope direction) during runoff generation, resulting in disruptions of the relationship between runoff and climate factors; hence, runoff changes in the KRK and YUK disagree with the runoff-generation law for rivers dominated by ice- and snow-meltwater recharge.
Author Contributions
Conceptualization, X.M., C.Z. and W.Y.; formal analysis, C.Z.; funding acquisition, C.Z.; methodology, X.M., W.Y. and Z.W.K.; resources, C.Z.; supervision, C.Z.; visualization, C.Z. and Z.W.K.; writing—original draft, X.M. and W.Y.; writing—review and editing, C.Z. and Z.W.K.
Funding
This research was funded by the Strategic Priority Research Program of the Chinese Academy of Sciences (XDA2006030201), the Natural Science Foundation of Jiangsu Province (BK20181059), the Key Project of National Natural Science Foundation (41671030), and the Young Backbone Teachers Assistance Scheme of Xinyang Normal University (2019GGJS-07).
Acknowledgments
The authors wish to thank Jingshi Liu, professor of Institute of Tibetan Plateau Research, Chinese Academy of Sciences, who provided the automatic-weather-station data. The authors are also grateful for the views of the reviewers and editors.
Conflicts of Interest
The authors declare no conflict of interest.
List of Acronyms
| Acronym | Full Name |
| AWS | Automatic Weather Station |
| DEM | Digital Elevation Models |
| GLOFs | Glacier Lake Outburst Floods |
| HS | Hydrological Station |
| KRK | Karakax River Basin |
| KRY | Keriya River Basin |
| M–K | Mann–Kendall Test |
| MODIS | Moderate Resolution Imaging Spectroradiometer |
| MOD10A2 | MODIS Product |
| MYD10A2 | MODIS Product |
| MRT | MODIS Reprojection Tool |
| NMS | National Meteorological Station |
| NSWKM | North Slope of the West Kunlun Mountains |
| SCA | Snow Cover Area |
| SCF | Snow cover fraction |
| SRTM | Shuttle Radar Topography Mission |
| TR | Tarim River |
| TP | Tibetan Plateau |
| UIB | Upper Indus River Basin |
| YRK | Yarkant River Basin |
| YUK | Yurungkax River Basin |
References
- Chen, Z.S.; Chen, Y.N. Effects of climate fluctuations on runoff in the headwater region of the Kaidu River in northwestern China. Front. Earth Sci. 2014, 8, 309–318. [Google Scholar] [CrossRef]
- Ragettli, S.; Immerzeel, W.W.; Pellicciotti, F. Contrasting climate change impact on river flows from high-altitude catchments in the Himalayan and Andes Mountains. Proc. Natl. Acad. Sci. USA 2016, 113, 9222–9227. [Google Scholar] [CrossRef] [Green Version]
- Barnett, T.P.; Adam, J.C.; Lettenmaier, D.P. Potential impacts of a warming climate on water availability in snow-dominated regions. Nature 2005, 438, 303–309. [Google Scholar] [CrossRef]
- Lutz, A.F.; Immerzeel, W.W.; Shrestha, A.B.; Bierkens, M.F.P. Consistent increase in High Asia’s runoff due to increasing glacier melt and precipitation. Nat. Clim. Chang. 2014, 4, 587–592. [Google Scholar] [CrossRef]
- Sun, C.J.; Yang, J.; Chen, Y.N.; Li, X.G.; Yang, Y.H.; Zhang, Y.Q. Comparative study of streamflow components in two inland rivers in the Tianshan Mountains, Northwest China. Environ. Earth Sci. 2016, 75, 14. [Google Scholar] [CrossRef]
- Chen, Y.N.; Xu, C.C.; Chen, Y.P.; Li, W.H.; Liu, J.S. Response of glacial-lake outburst floods to climate change in the Yarkant River basin on northern slope of Karakoram Mountains, China. Quat. Int. 2010, 226, 75–81. [Google Scholar] [CrossRef]
- Li, B.F.; Chen, Y.N.; Chen, Z.S.; Li, W.H. Trends in runoff versus climate change in typical rivers in the arid region of northwest China. Quat. Int. 2012, 282, 87–95. [Google Scholar] [CrossRef]
- Xu, C.C.; Chen, Y.N.; Chen, Y.P.; Zhao, R.F.; Ding, H. Responses of Surface Runoff to Climate Change and Human Activities in the Arid Region of Central Asia: A Case Study in the Tarim River Basin, China. Environ. Manag. 2013, 51, 926–938. [Google Scholar] [CrossRef]
- Immerzeel, W.W.; van Beek, L.P.H.; Bierkens, M.F.P. Climate Change Will Affect the Asian Water Towers. Science 2010, 328, 1382–1385. [Google Scholar] [CrossRef]
- Ji, F.; Wu, Z.H.; Huang, J.P.; Chassignet, E.P. Evolution of land surface air temperature trend. Nat. Clim. Chang. 2014, 4, 462–466. [Google Scholar] [CrossRef]
- Tao, H.; Gemmer, M.; Bai, Y.G.; Su, B.D.; Mao, W.Y. Trends of streamflow in the Tarim River Basin during the past 50 years: Human impact or climate change? J. Hydrol. 2011, 400, 1–9. [Google Scholar] [CrossRef]
- IPCC. The Physical Science Basis. Contribution of Working Group I to the Fifth Assessment Report of the Intergovernmental Panel on Climate Change. In Climate Change; Stocker, T.F., Qin, D., Plattner, G.-K., Tignor, M., Allen, S.K., Boschung, J., Nauels, A., Xia, Y., Bex, V., Midgley, P.M., Eds.; Cambridge University Press: Cambridge, UK; New York, NY, USA, 2013; p. 1535. [Google Scholar]
- Guo, D.L.; Wang, H.J. The significant climate warming in the northern Tibetan Plateau and its possible causes. Int. J. Climatol. 2012, 32, 1775–1781. [Google Scholar] [CrossRef]
- Ye, B.S.; Ding, Y.J.; Liu, F.J.; Liu, C.H. Responses of various-sized alpine glaciers and runoff to climatic change. J. Glaciol. 2003, 49, 1–7. [Google Scholar] [Green Version]
- Wu, H.B.; Wang, N.L.; Guo, Z.M.; Wu, Y.W. Regional glacier mass loss estimated by ICESat-GLAS data and SRTM digital elevation model in the West Kunlun Mountains, Tibetan Plateau, 2003–2009. J. Appl. Remote Sens. 2014, 8, 083515. [Google Scholar] [CrossRef]
- She, J.F.; Zhang, Y.F.; Li, X.G.; Chen, Y.N. Changes in snow and glacier cover in an arid watershed of the western Kunlun Mountains using multisource remote-sensing data. Int. J. Remote Sens. 2014, 35, 234–252. [Google Scholar] [CrossRef]
- Shangguan, D.; Liu, S.Y.; Ding, Y.J.; Ding, L.F.; Xu, J.L.; Jing, L. Glacier changes during the last forty years in the Tarim Interior River basin, northwest China. Prog. Nat. Sci. 2009, 19, 727–732. [Google Scholar] [CrossRef]
- Singh, S.; Kumar, R.; Bhardwaj, A.; Sam, L.; Shekhar, M.; Singh, A.; Kumar, R.; Gupta, A. Changing climate and glacio-hydrology in Indian Himalayan Region: A review. Wiley Interdiscip. Rev. Clim. Chang. 2016, 7, 393–410. [Google Scholar] [CrossRef]
- Zhang, S.Q.; Gao, X.; Zhang, X.W.; Hagemann, S. Projection of glacier runoff in Yarkant River basin and Beida River basin, Western China. Hydrol. Process. 2012, 26, 2773–2781. [Google Scholar] [CrossRef]
- Paudel, K.P.; Andersen, P. Monitoring snow cover variability in an agropastoral area in the Trans Himalayan region of Nepal using MODIS data with improved cloud removal methodology. Remote Sens. Environ. 2011, 115, 1234–1246. [Google Scholar] [CrossRef]
- Tian, G.L.; Xiao, D.H.; Cai, X.W.; Xing, Y.L.; Wen, L.L.; Zheng, G.G.; Ji, Z.R. An application of MODIS data to snow cover monitoring in a pastoral area: A case study in Northern Xinjiang, China. Remote Sens. Environ. 2008, 112, 1514–1526. [Google Scholar]
- Xu, C.C.; Chen, Y.N.; Li, W.H.; Chen, Y.P.; Ge, H.T. Potential impact of climate change on snow cover area in the Tarim River basin. Environ. Geol. 2008, 53, 1465–1474. [Google Scholar]
- Kumar, S.V.; Peters-Lidard, C.D.; Arsenault, K.R.; Getirana, A.; Mocko, D.; Liu, Y.Q. Quantifying the Added Value of Snow Cover Area Observations in Passive Microwave Snow Depth Data Assimilation. J. Hydrometeorol. 2015, 16, 1736–1741. [Google Scholar] [CrossRef]
- Kelly, R.E.; Chang, A.T.; Tsang, L.; Foster, J.L. A prototype AMSR-E global snow area and snow depth algorithm. IEEE Trans. Geosci. Remote Sens. 2003, 41, 230–242. [Google Scholar] [CrossRef] [Green Version]
- Atkinson, P.M.; Kelly, R.E.J. Scaling-up point snow depth data in the UK for comparison with SSM/I imagery. Int. J. Remote Sens. 1997, 18, 437–443. [Google Scholar] [CrossRef]
- Gusain, H.S.; Mishra, V.D.; Arora, M.K. Estimation of net shortwave radiation flux of western Himalayan snow cover during clear sky days using remote sensing and meteorological data. Remote Sens. Lett. 2014, 5, 83–92. [Google Scholar] [CrossRef]
- Liu, J.F.; Chen, R.S. Studying the spatiotemporal variation of snow-covered days over China based on combined use of MODIS snow-covered days and in situ observations. Theor. Appl. Climatol. 2011, 106, 355–363. [Google Scholar] [CrossRef]
- Hall, D.K.; Riggs, G.A.; Salomonson, V.V.; DiGirolamo, N.E.; Bayr, K.J. MODIS snow-cover products. Remote Sens. Environ. 2002, 83, 181–194. [Google Scholar] [CrossRef] [Green Version]
- Yasuda, T.; Furuya, M. Dynamics of surge-type glaciers in West Kunlun Shan, Northwestern Tibet. J. Geophys. Res. Earth Surf. 2015, 120, 2393–2405. [Google Scholar] [CrossRef]
- Gardelle, J.; Berthier, E.; Arnaud, Y.; Kaab, A. Region-wide glacier mass balances over the Pamir-Karakoram-Himalaya during 1999–2011. Cryosphere 2013, 7, 1885–1886. [Google Scholar] [CrossRef]
- Shi, Y.F.; Shen, Y.P.; Kang, E.; Li, D.L.; Ding, Y.J.; Zhang, G.W.; Hu, R.J. Recent and future climate change in northwest China. Clim. Change. 2007, 80, 379–393. [Google Scholar] [CrossRef]
- Xu, C.C.; Chen, Y.N.; Yang, Y.H.I.; Hao, X.M.; Shen, Y.P. Hydrology and water resources variation and its response to regional climate change in Xinjiang. J. Geogr. Sci. 2010, 20, 599–612. [Google Scholar] [CrossRef]
- Liu, X.M.; Zhang, D.; Luo, Y.Z.; Liu, C.M. Spatial and temporal changes in aridity index in northwest China: 1960 to 2010. Theor. Appl. Climatol. 2013, 112, 307–316. [Google Scholar] [CrossRef]
- Yao, T.D.; Thompson, L.; Yang, W.; Yu, W.S.; Gao, Y.; Guo, X.J.; Yang, X.X.; Duan, K.Q.; Zhao, H.B.; Xu, B.Q.; et al. Different glacier status with atmospheric circulations in Tibetan Plateau and surroundings. Nat. Clim. Chang. 2012, 2, 663–667. [Google Scholar] [CrossRef]
- Xu, J.H.; Chen, Y.N.; Li, W.H.; Yang, Y.; Hong, Y.L. An integrated statistical approach to identify the nonlinear trend of runoff in the Hotan River and its relation with climatic factors. Stoch. Environ. Res. Risk Assess. 2011, 25, 223–233. [Google Scholar] [CrossRef]
- Kan, B.Y.; Su, F.G.; Xu, B.Q.; Xie, Y.; Li, J.L.; Zhang, H.B. Generation of High Mountain Precipitation and Temperature Data for Quantitative Assessment of Flow Regime in the Upper Yarkant Basin in the Karakoram. J. Geophys. Res. Atmos. 2018, 123, 8462–8486. [Google Scholar] [CrossRef]
- Clift, P.D.; Zheng, H.B.; Carter, A.; Boning, P.; Jonell, T.N.; Schorr, H.; Shan, X.; Pahnke, K.; Wei, X.C.; Rittenour, T. Controls on erosion in the western Tarim Basin: Implications for the uplift of northwest Tibet and the Pamir. Geosphere 2017, 13, 1747–1765. [Google Scholar] [CrossRef] [Green Version]
- Kaab, A.; Treichler, D.; Nuth, C.; Berthier, E. Brief Communication: Contending estimates of 2003–2008 glacier mass balance over the Pamir-Karakoram-Himalaya. Cryosphere 2015, 9, 557–564. [Google Scholar] [CrossRef]
- Neckel, N.; Kropacek, J.; Bolch, T.; Hochschild, V. Glacier mass changes on the Tibetan Plateau 2003–2009 derived from ICES at laser altimetry measurements. Environ. Res. Lett. 2014, 9, 014009. [Google Scholar] [CrossRef]
- Zhang, G.Q.; Xie, H.J.; Yao, T.D.; Li, H.Y.; Duan, S.Q. Quantitative water resources assessment of Qinghai Lake basin using Snowmelt Runoff Model (SRM). J. Hydrol. 2014, 519, 976–987. [Google Scholar] [CrossRef]
- Kult, J.; Choi, W.; Keuser, A. Snowmelt runoff modeling: Limitations and potential for mitigating water disputes. J. Hydrol. 2012, 430, 179–181. [Google Scholar] [CrossRef]
- Matte, P.; Tapponnier, P.; Arnaud, N.; Bourjot, L.; Avouac, J.P.; Vidal, P.; Qing, L.; Pan, Y.S.; Yi, W. Tectonics of Western Tibet, between the Tarim and the Indus. Earth Planet. Sci. Lett. 1996, 142, 311–330. [Google Scholar] [CrossRef]
- Sun, C.J.; Li, X.G.; Chen, W.; Chen, Y.N. Climate change and runoff response based on isotope analysis in an arid mountain watershed of the western Kunlun Mountains. Hydrol. Sci. J. 2017, 62, 319–330. [Google Scholar] [CrossRef]
- Zan, J.B.; Fang, X.M.; Yang, S.L.; Nie, J.S.; Li, X.Y. A rock magnetic study of loess from the West Kunlun Mountains. J. Geophys. Res. Solid Earth 2010, 115, 007148. [Google Scholar] [CrossRef]
- Chen, Y.N.; Takeuchi, K.; Xu, C.C.; Chen, Y.P.; Xu, Z.X. Regional climate change and its effects on river runoff in the Tarim Basin, China. Hydrol. Process. 2006, 20, 2207–2216. [Google Scholar] [CrossRef]
- She, J.F.; Zhang, Y.F.; Li, X.G.; Feng, X.Z. Spatial and Temporal Characteristics of Snow Cover in the Tizinafu Watershed of the Western Kunlun Mountains. Remote Sens. 2015, 7, 3426–3445. [Google Scholar] [CrossRef] [Green Version]
- Xu, J.H.; Chen, Y.N.; Li, W.H.; Nie, Q.; Hong, Y.L.; Yang, Y. The nonlinear hydro-climatic process in the Yarkand River, northwestern China. Stoch. Environ. Res. Risk Assess. 2013, 27, 389–399. [Google Scholar] [CrossRef]
- Xu, Z.X.; Chen, Y.N.; Li, J.Y. Impact of climate change on water resources in the Tarim River basin. Water Resour. Manag. 2004, 18, 439–458. [Google Scholar] [CrossRef]
- Gottschalk, L.; Tallaksen, L.M.; Perzyna, G. Derivation of low flow distribution functions using recession curves. J. Hydrol. 1997, 194, 239–262. [Google Scholar] [CrossRef]
- Yu, K.X.; Xiong, L.H.; Gottschalk, L. Derivation of low flow distribution functions using copulas. J. Hydrol. 2014, 508, 273–288. [Google Scholar] [CrossRef]
- Zhao, H.L.; Guo, Y.R.; Zhou, R.L.; Drake, S. The effects of plantation development on biological soil crust and topsoil properties in a desert in northern China. Geoderma 2011, 160, 367–372. [Google Scholar] [CrossRef]
- Pu, Z.X.; Xu, L.; Salomonson, V.V. MODIS/Terra observed seasonal variations of snow cover over the Tibetan Plateau. Geophys. Res. Lett. 2007, 34, 029262. [Google Scholar] [CrossRef]
- Chen, Y.; Li, B.; Fan, Y.; Sun, C.; Fang, G. Hydrological and water cycle processes of inland river basins in the arid region of Northwest China. J. Arid Land 2019, 112, 161–179. [Google Scholar] [CrossRef]
- Yan, W.; Liu, J.S.; Zhang, M.X.; Hu, L.J.; Chen, J.J. Outburst flood forecasting by monitoring glacier-dammed lake using satellite images of Karakoram Mountains, China. Quat. Int. 2017, 453, 24–36. [Google Scholar] [CrossRef]
- Gao, Y.; Xie, H.J.; Yao, T.D.; Xue, C.S. Integrated assessment on multi-temporal and multi-sensor combinations for reducing cloud obscuration of MODIS snow cover products of the Pacific Northwest USA. Remote Sens. Environ. 2010, 114, 1662–1675. [Google Scholar] [CrossRef]
- Kendall, M.G. Rank Correlation Methods; Griffin: London, UK, 1975. [Google Scholar]
- Mann, H.B. Nonparametric Tests against Trend. Econometrica 1945, 13, 245–259. [Google Scholar] [CrossRef]
- Burn, D.H. Climatic influences on streamflow timing in the headwaters of the Mackenzie River Basin. J. Hydrol. 2008, 352, 225–238. [Google Scholar] [CrossRef]
- Wang, Y.D.; Liu, X.L.; Ren, G.X.; Yang, G.H.; Feng, Y.Z. Analysis of the spatiotemporal variability of droughts and the effects of drought on potato production in northern China. Agric. For. Meteorol. 2019, 264, 334–342. [Google Scholar] [CrossRef]
- Zhang, Q.; Xu, C.Y.; Tao, H.; Jiang, T.; Chen, Y.D. Climate changes and their impacts on water resources in the arid regions: A case study of the Tarim River basin, China. Stoch. Environ. Res. Risk Assess. 2010, 24, 349–358. [Google Scholar] [CrossRef]
- Beyers, J.H.M.; Sundsbo, P.A.; Harms, T.M. Numerical simulation of three-dimensional, transient snow drifting around a cube. J. Wind Eng. Ind. Aerodyn. 2004, 92, 725–747. [Google Scholar] [CrossRef]
- Li, B.F.; Chen, Y.N.; Chipman, J.W.; Shi, X.; Chen, Z.S. Why does the runoff in Hotan River show a slight decreased trend in northwestern China? Atmos. Sci. Lett. 2018, 19, e800. [Google Scholar] [CrossRef] [Green Version]
- Guo, H.W.; Ling, H.B.; Xu, H.L.; Guo, B. Study of suitable oasis scales based on water resource availability in an arid region of China: A case study of Hotan River Basin. Environ. Earth Sci. 2016, 75, 984. [Google Scholar] [CrossRef]
- Gao, T.G.; Zhang, T.J.; Cao, L.; Kang, S.C.; Sillanpaa, M. Reduced winter runoff in a mountainous permafrost region in the northern Tibetan Plateau. Cold Reg. Sci. Tech. 2016, 126, 36–43. [Google Scholar] [CrossRef]
- Liu, J.S.; Wang, S.Y.; Huang, Y.Y. Effect of climate change on runoff in a basin with mountain permafrost, northwest China. Permafr. Periglac. Process. 2007, 18, 369–377. [Google Scholar] [CrossRef]
- Ling, H.B.; Zhang, Q.Q.; Shi, W.; Xu, H.L. Runoff variation law and its response to climate change in the headstream area of the Keriya River basin, Xinjiang. J. Earth Sci. 2011, 22, 780–791. [Google Scholar] [CrossRef]
- Ling, H.B.; Xu, H.L.; Fu, J.Y. High- and low-flow variations in annual runoff and their response to climate change in the headstreams of the Tarim River, Xinjiang, China. Hydrol. Process. 2013, 27, 975–988. [Google Scholar] [CrossRef]
- Fujita, K.; Ohta, T.; Ageta, Y. Characteristics and climatic sensitivities of runoff from a cold-type glacier on the Tibetan Plateau. Hydrol. Process. 2007, 21, 2882–2891. [Google Scholar] [CrossRef]
- Yuan, Z.D.; Chen, J.; Owen, L.A.; Hedrick, K.A.; Caffee, M.W.; Li, W.Q.; Schoenbohm, L.M.; Robinson, A.C. Nature and timing of large landslides within an active orogen, eastern Pamir, China. Geomorphology 2013, 182, 49–65. [Google Scholar] [CrossRef]
- Kumar, R.; Singh, S.; Kumar, R.; Singh, A.; Bhardwaj, A.; Sam, L.; Randhawa, S.S.; Gupta, A. Development of a Glacio-hydrological Model for Discharge and Mass Balance Reconstruction. Water Resour. Manag. 2016, 30, 3475–3492. [Google Scholar] [CrossRef]
- Zhao, B.F.; Xu, J.H.; Chen, Z.S.; Bai, L.; Li, P. Air Temperature Change in the Southern Tarim River Basin, China, 1964–2011. Sci. World J. 2013, 2013, 894851. [Google Scholar] [CrossRef]
- Zhou, S.Q.; Kang, S.C.; Chen, F.; Joswiak, D.R. Water balance observations reveal significant subsurface water seepage from Lake Nam Co, south-central Tibetan Plateau. J. Hydrol. 2013, 491, 89–99. [Google Scholar] [CrossRef]
Figure 1.
Geographical location of West Kunlun Mountains.

Figure 2.
Correlation of daily temperature between hydrological or meteorological stations in mountainous areas and adjacent AWSs at high altitudes. (a) Yurung and Tongguziluoke, (b) Yurung and Heishan, (c) Kala and Wuluwati (d) Kala and Tuoman, (e) Shenxianwan and Tashkurgan.
Figure 2.
Correlation of daily temperature between hydrological or meteorological stations in mountainous areas and adjacent AWSs at high altitudes. (a) Yurung and Tongguziluoke, (b) Yurung and Heishan, (c) Kala and Wuluwati (d) Kala and Tuoman, (e) Shenxianwan and Tashkurgan.

Figure 3.
Correlation of monthly precipitation in summer between different hydrological and meteorological stations in mountainous areas. (a) Tongguziluoke and Heishan, (b) Yurung and Heishan, (c) Wuluwati and Tuoman, (d) Tashkurgan and Kulukelangan.
Figure 3.
Correlation of monthly precipitation in summer between different hydrological and meteorological stations in mountainous areas. (a) Tongguziluoke and Heishan, (b) Yurung and Heishan, (c) Wuluwati and Tuoman, (d) Tashkurgan and Kulukelangan.

Figure 4.
Flowchart of eliminating cloud pixels in snow-cover images.

Figure 5.
Annual mean temperature of weather stations and hydrological stations on the NSWKM from 1957 to 2017. NSWKM data are average data of all meteorological and hydrological stations (A1–J1).
Figure 5.
Annual mean temperature of weather stations and hydrological stations on the NSWKM from 1957 to 2017. NSWKM data are average data of all meteorological and hydrological stations (A1–J1).

Figure 6.
Annual mean precipitation of weather stations and hydrological stations on the NSWKM from 1957 to 2017. NSWKM data are average data of all meteorological and hydrological stations (A–J in Figure 1).
Figure 6.
Annual mean precipitation of weather stations and hydrological stations on the NSWKM from 1957 to 2017. NSWKM data are average data of all meteorological and hydrological stations (A–J in Figure 1).

Figure 7.
Snow cover area (SCA) changes (average, maximum, and minimum) in the (a) YRK, (b) KRK, (c) YUK, and (d) KRY in 2001–2016.
Figure 7.
Snow cover area (SCA) changes (average, maximum, and minimum) in the (a) YRK, (b) KRK, (c) YUK, and (d) KRY in 2001–2016.

Figure 8.
Snow-cover fraction (SCF) of the (a) YRK, (b) KRK, (c) YUK, and (d) KRY at different altitudes in 2001–2016. (e) Seasonal SCF variation in these basins. Spring: March to May; summer: June to August; autumn: September to November; and winter: December to February.
Figure 8.
Snow-cover fraction (SCF) of the (a) YRK, (b) KRK, (c) YUK, and (d) KRY at different altitudes in 2001–2016. (e) Seasonal SCF variation in these basins. Spring: March to May; summer: June to August; autumn: September to November; and winter: December to February.

Figure 9.
Runoff depth variation of the (a) YRK, (b) KRK, (c) YUK, and (d) KRY in 1957–2017.

Figure 10.
Variations in monthly mean runoff depth.

Figure 11.
Results of Mann-Kendall (M–K) trend test of monthly and annual runoff depth during 1957–2017 of the (a) YRK, (b) KRK, (c) YUK, and (d) KRY. The top of bars represents the runoff depth change rate in mm/decade, the numbers in bars represent the change point year, and the dotted lines represent the critical Zc at a significance level of 0.05.

Figure 12.
M–K change point test of annual runoff depth in the (a) YRK, (b) KRK, (c) YUK, and (d) KRY in 1957–2017.
Figure 12.
M–K change point test of annual runoff depth in the (a) YRK, (b) KRK, (c) YUK, and (d) KRY in 1957–2017.

Figure 13.
Regression analyses between monthly runoff and mean air temperature (left column) and precipitation (right column) of the (a1,a2) YRK, (b1,b2) KRK, (c1,c2) YUK, and (d1,d2) KRY in summer.
Figure 13.
Regression analyses between monthly runoff and mean air temperature (left column) and precipitation (right column) of the (a1,a2) YRK, (b1,b2) KRK, (c1,c2) YUK, and (d1,d2) KRY in summer.


Table 1.
Information from stations (Automatic Weather Station (AWS), National Meteorological Station (NMS), and Hydrological Station (HS)) in the north slope of the West Kunlun Mountains (NSWKM).
Table 1.
Information from stations (Automatic Weather Station (AWS), National Meteorological Station (NMS), and Hydrological Station (HS)) in the north slope of the West Kunlun Mountains (NSWKM).
| Basin | Station | Type | Longitude (°) | Latitude (°) | Elevation (m) | Basin Area (km2) | Glacier Area (km2) |
|---|---|---|---|---|---|---|---|
| YRK | Kaqun | HS | 37.98 | 76.90 | 1370 | 46,635 | 5145 |
| Kulukelangan | HS | 37.73 | 76.22 | 2000 | 29,397 | 4462 | |
| Tashkurgan | NMS | 37.77 | 75.23 | 3090 | |||
| Shenxianwan | AWS | 35.63 | 77.68 | 4953 | |||
| Shache | NMS | 38.43 | 77.27 | 1231 | |||
| KRK | Kala | AWS | 36.42 | 77.72 | 4482 | ||
| Wuluwati | HS | 36.87 | 79.43 | 1850 | 19,891 | 1920 | |
| Pishan | NMS | 37.62 | 78.28 | 1375 | |||
| Tuoman | NMS | 37.03 | 78.88 | 2145 | 18,119 | 1919 | |
| YUK | Yurung | AWS | 36.25 | 79.80 | 3670 | ||
| Tongguziluoke | HS | 36.82 | 79.92 | 1650 | 14,820 | 2921 | |
| Hotan | NWS | 37.13 | 79.93 | 1375 | |||
| Heishan | NWS | 36.25 | 79.77 | 2460 | 10,948 | 2877 | |
| KRY | Yutian | NWS | 36.85 | 81.65 | 1422 | ||
| Keriya | HS | 36.47 | 81.47 | 1880 | 8312 | 682 |
Note: Tuoman and Heishan stations are seasonal observation stations, operating only from June to August. Basin area is based on shuttle radar topography mission (SRTM)-obtained digital-elevation-model (DEM) data extraction, and glacier area comes from the Second Glacier Inventory Dataset of China.
Table 2.
Validation of eliminating cloudy pixels (unit: %).
| Date | OCC | Two-Satellite Synthesis | Entrance-Glacier Boundary | FR | ||||||
|---|---|---|---|---|---|---|---|---|---|---|
| TECP | CC | OE | UE | TECP | CC | OE | UE | |||
| 2005145 | 43.07 | 42.49 | 39.05 | 0.39 | 3.05 | 28.85 | 28.84 | 0.01 | 0.00 | 71.34 |
| 2008097 | 34.98 | 33.41 | 29.17 | 0.70 | 3.54 | 37.22 | 37.10 | 0.12 | 0.00 | 70.63 |
| 2009129 | 35.60 | 61.45 | 55.32 | 2.26 | 3.87 | 25.80 | 25.76 | 0.03 | 0.00 | 87.25 |
| 2010129 | 36.22 | 56.58 | 50.68 | 0.23 | 5.67 | 23.96 | 23.92 | 0.04 | 0.00 | 80.54 |
| 2011089 | 34.10 | 49.14 | 46.12 | 0.85 | 2.17 | 27.27 | 27.24 | 0.02 | 0.00 | 76.41 |
| Mean | 48.61 | 44.07 | 0.89 | 3.66 | 28.62 | 28.57 | 0.04 | 0.00 | 77.23 | |
Note: OCC, original with cloud cover; TECP, total eliminated cloudy pixels; CC, correct classification; OE, overestimation; UE, underestimation; FR, final result.
Table 3.
Frequency of occurrence of minimum and maximum monthly discharge in each month (unit: %).
| Basin | Monthly Mean Minimum Runoff | Monthly Mean Maximum Runoff | ||||||||
|---|---|---|---|---|---|---|---|---|---|---|
| Jan | Feb | Mar | Apr | May | Nov | Dec | Jun | Jul | Aug | |
| YRK | 7.9 | 19.0 | 30.2 | 38.1 | 3.2 | 0.0 | 1.6 | 0.0 | 34.4 | 65.6 |
| KRK | 67.7 | 21.0 | 1.6 | 0.0 | 0.0 | 0.0 | 9.7 | 1.6 | 62.3 | 36.1 |
| YUK | 29.5 | 36.1 | 19.7 | 0.0 | 0.0 | 0.0 | 14.8 | 0.0 | 45.9 | 54.1 |
| KRY | 23.0 | 26.2 | 14.8 | 0.0 | 0.0 | 1.6 | 34.4 | 0.0 | 54.1 | 45.9 |
Table 4.
Pearson correlation coefficients and partial correlation coefficients between annual runoff (R) and mean air temperature (T) and precipitation (P) in four basins.
Table 4.
Pearson correlation coefficients and partial correlation coefficients between annual runoff (R) and mean air temperature (T) and precipitation (P) in four basins.
| Basin/Correlation Coefficient | R-T | R-T|P | R-P | R-P|T | T-P |
|---|---|---|---|---|---|
| YRK | 0.360 * | 0.356 * | −0.063 | −0.023 | −0.156 |
| KRK | −0.116 | −0.207 | −0.367 * | −0.400 ** | −0.198 |
| YUK | 0.110 | 0.107 | 0.067 | 0.063 | 0.046 |
| KRY | 0.250 | 0.277 * | 0.411 *** | 0.426 *** | −0.006 |
Note: ***, **, and *, significance levels of 0.001, 0.01, and 0.05, respectively. |, partial correlation analysis between R and removal of P (|P) or T (|T).
© 2019 by the authors. Licensee MDPI, Basel, Switzerland. This article is an open access article distributed under the terms and conditions of the Creative Commons Attribution (CC BY) license (http://creativecommons.org/licenses/by/4.0/).
Share and Cite
MDPI and ACS Style
Ma, X.; Yan, W.; Zhao, C.; Kundzewicz, Z.W. Snow-Cover Area and Runoff Variation under Climate Change in the West Kunlun Mountains. Water 2019, 11, 2246. https://doi.org/10.3390/w11112246
AMA Style
Ma X, Yan W, Zhao C, Kundzewicz ZW. Snow-Cover Area and Runoff Variation under Climate Change in the West Kunlun Mountains. Water. 2019; 11(11):2246. https://doi.org/10.3390/w11112246
Chicago/Turabian StyleMa, Xiaofei, Wei Yan, Chengyi Zhao, and Zbigniew W. Kundzewicz. 2019. "Snow-Cover Area and Runoff Variation under Climate Change in the West Kunlun Mountains" Water 11, no. 11: 2246. https://doi.org/10.3390/w11112246
Note that from the first issue of 2016, this journal uses article numbers instead of page numbers. See further details here.