Evaluating the Impacts of Climate Change and Vegetation Restoration on the Hydrological Cycle over the Loess Plateau, China


1
Key Laboratory of Water Cycle and Related Land Surface Processes, Institute of Geographical Sciences and Natural Resources Research, Chinese Academy of Sciences, Beijing 100101, China
2
University of the Chinese Academy of Sciences, Beijing 100049, China
*
Author to whom correspondence should be addressed.
Water 2019, 11(11), 2241; https://doi.org/10.3390/w11112241
Submission received: 20 September 2019
/
Revised: 17 October 2019
/
Accepted: 23 October 2019
/
Published: 26 October 2019
(This article belongs to the Section Hydrology)
Abstract
:In recent decades, both observation and simulation data have demonstrated an obvious decrease in runoff and soil moisture, with increasing evapotranspiration, over the Loess Plateau. In this study, we employed a Variable Infiltration Capacity model coupled with scenario simulation to explore the impact of change in climate and land cover on four hydrological variables (HVs) over the Loess Plateau, i.e., evapotranspiration (ET), runoff (Runoff), shallow soil moisture (SM1), and deep soil moisture (SM2). Results showed precipitation, rather than temperature, had the closest relationship with the four HVs, with r ranging from 0.76 to 0.97 (p < 0.01), and this was therefore presumed to be the dominant climate-based driving factor in the variation of hydrological regimes. Vegetation conversion, from cropland and grassland to woodland, significantly reduced runoff and increased soil moisture consumption, to sustain an increased ET, and, assuming that the reduction of SM2 is entirely evaporated, we can attribute 71.28% ± 18.64%, 65.89% ± 24.14% of the ET increase to the water loss of SM2 in the two conversion modes, respectively. The variation in HVs, induced by land cover change, were higher than the expected climate change with respect to SM1, while different factors were selected to determine HVs variation in six catchments, due to differences in the mode and intensity of vegetation conversion, and the degree of climate change. Our findings are critical for understanding and quantifying the impact of climate change and vegetation conversions, and provide a further basis for the design of water resources and land-use management strategies with respect to climate change, especially in the water-limited Loess Plateau.
1. Introduction
Climate and land cover are the two main factors regulating global and regional hydrological cycles [1,2]. Climate, which is primarily represented by the spatial–temporal distribution of net radiance, precipitation, temperature, and wind speed, controls the water flux and state of land [3]. Land cover, especially various vegetation classes, plays a key role in influencing the water and energy balance at the land surface, affecting a series of hydrologic processes, including precipitation, interception, runoff, transpiration, and evaporation [4]. Many studies have found that the hydrological cycle in many regions worldwide changes significantly in the context of climate change and land cover change [5,6]. Generally, changes in climate, especially precipitation, directly influence the amount of water input and output in a region, while change in land cover affects the timing and magnitude of evaporative losses to the atmosphere, the amount of water yield that governs soil moisture content, runoff, and baseflow patterns of regional hydrologic responses, by altering surface roughness [7].
Due to its low vegetation cover, frequent high-rainfall storms in the summer months, highly erodible loessal soil, steep topography, and long history of intensive cultivation and unsustainable land use, the Loess Plateau has one of the most severe soil erosion and heavy sediment loads in the world [8,9]. A series of soil and water conservation measures and projects have been implemented to control severe soil erosion and improve the ecological environment, including afforestation, pasture reestablishment, terraces, and check dams. Since the implementation of Grain for Green Project (GGP), a large reforestation campaign that involved converting steep croplands to forest and pasture lands, launched in 1999, the Loess Plateau has experienced extensive land cover changes. Vegetation coverage on the Loess Plateau exhibits an overall increase, after the implementation of large-scale ecological restoration [10]. However, with increased water consumption from the introduced vegetation, negative ecohydrological impacts have been reported, including runoff reduction [8,11,12], soil moisture deficit [13,14] and ecosystem degradation, such as stunted or “small old” trees, and even plant mortality [15]. Meanwhile, a climatic warming and drying trend, with reduced precipitation and increased potential evapotranspiration and temperature, has been detected in the Loess Plateau since the 1950s [16,17]. Numerous studies have been conducted to investigate the change in hydrological regimes induced by changes in climate and land cover, aimed at streamflow, evapotranspiration, soil moisture, water yield, etc. [11,18,19,20,21,22]. The streamflow within the Loess Plateau has exhibited an obvious declining trend over the past six decades [6,23,24,25]. A decline in average water yield (that is, the ratio of annual river runoff to precipitation) was detected across 32 observed catchments in the Loess Plateau, ranging from 8%, during the period 1980–1999, to 5% during the period 2000–2010 [26]. A study by Li et al. [27] found that a higher evapotranspiration rate from restored vegetation is the primary reason for the reduced runoff coefficient. A study by Feng et al. [26] found that satellite-derived evapotranspiration (ET) increased with a trend of 4.3 ± 1.7 mm·yr−2 in the period 2000–2010, and the increase of ET in revegetated areas was apparently higher than in adjacent unconverted cropland and the whole of the Loess Plateau, which indicated a positive driving effect of revegetation, contributing to an increase in ET. Soil moisture is a key factor in the process of terrestrial water cycles. Substantial spatial–temporal heterogeneity and lack of observation data preclude investigations into soil moisture, especially those relating to variability and response. In recent years, many researchers have carried out field experiments of multi-layer soil moisture in several catchments across the Loess Plateau, and accumulated abundant data [28,29]. Studies on the response of soil moisture to vegetation restoration have come to the relatively consistent conclusion that increased vegetation, especially afforestation, consumed excessive soil moisture and caused a notable decline in soil moisture, widely detected across the Loess Plateau [14,30,31,32,33,34]. A stable dry soil layer has been formed in some areas of the Loess Plateau, which exemplifies an expanding and intensifying trend [35,36,37]. Microwave remote sensing-based surface soil moisture also shows significant decreases from the period 1988–2010 over the majority of the Loess Plateau [15]. All these studies have demonstrated that changes in climate and land cover have a profound and drastic influence on hydrological cycles.
Additionally, more and more studies attempt to isolate the hydrological impacts of climate change and land use/cover change, and further identify their respective contributions, based on various methods, including paired catchment approach [19], empirical statistical methods [38], physically-based hydrological models, elasticity, or sensitivity-based method [11,22,24] and decomposition method [38]. A study by Zhang et al. [8] used the climate elasticity approach to explore the reasons for streamflow reduction in 11 catchments of the Loess Plateau, between the period 1950–2000, and found that land use/cover changes accounted for more than 50% of the reduction in eight of the 11 catchments, while climate played a more important role in the three remaining catchments. Using Budyko’s curve equation and linear regression analysis, Zhao et al. [23] indicated that human activities accounted for the majority of the streamflow changes in most of the tributaries in the middle reaches of the Yellow River basin in the period 1950–2010. With the time–trend analysis method and sensitivity-based approach, Gao et al. [24] found that, on average, 70% of the streamflow reduction in the Loess Plateau between the 1950s and 2010 resulted from land use changes. Different and opposite results, with varying degrees of change in hydrological regime and the contribution of each driving factor, were acquired, due to differences in study periods, regions, methods and dataset, indicating an enormous amount of complexity and challenge in this field of study [39]. In general, the enhanced impact of human activities on hydrologic processes has been widely confirmed and accepted.
However, few studies gave an explicit analysis of how changes in land cover, including conversions between different land cover types and shifts in the geographic extent of those land cover types, have affected regional hydrology. Most studies only focused on single hydrological variables, and hydrological effect was divided, due to a lack of systematic simulation of hydrology cycles, which may lead to a unilateral understanding of hydrological response to climate change and land cover change. How land cover changes influence hydrological processes, i.e., changes in precipitation distribution processes and ratio of runoff, evapotranspiration, and soil moisture, is still unclear, and further exploration is needed to achieve sustainable ecosystem restoration services, and ensure the security of water resources in the Loess Plateau.
Therefore, this study employed the variable infiltration capacity (VIC) model with the scenario simulation analysis method and focused on four key hydrological variables (called hydrological variables (HVs) hereafter) in the hydrologic cycle, i.e., evapotranspiration (ET), runoff (Runoff), shallow soil moisture (SM1) and deep soil moisture (SM2). The specific objectives were to (1) derive the spatial and temporal dynamics of the four HVs; (2) detect the response of the four HVs to climate change in three vegetation types (cropland, grassland and woodland); (3) explore the impact of three typical vegetation conversion modes (cropland to grassland, cropland to woodland, grassland to woodland) on the four HVs; (4) attribute the variation in hydrologic variables, induced by climate change (CC) and land cover change (LUCC), in the Loess Plateau and six catchments.
2. Materials and Methods
2.1. Study Area
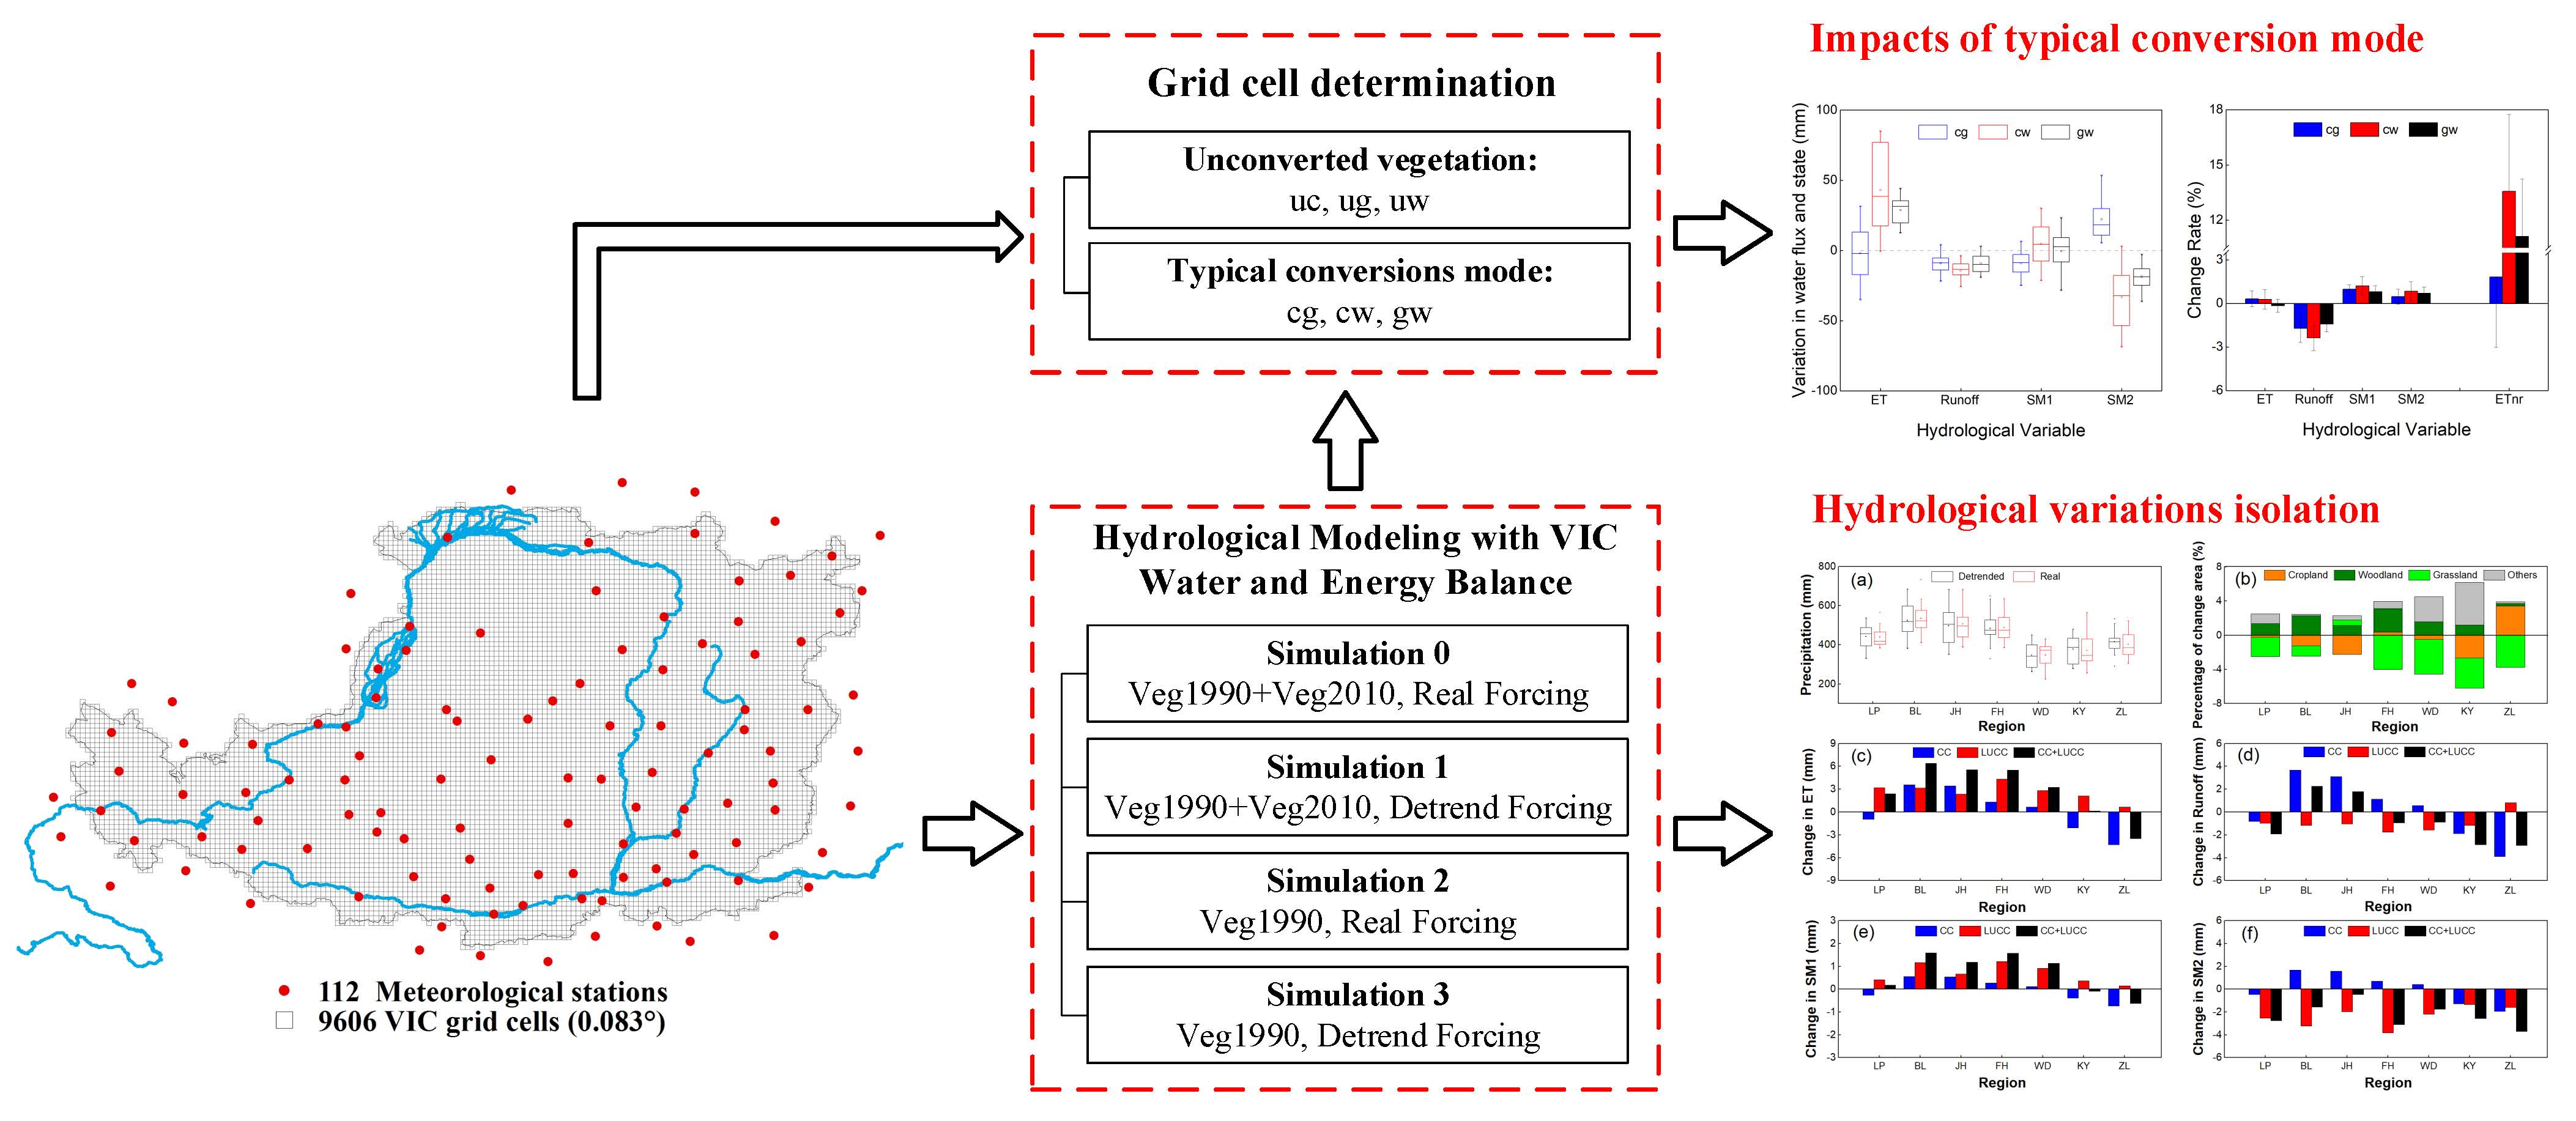
The Loess Plateau (Figure 1), located in the upper and middle reaches of the Yellow River (100°54′–114°33′ E and 33°43′–41°16′ N), covers approximately 640,000 km2, and is characterized by its thick loess soils with a depth of 30 m to 80 m [40]. It is a typical semiarid and arid climate, with mean annual precipitation varying from 150 mm·yr−1 in the northwest to 800 mm·yr−1 in the southeast, and a mean value of about 450 mm·yr−1. It is a typical water-limited landscape, with evaporation accounting for 85% of the precipitation, and this percentage increases along the precipitation gradient [26]. About 55%–78% of the annual precipitation falls during the main vegetation growing season between June and September, much of it in high-intensity rainstorms [41]. Precipitation is the primary water source for local vegetation, as groundwater depth in the Loess Plateau is typically deeper than 20 m below the land surface [42]. During the period 1961–2010, the trends of annual mean temperature and precipitation in the Loess Plateau were 0.29 ± 0.1 °C/decade and −11.03 ± 13 mm/decade, indicating an obvious warming and drying climate [17].
The Loess Plateau of China is well known for severe soil erosion and heavy sediment load because of its low vegetation cover, frequent high-rainfall storms in summer months, highly erodible loessal soil, steep topography, and long history of intensive cultivation and unsustainable land use [8]. Besides the Loess Plateau, another six catchments, with different levels of climate change and land cover change, were selected to analyze the effects of CC and LUCC on hydrologic processes in detail.
2.2. VIC Model Set up and Calibration
2.2.1. Model Description
In this study, the Variable Infiltration Capacity (VIC) [43,44] model is employed, to simulate hydrologic processes in the Loess Plateau. VIC model is a physically-based macroscale hydrologic model, which has been applied in many basins all over the world [45,46,47,48,49]. As a semi-distributed hydrological model, it is able to resolve the complete water and energy balance of multiple land cover classes within each computational grid cell using a mosaic-type vegetation scheme. In this study, the Loess Plateau is divided into 9606 grid cells with a spatial resolution of 0.083° × 0.083°. The representation is relatively detailed, including multiple evaporation and transpiration pathways, snow accumulation and melt, and soil freeze/thaw in three soil layers [44], and 10 thermal nodes, with a thermal damping depth of 4 m, with the finite difference solution technique [50]. The variable infiltration curve is used to consider the spatial heterogeneity of the runoff generation [51]. ET and runoff are simulated for each type of land cover separately, and a weighted average, using the fractions of vegetation types, is calculated, to obtain grid–cell average ET and runoff. Baseflow, which only happens in the third layer, is described by ARNO model [52]. A conceptual surface runoff model with Philip infiltration formulation is used to generate runoff from the first and second layers [53,54]. A separate routing model (RVIC) is coupled with VIC model to simulate streamflow [55,56], where the runoff generated in each grid cell is routed to selected points through the channel network [57].
2.2.2. Model Calibration and Validation
The six parameters of the VIC model are difficult to determine and thus require calibration, namely the variable infiltration curve parameter (), the maximum velocity of base flow (), the fraction of where non-linear base flow begins (), the fraction of maximum soil moisture where non-linear baseflow occurs (), and the thickness of two soil moisture layers (, = 2, 3).
The VIC model was calibrated by adjusting the six parameters individually to optimize the objective function, which compared the simulated and observed streamflow [47]. We set 1960 to 1964 as the warm-up period, 1965 to 1974 as the calibration period, and 1975 to 1984 as the validation period for each catchment. The Nash–Sutcliffe coefficient () and relative bias (BIAS) were employed as the optimal functions for the model calibration and validation:
where and are the simulated and observed streamflow series (m3/s), and and are the respective mean values.
2.3. Data Acquisition and Processing
2.3.1. Input Data
The data for driving VIC model contained two parts, i.e., forcing data and parameter database. Daily meteorological data of 112 stations within or around the Loess Plateau, obtained from China Meteorological Administration (CMA), were used in this study, which consisted of four variables: precipitation, maximum and minimum temperature, and wind speed for the period 1960–2015. These stations were selected based on data quality controls, to exclude stations with abnormal values. The meteorological data was interpolated to each 0.083° × 0.083° grid by a linear interpolation method, in which an inverse squared distance between the stations and the center of the target grid was used as a weight to transfer the meteorological variables from the station to the target grid [47]. Notably, to reflect the decrease in temperature with increasing elevation, the temperature data of each station were adjusted to the same elevation as the target grid, using a lapse rate of −6.5 °C·km−1 with respect to the elevation difference between the station and the target grid [58]. In addition, a trend-removed meteorological forcing data was generated, based on the interpolated dataset, following the method mentioned in previous studies [18,59].
The vegetation parameters were derived from land use/cover data (100 m), based on the Landsat TM data, acquired from the Resource and Environment Data Cloud Platform (RESDC), Chinese Academy of Sciences (http://www.resdc.cn) [60]. Two land use and land cover (LULC) maps for the two representative years of 1990 and 2010 were employed, to characterize the vegetation condition before and after 1999. Additionally, the primary characteristic of land cover that affected hydrologic fluxes in VIC model was LAI. To make the LAI more reasonable, to reflect the land cover change of each grid, two LAI datasets of period 1984–1999 and 2000–2015 were produced by GIMMS LAI, obtained from the Advanced Very High-Resolution Radiometer (AVHRR) satellites. Both LAI datasets contained 12-month LAI of each VIC grid and restored vegetation parameter files. Based on the two LULC maps and the LAI datasets, two sets of vegetation parameters (namely vege1990, vege2010) for different periods were produced for VIC simulation. The soil parameters were derived from Soil Map Based Harmonized World Soil Database (HWSD v1.1). For each 0.083° × 0.083° grid cell, the dominant soil type was used. The soil parameters that were not available from the soil data set were calculated according to methods by Saxton and Rawls [61]. Elevation data obtained from the Shuttle Radar Topography Mission (SRTM) high-resolution digital elevation dataset was used to extract each catchment and delineate river networks.
2.3.2. Other Data for Evaluation
Additionally, some other data were employed for model calibration, validation and further evaluations of model performance. The streamflow data from the period 1960–2015 of 16 hydrologic stations were obtained from the Annual Hydrological Report for P.R. China. Soil moisture observations for 28 stations across the Loess Plateau were obtained from the China Meteorology Administration (http://data.cma.cn/data/). The surface soil saturation degree (as a percentage) was presented as the 10-days average for 10, 20, 50, 70, and 100 cm depths from 1992 to 2007. Mean value of soil moisture at 20, 50, 70, and 100 cm depths was calculated as the average soil moisture of 10–100 cm depth. Close attention was paid, to ensure the observed soil moisture was expressed in gravimetric water content (kg/kg), which differed from the flux data of VIC with volumetric unit. Therefore, we focused on temporal variations rather than their absolute values [62] and employed the anomaly of soil moisture, calculated by the ratio of difference between observed and mean soil moisture to mean soil moisture, in the following evaluation. A three-layers (0–5 cm, 5–20 cm, 20–100 cm) of the soil moisture data with 0.25° × 0.25° resolution during 2002–2011 was provided by Yang [63], estimated through a Dual-Pass Microwave Land Data Assimilation System (ITPLDAS). For ET evaluation, we used three ET products derived from different methods, i.e., MOD16A2 [64], Zhang Ke ET datasets [65] and Jung global land ET product (http://www.bgc-jena.mpg.de/geodb/projects/Data.php) [66]. MOD16A2 and Zhang Ke ET datasets were estimated by diagnostic models, and used remote sensed vegetation information as an important input, using the Penman–Monteith (PM) algorithm (Zhang et al.; Mu et al.). Another ET dataset was Jung global land ET product, which was produced by upscaling FLUXNET observations from 198 global flux monitoring towers to the global scale, using a data-adaptive machine learning technique (i.e., model tree ensembles, MTE).
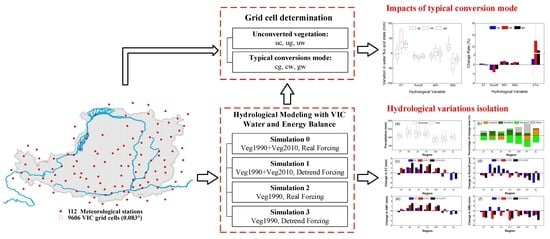
2.4. Scenario Simulation Design and Analysis
In this study, we focused on four key hydrological variables (HVs), i.e., evapotranspiration (ET), runoff (Runoff), shallow soil moisture (SM1, 0–50 cm), and deep soil moisture (SM2, 50–200 cm). Four scenarios, with different vegetation parameters and climate conditions, were adopted, to investigate the impact of CC and LUCC on hydrological processes (Table 1). The scenario0 (S0), using two vegetation parameters for two periods before and after 1999, and the real climate conditions of the period 1984–2015, simulated the real hydrological cycle, and was further used to detect the variations in hydrological fluxes and states during the period 1984–2015, as shown in Section 3.1 and Section 3.2. The scenario1 (S1) also used two vegetation parameters as input, as well as detrended meteorological variables. Scenario2 (S2) and scenario3 (S3) both used one vegetation parameter (veg1990) for the whole period, without respect to LUCC, but used real and detrended meteorological variables, respectively.
The simulation in S2 was a continuous time series dataset and correlation analysis, employed to detect the relationship between climate and hydrologic processes, and the variations in forcing data and simulation in S0 and S1 were used to explore the driving effects of CC on HVs, as shown in Section 3.3.1. The variations of simulation in S0 and S2 for the period 2000–2015 were induced by LUCC, as discussed in Section 3.3.2. In Section 3.4, six catchments, with different levels of CC and LUCC, were selected, to analyze the impacts of CC and LUCC on the hydrologic cycle in detail. Compared with S0, meteorological variables in S1 were detrended to identify the effect of CC. The vegetation parameter in S2 was static and the same as that of the period 1984–1999 (Veg1990) to identify the effect of LUCC, while S3 employed both static vegetation parameters and detrended meteorological variables, which simulated the hydrologic processes without CC and LUCC, to identify the co-effects of CC and LUCC. The effects were separated based on the scenario simulations, calculated as follows:
where , , and are the mean value of four HVs under scenarios S0, S1, S2, and S3, respectively. As set in the vegetation parameters and meteorological forcing data, , and were the variations in HVs between S1, S2, S3, and S0 for the period 2000–2015, treated as contributions of CC, LUCC, and co-effects of CC and LUCC, respectively. A positive value represents an increase of each HV, while a negative value represents a decline.
3. Results
3.1. Evaluation of Model Performance
3.1.1. Model Calibration and Validation
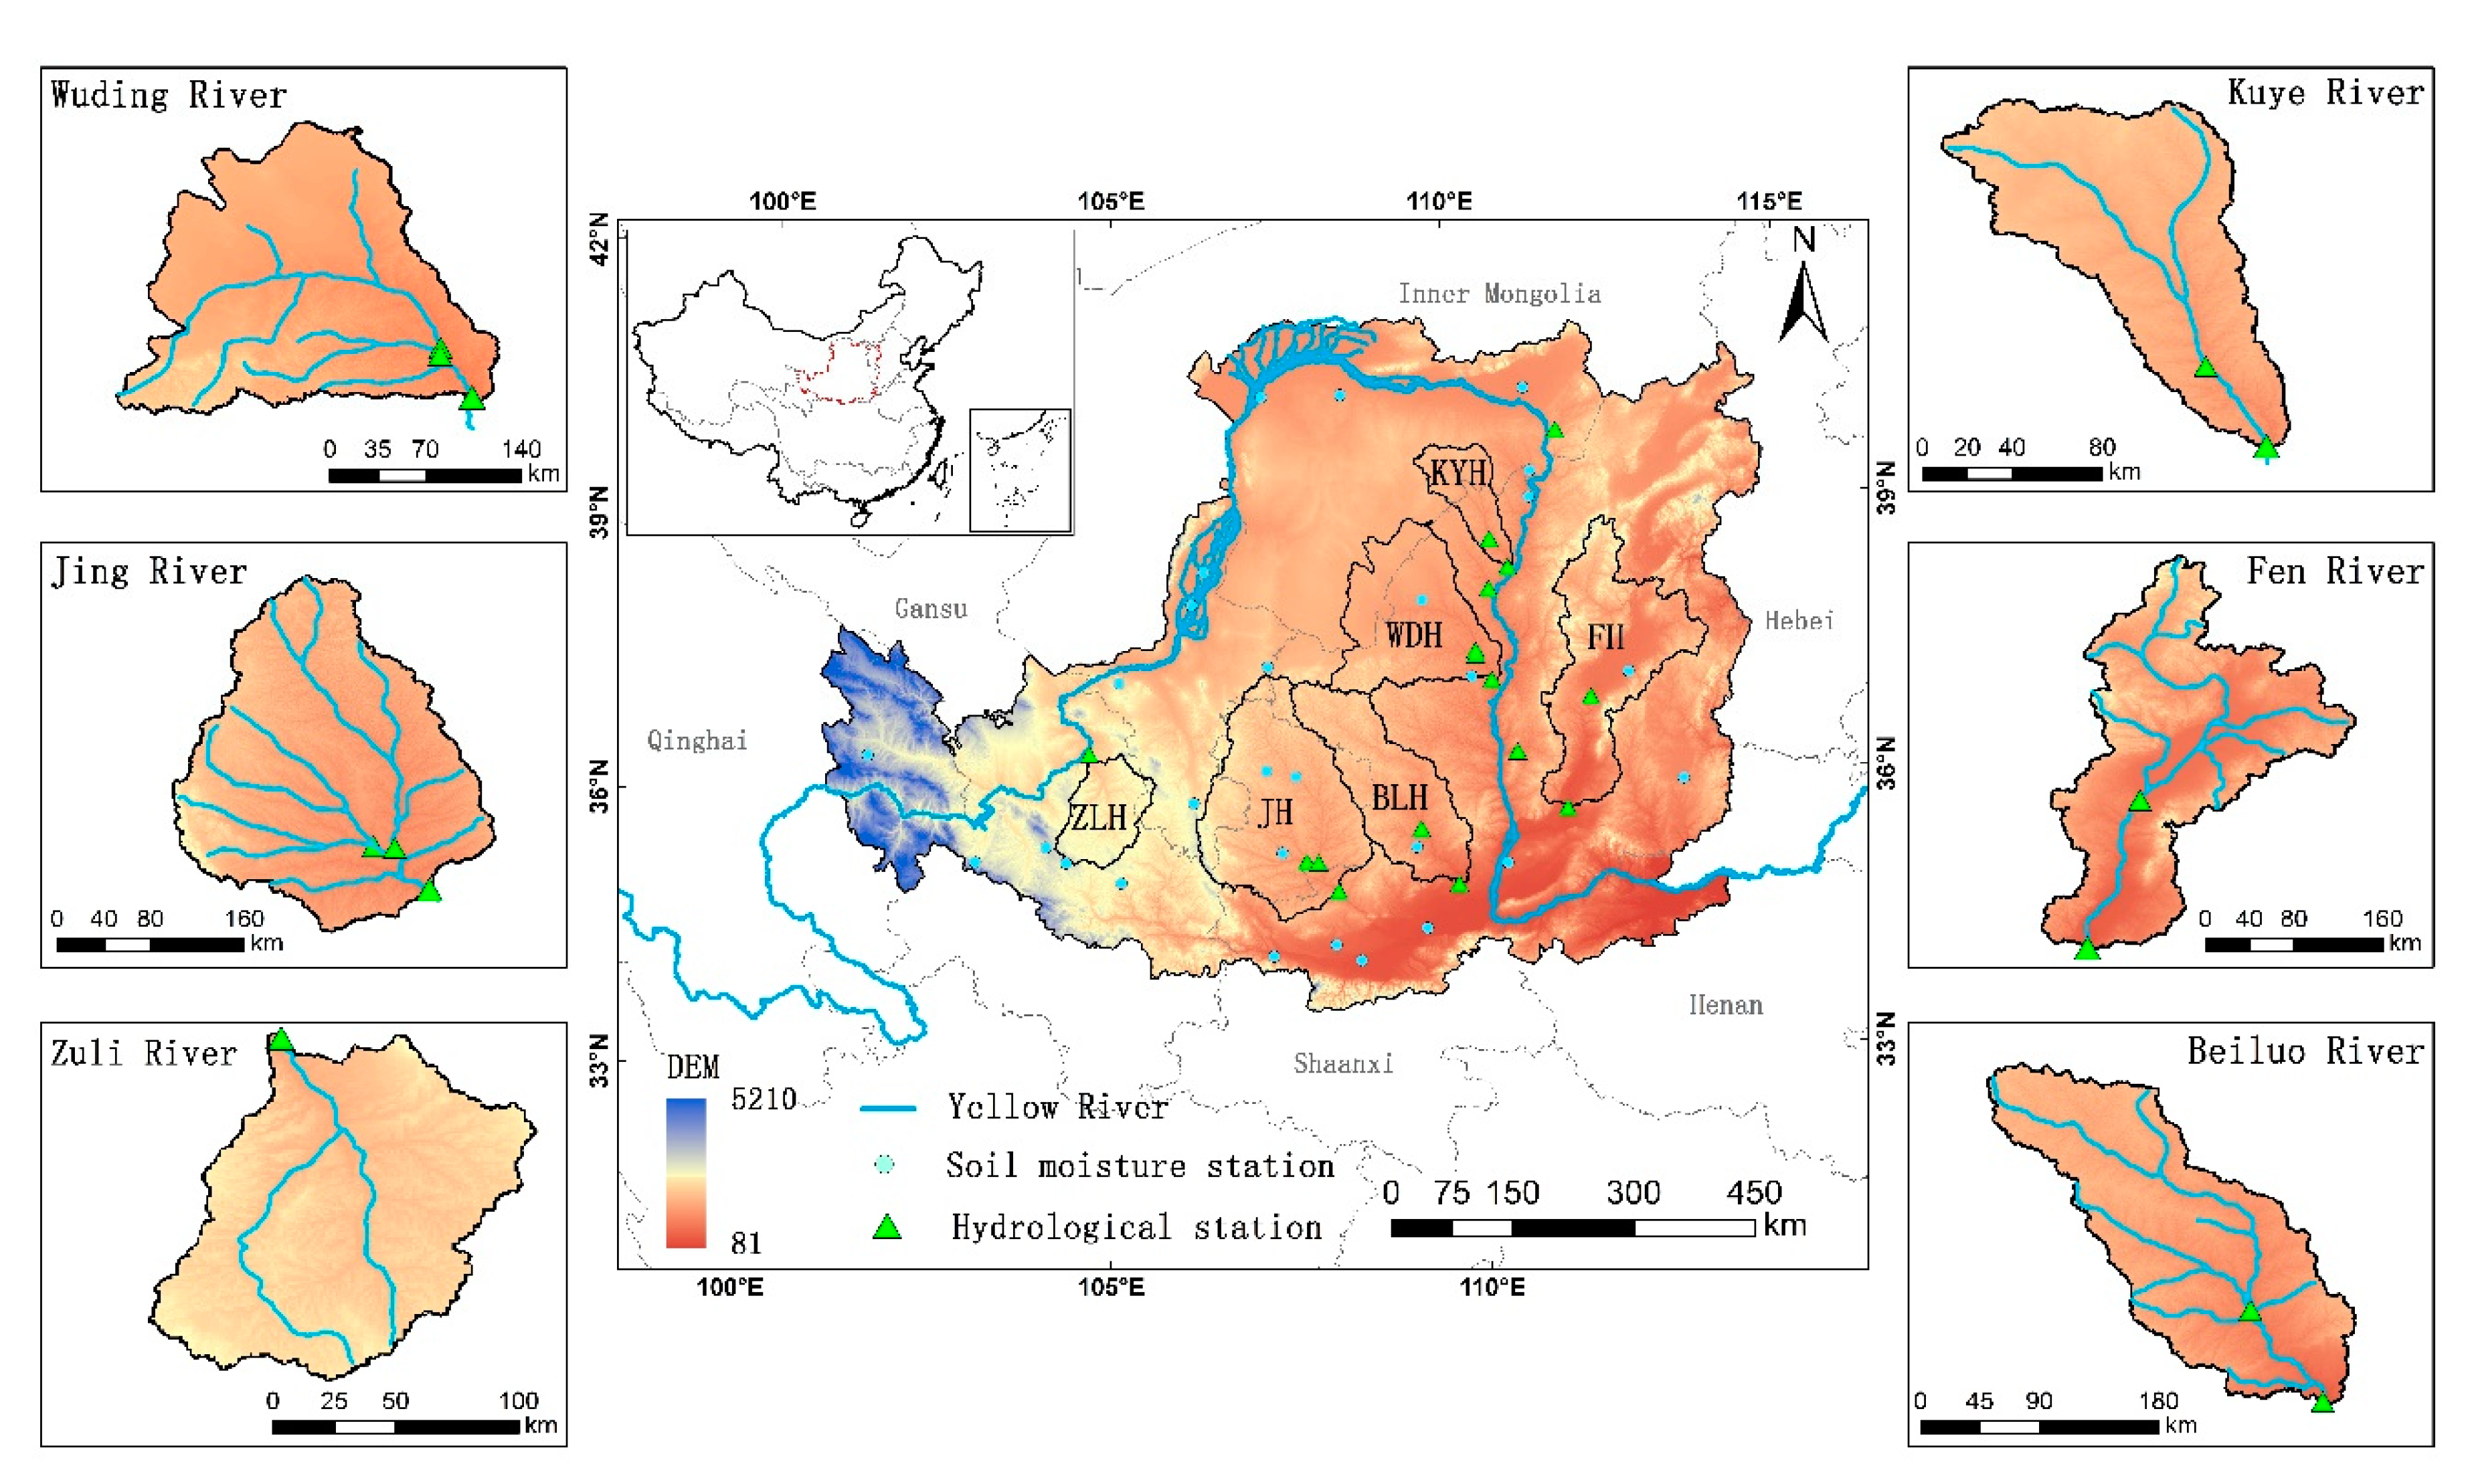
In this study, eight hydrological stations, with long-term monthly streamflow observations and minimal human disturbance, were selected to calibrate the model (Figure 2). The NSE of simulated and observed streamflow was above 0.70 at six out of eight stations in the calibration and validation period (Table A1 in Appendix A). The BIAS between simulated and observed streamflow ranged from −15% to 16%, excepting Jiaokouhe station, in the validation period. The results indicated that the parameters of each catchment were reasonable, and the calibrated VIC model was generally acceptable at reproducing the observed monthly streamflow. Therefore, the model parameters of the uncalibrated catchments were set to be identical to the nearest calibrated catchments in the same major river basin for the simulation of the Loess Plateau [57]. Another eight hydrological stations, with larger catchment areas, covering the catchments used for model calibration, were chosen, to validate the parameter implementation (Table A2). The NSE were at or above 0.63 at seven of the eight stations, excepting Baijiachuan station, and the BIAS was in the range −18.94%–26.81%.
3.1.2. Comparisons of Simulated ET and SM with Other Datasets
Evapotranspiration and soil moisture were another two key hydrological variables investigated in this study. Evaluations of ET and SM were essential for the validation of model performance and further studies. Three ET products, with the common data period of 2001–2011, were employed to evaluate the simulate ET in this study (ETVIC). Results showed that ETVIC had a good correlation with ETMODIS (r = 0.72, p < 0.05) and ETZK (r = 0.59, p < 0.05), which indicated that ETVIC was consistent with ETMODIS and ETZK in capturing the inter-annual variation of ET. Compared with the ETVIC, ETZK and ETMTE underestimated ET by 18.07% and 10.89%, and ETMODIS overestimated ET by 8.54%. Though it was well accepted that ETMODIS underestimated actual ET, part of the desert with low ET in the northwest Loess Plateau was treated, as no data may account for the overestimation. The underestimation of ETZK may be because the model did not consider the evaporation from canopy interception. Generally, the spatial pattern of multi-year average ETVIC was similar to ETMODIS and ETZK.
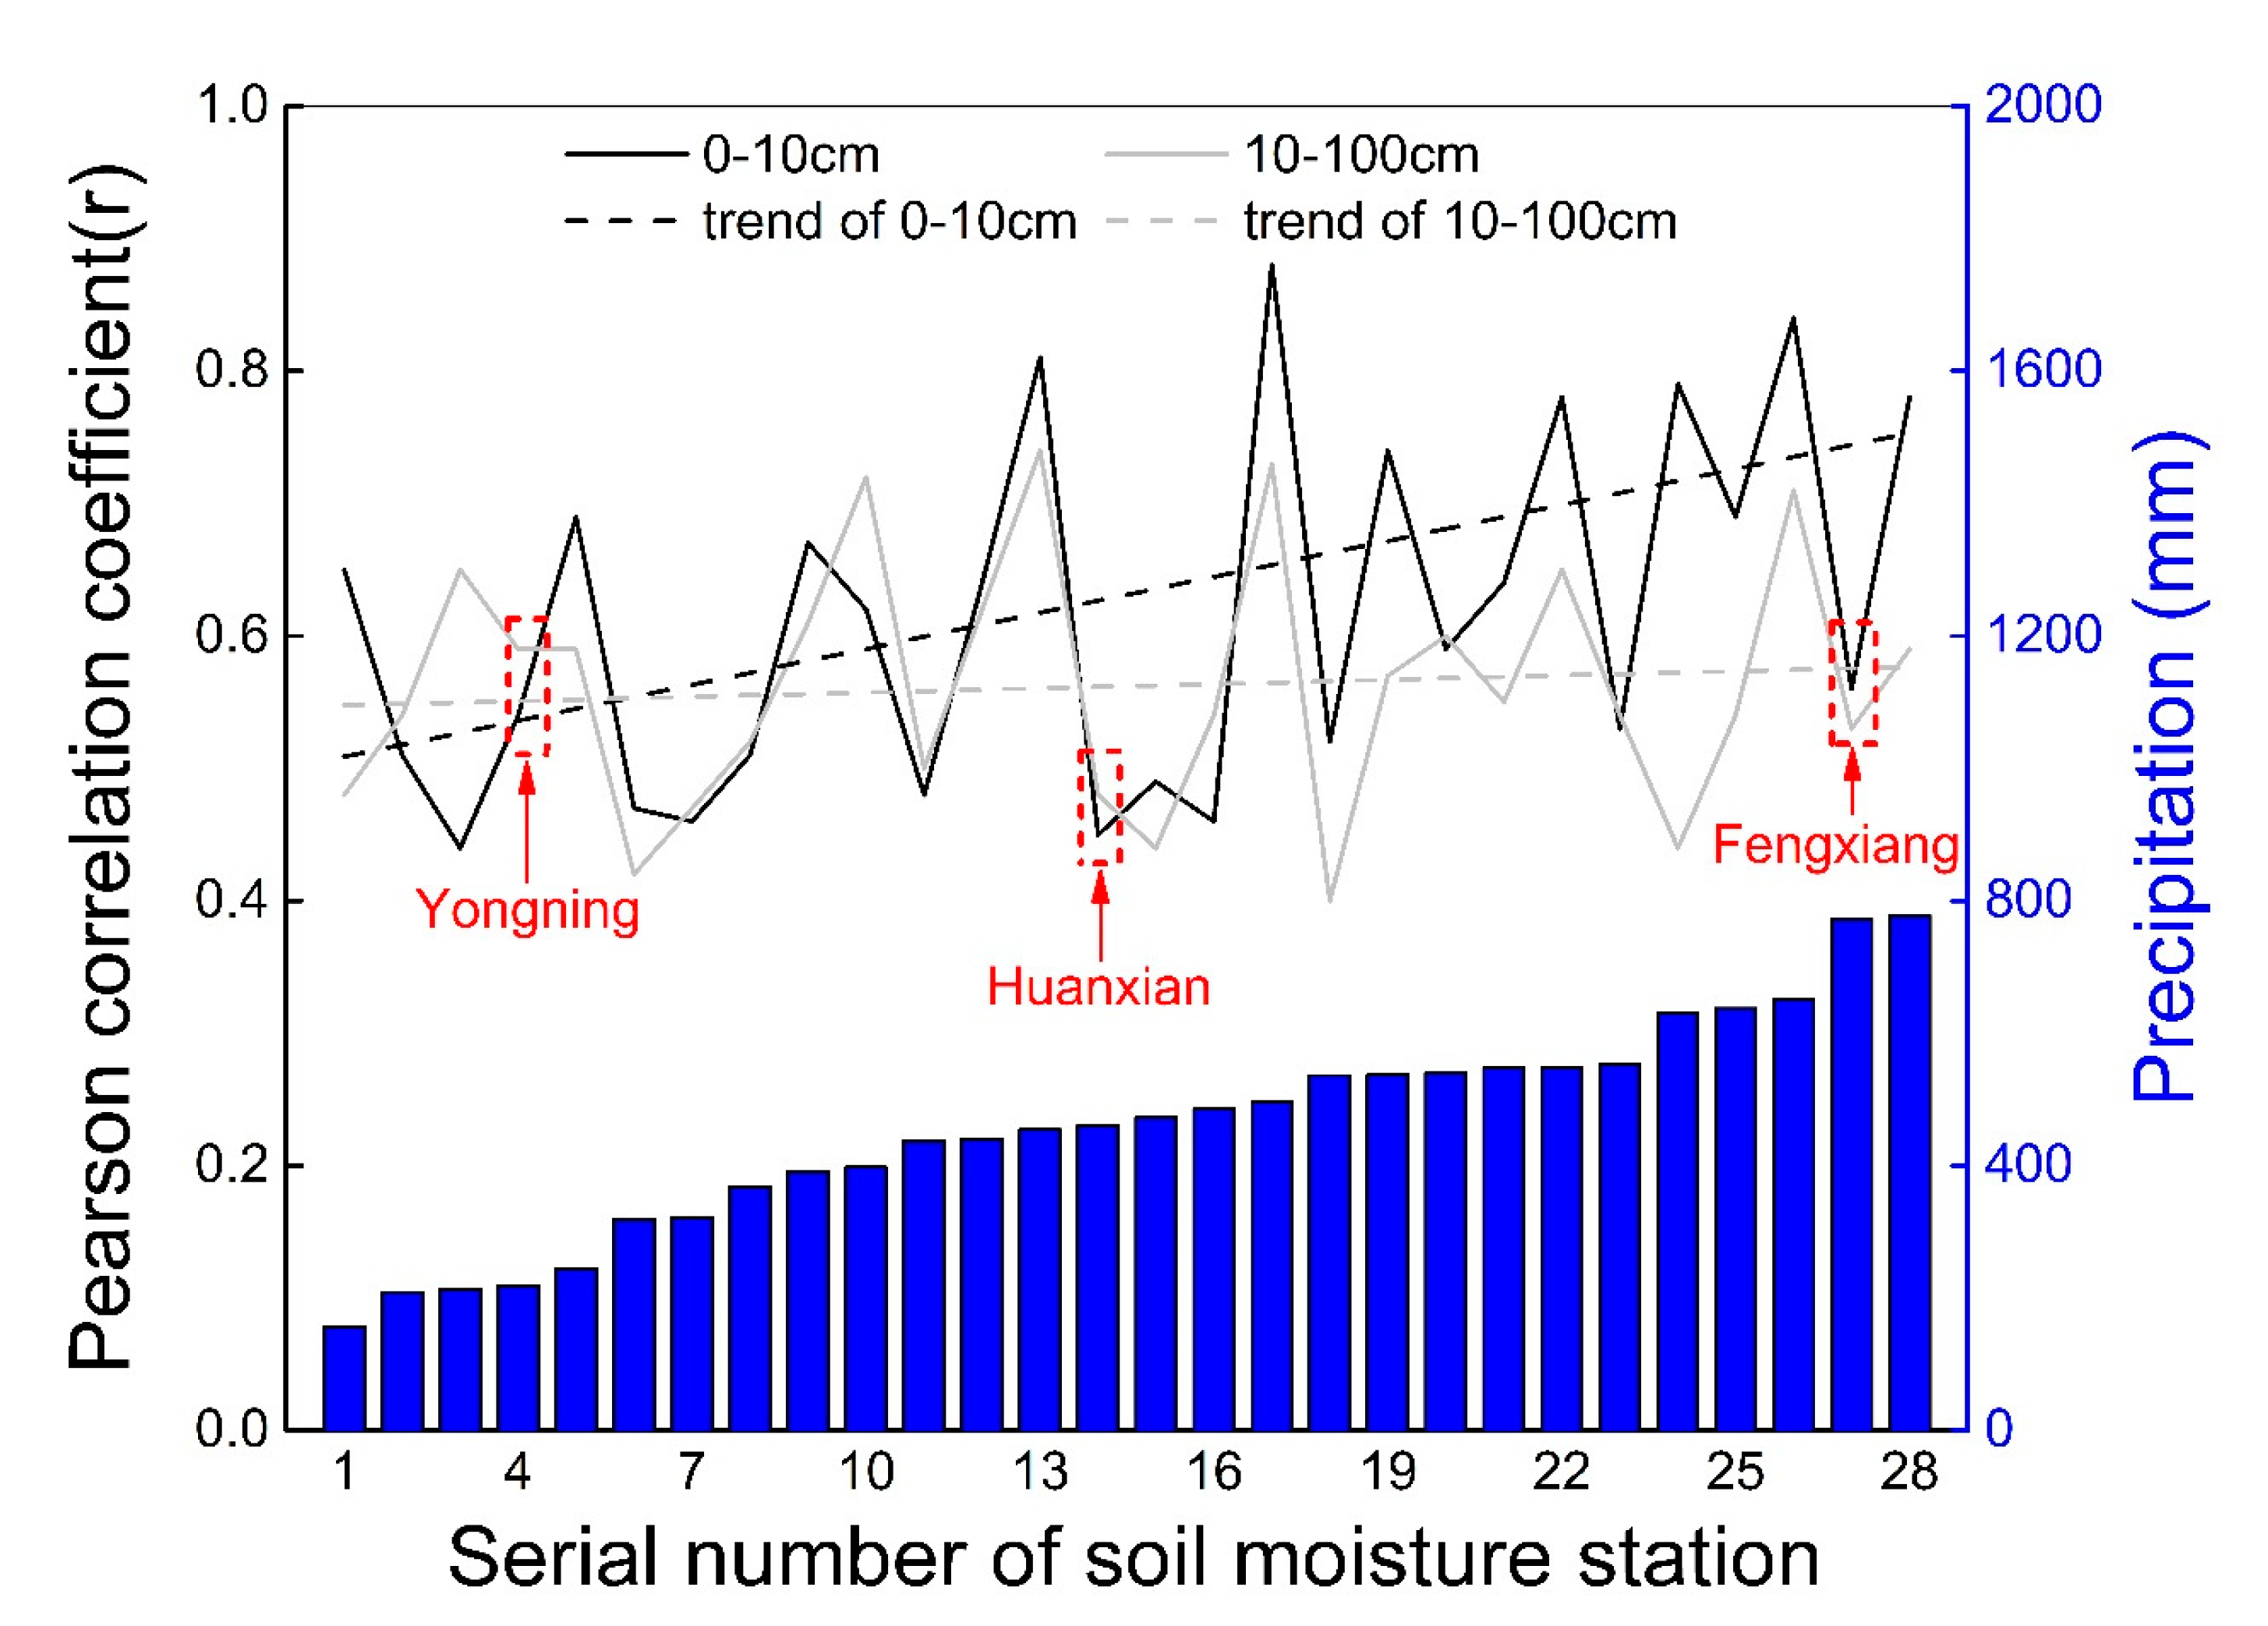
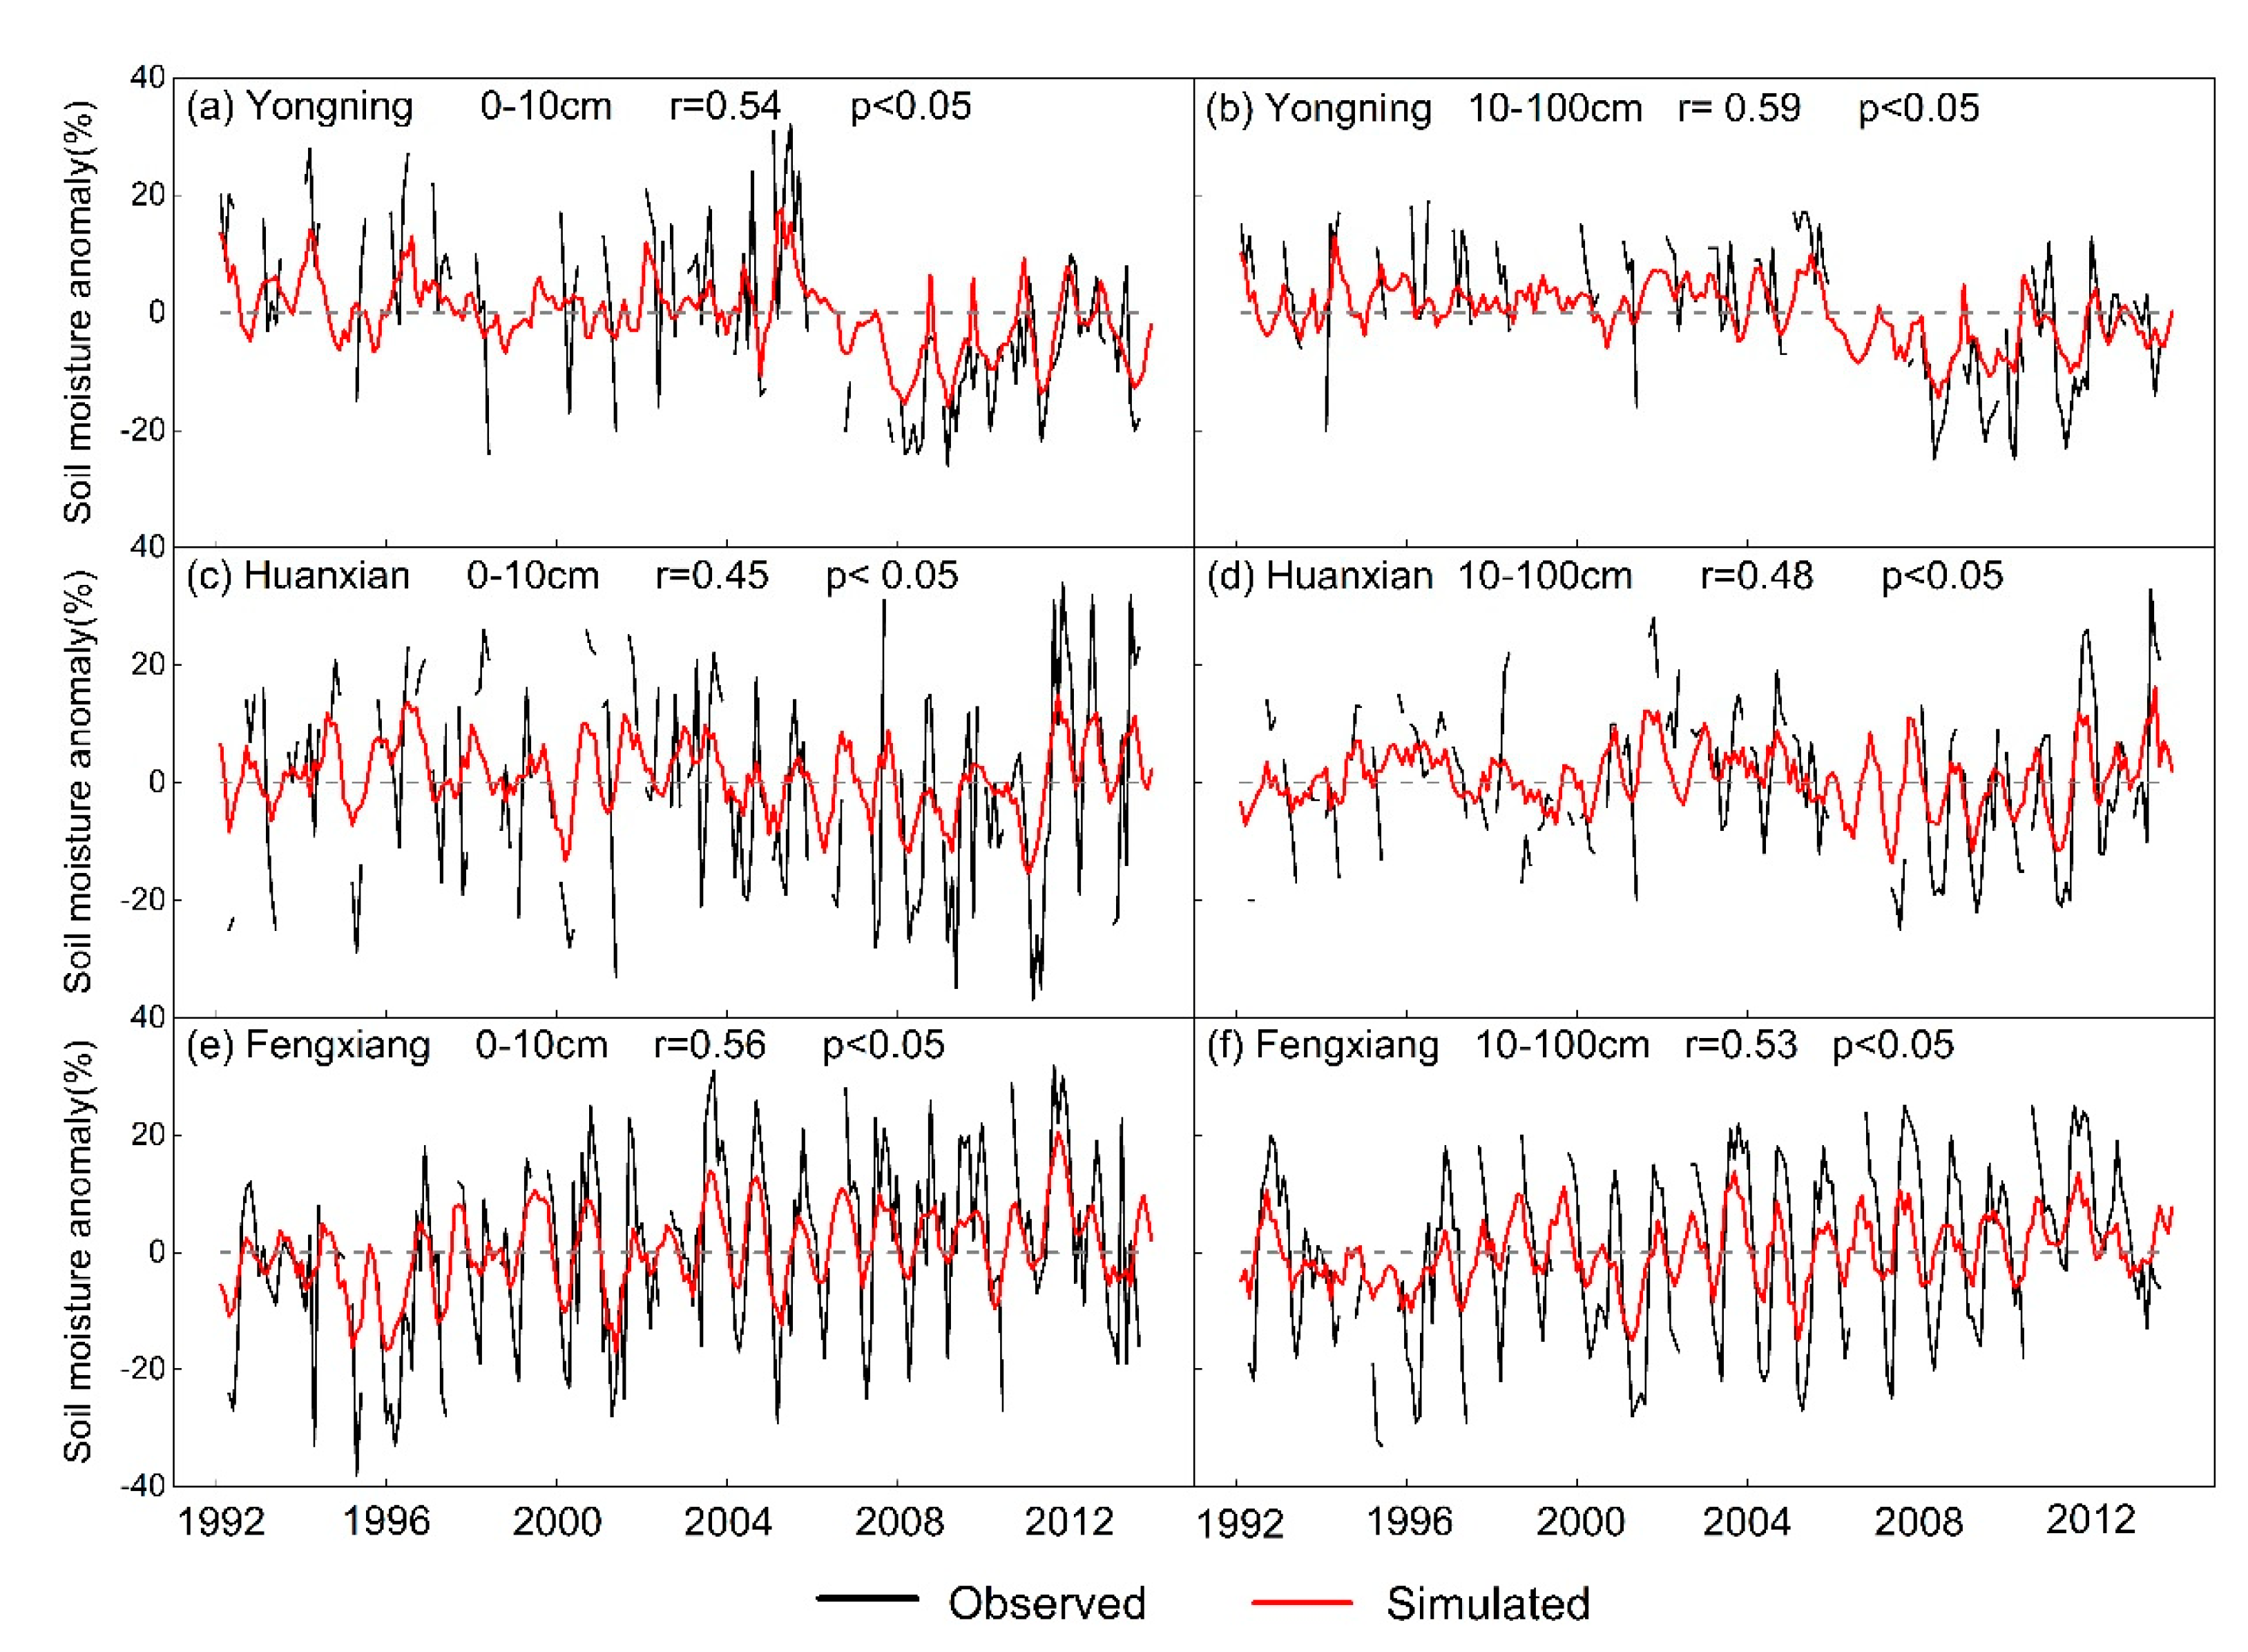
Additionally, a soil moisture dataset from Yang (SMYK), and soil moisture observation from 28 stations (SMobs) were employed to evaluate the simulation by VIC (SMVIC). The comparison was conducted between SMYK and SMVIC within a depth of 0–100 cm, after conversion of units from m3/m3 to mm. The multi-year average soil moisture of the two datasets was comparable, with a bias of -14.12%. The correlation coefficient was 0.38 (p > 0.05), which indicated an obvious difference in soil moisture simulation between VIC and ITPLDAS. The Pearson correlation coefficient (r) between simulated and observed soil moisture of 28 stations ranged from 0.44 to 0.81 for 0–10 cm, and from 0.40 to 0.72 for 10–100 cm (Figure 3). In general, the correlation coefficients of 0–10 cm were higher than that of 10–100 cm, and showed a significant increase with increased precipitation, while a similar trend was not detected for 10–100 cm. Three stations with a long-time span of observation data and remarkable difference in precipitation were selected to represent the typical arid, semiarid and semi-humid region, as shown in Figure 4. The variability of SMVIC was generally lower than that of SMobs, which may be partly attributed to the difference in time–space scale. SMVIC represented the average daily state of the entire grid cell, while SMobs was observed at a certain sampling point at a certain time, which was more susceptible to the local transient climate, and the vegetation and soil conditions of the sampling site. Generally, the results of evaluation confirmed a reasonable and acceptable performance from the calibrated VIC model.
3.2. Spatiotemporal Distribution of Four Hydrologic Variables
3.2.1. Spatial Patterns
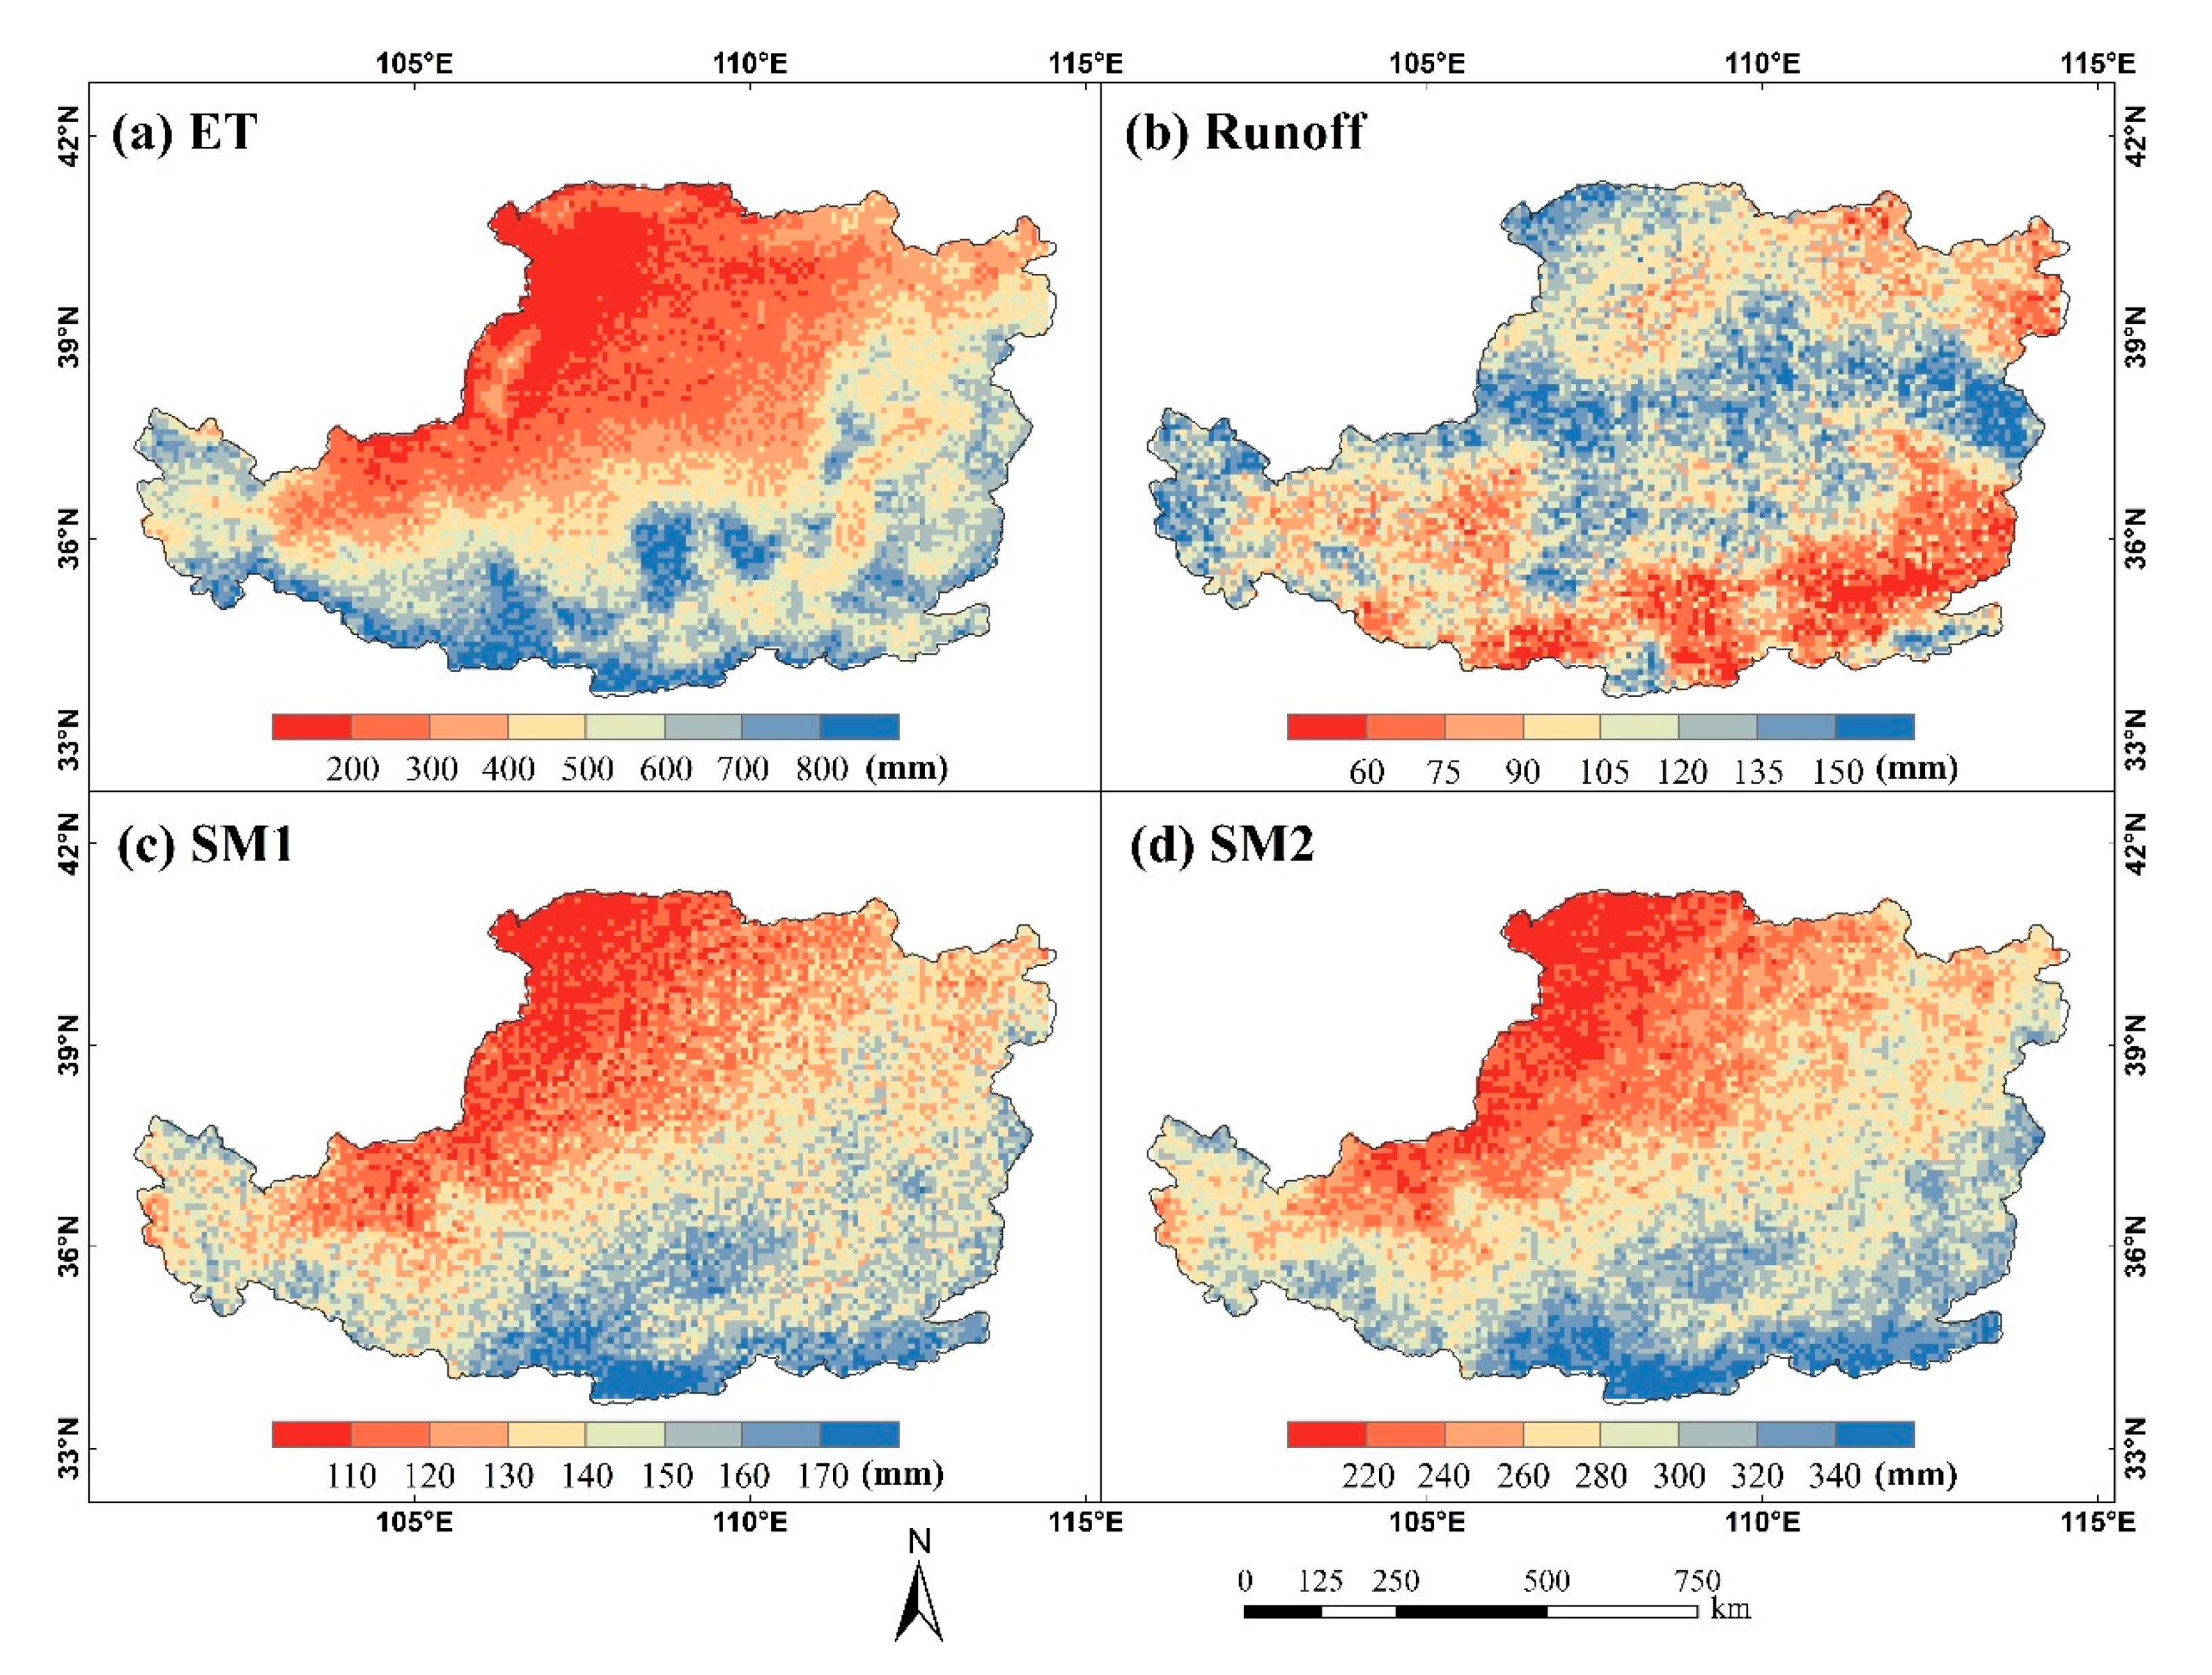
The spatial distribution patterns of ET, Runoff, SM1, and SM2 throughout the period 1984–2015 in the Loess Plateau were shown in Figure 5. The multi-year average of ET, SM1 and SM2 showed a decreasing gradient trend from southeast to northwest, with an average of 321.95 mm, 136.02 mm and 319.24 mm, respectively, which had a high consistency with the gradient spread of precipitation. However, the runoff, ranging from 45.40 mm to 160.69 mm, showed an obviously different spatial pattern, with a higher runoff in the central Loess Plateau and a relatively smaller runoff in the southeastern forest and irrigated agricultural area.
The variation in four HVs between the periods 1984–1999 and 2000–2015, with a mean value of −1.55 mm, 4.28 mm, 1.32 mm and −3.94 mm, respectively, were derived by CC and LUCC, as shown in Figure 6. The ET increased in the central and southern Loess Plateau, including the Ziwu Mountains, and part of the middle reaches of the Yellow River where vegetation restoration efforts by the GGP have taken place since 1999 [67], and an obvious decrease was found in the southeastern and southwestern Loess plateau. The variations of Runoff and SM2 showed a similar spatial pattern, with a larger fluctuation in the central Loess Plateau, and the SM2 experienced a sharp decrease, up to more than 60 mm, which demonstrates a great decline in terms of the regional multi-year average SM2 of a grid cell. The variation of SM1 ranged from -20 mm to 20 mm for most of the regions, but exhibited a larger spatial heterogeneity. The HVs variations of the six catchments were discussed in detail in Section 3.4.
3.2.2. Temporal Variability
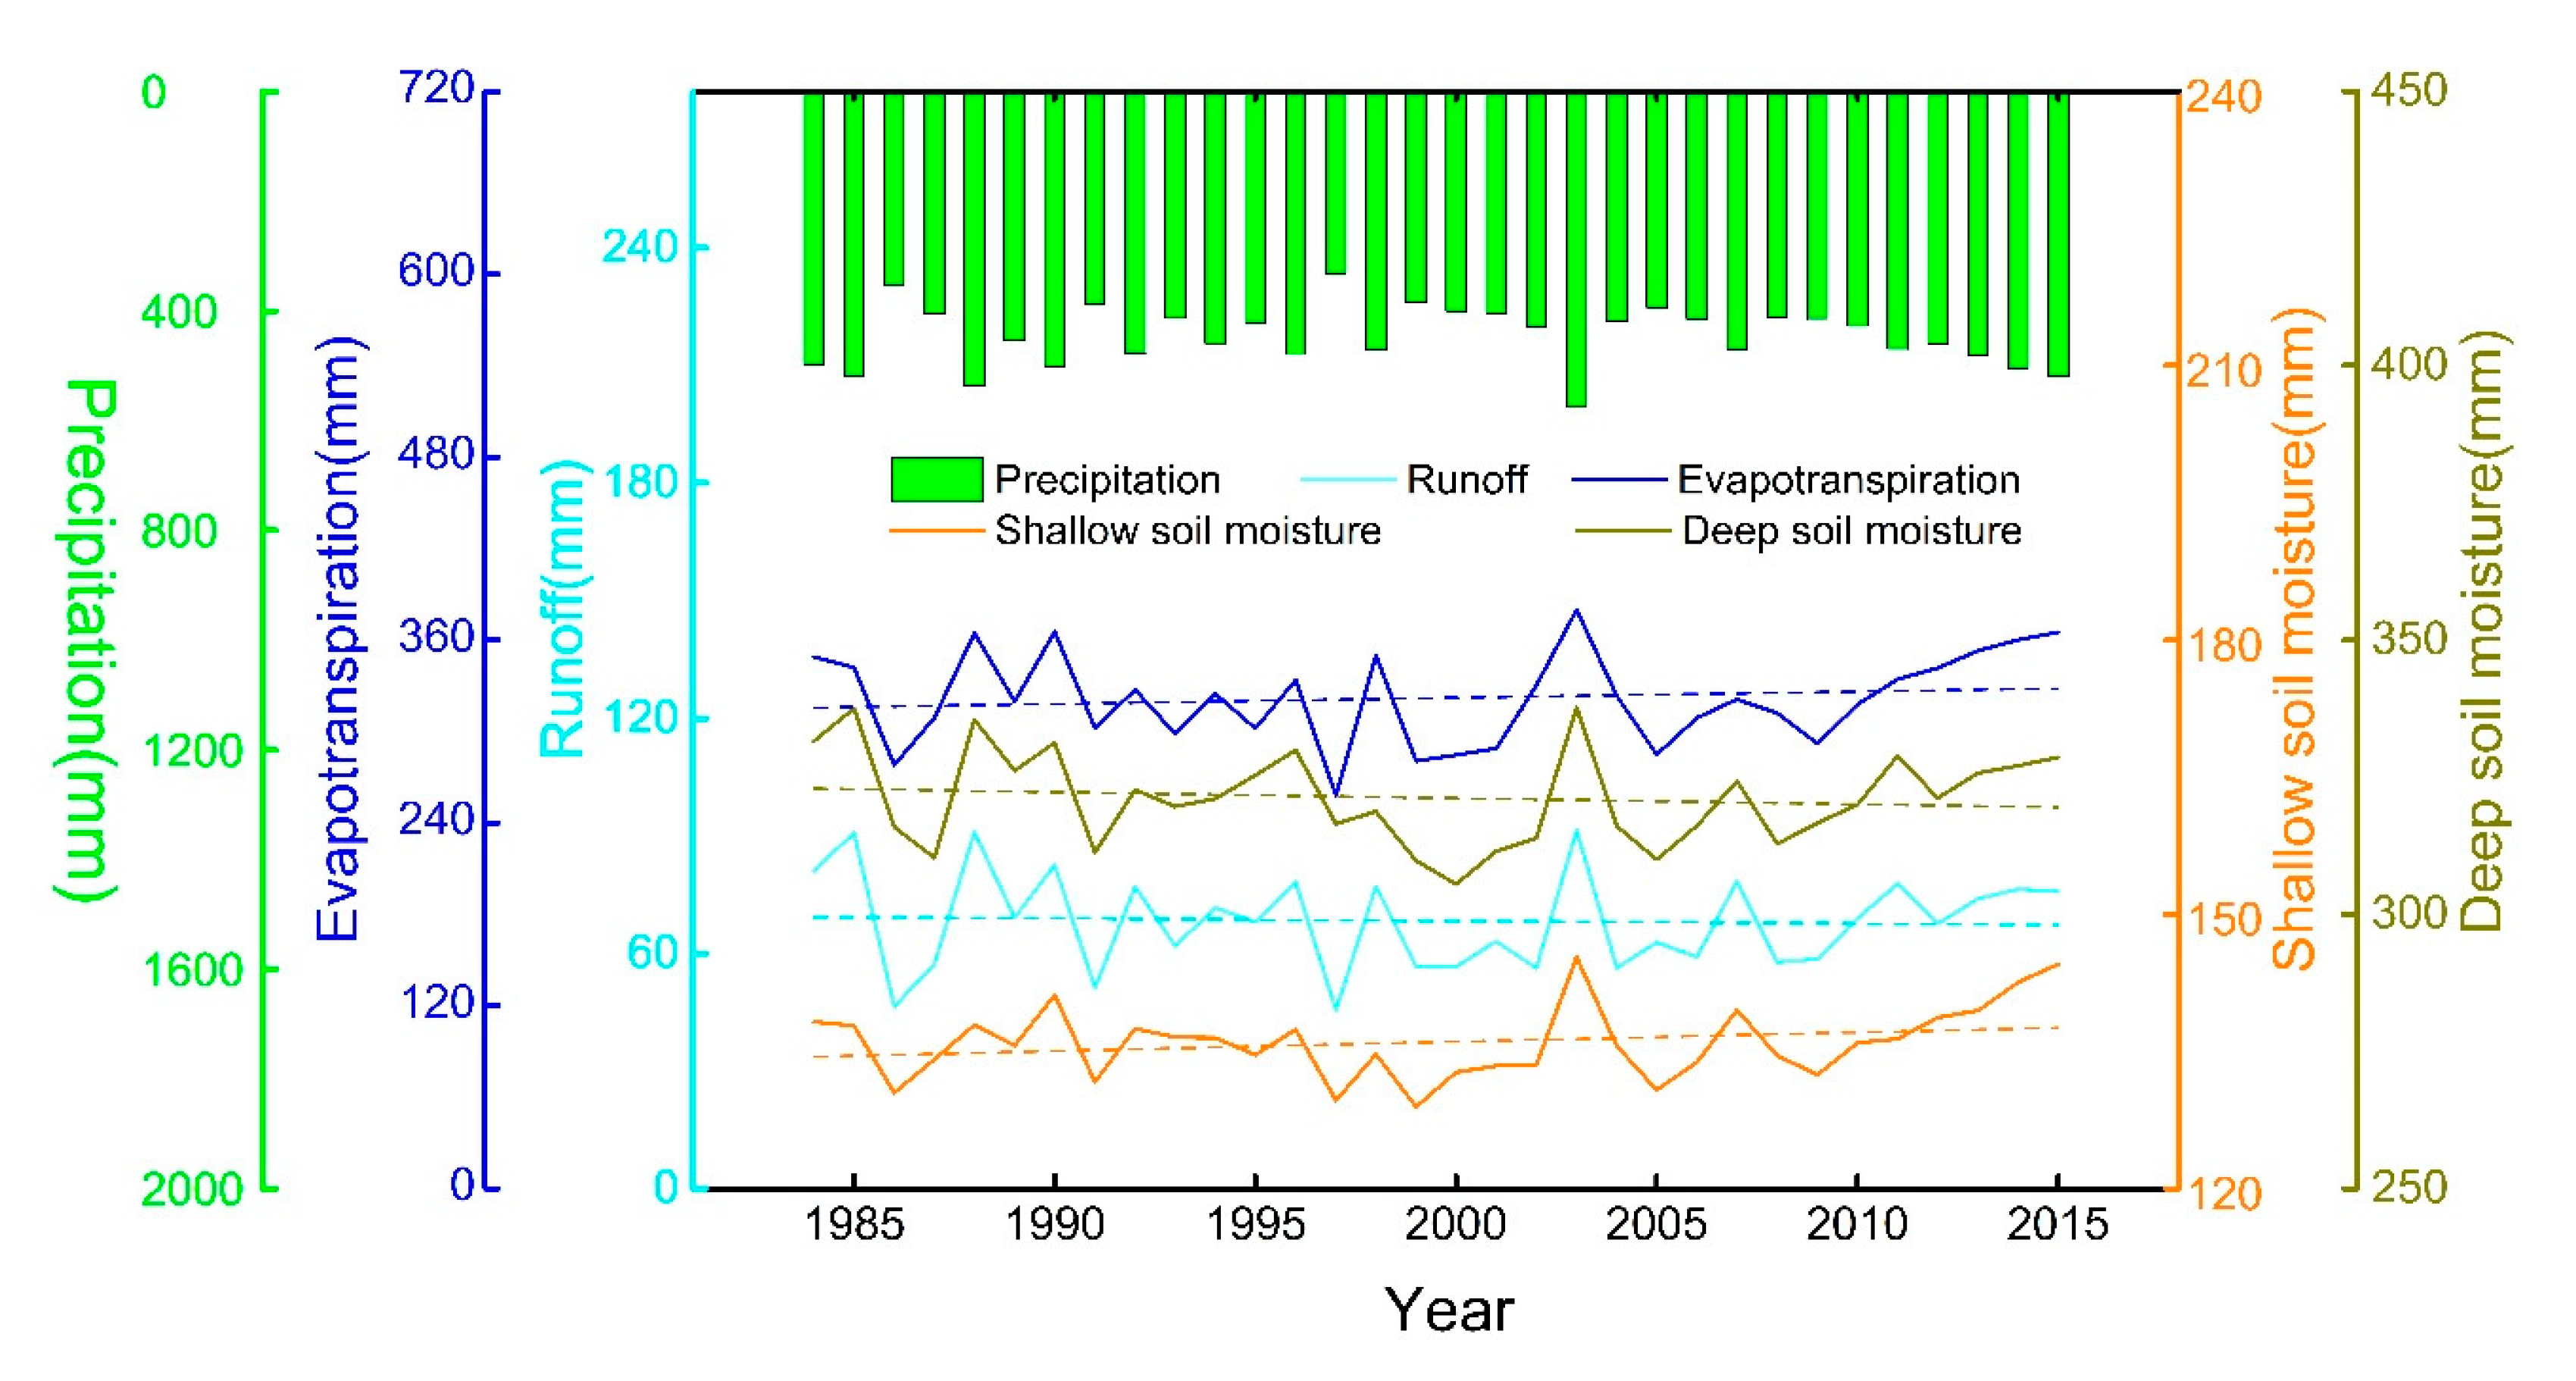
The annual mean values of the four HVs during the period 1984–2015 were shown in Figure 7. ET ranged from 258.15 to 379.62 mm, with a slight insignificant increasing trend (0.62 mm·yr−1, p = 0.37). Runoff ranged from 45.51 to 91.45 mm, with a slight insignificant decreasing trend (−0.11 mm·yr−1, p = 0.71). SM1 ranged from 128.94 to 145.38 mm, with a slight insignificant increasing trend (0.09 mm·yr−1, p = 0.40). SM2 ranged from 305.45 to 337.69 mm, with a slight insignificant decreasing trend (−0.52 mm·yr−1, p = 0.83). The minimum values of the four HVs were found at 1997, with a minimum precipitation of 331.02 mm and maximum values were found at 2003, with a minimum precipitation of 575.14 mm. The fluctuation of the four HVs exhibited obvious uniformity in precipitation change, which implies that precipitation was the main driving factor for the change of HVs on the regional scale of the Loess Plateau. Among the four HVs, the runoff was most sensitive to precipitation changes, with a change rate of 67.23%, and the SM2 showed the maximum resistance to precipitation changes, with a change rate of 10.01%, which suggests that deep soil water can effectively resist the impact of precipitation changes.
3.3. Impacts of Climate Change (CC) and Land Cover Change (LUCC) on Hydrologic Processes
3.3.1. Climate Change (CC)
The relationship between HVs and precipitation on a regional scale in the Loess Plateau were shown in the previous section. In this section, which aims to explore the difference in the HV response to climate change of three vegetation types, the relationship between HVs and meteorological variables (precipitation and temperature) is discussed, based on the Scenario2 (S2) simulation and selected typical grid cells of cropland (uc), grassland (ug) and woodland (uw) (see Table S1 (Supplementary Materials) for more details). Wind speed was one of the key meteorological variables for VIC model, although, due to its large spatial and temporal variability, the effect of wind was not analyzed in this study. As shown in Table 2, a significant positive correlation between the four HVs and precipitation in the three vegetation types was confirmed, with r ranging from 0.76 to 0.97 at the significance level of p < 0.01. The Runoff had the maximum correlation, followed by ET, SM1, and SM2.
The ET and Runoff were not related to temperature, while SM1 and SM2 showed a negative correlation, with r ranging from −0.29 to −0.55, but this was not significant except in the SM2 of woodland (uw), which indicated a lesser effect of temperature on hydrologic processes than in cropland and grassland. The variation in precipitation and temperature and corresponding variation in HVs between the periods 1984–1999 and 2000–2015 were analyzed to detect the driving role of climate change in three vegetation types (Table 3). The result further defined that the change in precipitation contributed the most to the variations in four HVs in cropland, with R2 ranging from 0.58 to 0.74 (p < 0.01), which suggests that precipitation was the main and direct driving factor of cropland’s hydrologic processes. The variations of Runoff and SM2 were also significantly correlated with variation in precipitation in grassland (R2 = 0.76 and 0.64, p < 0.01) and woodland (R2 = 0.92 and 0.72, p < 0.01), while a similarly significant role of precipitation was not found in ET and SM1, indicating a more complex response mechanism of ET and SM1 in grassland and woodland. Among the three vegetation types, precipitation had the strongest driving effect on Runoff and SM2 in woodland, followed by its effects on grassland and cropland. In comparison to precipitation, the effect of temperature changes on the hydrologic processes was very weak, with R2 less than 0.12.
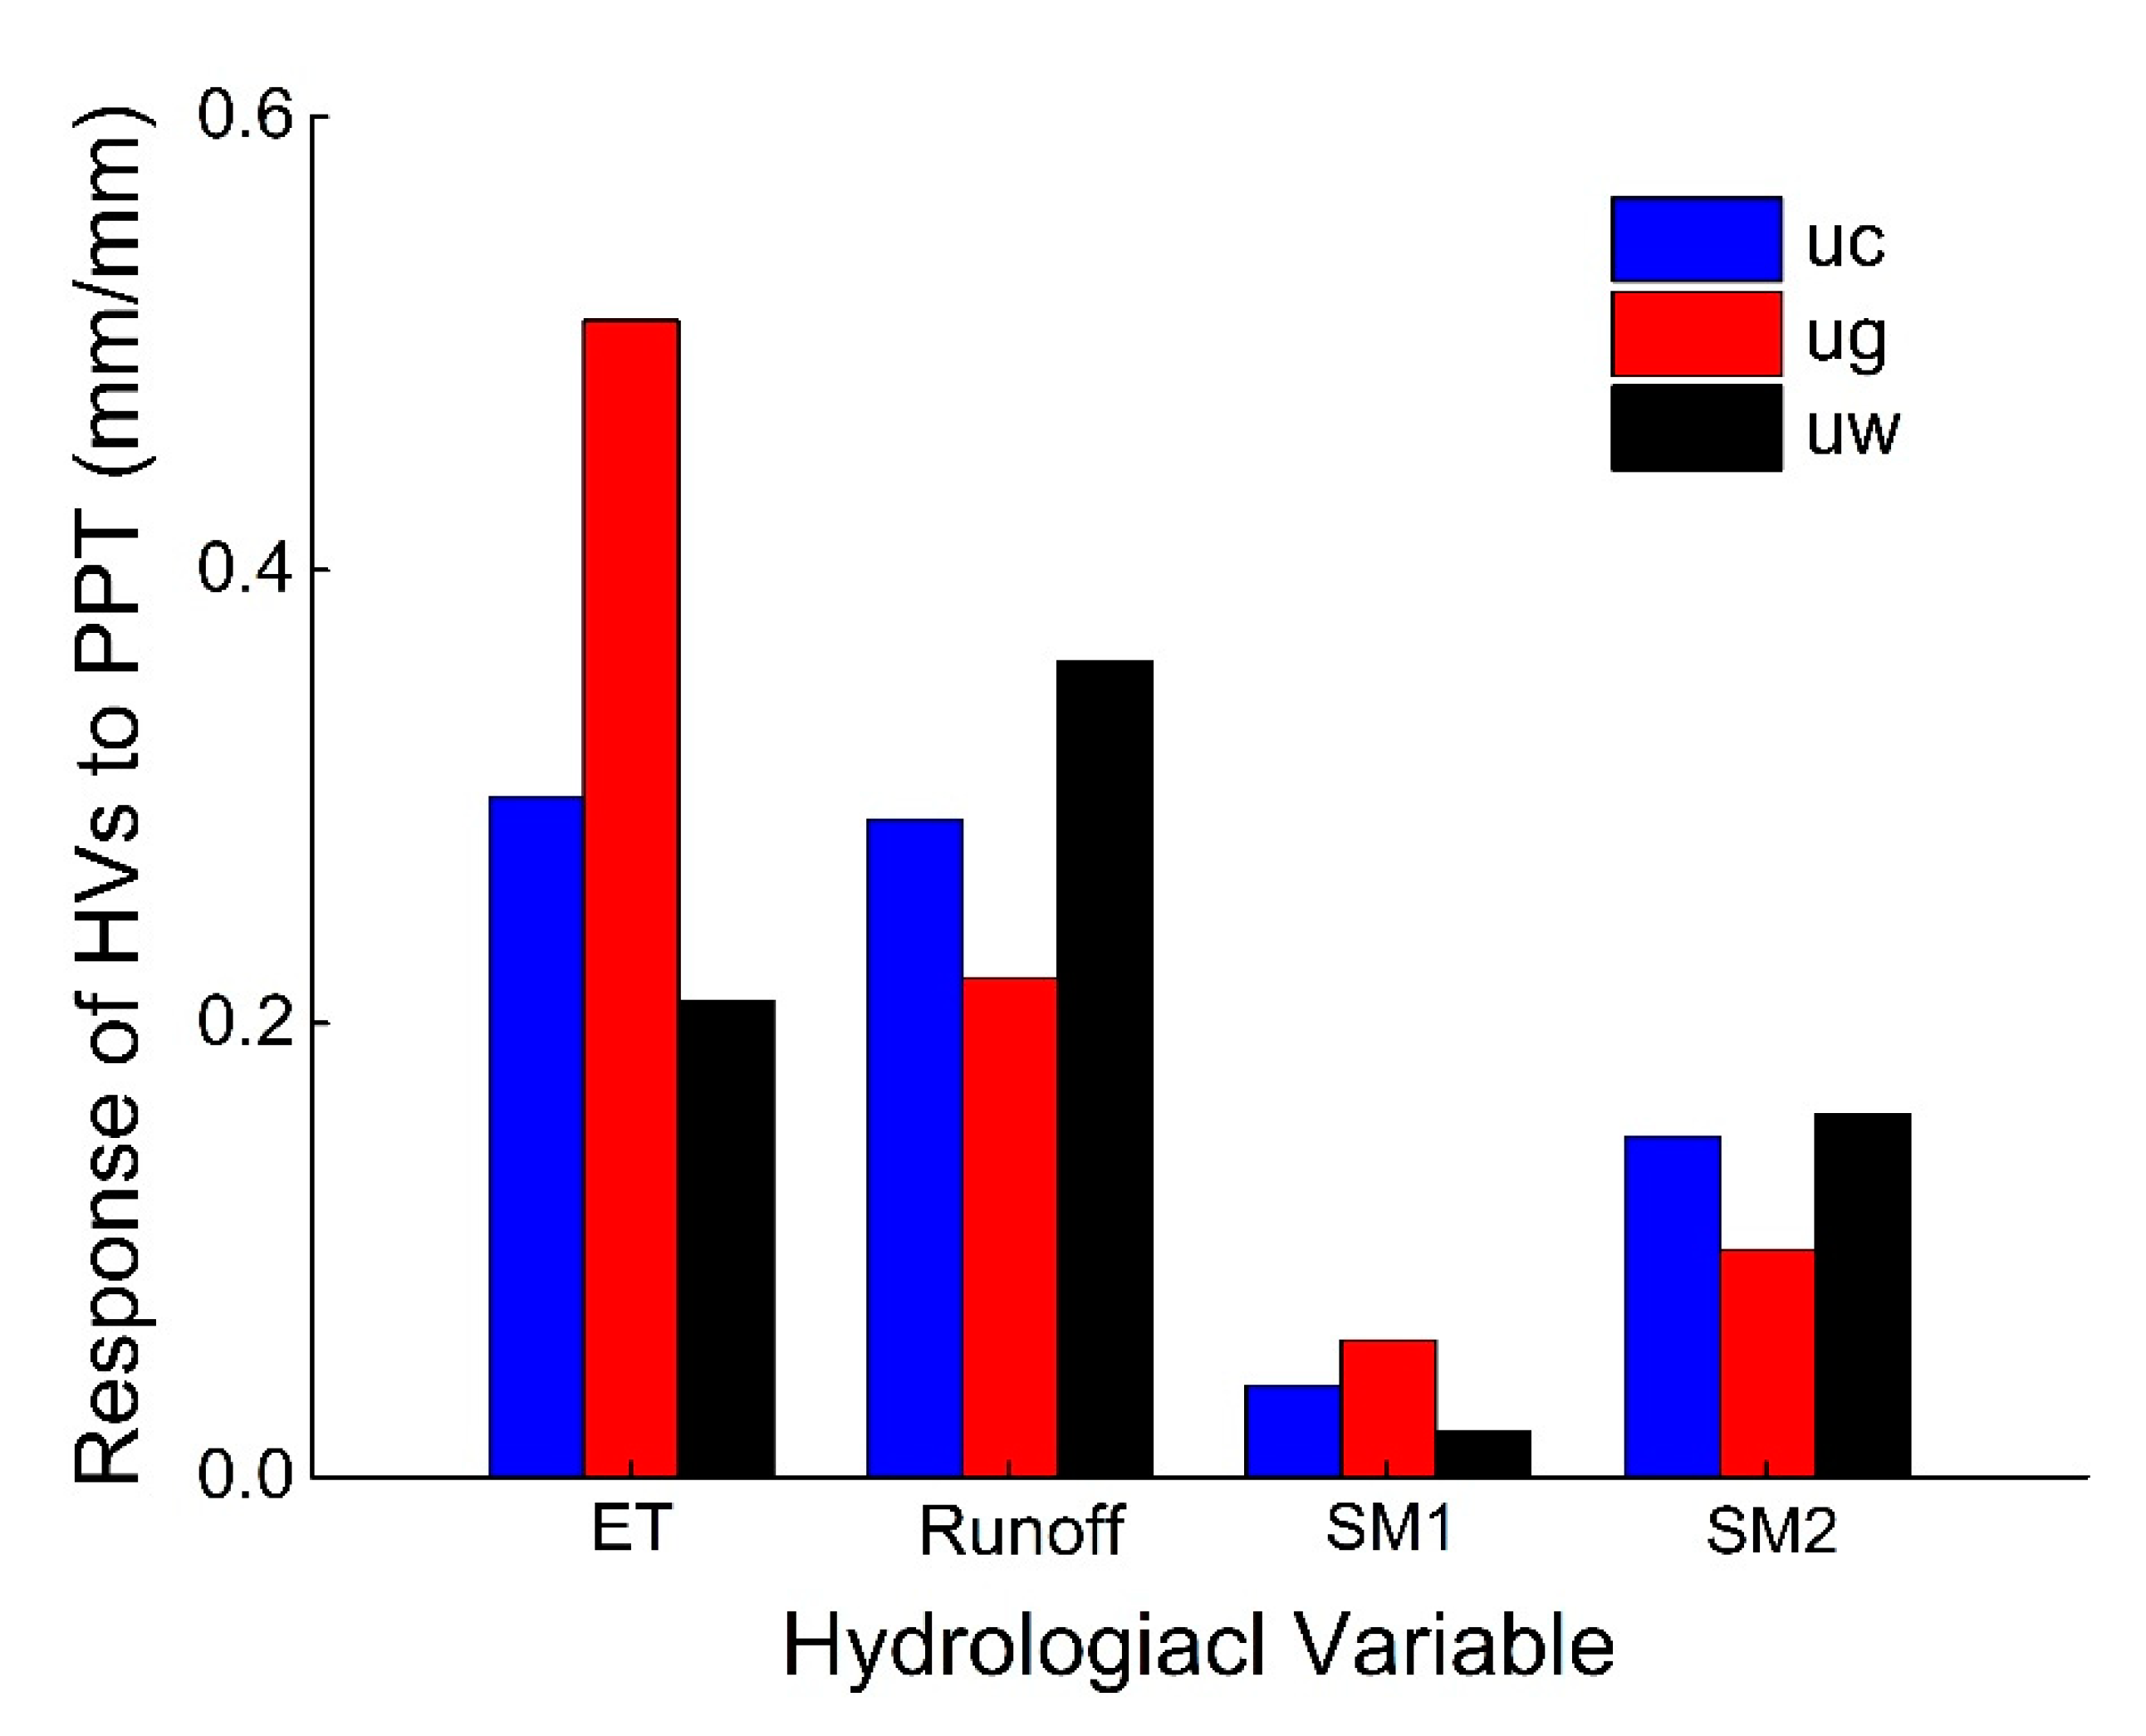
Since the HVs were significantly correlated with precipitation, the regression coefficients were calculated as the response level of HVs to precipitation changes, i.e., the variation in HVs induced by precipitation changing 1 mm (Figure 8). The results showed that ET and Runoff were more sensitive to variation in precipitation than SM1 and SM2, indicating that most of the increased precipitation was converted into an increase in ET and Runoff. The ET of grassland exhibited the highest response, with a mean value of 0.51 mm/mm, followed by cropland (0.30 mm/mm) and woodland (0.21 mm/mm), which suggested that grassland could convert more precipitation increments into evapotranspiration, and SM1 was consistent with response of ET. However, the response levels of Runoff and SM2 to precipitation were ordered from high to low: woodland (0.36 mm/mm, 0.16 mm/mm) > cropland (0.29 mm/mm, 0.15 mm/mm) > grassland (0.22 mm/mm, 0.10 mm/mm).
3.3.2. Land Use and Land Cover Change (LUCC)
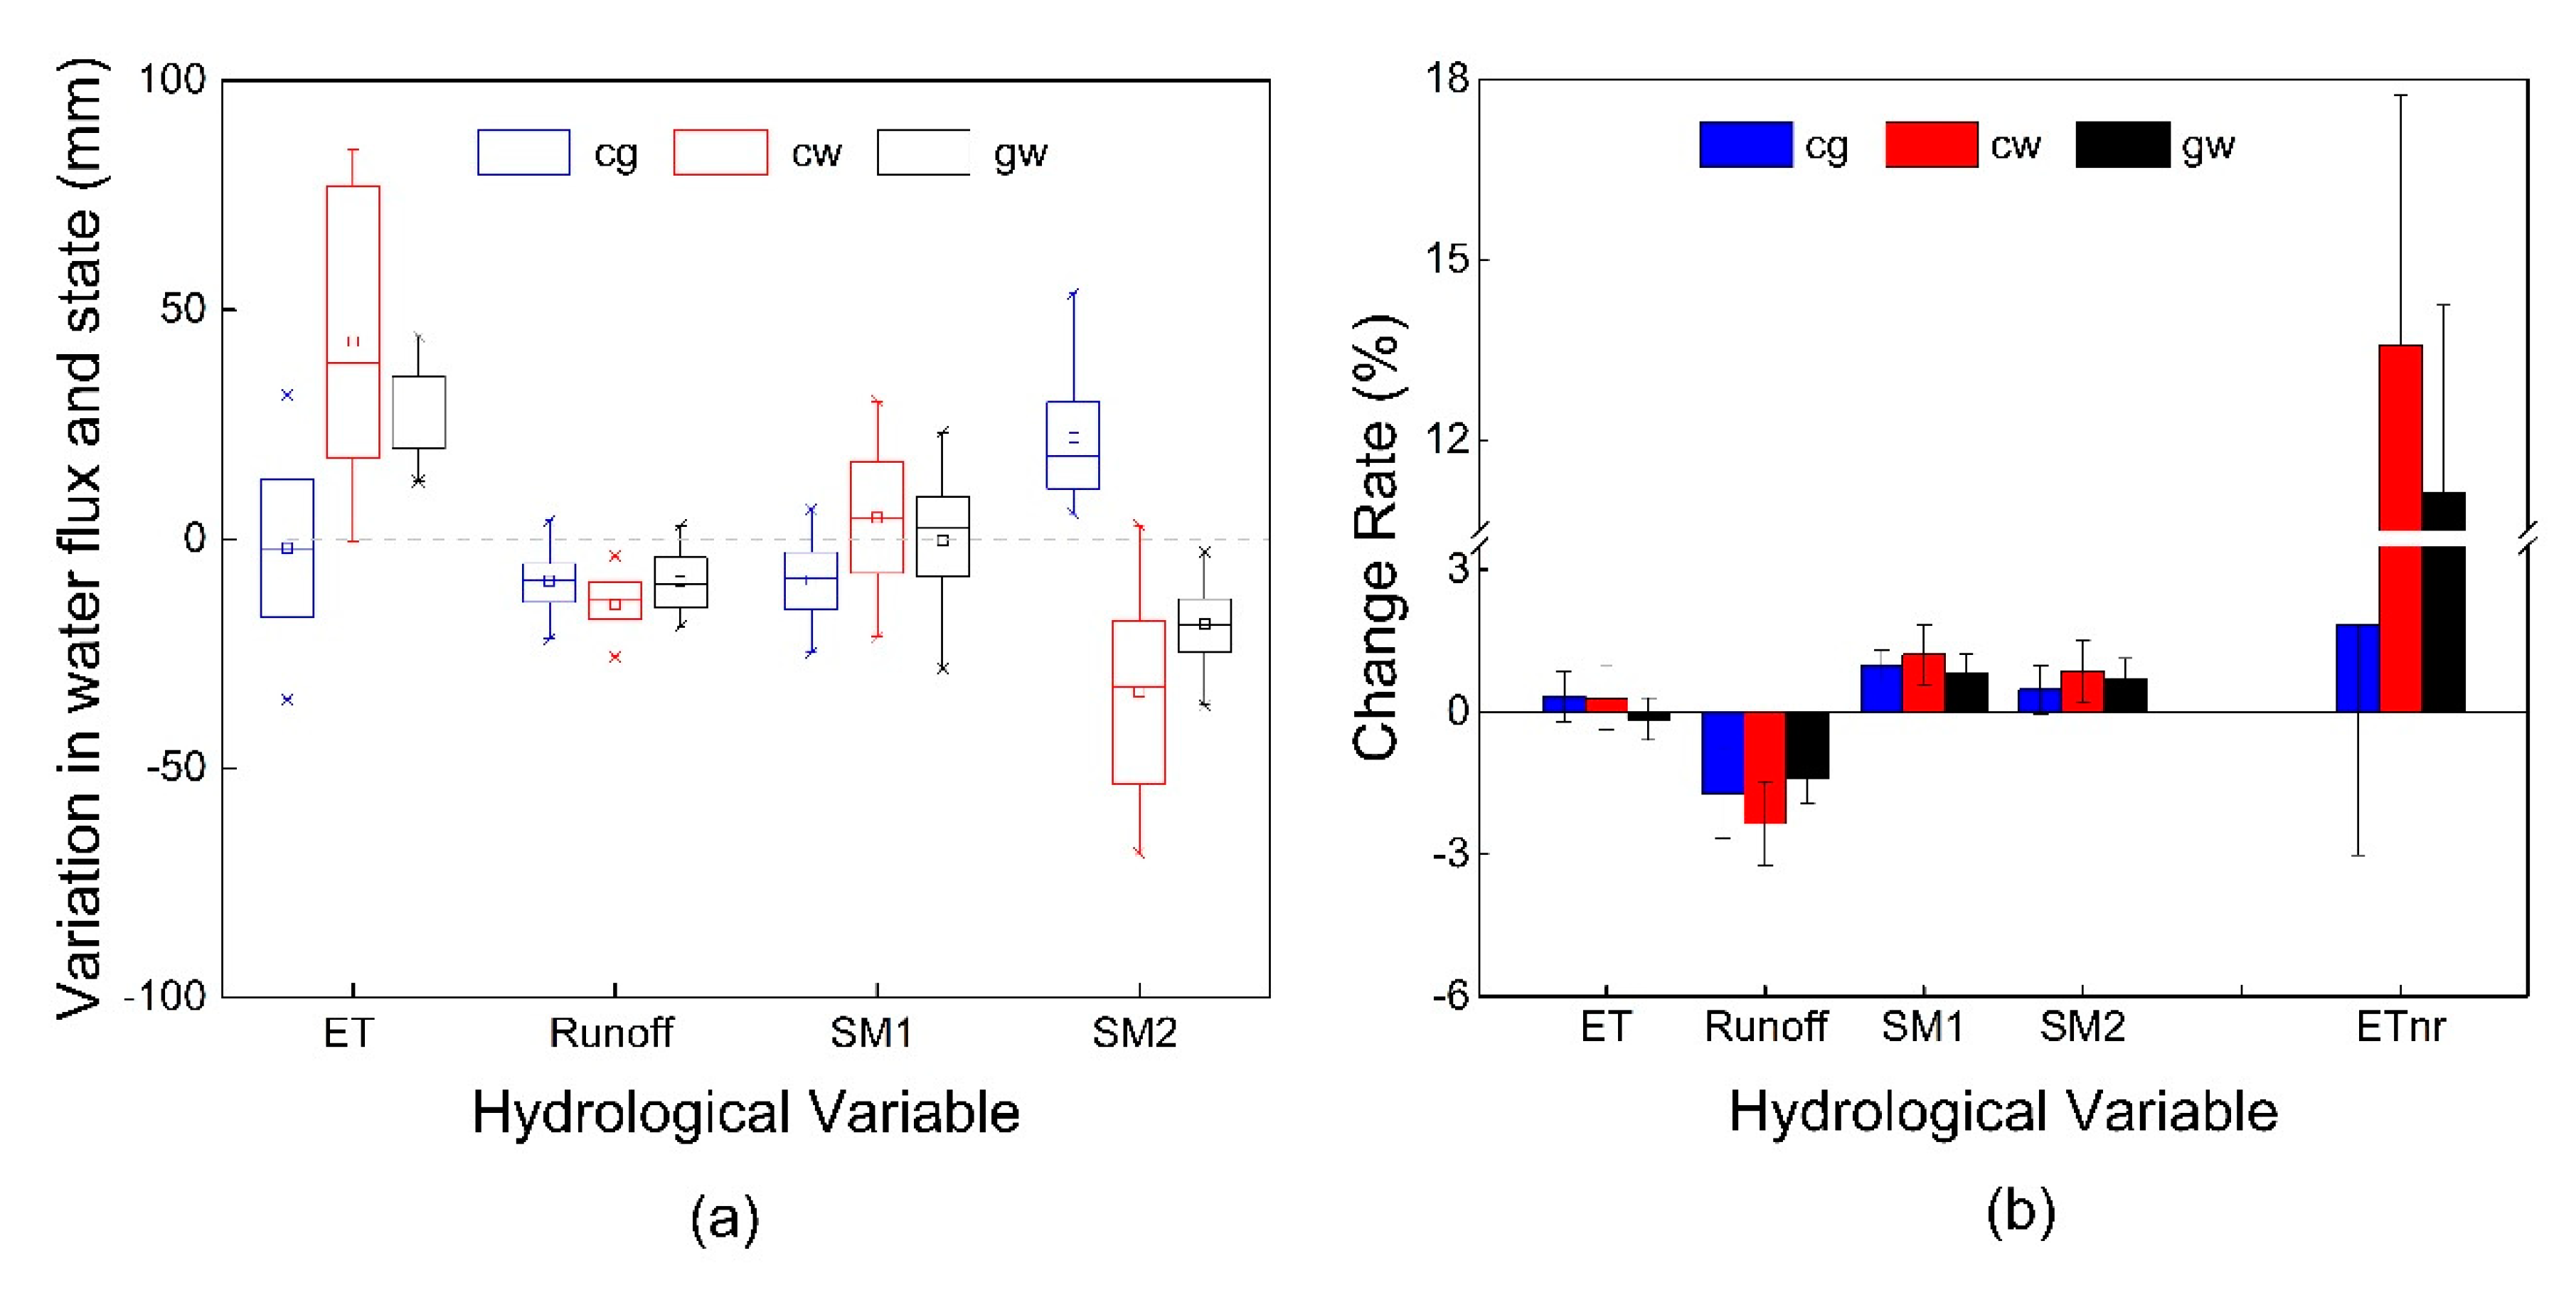
As shown in Table 1, the changes in hydrologic processes in Scenario0 (S0) and Scenario2 (S2) for the period 2000–2015 were considered to be induced by LUCC. Therefore, the differences in the annual mean HVs of three kinds of conversion grid cells (cg, cw, gw) (see Table S1 for more details) between S0 and S2 were employed, to analyze how the three typical vegetation conversion modes affected hydrologic processes. This was similar to the experiment designed for sensitivity analysis, as mentioned in Mao et al. [68], but was conducted under real climate, vegetation and soil conditions, which were more realistic and convincing, to reproduce the response of HVs to different vegetation conversions. As shown in Figure 9a, the vegetation conversions had a greater impact on ET and SM2 than Runoff and SM1, especially for the conversion of cropland and grassland to woodland. Runoff experienced a slight decline after the three conversions, with a mean value of 9.14 mm, 14.31 mm, 10.18 mm for cg, cw and gw, respectively, while the variation in SM1 exhibited an obvious difference, fluctuating around 0, indicating a large spatial heterogeneity and complexity in shallow soil moisture response to vegetation conversion, which may closely relate to the degree of change in vegetation and regional climate, especially the temporal and spatial distribution of precipitation. The variations in ET and SM2, induced by the three vegetation conversions, were similar but opposite, which implied a close relationship in the water flux between ET and SM2. The ET increased most, by an average of 43.05 mm, and SM2 decreased by 33.32 mm in cw, followed by gw, with ET increasing by 28.7 and SM2 decreasing by 18.61 mm, while the conversion of cropland to grassland (cg) resulted in a slight decrease of ET, with an average of 1.96 mm and increase of SM2, with an average of 22.07 mm.
Land cover changes influenced hydrological cycle by affecting the distribution of precipitation (mainly runoff and soil moisture) on rainfall days and the consumption of soil moisture (mainly ET) on non-rainfall days. In order to give a more detailed illustration of the effect of vegetation conversions on hydrological processes, we calculated the change rate of distribution of precipitation and consumption of soil moisture from June to September, noted that the change rates of ET, Runoff, SM1, and SM2 were calculated from the difference between S0 and S2 on rainfall days, and daily precipitation, while change rates of ET in non-rainfall days (ETnr) were calculated from the difference of ET in S0 and S2 to daily ET in S0 in non-rainfall days (Figure 9b). Results showed that all three vegetation conversion modes reduced runoff and caused more precipitation infiltration into soil, increasing soil moisture. Out of the three, cw exhibited the biggest drop, up to 2.62% in average, followed by cg (2.08%) and gw (1.69%), and cg took more reduction in Runoff to supply SM1 than SM2, while this was comparable in cw and gw. Additionally, the effect of vegetation conversion on ET was relatively small and negligible during precipitation, which was likely, as evapotranspiration was close to saturated surface evapotranspiration, regardless of vegetation type. However, in non-rainfall days, ET experienced significant increases, in the order, from high to low, of cw (13.57%) > gw (11.12%) > cg (4.85%), which was mainly caused by the stronger evapotranspiration capacity of tree, compared to grass and crop. The results suggested that all three conversions had a reducing effect on runoff, and the conversions of cropland and grassland to woodland exacerbated the consumption of deep soil moisture to meet the increase in ET, causing an obvious decline in deep soil moisture. Assuming the reduction of SM2 was entirely evaporated, we can attribute 71.28% ± 18.64%, 65.89% ± 24.14% of the ET increase to the water loss of SM2 in cw and gw, respectively.
3.4. Contributions of Climate Change (CC) and Land Cover Change (LUCC)
In practice, hydrologic processes were concurrently affected by both climate change and vegetation changes in the Loess Plateau. The effects of different vegetation conversions and changes in meteorological variables, which occurred in a grid cell, may be strengthened or offset. The effects of vegetation change on hydrological processes were limited within the changing grid cells, while climate change had a wide-ranging impact on the entire basin and the region, though spatial heterogeneity may exist. This paper aimed to detect the separated effect of CC and LUCC, and their contribution to the variations in HVs.
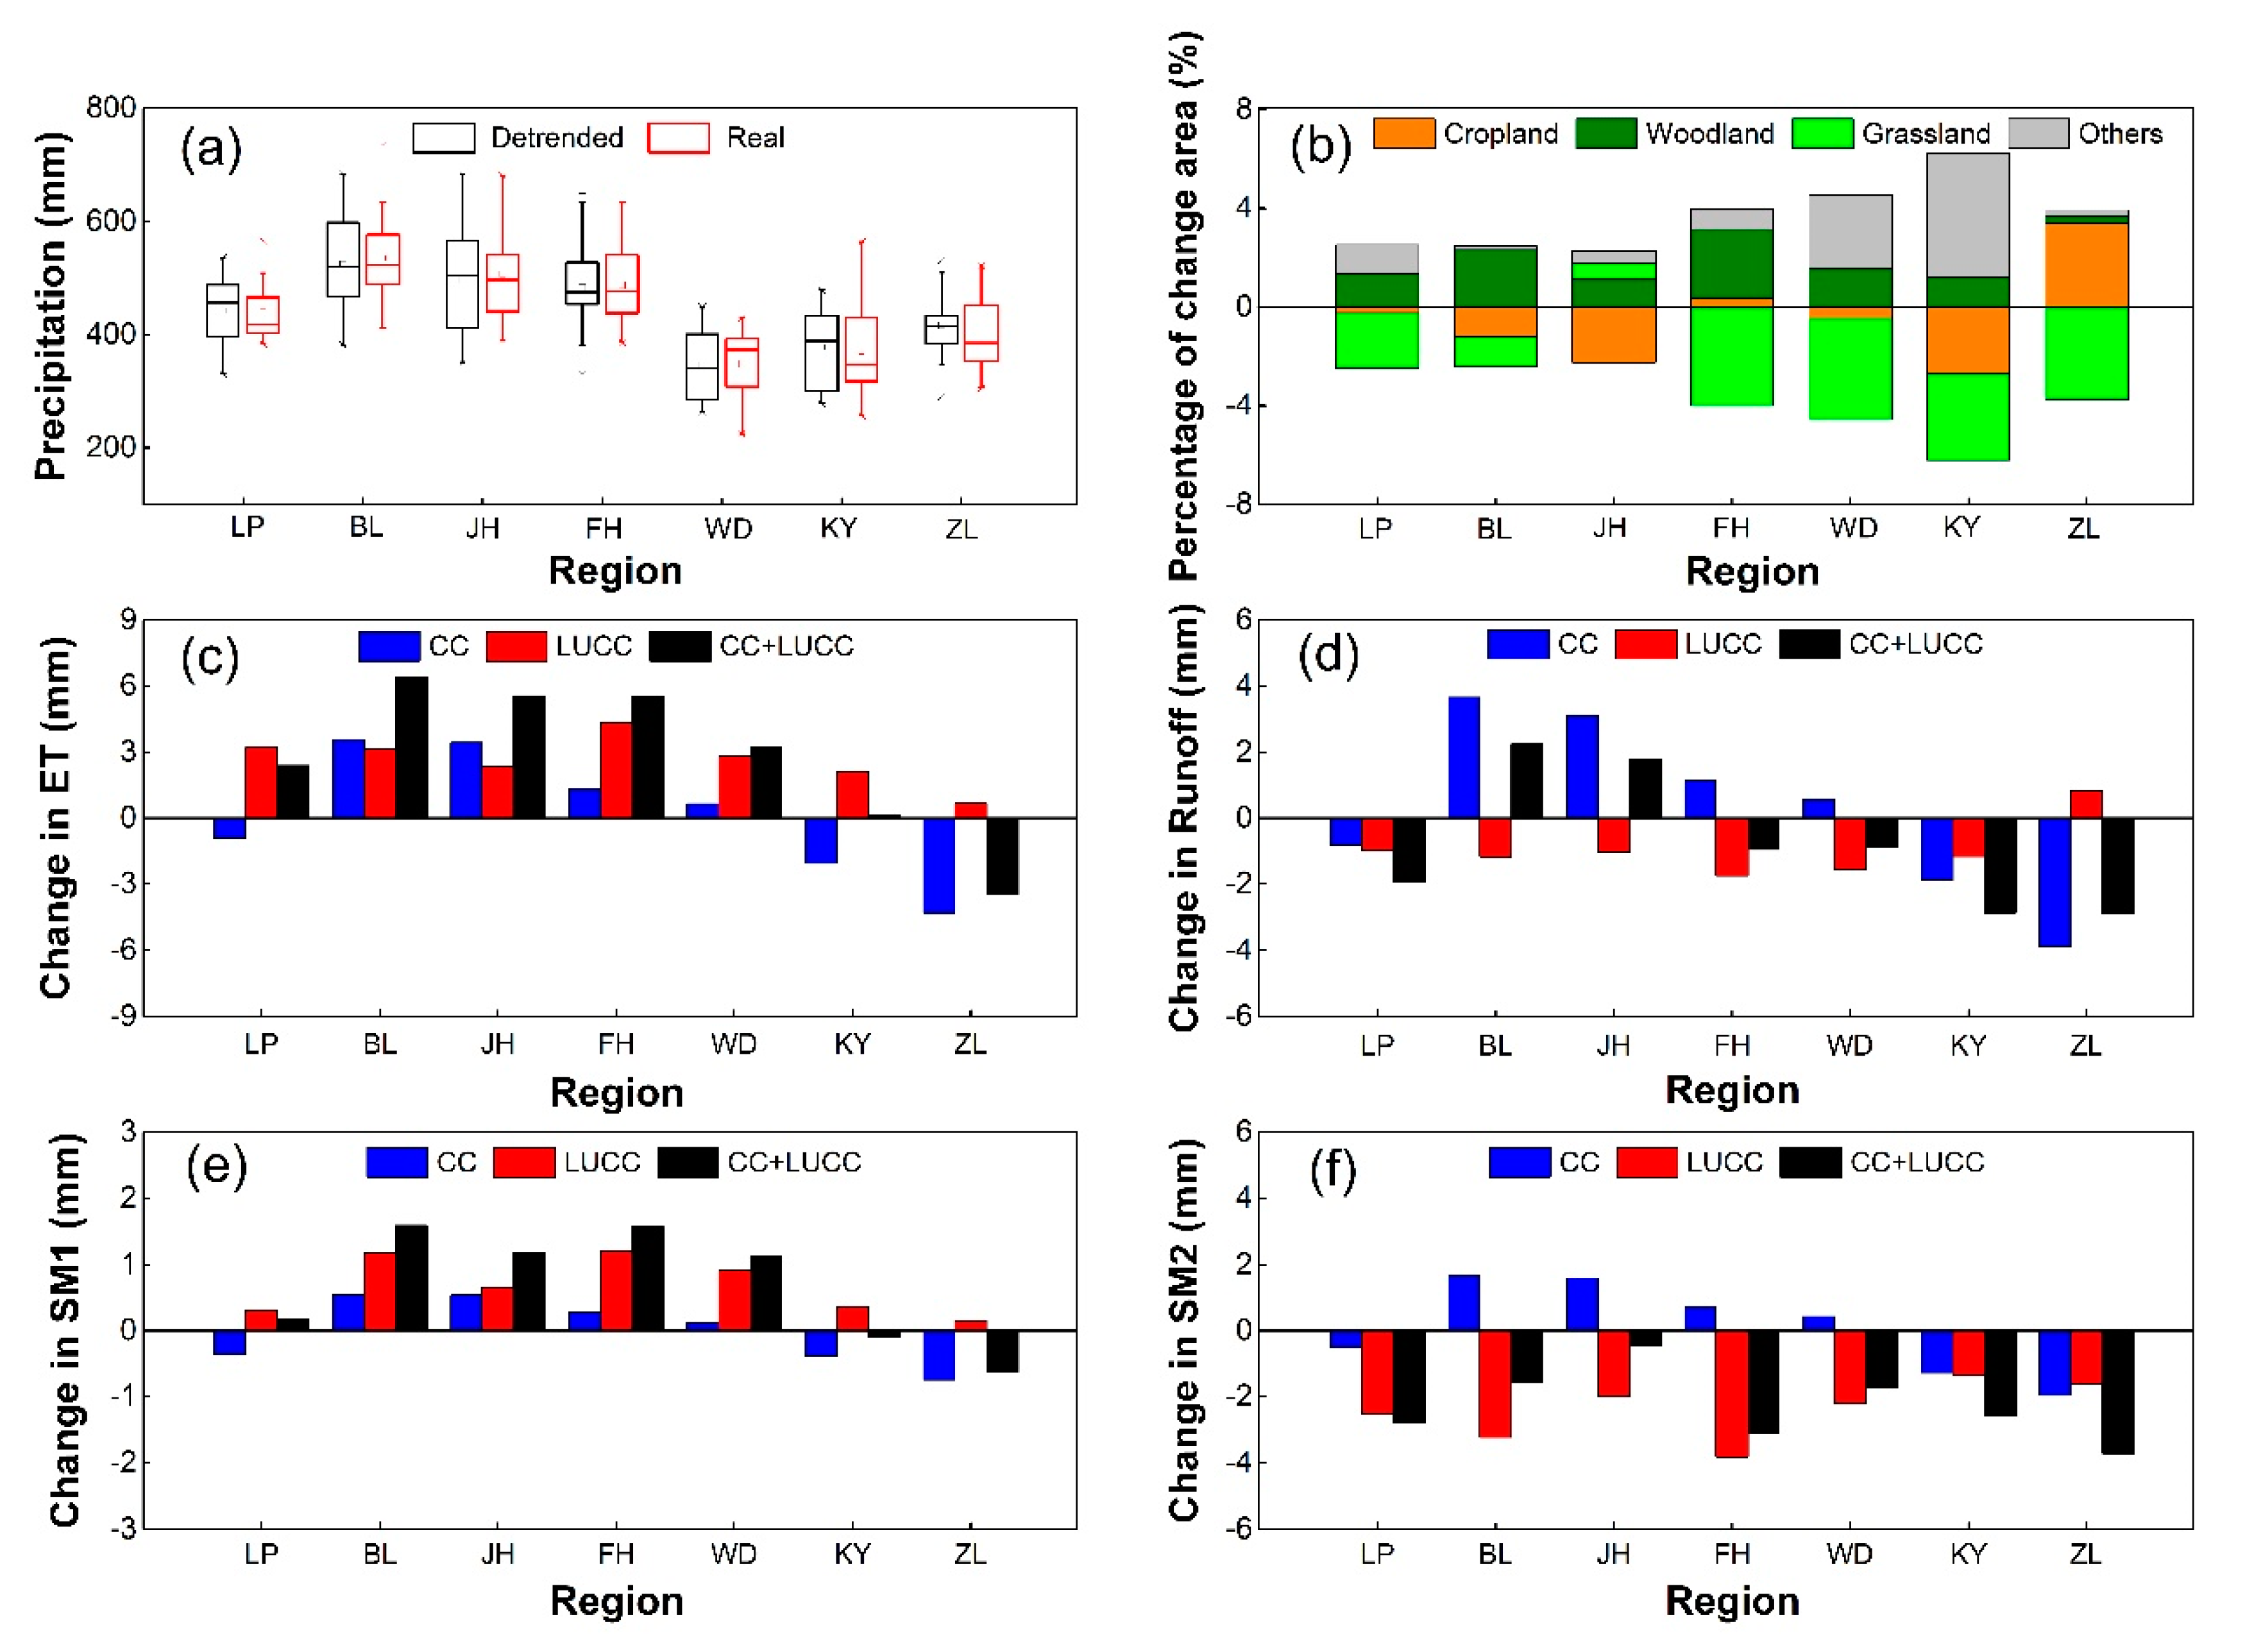
Compared with detrended meteorological variables during the period 2000–2015, precipitation on the Loess Plateau showed a slight decline by 3.35 mm, with a smaller variability in annual mean precipitation, and the variation in the precipitation of each catchment was, in order from high to low, BL (11.25 mm) > JH (10.04 mm) > FH (4 mm) > WD (2.21 mm) > KY (−6.87 mm) > ZL (−13.5 mm) (Figure 10a). The land cover in the Loess Plateau has experienced obvious changes since 1999, and the change rates of cropland, grassland, and woodland between LULC2010 and LULC1990 were shown in Figure 10b. Benefiting from GGP, there was a notable increase in woodland in the Loess Plateau, in six catchments with varying degrees, whereas grassland and cropland significantly decreased, expecting in JH and ZL. Figure 10c–f showed the variations in four HVs, caused by different factors. In general, the ET and SM1 increased by an annual mean value of 2.4 mm and 0.18 mm, while Runoff and SM2 decreased by 1.91 mm and 2.77 mm in the Loess Plateau, influenced by the coeffects of CC and LUCC, and the variations in HVs induced by LUCC were higher than those induced by CC, excepting SM1. The variations in HVs caused by CC were consistent with precipitation change, indicating that the increase in precipitation was a direct driving factor in the increase in HVs. The impact of vegetation changes on each hydrological variable was relatively uniform, with some variation in degrees, i.e., increasing ET and SM1 and decreasing Runoff and SM2, which mainly resulted from the conversion of cropland and grassland to woodland, expect Runoff in ZL.
Due to differences in climate change intensity and vegetation conversion modes, the impact of CC and LUCC on the HVs of Loess Plateau and six catchments exhibited obvious differences. The variation in HVs in the FH, where woodland increased most (2.77%), with a slight increase in precipitation, was dominated by vegetation change, followed by WD, whereas the hydrologic processes in ZL were more influenced by climate change, with an obvious and larger decrease in precipitation detected alongside the major vegetation conversion of grassland to cropland, which had a relatively small impact on hydrological processes. However, the variation in the four HVs in BL and JH was dominated by different factor; vegetation change contributed more to the increase in ET and decrease in Runoff, while climate change dominated variations in SM1 and SM2. Differences in the response level of the four HVs to changes in precipitation, as discussed in Section 3.3.2, likely to account for this. Among the six catchments, KY exhibited the greatest complexity, with comparable contributions of CC and LUCC in absolute values of variation in the four HVs, while the increase in other land covers may serve as a key uncertainty to influence hydrologic processes, which was not analyzed in this paper. The results suggest that the responses of the four HVs to CC and LUCC were significantly different in the six catchments, which may be related to the conversion mode of vegetation and the intensity of climate change.
4. Discussion
4.1. Hydrological Effect of Vegetation Conversion
Vegetation is critical in the hydrological cycle [69,70]. Disturbance, both natural (e.g., wildfire, insect outbreaks, disease, windstorms, drought) and anthropogenic (e.g., timber harvesting, land conversion), can have a profound effect on hydrological processes, through impact on vegetation dynamics. The Loess Plateau is covered by nearly 100 m loess in thickness and a loose soil structure [71], and the groundwater level is relatively deep, up to 30–100 m below surface [72], making it difficult to effectively replenish soil moisture. Little of the groundwater at these depths can be used as a supply for soil evaporation and plant transpiration [28], and precipitation acts as the only natural source of water. Vegetation plays a redistributive role in precipitation, distributing precipitation into canopy interception, surface runoff, soil moisture, and subsurface runoff. Different vegetation classes have different precipitation allocation strategies, and vegetation change will lead to obvious changes in the precipitation distribution ratio between these hydrological variables [11,73,74]. Runoff is very sensitive to vegetation change. The study of Wang et al. [75] found that the conversion of grassland to forest decreased the annual water yield from slope by 50–100 mm, which was further confirmed in our study. Increased canopy interception by woodland accounted for a fraction of the decline in runoff, while a decrease in runoff infiltrates the soil and becomes soil moisture, especially during high-intensity rainfall, when water can replenish deeper soil. However, many studies have demonstrated that artificial trees can consume more water than natural native species [30,33,75]. Higher evapotranspiration of forests consumes more soil moisture than crop and grass and the increase in soil moisture was insufficient to support the increase in ET, which resulted in a decline in deep soil moisture [14,31,32,34]. A similar conclusion was found by Feng et al. [26], who detected a systematic, significant and negative trend in the soil moisture of Loess Plateau (p < 0.001) based on data estimated by the Community Land Model GLDAS, and confirmed that the ecosystem was mining soil water. These results were consistent with the reported soil desiccation in the Loess Plateau that had been attributed to the excessive depletion of deep soil water by planted vegetation and long-term insufficient precipitation input [76].
Our results suggested that the conversion of cropland and grassland to woodland, closely related to GGP, obviously changes hydrologic processes by increasing ET and decreasing runoff and deep soil moisture, which exacerbates soil water consumption and causes soil drying. The implementation of GGP aims to effectively reduce soil erosion, alleviate land degradation and improve ecosystem services, while soil drought, which was induced by more consumption of soil water to meet increased ET, and may directly cause ecosystem degradation, was not expected. By contrast, the conversion of cropland to grassland reduced runoff and increased soil moisture overall, which has a better effect on controlling soil erosion and water conservation.
4.2. Uncertainties and Limitations
The uncertainties of this study mainly came from two factors, i.e., meteorological forcing data and parameters. The meteorological forcing dataset was generated by employing the Synagraphic Mapping System (SYMAP) interpolation algorithm and based on observation data of 112 meteorological stations. Though we selected as many stations as possible, to ensure the accuracy of meteorological data, uncertainties were inevitably introduced in the interpolation from point to face, especially for wind speed, which has great and unpredictable variability in both time and space. Precipitation proved to be the most critical input for hydrological models and a tiny deviation is likely to result in great uncertainties. Parameters after calibration and validation were considered reasonable and applicable to simulate hydrologic processes in the catchments. Using a parameter dataset (i.e., six parameters with calibration) to characterize all grid cells of a catchment was a generalized description of the catchment features. Furthermore, parameter implementation, which was actually based on an idealized assumption for simulation in uncalibrated regions, was essential for hydrological simulation from catchment-scale up to region-scale [57,77]. In this study, though further validations were conducted in some catchments to ensure the reliability of parameter transplantation, and obtained a relatively satisfactory result, a potential uncertainty still existed, which may directly influence the model performance and call for improved parameterization.
In addition to these uncertainties, there were several limitations that need to be further examined for consideration and improvement in subsequent studies. The version of VIC model used in this study employed static vegetation parameters for the whole study period. In order to detect the impact of vegetation change on hydrologic processes, two vegetation parameter datasets were applied to characterize the land cover of Loess Plateau before and after the implementation of GGP. However, vegetation change was a continuous and serial process accompanied by GGP, and this application was considered a less than ideal alternative, with the assumption that land cover changes were completed in an instant at 1999. Thus, the changes of the four HVs over the period 1984–2015 were actually changes in HVs driven by climate change in the land covers of two periods before and after 1999, which were insufficient to reflect the actual trend of HVs under the influence of CC and LUCC. Therefore, to avoid this potential bias, we employed the variation in HVs between the two scenario simulations, rather than the trend, to detect the impact of CC and LUCC. An improvement in VIC model, updating the land cover information in simulations, which depends on yearly dynamic vegetation parameters (i.e., vegetation classes and LAI) that can be retrieved from remote sensing data, was requisite to solve this problem thoroughly. Besides, scenario simulation methods were widely used in the study of the effect of CC and LUCC on hydrological processes. As designed in this study, two vegetation parameter datasets and two forcing datasets were combined over different scenarios, to distinguish the impact of each factor. However, climate conditions and land cover were always closely connected, including feedback and response. For example, the effect of LUCC was separated by changing the land cover in a detrended climate condition, while the effect of LUCC was likely to be strengthened or weakened in the context of actual climate change. Several previous studies confirmed a close interaction between climate and land cover [78,79]. In this study, this interaction can be further confirmed by the fact that the sum of variations in each hydrological variable induced by CC and LUCC was not equal to that induced by the coeffect, indicating there was not a simple addition relationship between the effects of CC and LUCC. The scenario simulations unavoidably split this link and interaction [39], and inevitably introduce a certain bias in quantifying the variation in HVs, induced by CC and LUCC. Improvement of the VIC model by coupling dynamic vegetation processes in a changing climate background would be favorable to remedy this issue.
5. Conclusions
In this study, the VIC model was employed to simulate the water fluxes and states in the Loess Plateau from 1965 to 2015. With the evaluation of VIC simulations, using observed streamflow records and multi-source datasets of ET and soil moisture, VIC was confirmed to successfully capture the magnitude and inter-annual variability of streamflow, evapotranspiration, runoff, and soil moisture over the Loess Plateau. The following conclusions can be drawn:
- The ET and SM1 increased slightly during the period 1984–2015 over the entire Loess Plateau, while a decreasing trend was found in Runoff and SM2. The changes in hydrological variables across the Loess Plateau exhibits clear spatial heterogeneity, and the central loess plateau experienced an obvious increase in ET, and decrease in Runoff and SM2.
- The hydrological variables were significantly related to precipitation. The response levels of HVs to precipitation were different in the three vegetation classes.
- Vegetation conversions had a significant impact on hydrologic processes, especially conversion of cropland to woodland (cw), which causes a dramatic increase in ET and decrease in SM2. The three vegetation conversions decreased runoff and converted it to soil moisture, leading to an obvious increase in SM1 and SM2 on rainfall days, while ET, especially for cw and gw, was considerably higher than that before conversion on non-rainfall days.
- Land cover change contributed more to the variation in HVs in the Loess Plateau, while different factors were detected to control the change of hydrologic processes in six catchments. There existed a trade-off between mode and intensity of vegetation conversion versus degree of climate change.
Both climate change and vegetation conversions have been proved to have a notable impact on hydrologic processes, especially the mode and intensity of vegetation conversion. It is important to generate effective strategies to implement vegetation restoration scientifically in the context of climate change, including selecting a reasonable vegetation conversion mode and quantity, according to local conditions, which is critical to maintain a benign water cycle and achieve sustainable development of ecosystems.
Supplementary Materials
The following are available online at https://www.mdpi.com/2073-4441/11/11/2241/s1. Table S1: Determination method of six target VIC grid cells of three typical vegetation and three vegetation conversion modes.
Author Contributions
Conceptualization, S.Y. and Y.G.; Methodology, S.Y. and J.B.; Software, S.Y., J.B. and T.K.; Validation, Y.G.; Formal Analysis, S.Y.; Investigation, S.Y., J.C. and Y.G.; Resources, S.Y. and Y.G.; Data Curation, Y.G.; Writing—Original Draft Preparation, S.Y.; Writing—Review and Editing, T.K., J.B., J.C. and Y.G.; Visualization, S.Y. and J.B.; Supervision, Y.G.; Project Administration, Y.G.; Funding Acquisition, Y.G.
Funding
This research was financially supported by the National Key Project for Research and Development of China (No. 2016YFC0501605).
Acknowledgments
We would like to express our heartfelt gratefulness to the academic editor and two anonymous reviewers for their serious and meticulous work, and precious suggestions which made great contribution to substantially improve this paper.
Conflicts of Interest
The authors declare no conflict of interest.
Appendix A

Table A1.
Information of eight catchments used for calibrating and validating parameters and the performance of the VIC model for monthly runoff simulation in each catchment.
Table A1.
Information of eight catchments used for calibrating and validating parameters and the performance of the VIC model for monthly runoff simulation in each catchment.
| Gauging Station | Catchment | Area (km2) | Latitude | Longitude | Calibration Period (1965–1974) | Validation Period (1975–1984) | ||
|---|---|---|---|---|---|---|---|---|
| NSE | BIAS (%) | NSE | BIAS (%) | |||||
| Shenmu | KY | 7298 | 38°48′ | 110°30′ | 0.82 | −4.84 | 0.80 | −6.12 |
| Yitang | FH | 23945 | 37°00′ | 111°50′ | 0.80 | −10.95 | 0.75 | 13.11 |
| Dingjiagou | WD | 23422 | 37°33′ | 110°15′ | 0.79 | 7.13 | 0.70 | 11.08 |
| Suide | DL | 3893 | 37°30′ | 110°14′ | 0.84 | 9.08 | 0.79 | 14.19 |
| Jiaokouhe | BL | 17180 | 35°39′ | 109°21′ | 0.74 | 15.32 | 0.62 | 24.19 |
| Yangjiaping | JH | 14124 | 35°20′ | 107°44′ | 0.67 | −14.77 | 0.71 | −12.29 |
| Yuluoping | ML | 19019 | 35°20′ | 107°53′ | 0.59 | 15.35 | 0.65 | 10.28 |
| Jingyuan | ZL | 10647 | 36°33′ | 104°40′ | 0.80 | 7.22 | 0.74 | 11.82 |
Table A2.
Information of additional eight catchments used for validating the parameter implementation of the VIC model for monthly runoff simulation in each catchment.
Table A2.
Information of additional eight catchments used for validating the parameter implementation of the VIC model for monthly runoff simulation in each catchment.
| Gauging Station | Catchment | Area (km2) | Latitude | Longitude | Period | NSE | BIAS (%) |
|---|---|---|---|---|---|---|---|
| Wenjiachuan | KY | 8515 | 38°29′ | 110°45′ | 1965–1984 | 0.81 | −7.75 |
| Chaizhuang | FH | 33932 | 35°48′ | 111°24′ | 1965–1984 | 0.68 | 9.19 |
| Baijiachuan | WD | 29662 | 37°14′ | 110°25′ | 1965–1984 | 0.56 | 26.81 |
| Zhuangtou | BL | 25154 | 35°02′ | 109°50′ | 1965–1984 | 0.74 | 14.22 |
| Jingcun | JH | 40281 | 35°00′ | 108°08′ | 1965–1984 | 0.76 | −18.94 |
| Fangniugou | HH | 5461 | 39°57′ | 111°33′ | 1965–1984 | 0.63 | −10.54 |
| Gaojiachuan | TW | 3253 | 38°15′ | 110°29′ | 1965–1984 | 0.72 | 5.92 |
| Daning | XS | 3992 | 36°28′ | 110°43′ | 1965–1984 | 0.77 | 15.36 |
References
- Oki, T.; Kanae, S. Global hydrological cycles and world water resources. Science 2006, 313, 1068–1072. [Google Scholar] [CrossRef] [PubMed]
- Sherwood, S.; Fu, Q. A Drier Future? Science 2014, 343, 737–739. [Google Scholar] [CrossRef] [PubMed]
- Frans, C.; Istanbulluoglu, E.; Mishra, V.; Munoz-Arriola, F.; Lettenmaier, D.P.; Muñoz-Arriola, F. Are climatic or land cover changes the dominant cause of runoff trends in the Upper Mississippi River Basin? Geophys. Res. Lett. 2013, 40, 1104–1110. [Google Scholar] [CrossRef]
- Greene, E.M.; Liston, G.E.; Pielke, R.A. Relationships between landscape, snowcover depletion, and regional weather and climate. Hydrol. Process. 1999, 13, 2453–2466. [Google Scholar] [CrossRef]
- Allen, M.R.; Ingram, W.J. Constraints on future changes in climate and the hydrologic cycle. Nature 2002, 419, 224–232. [Google Scholar] [CrossRef]
- Li, Q.Y.; Sun, Y.W.; Yuan, W.L.; Lyu, S.B.; Wan, F. Streamflow responses to climate change and LUCC in a semi-arid watershed of Chinese Loess Plateau. J. Arid Land 2017, 9, 609–621. [Google Scholar] [CrossRef] [Green Version]
- Niehoff, D.; Fritsch, U.; Bronstert, A. Land-use impacts on storm-runoff generation: Scenarios of land-use change and simulation of hydrological response in a meso-scale catchment in SW-Germany. J. Hydrol. 2002, 267, 80–93. [Google Scholar] [CrossRef]
- Zhang, X.P.; Zhang, L.; Zhao, J.; Rustomji, P.; Hairsine, P. Responses of streamflow to changes in climate and land use/cover in the Loess Plateau, China. Water Resour. Res. 2008. [Google Scholar] [CrossRef]
- Fu, B.J.; Wang, S.; Liu, Y.; Liu, J.B.; Liang, W.; Miao, C.Y. Hydrogeomorphic ecosystem responses to natural and anthropogenic changes in the Loess Plateau of China. Annu. Rev. Earth Planet. Sci. 2017, 45, 223–243. [Google Scholar] [CrossRef]
- Xiao, J.F. Satellite evidence for significant biophysical consequences of the “Grain for Green” Program on the Loess Plateau in China. J. Geophys. Res. Biogeosci. 2014, 119, 2261–2275. [Google Scholar] [CrossRef]
- Liang, W.; Bai, D.; Wang, F.Y.; Fu, B.J.; Yan, J.P.; Wang, S.; Yang, Y.T.; Long, D.; Feng, M.Q. Quantifying the impacts of climate change and ecological restoration on streamflow changes based on a Budyko hydrological model in China’s Loess Plateau. Water Resour. Res. 2015, 51, 6500–6519. [Google Scholar] [CrossRef]
- Zhang, S.L.; Yang, H.B.; Yang, D.W.; Jayawardena, A.W. Quantifying the effect of vegetation change on the regional water balance within the Budyko framework. Geophys. Res. Lett. 2016, 43, 1140–1148. [Google Scholar] [CrossRef]
- Wang, Y.Q.; Shao, M.A.; Zhu, Y.J.; Liu, Z.P. Impacts of land use and plant characteristics on dried soil layers in different climatic regions on the Loess Plateau of China. Agric. For. Meteorol. 2011, 151, 437–448. [Google Scholar] [CrossRef]
- Liang, H.B.; Xue, Y.Y.; Li, Z.S.; Wang, S.; Wu, X.; Gao, G.Y.; Liu, G.H.; Fu, B.J. Soil moisture decline following the plantation of Robinia pseudoacacia forests: Evidence from the Loess Plateau. For. Ecol. Manag. 2018, 412, 62–69. [Google Scholar] [CrossRef]
- Zhang, S.L.; Yang, D.W.; Yang, Y.T.; Piao, S.L.; Yang, H.B.; Lei, H.M.; Fu, B.J. Excessive afforestation and soil drying on China’s Loess Plateau. J. Geophys. Res. Biogeosci. 2018, 123, 923–935. [Google Scholar] [CrossRef]
- Wang, Q.X.; Fan, X.H.; Qin, Z.D.; Wang, M.B. Change trends of temperature and precipitation in the Loess Plateau Region of China, 1961–2010. Glob. Planet. Chang. 2012, 92–93, 138–147. [Google Scholar] [CrossRef]
- Sun, Q.H.; Miao, C.Y.; Duan, Q.Y.; Wang, Y.F. Temperature and precipitation changes over the Loess Plateau between 1961 and 2011, based on high-density gauge observations. Glob. Planet. Chang. 2015, 132, 1–10. [Google Scholar] [CrossRef]
- Tang, Q.H.; Oki, T.; Kanae, S.; Hu, H.P. Hydrological cycles change in the Yellow River basin during the last half of the twentieth century. J. Clim. 2008, 21, 1790–1806. [Google Scholar] [CrossRef]
- Wang, F.; Hessel, R.; Mu, X.M.; Maroulis, J.; Zhao, G.J.; Geissen, V.; Ritsema, C. Distinguishing the impacts of human activities and climate variability on runoff and sediment load change based on paired periods with similar weather conditions: A case in the Yan River, China. J. Hydrol. 2015, 527, 884–893. [Google Scholar] [CrossRef]
- Feng, X.M.; Cheng, W.; Fu, B.J.; Lu, Y.H. The role of climatic and anthropogenic stresses on long-term runoff reduction from the Loess Plateau, China. Sci. Total Environ. 2016, 571, 688–698. [Google Scholar] [CrossRef]
- Gao, G.Y.; Fu, B.J.; Wang, S.; Liang, W.; Jiang, X. Determining the hydrological responses to climate variability and land use/cover change in the Loess Plateau with the Budyko framework. Sci. Total Environ. 2016, 557, 331–342. [Google Scholar] [CrossRef] [PubMed]
- Wang, F.Y.; Duan, K.Q.; Fu, S.Y.; Gou, F.; Liang, W.; Yan, J.W.; Zhang, W.B. Partitioning climate and human contributions to changes in mean annual streamflow based on the Budyko complementary relationship in the Loess Plateau, China. Sci. Total Environ. 2019, 665, 579–590. [Google Scholar] [CrossRef]
- Zhao, G.J.; Tian, P.; Mu, X.M.; Jiao, J.Y.; Wang, F.; Gao, P. Quantifying the impact of climate variability and human activities on streamflow in the middle reaches of the Yellow River basin, China. J. Hydrol. 2014, 519, 387–398. [Google Scholar] [CrossRef]
- Gao, Z.L.; Zhang, L.; Zhang, X.P.; Cheng, L.; Potter, N.; Cowan, T.; Cai, W.J. Long-term streamflow trends in the middle reaches of the Yellow River Basin: Detecting drivers of change. Hydrol. Process. 2016, 30, 1315–1329. [Google Scholar] [CrossRef]
- Li, B.Q.; Liang, Z.M.; Zhang, J.Y.; Wang, G.Q.; Zhao, W.M.; Zhang, H.Y.; Wang, J.; Hu, Y.M. Attribution analysis of runoff decline in a semiarid region of the Loess Plateau, China. Theor. Appl. Climatol. 2018, 131, 845–855. [Google Scholar] [CrossRef]
- Feng, X.M.; Fu, B.J.; Piao, S.; Wang, S.H.; Ciais, P.; Zeng, Z.Z.; Lu, Y.H.; Zeng, Y.; Li, Y. Revegetation in China’s Loess Plateau is approaching sustainable water resource limits. Nat. Clim. Chang. 2016, 6, 1019–1022. [Google Scholar] [CrossRef]
- Li, S.; Liang, W.; Fu, B.J.; Lu, Y.H.; Fu, S.Y.; Wang, S.; Su, H.M. Vegetation changes in recent large-scale ecological restoration projects and subsequent impact on water resources in China’s Loess Plateau. Sci. Total Environ. 2016, 569, 1032–1039. [Google Scholar] [CrossRef]
- Yang, L.; Wei, W.; Chen, L.; Jia, F.; Mo, B. Spatial variations of shallow and deep soil moisture in the semi-arid Loess Plateau, China. Hydrol. Earth Syst. Sci. 2012, 16, 3199–3217. [Google Scholar] [CrossRef] [Green Version]
- Yao, X.L.; Fu, B.J.; Lü, Y.H.; Chang, R.Y.; Wang, S.; Wang, Y.F.; Su, C.H. The multi-scale spatial variance of soil moisture in the semi-arid Loess Plateau of China. J. Soils Sediments 2012, 12, 694–703. [Google Scholar] [CrossRef]
- Wang, L.; Wang, Q.J.; Wei, S.P.; Shao, M.A.; Li, Y. Soil desiccation for Loess soils on natural and regrown areas. For. Ecol. Manag. 2008, 255, 2467–2477. [Google Scholar] [CrossRef]
- Wang, S.; Fu, B.J.; Gao, G.Y.; Liu, Y.; Zhou, J. Responses of soil moisture in different land cover types to rainfall events in a re-vegetation catchment area of the Loess Plateau, China. Catena 2013, 101, 122–128. [Google Scholar] [CrossRef]
- Jia, Y.H.; Shao, M.A. Dynamics of deep soil moisture in response to vegetational restoration on the Loess Plateau of China. J. Hydrol. 2014, 519, 523–531. [Google Scholar] [CrossRef]
- Jia, X.X.; Shao, M.A.; Zhu, Y.J.; Luo, Y. Soil moisture decline due to afforestation across the Loess Plateau, China. J. Hydrol. 2017, 546, 113–122. [Google Scholar] [CrossRef]
- Tian, F.; Feng, X.M.; Zhang, L.; Fu, B.J.; Wang, S.; Lv, Y.H.; Wang, P. Effects of revegetation on soil moisture under different precipitation gradients in the Loess Plateau, China. Hydrol. Res. 2017, 48, 1378–1390. [Google Scholar] [CrossRef]
- Wang, Y.Q.; Shao, M.A.; Shao, H.B. A preliminary investigation of the dynamic characteristics of dried soil layers on the Loess Plateau of China. J. Hydrol. 2010, 381, 9–17. [Google Scholar] [CrossRef]
- Zhang, C.C.; Shao, M.A.; Jia, X.X. Spatial continuity and local conditions determine spatial pattern of dried soil layers on the Chinese Loess Plateau. J. Soils Sediments 2017, 17, 2030–2039. [Google Scholar] [CrossRef]
- Jia, Y.H.; Li, T.C.; Shao, M.A.; Hao, J.H.; Wang, Y.Q.; Jia, X.X.; Zeng, C.; Fu, X.L.; Liu, B.X.; Gan, M.; et al. Disentangling the formation and evolvement mechanism of plants-induced dried soil layers on China’s Loess Plateau. Agric. For. Meteorol. 2019, 269, 57–70. [Google Scholar] [CrossRef]
- Zhang, L.; Zhao, F.F.; Chen, Y.; Dixon, R.N.M. Estimating effects of plantation expansion and climate variability on streamflow for catchments in Australia. Water Resour. Res. 2011. [Google Scholar] [CrossRef]
- Wu, J.W.; Miao, C.Y.; Zhang, X.M.; Yang, T.T.; Duan, Q.Y. Detecting the quantitative hydrological response to changes in climate and human activities. Sci. Total Environ. 2017, 586, 328–337. [Google Scholar] [CrossRef]
- Zhu, X.A.; Li, Y.S.; Peng, X.A.; Zhang, S.G. Soils of the loess region in China. Geoderma 1983, 29, 237–255. [Google Scholar]
- Wang, Y.Q.; Shao, M.A.; Liu, Z.P. Vertical distribution and influencing factors of soil water content within 21-m profile on the Chinese Loess Plateau. Geoderma 2013, 193–194, 300–310. [Google Scholar] [CrossRef]
- Li, Y.S.; Huang, M.B. Pasture yield and soil water depletion of continuous growing alfalfa in the Loess Plateau of China. Agric. Ecosyst. Environ. 2008, 124, 24–32. [Google Scholar] [CrossRef]
- Liang, X.; Lettenmaier, D.P.; Wood, E.F.; Burges, S.J. A simple hydrologically based model of land surface water and energy fluxes for general circulation models. J. Geophys. Res. 1994, 99, 14415–14428. [Google Scholar] [CrossRef]
- Liang, X.; Wood, E.F.; Lettenmaier, D.P. Surface soil moisture parameterization of the VIC-2L model: Evaluation and modification. Glob. Planet. Chang. 1996, 13, 195–206. [Google Scholar] [CrossRef]
- Nijssen, B.; Schnur, R.; Lettenmaier, D.P. Global retrospective estimation of soil moisture using the variable infiltration capacity land surface model, 1980–1993. J. Clim. 2001, 14, 1790–1808. [Google Scholar] [CrossRef]
- Sheffield, J. A simulated soil moisture based drought analysis for the United States. J. Geophys. Res. 2004. [Google Scholar] [CrossRef]
- Xie, Z.H.; Yuan, F.; Duan, Q.Y.; Zheng, J.; Liang, M.L.; Chen, F. Regional parameter estimation of the VIC land surface model: Methodology and application to river basins in China. J. Hydrometeorol. 2007, 8, 447–468. [Google Scholar] [CrossRef]
- Sheffield, J.; Livneh, B.; Wood, E. Representation of terrestrial hydrology and large-scale drought of the continental United States from the North American regional reanalysis. J. Hydrometeorol. 2012, 13, 856–876. [Google Scholar] [CrossRef]
- Byun, K.; Chiu, C.-M.; Hamlet, A.F. Effects of 21st century climate change on seasonal flow regimes and hydrologic extremes over the Midwest and Great Lakes region of the US. Sci. Total Environ. 2019, 650, 1261–1277. [Google Scholar] [CrossRef]
- Cherkauer, K.A.; Lettenmaier, D.P. Hydrologic effects of frozen soils in the upper Mississippi River basin. J. Geophys. Res. Atmos. 1999, 104, 19599–19610. [Google Scholar] [CrossRef]
- Zhao, R.J. The Xinanjiang model applied in China. J. Hydrol. 1992, 135, 371–381. [Google Scholar]
- Todini, E. The ARNO rainfall-runoff model. J. Hydrol. 1996, 175, 339–382. [Google Scholar] [CrossRef]
- Liang, X.; Xie, Z.H. A new surface runoff parameterization with subgrid-scale soil heterogeneity for land surface models. Adv. Water Resour. 2001, 24, 1173–1193. [Google Scholar] [CrossRef]
- Liang, X.; Xie, Z.; Huang, M. A new parameterization for surface and groundwater interactions and its impact on water budgets with the variable infiltration capacity (VIC) land surface model. J. Geophys. Res. 2003. [Google Scholar] [CrossRef]
- Lohmann, D.; Nolte-Holube, R.; Raschke, E. A large-scale horizontal routing model to be coupled to land surface parametrization schemes. Tellus Ser. Dyn. Meteorol. Oceanogr. 1996, 48, 708–721. [Google Scholar] [CrossRef]
- Lohmann, D.; Raschke, E.; Nijssen, B.; Lettenmaier, D.P. Regional scale hydrology: I. Formulation of the VIC-2L model coupled to a routing model. Hydrol. Sci. J. 1998, 43, 131–141. [Google Scholar] [CrossRef]
- Zhang, X.J.; Tang, Q.h.; Pan, M.; Tang, Y. A Long-term land surface hydrologic fluxes and states dataset for China. J. Hydrometeorol. 2014, 15, 2067–2084. [Google Scholar] [CrossRef]
- Cuo, L.; Zhang, Y.X.; Wang, Q.C.; Zhang, L.L.; Zhou, B.R.; Hao, Z.C.; Su, F.G. Climate change on the northern Tibetan Plateau during 1957–2009: Spatial patterns and possible mechanisms. J. Clim. 2013, 26, 85–109. [Google Scholar] [CrossRef]
- Xie, X.H.; Liang, S.L.; Yao, Y.J.; Jia, K.; Meng, S.S.; Li, J. Detection and attribution of changes in hydrological cycle over the Three-North region of China: Climate change versus afforestation effect. Agric. For. Meteorol. 2015, 203, 74–87. [Google Scholar] [CrossRef]
- Liu, J.Y.; Tian, H.Q.; Liu, M.L.; Zhuang, D.F.; Melillo, J.M.; Zhang, Z.X. China’s changing landscape during the 1990s: Large-scale land transformations estimated with satellite data. Geophys. Res. Lett. 2005. [Google Scholar] [CrossRef]
- Saxton, K.E.; Rawls, W.J. Soil water characteristic estimates by texture and organic matter for hydrologic solutions. Soil Sci. Soc. Am. J. 2006, 70, 1569–1578. [Google Scholar] [CrossRef]
- Su, B.; Wang, A.Q.; Wang, G.J.; Wang, Y.J.; Jiang, T. Spatiotemporal variations of soil moisture in the Tarim River basin, China. Int. J. Appl. Earth Obs. Geoinf. 2016, 48, 122–130. [Google Scholar] [CrossRef]
- Yang, K.; Zhu, L.; Chen, Y.Y.; Zhao, L.; Qin, J.; Lu, H.; Tang, W.J.; Han, M.L.; Ding, B.H.; Fang, N. Land surface model calibration through microwave data assimilation for improving soil moisture simulations. J. Hydrol. 2016, 533, 266–276. [Google Scholar] [CrossRef]
- Mu, Q.; Heinsch, F.A.; Zhao, M.; Running, S.W. Development of a global evapotranspiration algorithm based on MODIS and global meteorology data. Remote Sens. Environ. 2007, 111, 519–536. [Google Scholar] [CrossRef]
- Zhang, K.; Kimball, J.S.; Nemani, R.R.; Running, S.W.; Hong, Y.; Gourley, J.J.; Yu, Z.B. Vegetation greening and climate change promote multidecadal rises of global land evapotranspiration. Sci. Rep. 2015, 5, sep15956. [Google Scholar] [CrossRef]
- Jung, M.; Reichstein, M.; Ciais, P.; Seneviratne, S.I.; Sheffield, J.; Goulden, M.L.; Bonan, G.; Cescatti, A.; Chen, J.; de Jeu, R.; et al. Recent decline in the global land evapotranspiration trend due to limited moisture supply. Nature 2010, 467, 951–954. [Google Scholar] [CrossRef] [PubMed]
- Lu, Y.H.; Fu, B.J.; Feng, X.M.; Zeng, Y.; Liu, Y.; Chang, R.Y.; Sun, G.; Wu, B.F. A policy-driven large scale ecological restoration: Quantifying ecosystem services changes in the Loess Plateau of China. PLoS ONE 2012, 7, e31782. [Google Scholar]
- Mao, D.; Cherkauer, K.A. Impacts of land-use change on hydrologic responses in the Great Lakes region. J. Hydrol. 2009, 374, 71–82. [Google Scholar] [CrossRef]
- Yang, D.W.; Shao, W.W.; Yeh, P.J.F.; Yang, H.B.; Kanae, S.; Oki, T. Impact of vegetation coverage on regional water balance in the nonhumid regions of China. Water Resour. Res. 2009. [Google Scholar] [CrossRef]
- Wang, L.X.; Wei, X.H.; Bishop, K.; Reeves, A.D.; Ursino, N.; Winkler, R. Vegetation changes and water cycle in a changing environment. Hydrol. Earth Syst. Sci. 2018, 22, 1731–1734. [Google Scholar] [CrossRef] [Green Version]
- Chen, L.D.; Wei, W.; Fu, B.J.; Lu, Y.H. Soil and water conservation on the Loess Plateau in China: Review and perspective. Prog. Phys. Geogr. Earth Environ. 2007, 31, 389–403. [Google Scholar] [CrossRef]
- Mu, X.M.; Xu, X.X.; Wang, W.L.; Wen, Z.M.; Du, F. Impact of artificial forest on soil moisture of the deep soil layer on loess plateau. Acta Pedol. Sin. 2003, 40, 210–217. [Google Scholar]
- Donohue, R.J.; Roderick, M.L.; McVicar, T.R. On the importance of including vegetation dynamics in Budyko’s hydrological model. Hydrol. Earth Syst. Sci. 2007, 11, 983–995. [Google Scholar] [CrossRef]
- Li, D.; Pan, M.; Cong, Z.T.; Zhang, L.; Wood, E. Vegetation control on water and energy balance within the Budyko framework. Water Resour. Res. 2013, 49, 969–976. [Google Scholar] [CrossRef]
- Wang, Y.H.; Yu, P.T.; Xiong, W.; Shen, Z.X.; Guo, M.C.; Shi, Z.J.; Du, A.P.; Wang, L.M. Water-yield reduction after afforestation and related processes in the semiarid Liupan Mountains, Northwest China. J. Am. Water Resour. Assoc. 2008, 44, 1086–1097. [Google Scholar] [CrossRef]
- Chen, H.S.; Shao, M.A.; Li, Y.Y. Soil desiccation in the Loess Plateau of China. Geoderma 2008, 143, 91–100. [Google Scholar] [CrossRef]
- Zhai, R.; Tao, F.; Xu, Z. Spatial–temporal changes in runoff and terrestrial ecosystem water retention under 1.5 and 2 °C warming scenarios across China. Earth Syst. Dyn. 2018, 9, 717–738. [Google Scholar] [CrossRef]
- Pan, Z.T.; Takle, E.; Segal, M.; Arritt, R. Simulation of potential impacts of man-made land use changes on US Summer climate under various synoptic regimes. J. Geophys. Res. Atmos. 1999, 104, 6515–6528. [Google Scholar] [CrossRef]
- Copeland, J.H.; Pielke, R.A.; Kittel, T.G.F. Potential climatic impacts of vegetation change: A regional modeling study. J. Geophys. Res. Atmos. 1996, 101, 7409–7418. [Google Scholar] [CrossRef]
Figure 1.
The Loess Plateau and six selected catchments.

Figure 2.
Observed and simulated monthly streamflow during calibration period (1965–1974) and validation period (1975–1984).
Figure 2.
Observed and simulated monthly streamflow during calibration period (1965–1974) and validation period (1975–1984).

Figure 3.
The correlation coefficient between simulated and observed soil moisture anomalies for soil depths of 0–10 cm and 10–100 cm.
Figure 3.
The correlation coefficient between simulated and observed soil moisture anomalies for soil depths of 0–10 cm and 10–100 cm.

Figure 4.
Comparison between simulated and observed soil moisture anomalies for depths of 0–10 cm and 10–100 cm in three typical stations.
Figure 4.
Comparison between simulated and observed soil moisture anomalies for depths of 0–10 cm and 10–100 cm in three typical stations.

Figure 5.
Spatial pattern of the multi-year mean value of four key HVs, (a) ET, (b) Runoff, (c) SM1, (d) SM2, simulated by VIC model from the period 1984–2015.
Figure 5.
Spatial pattern of the multi-year mean value of four key HVs, (a) ET, (b) Runoff, (c) SM1, (d) SM2, simulated by VIC model from the period 1984–2015.

Figure 6.
Spatial pattern of differences in the multi-year mean of four key HVs, (a) ET, (b) Runoff, (c) SM1, (d) SM2, simulated by VIC model during the two periods of 1984–1999 and 2000–2015.
Figure 6.
Spatial pattern of differences in the multi-year mean of four key HVs, (a) ET, (b) Runoff, (c) SM1, (d) SM2, simulated by VIC model during the two periods of 1984–1999 and 2000–2015.

Figure 7.
Temporal variations of runoff (Runoff), evapotranspiration (ET), shallow soil moisture (SM1) and deep soil moisture (SM2) for the CM from the years 1984 to 2015.
Figure 7.
Temporal variations of runoff (Runoff), evapotranspiration (ET), shallow soil moisture (SM1) and deep soil moisture (SM2) for the CM from the years 1984 to 2015.

Figure 8.
Response levels of the four key HVs to precipitation changes in three vegetation types.

Figure 9.
Impact of three typical vegetation conversion modes on the four key HVs. (a) Variations in multi-year mean value of water flux and state, (b) change rate of HVs in rainfall and non-rainfall days, before and after conversions, during the period 2000–2015.
Figure 9.
Impact of three typical vegetation conversion modes on the four key HVs. (a) Variations in multi-year mean value of water flux and state, (b) change rate of HVs in rainfall and non-rainfall days, before and after conversions, during the period 2000–2015.

Figure 10.
(a) Comparison of real and detrended precipitation during the period 2000–2015, (b) land cover change between LULC2010 and LULC1990, and variations induced by different factors in (c) ET, (d) Runoff, (e) SM1, (f) SM2 for Loess Plateau and six selected catchments during the period 2000–2015.

Table 1.
Experiment design and simulation scenarios used to detect the impact of climate and vegetation conversions during the period 1984–2015.
Table 1.
Experiment design and simulation scenarios used to detect the impact of climate and vegetation conversions during the period 1984–2015.
| Scenario | Vegetation Parameters | Forcing Data | Objectives | |
|---|---|---|---|---|
| 1984–1999 | 2000–2015 | |||
| Scenario0 (S0) | Veg1990 | Veg2010 | Real 1984–2015 | Base line |
| Scenario1 (S1) | Veg1990 | Veg2010 | Detrended 1984–2015 | To identify the effect of CC |
| Scenario2 (S2) | Veg1990 | Veg1990 | Real 1984–2015 | To identify the effect of LUCC |
| Scenario3 (S3) | Veg1990 | Veg1990 | Detrended 1984–2015 | To identify the co-effect of CC and LUCC |
Table 2.
Pearson correlation coefficient between the four HVs and two key meteorological factors.
| HVs | Vegetation | Precipitation | Temperature |
|---|---|---|---|
| ET | uc | 0.84 ** | −0.1 |
| ug | 0.88 ** | −0.17 | |
| uw | 0.78 ** | −0.2 | |
| Runoff | uc | 0.97 ** | 0.08 |
| ug | 0.95 ** | 0.01 | |
| uw | 0.95 ** | 0.17 | |
| SM1 | uc | 0.82 ** | −0.33 |
| ug | 0.87 ** | −0.33 | |
| uw | 0.77 ** | −0.55 | |
| SM2 | uc | 0.76 ** | −0.32 |
| ug | 0.78 ** | −0.29 | |
| uw | 0.80 ** | −0.45 ** |
Note: uc, ug and uw refer to unconverted cropland, grassland and woodland, respectively. * and ** indicate the 0.05 and 0.01 significance level, respectively.
Table 3.
The driving effects of meteorological variables on variations in the four HVs of three vegetation types.
Table 3.
The driving effects of meteorological variables on variations in the four HVs of three vegetation types.
| Hydrological Variables | ET | Runoff | SM1 | SM2 | |
|---|---|---|---|---|---|
| PPT | uc |  | |||
| ug | |||||
| uw | |||||
| Tem | uc |  | |||
| ug | |||||
| uw | |||||
Note: PPT and Tem refer to two meteorological variables, i.e., precipitation and temperature, respectively.
© 2019 by the authors. Licensee MDPI, Basel, Switzerland. This article is an open access article distributed under the terms and conditions of the Creative Commons Attribution (CC BY) license (http://creativecommons.org/licenses/by/4.0/).
Share and Cite
MDPI and ACS Style
Yang, S.; Kang, T.; Bu, J.; Chen, J.; Gao, Y. Evaluating the Impacts of Climate Change and Vegetation Restoration on the Hydrological Cycle over the Loess Plateau, China. Water 2019, 11, 2241. https://doi.org/10.3390/w11112241
AMA Style
Yang S, Kang T, Bu J, Chen J, Gao Y. Evaluating the Impacts of Climate Change and Vegetation Restoration on the Hydrological Cycle over the Loess Plateau, China. Water. 2019; 11(11):2241. https://doi.org/10.3390/w11112241
Chicago/Turabian StyleYang, Shuai, Tingting Kang, Jingyi Bu, Jiahao Chen, and Yanchun Gao. 2019. "Evaluating the Impacts of Climate Change and Vegetation Restoration on the Hydrological Cycle over the Loess Plateau, China" Water 11, no. 11: 2241. https://doi.org/10.3390/w11112241
Note that from the first issue of 2016, this journal uses article numbers instead of page numbers. See further details here.