Characteristics of Flow Structure around Cylindrical Bridge Piers in Pressure-Flow Conditions


1
Department of Civil Engineering, Liverpool John Moores University, Liverpool L3 3AF, UK
2
Department of Geography and Planning, University of Liverpool, Liverpool L69 7ZT, UK
3
Department of Energy, Systems, Territory and Construction Engineering, University of Pisa, Pisa 56122, Italy
*
Author to whom correspondence should be addressed.
Water 2019, 11(11), 2240; https://doi.org/10.3390/w11112240
Submission received: 31 August 2019
/
Revised: 21 October 2019
/
Accepted: 23 October 2019
/
Published: 26 October 2019
(This article belongs to the Special Issue Bridge Hydraulics: Current State of the Knowledge and Perspectives)
Abstract
:The emerging shift of extreme events, combined with an aging infrastructure and bridges, highlights the potential increase in the risk of damage and catastrophic failure of bridges with climate change. This article analyzes the behavior of the flow and turbulence features in proximity to bridge piers, at two different moments of the scour temporal evolution in free-surface and pressure-flow conditions. Bridge pressure-flow conditions occur when the water depth submerges a bridge deck during extreme events. A circular pier and two rectangular decks of different lengths were used for this research. All tests were carried out in clear water conditions at the sediment critical velocity. This paper studied first the rate of scour temporal evolution and scour morphologies. Second, velocity measurements were taken using a Nortek acoustic Velocimeter at 25 Hz sampling rate in both free-surface and pressure-flow conditions. The average three-dimensional flow velocities, turbulence intensities, Reynolds stress, and turbulent kinetic energy were studies for the cross section corresponding to the center of the pier. The results show that pressure flow conditions accelerate the scour rate. This rate approximately reaches twice the scour in free-surface conditions with a vertical contraction of about 17%. Flow and turbulence measurements clearly exhibit how, under pressure-flow conditions, the additional turbulence and accelerated velocity modifies the flow pattern and circulation, accelerating the scour evolution around the bridge base. While numerous studies exist for pier scour and turbulence in free-surface conditions, pressure flow conditions received limited attention in the past. These results provide essential information for understanding scour mechanisms and for facilitating the design of future structures to increase bridge safety and resilience.
1. Introduction
A recent increase in anthropogenic pressure on various catchments, from changes in agricultural practices to changes in urbanization, combined with projected climate change trends (e.g., [1,2,3]) have resulted in more frequent extreme riverine and coastal flooding. The general increase of extreme-events-occurrence probability is connected to increased precipitation intensity, storm surge activity, sea level rises, and hurricane activity (e.g., [2,4,5,6,7,8]). Additionally, several bridges and infrastructures were designed and built decades ago. This resulted in designs that potentially did not account for the sharp increase in extreme events, and whose decks have the potential of being partially or fully submerged in the future. This interaction between a bridge deck and the free surface creates conditions known as pressure-flow conditions [9,10]. The deck restricts the conveyance sections of the flow, intensifying the velocity and modifying the particular flow and turbulence structure observed in the presence of the bridge pier. This results in enhanced scouring [11], with potential unexpected failures.
Bridge pier scour is a major complex phenomenon that can affect and compromise the stability of critical infrastructures, leading to minor loss of serviceability up to the catastrophic collapse, with potential death and economic losses for local and national economies. Scouring can be considered as a natural phenomenon that normally occurs in rivers [12]. Morphological changes of riverbeds include phenomena of aggradation and degradation that are generally caused by changes in shear stresses due to basin hydrology, as well as by the availability or lack of sediments. Local scour is onset or enhanced in the presence of obstacles, such as bridges and abutments, that further increase the complexity of flow and turbulence patterns. The combination of local accelerated flows and enhanced turbulence can entrain more particles in the stream, with scour depths possibly reaching bridge’s foundations.
According to [13,14,15,16,17], river basin characteristics, flow characteristics, and geometric conditions, such as flow shallowness, flow intensity, sediment coarseness, and time, affect the maximum scour-hole depth, vortex strength, and scour morphology. While several of these studies are based on similarity and experimental analysis, recent work carried out by [18] explored a new theoretical framework to study the equilibrium scour in proximity of cylinders. This new framework highlights the impact of the relative coarseness (i.e., the ration between the pier diameter and the sediment average size) on the maximum scour depth. In particular, it explains how the size of the eddies’ scales with the size of the sediment to affect the shear stresses and, hence, the equilibrium scour, produce a new formulation, which is not affected by scaling issues.
In order to explain the phenomenology of scouring, the flow dynamics and turbulence characteristics around bridge piers was studied thoroughly in the past and is still the object of intense investigation (i.e., [16,19,20,21,22,23,24,25,26,27,28] among numerous studies). Flow dynamics and turbulence are often characterized by their turbulence intensity, Reynolds stress, and total kinetic energy, with several coherent structures that form when a free-surface flow hits a vertical structure. In particular, in presence of piers, the main vortex shedding characteristics were distinguished: (a) a surface roller of upward direction and rotation opposed to (b) the downflow that forms in front of the stagnation section of the pier, directed downward toward the base of the pier; (c) a horseshoe vortex at the bridge pier base, which strongly affects the scour morphology; and (d) wake vortices downstream of the bridge pier. Ettema et al. [24] showed how cylindrical piers of various dimensions affect vortices shedding and wake vorticity. The power-spectrum peak of turbulent velocity fluctuation was connected with the strength of the wake and its capability to entrain sediments from the lateral sides of the pier. The authors also qualitatively assessed the sediment burst lift, which is the rapid entrainment of sediments from the base of the pier into the water column, followed by downstream sediment transport. Sediments are transported by the wake generated at the base of the pier and are lifted up to 80% of the height of the water column. As the pier vortices weaken, the entrapped sediments fall back on the riverbed, forming a deposit. A different approach to characterize the flow field in the presence of hydraulic structures, in both rigid and mobile beds, was introduced by [29], where, by using the Okubo–Weiss parameter, the research could characterize vorticity-dominated regions by strain-dominated regions. While most of this studies focused on isolated piers, [30] studied the flow characteristics in presence of large woody debris accumulation at the bridge pier and the impact of the deposit roughness on the flow field. This study reveals how the roughness affects the flow structure by generating boundary layers that develop differently around the accumulation. These differences have a direct impact on the scour depth and its temporal evolution and showed that accumulation with larger equivalent roughness height would generate deeper scour. A recent study [31] analyzed the flow dynamic of bridges in pressure-flow conditions, but this study focused on the combined impact of pressure flow and abutment scour, which presents important differences compared to pier scour.
Despite the vast literature on bridge pier scour and the analyses of coherent flow structure observed around piers, there is still limited research dealing with the mutual interaction of pressure-flow conditions and piers, revealing the need for further analysis to respond to future adaptation challenges. Understanding the nature of these new interactions has several advantages, from the implication related to the design of bridges to that of protection structures or emergency response. This paper aims to investigate the flow and turbulence structures existing in pressure-flow conditions around bridge piers. While several investigations were carried out in free-surface conditions around piers of different shapes and complexities, to the authors’ knowledge, the flow and turbulence structure for pier scour in pressure-flow conditions is rarely investigated. The information produced in this study provides a new set of data that will contribute further to bridge pier scour literature and help validate numerical models. Tests were run in clear-water conditions and using simple geometric configurations. Two decks of different lengths were used to understand how the presence of pressure-flow conditions alters the observed scour and its temporal evolution. In particular, this paper focuses on understanding the difference between scouring around a pier under pressure and free-surface conditions. Initially, scour temporal evolution will be compared. Successively, this paper analyzes and compares the three-dimensional flow field, turbulence intensity, total kinetic energy, and Reynolds stresses measured in free-surface and pressure conditions, for both fixed and mobile bed conditions.
2. Materials and Methods
The experimental apparatus consisted of a glass-walled tilting recirculating flume of 0.61 m width and 7.6 m length. During the tests, a cylindrical pier made of Perspex of 0.03 m in diameter was fitted into the sand bed at the center of flume, with a deck placed over it (Figure 1). Water entered from the inlet section through a honeycomb flow straightener. This was followed by a first transition zone of 2 m of length, made of steel boxes, and reached the working section after a transitional zone of 1 m length covered in sediment of the same size, to avoid an abrupt change in roughness. After the transitional zone, a floor of 2 m length was prepared, having either a fixed or mobile bed. The fixed bed was prepared by gluing material of the same size as the one of the mobile bed. The channel bottom ended downstream by another false floor of 1.6 m. An adjustable rectangular weir was used to control the tail-water level. A sharp tailgate, located at the end of the flume, was used to control the water depth prior to the test and to prevent any anomalous scour formation at the beginning of the experiments.
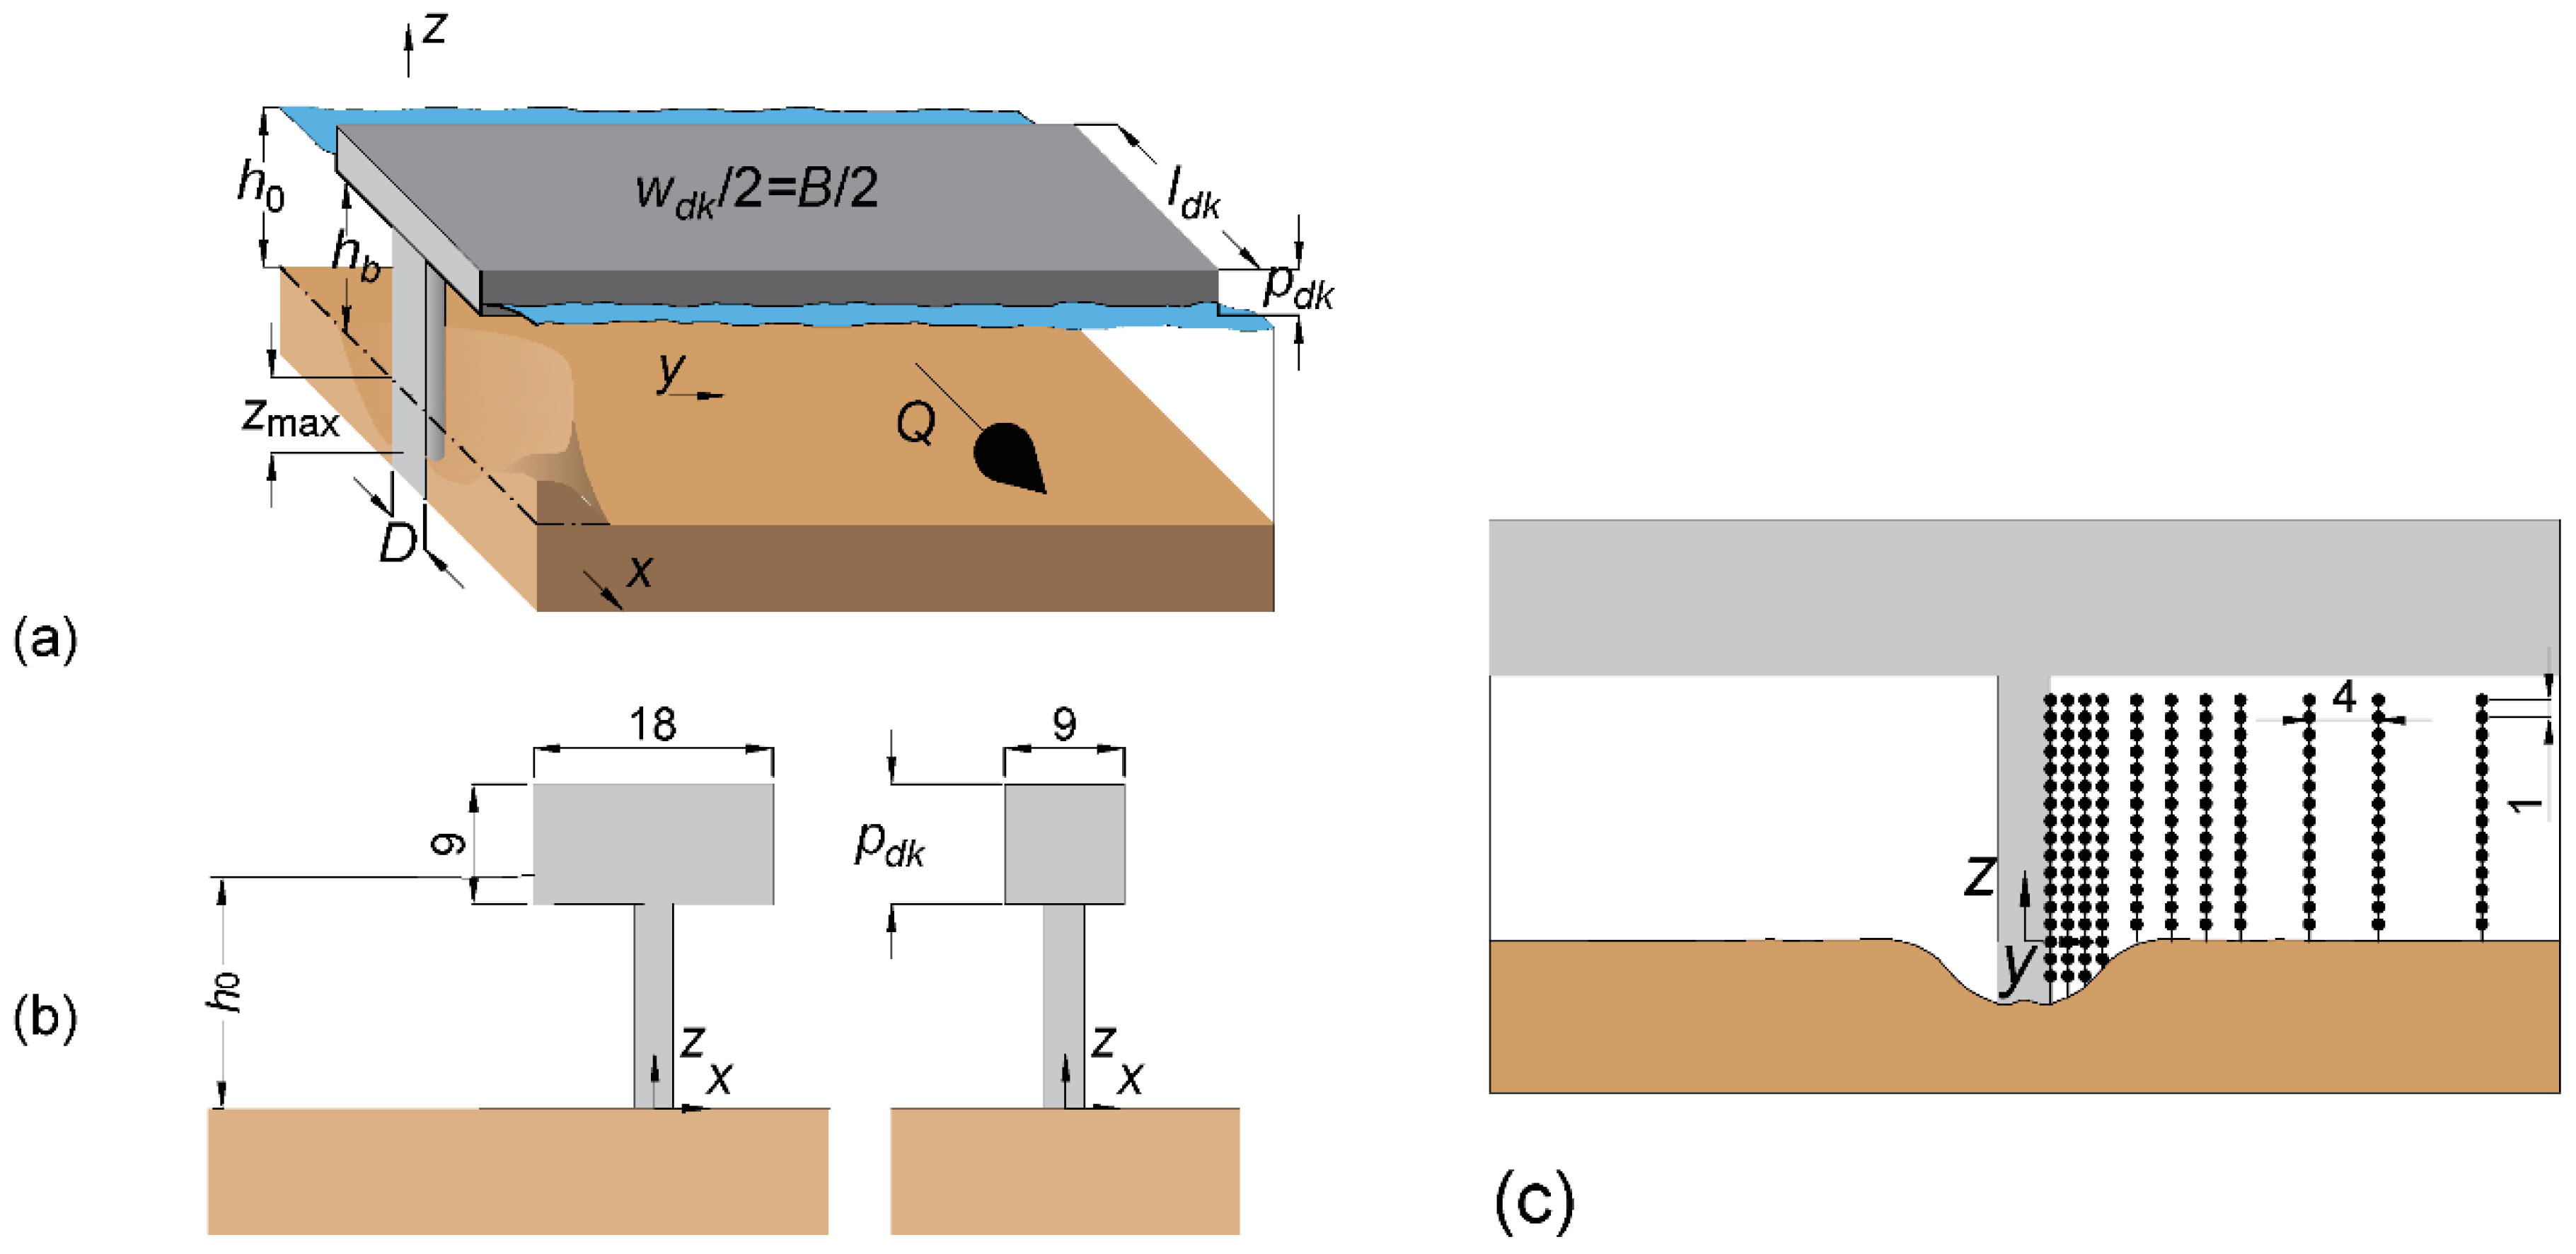
Figure 1a shows a three-dimensional view of the experimental setup and summarizes the main variables used in the tests. Figure 1b shows a longitudinal view of the deck and the pier, and Figure 1c shows the positions sampled with the Acoustic Doppler Velocimeter (ADV).
In the figure, x, y, and z are longitudinal, transverse, and vertical coordinates measured from the center of the pier and from the initial bottom level; zmax is the maximum scour hole measured at the bridge pier, B is the channel width, D is the pier diameter, and Q is the water discharge. The approaching flow depth, h0, corresponds to the water elevation measured, averaging four water depths at the transverse section, located at a distance of 10 pier diameters upstream of the bridge deck, which is where the backwater influence was found to be negligible for the tested conditions [9]. All tests carried out under pressure-flow conditions were characterized by no flow above the deck and limited differences between water levels upstream and downstream of the deck, i.e., Type 1 condition as defined in [32]. Tests were carried out in clear water conditions and for a flow intensity U0/Uc = 1, with U0 being the average flow velocity at 10D from the pier and Uc the sediment critical velocity. The test carried out for U0/Uc = 1 corresponds to the maximum scour in clear water conditions [33]. Specifically, we executed tests using a flat deck covered in tape, with two different streamwise length values (Figure 1c, ldk = 6D, ldk = 3D). Table 1 summarizes the executed tests and the corresponding main variables.
The flow rate (Q) was measured using a KROHNE® Optiflux 2000 of 0.1 l/s precision. A point gauge of 0.1 mm of vertical accuracy was used to measure both sediment bottom and water levels.
The temporal scour evolution was recorded at the bridge pier, using a clear 1 mm accurate scale attached to the pier and was measured at regular intervals of time, i.e., time t = 1, 2, 4, 8, 15, 30, and 60 min, and every hour thereafter. Mobile tests lasted 6 h. While measurements taken in proximity of the pier do not represent the location where the deepest scour occurs [34,35], its direct measurements are significant enough to observe clear differences between the two conditions, while ensuring minimal disturbance in executing tests using point gauges. All experiments were long enough to obtain a temporal scour evolution insensitive to the start–up operations, e.g., the initial operation would not affect the results obtained after 30 min. All experimental tests were carried out according to [35] and [36] procedures. Similarly, (a) the flow entered the inlet with low values to reduce the sediment erosion at the base of the pier and at the leading edge of the false bottom; (b) next, the water depth reached the value hb+pdk, and it was kept constant until the target flow rate (Q) was achieved; and (c) the water level was lowered up to the value h0, and scour measurements were recorded from this moment. The sediment critical flow velocity Uc was calculated according to Wu and Wang [37]. Sediment critical flow velocity and clear water conditions were referred to the undisturbed section “0”, i.e., the section 10D upstream the deck.
Sand of mean diameter, d50 = 1 mm, geometric standard deviation of the particle size distribution σs = (d84/d16)0.5 = 1.2, relative specific sediment density Δ = (ρs/ρ–1), equal to 1.44, and dry and wet sediments angles of repose equal to φ = 31° and φ′ = 36°, respectively, were used during the three experiments, where d84, d50, and d16 are the particle diameters corresponding to 84%, 50%, and 16% in weight of the bed material, respectively. Raudkivi and Ettema [38], Melville and Chiew [14], and Oliveto and Hager [39] suggested to use a mean grain size of d50 > 0.9 mm to avoid bedforms formation. The bed material used in this study was almost uniform in size, to limit the armoring of the bed (i.e., σ < 1.4, [15,40]), which could result in changes in scour depths [38].
Flow velocity measurements, using the ADV, were recorded to characterize the flow field underneath the deck and its turbulence characteristics and to understand how the pressure-flow condition affects the pier scour. Velocity measurements were taken at the beginning and at the end of the tests (Table 1), i.e., at t = 0 min and t = 360 min. The sediments were glued at the beginning and end of each test, in order to reduce any disturbance from the presence of the ADV and measure the flow field under constant conditions. Velocities were surveyed at section x = 0 m, where the largest geometrical contraction occurred, and every 1 cm from y = 1.5 cm to y = 26.5 cm, transversally, and from the sediment bottom to z = 14 cm, vertically (Figure 1c). In the literature, ADV sampling times are varied between 60 s ([21]) and 3–10 min ([16]), depending on the turbulence intensity. After a preliminary analysis of sample signal, the flow velocity was sampled for 300 s, with a frequency of 25 Hz (maximum allowable frequency) and a 6 × 6 mm control volume. Figure 1c shows the location of the points measured in the transversal cross section. In order to increase the accuracy of measurements next to the pier, verticals were spaced about 1 cm apart, next to the pier, up to 4 cm toward the side. ADV records were post-processed using a signal correlation (COR) threshold of COR > 70% and a signal-to-noise ratio (SNR) threshold of SNR > 15, after application of the modified phase–space despiking algorithm proposed by Wahl [41]. The Nortek ADV used for these experiments was attached to a 10 cm long rod connected directly to a flexible cable. This allowed the ADV pitch and roll to be freely changed, to directly access points underneath the deck and in proximity of the pier, without the need to change the experimental configuration. The procedure is similar to the one followed by [42] and [30]. ADV error in measuring average velocity and Reynolds was analyzed thoroughly in several studies. Voulgaris and Trowbridge [43] suggested an error within 1% of the true value. Error measurements of average velocity in stratified flow for skewed ADV position were observed to be within 5% and generally below 2%, depending on the configuration adopted, but in this series of experiments, configurations were limited to a pitch value of 50 degrees [44].
3. Results
3.1. Temporal Scour Evolution
Bridge pier scour normally evolves, forming an initial groove at the base of the pier and centrally within the flume. Sediments erode first close to the side of the pier, and the combined effect of the horseshoe vortex and the downflow increases the size of the grove. Scour initially forms in the central part of the channel area and then expands laterally. Sediments removed from the base of the pier then deposit immediately downstream, and the pier wake pushes the deposit further downstream. Depending on how close to the sediment critical velocity the experimental conditions are, this deposit either grows asymptotically in time (for U0 < Uc) or shows an initial growth, with a secondary phase of slower erosion rate [45].
In pressurized flow conditions without a pier, the scour is mostly two-dimensional, i.e., it does not vary transversally, and it is generally comparable to a vertical contraction scour. This is mainly generated by the increase of shear stresses produced by the vertical contraction [46]. Scour equilibrium can be calculated theoretically by observing that the additional scour below the contraction would reduce the overall flow velocity and, hence, the bed shear stresses, i.e., the equilibrium is attained when the shear velocity (u*) equals the critical shear velocity for incipient motion (u*c). Conversely, the combination of pier and the vertical contraction generated by the deck forces the scour to assume the typical three-dimensional groove normally observed in bridge pier scour [11], where the scour depth is much deeper in proximity of the pier.
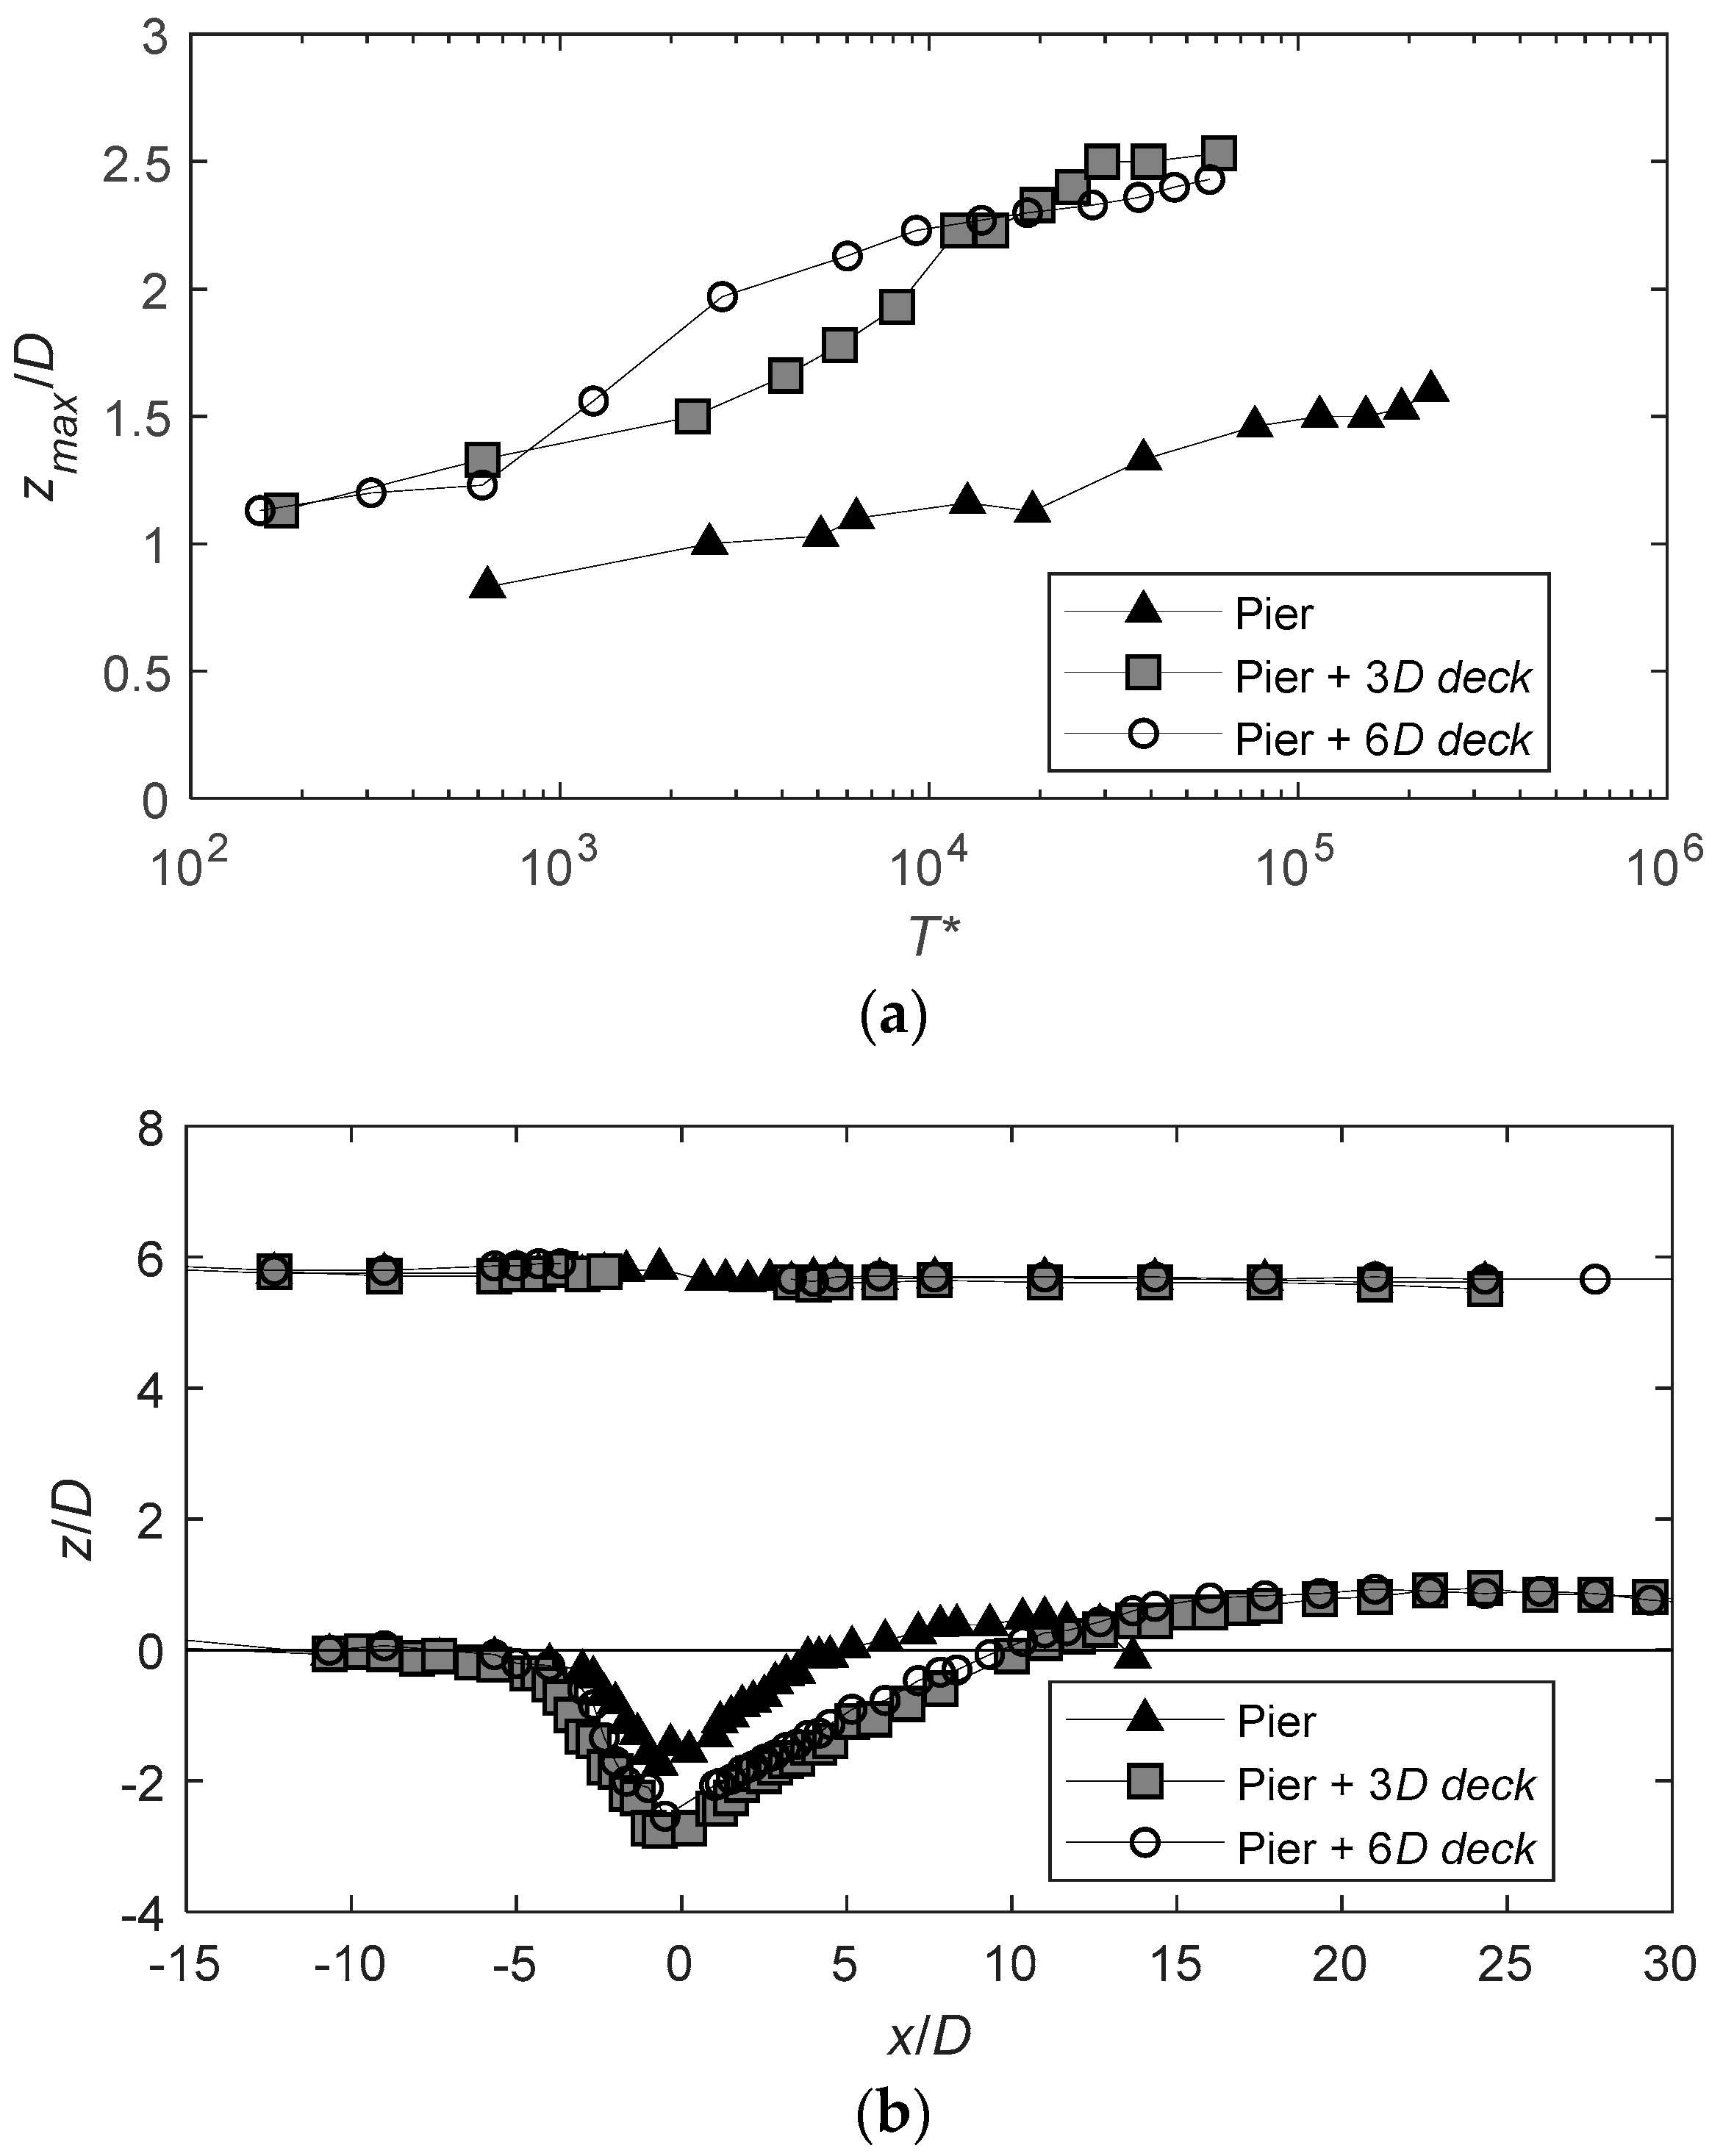
The analysis of the temporal scour evolution measured next to the pier offers an additional view of the differences arising from the change in flow circulation around the pier. Figure 2 shows the three different conditions tested in this study. In Figure 2a, the maximum measured scour is normalized by the bridge diameter and the normalized time ():
is defined as in [35]. Herein, U0 is the average undisturbed velocity at 10D from the pier, t is time in seconds, and h0 is the undisturbed depth. The normalization parameter accounts for the additional impact of the deck on the temporal evolution and depends on the conveyance area blocked by the deck Adk = (h0 – hb)B + hbD, where B is the channel breadth. The scour temporal evolution shows a logarithmic growth for the tested durations. Of the three tests, the isolated pier shows the slowest evolution. Differently, the ldk = 3D and the ldk = 6D decks show a sharp increase in scour, with depths of scour up to 2.5 the pier diameter (Figure 2b). The two decks’ conditions differ slightly from one another in the observed durations, with deeper scour observed for the 3D deck test.
The morphologies observed for the three tests show longer and deeper scours for pressure-flow conditions when compared to free-surface-flow conditions. The morphology shows generally a deeper scour for the 3D long deck and a maximum difference between the two tested decks of 0.2D. The water surface shows slight differences between the three tests due to backwater created in proximity of the pier for both free-surface-flow and pressure conditions, but these tend to dissipate further upstream, at around 10D from the pier. This water surface behavior is similar to that described in [32] and matches their type I condition for a Froude number Fr0 = 0.25 and relative submergence h0/pdk = 1.6.
3.2. Average Flow Field
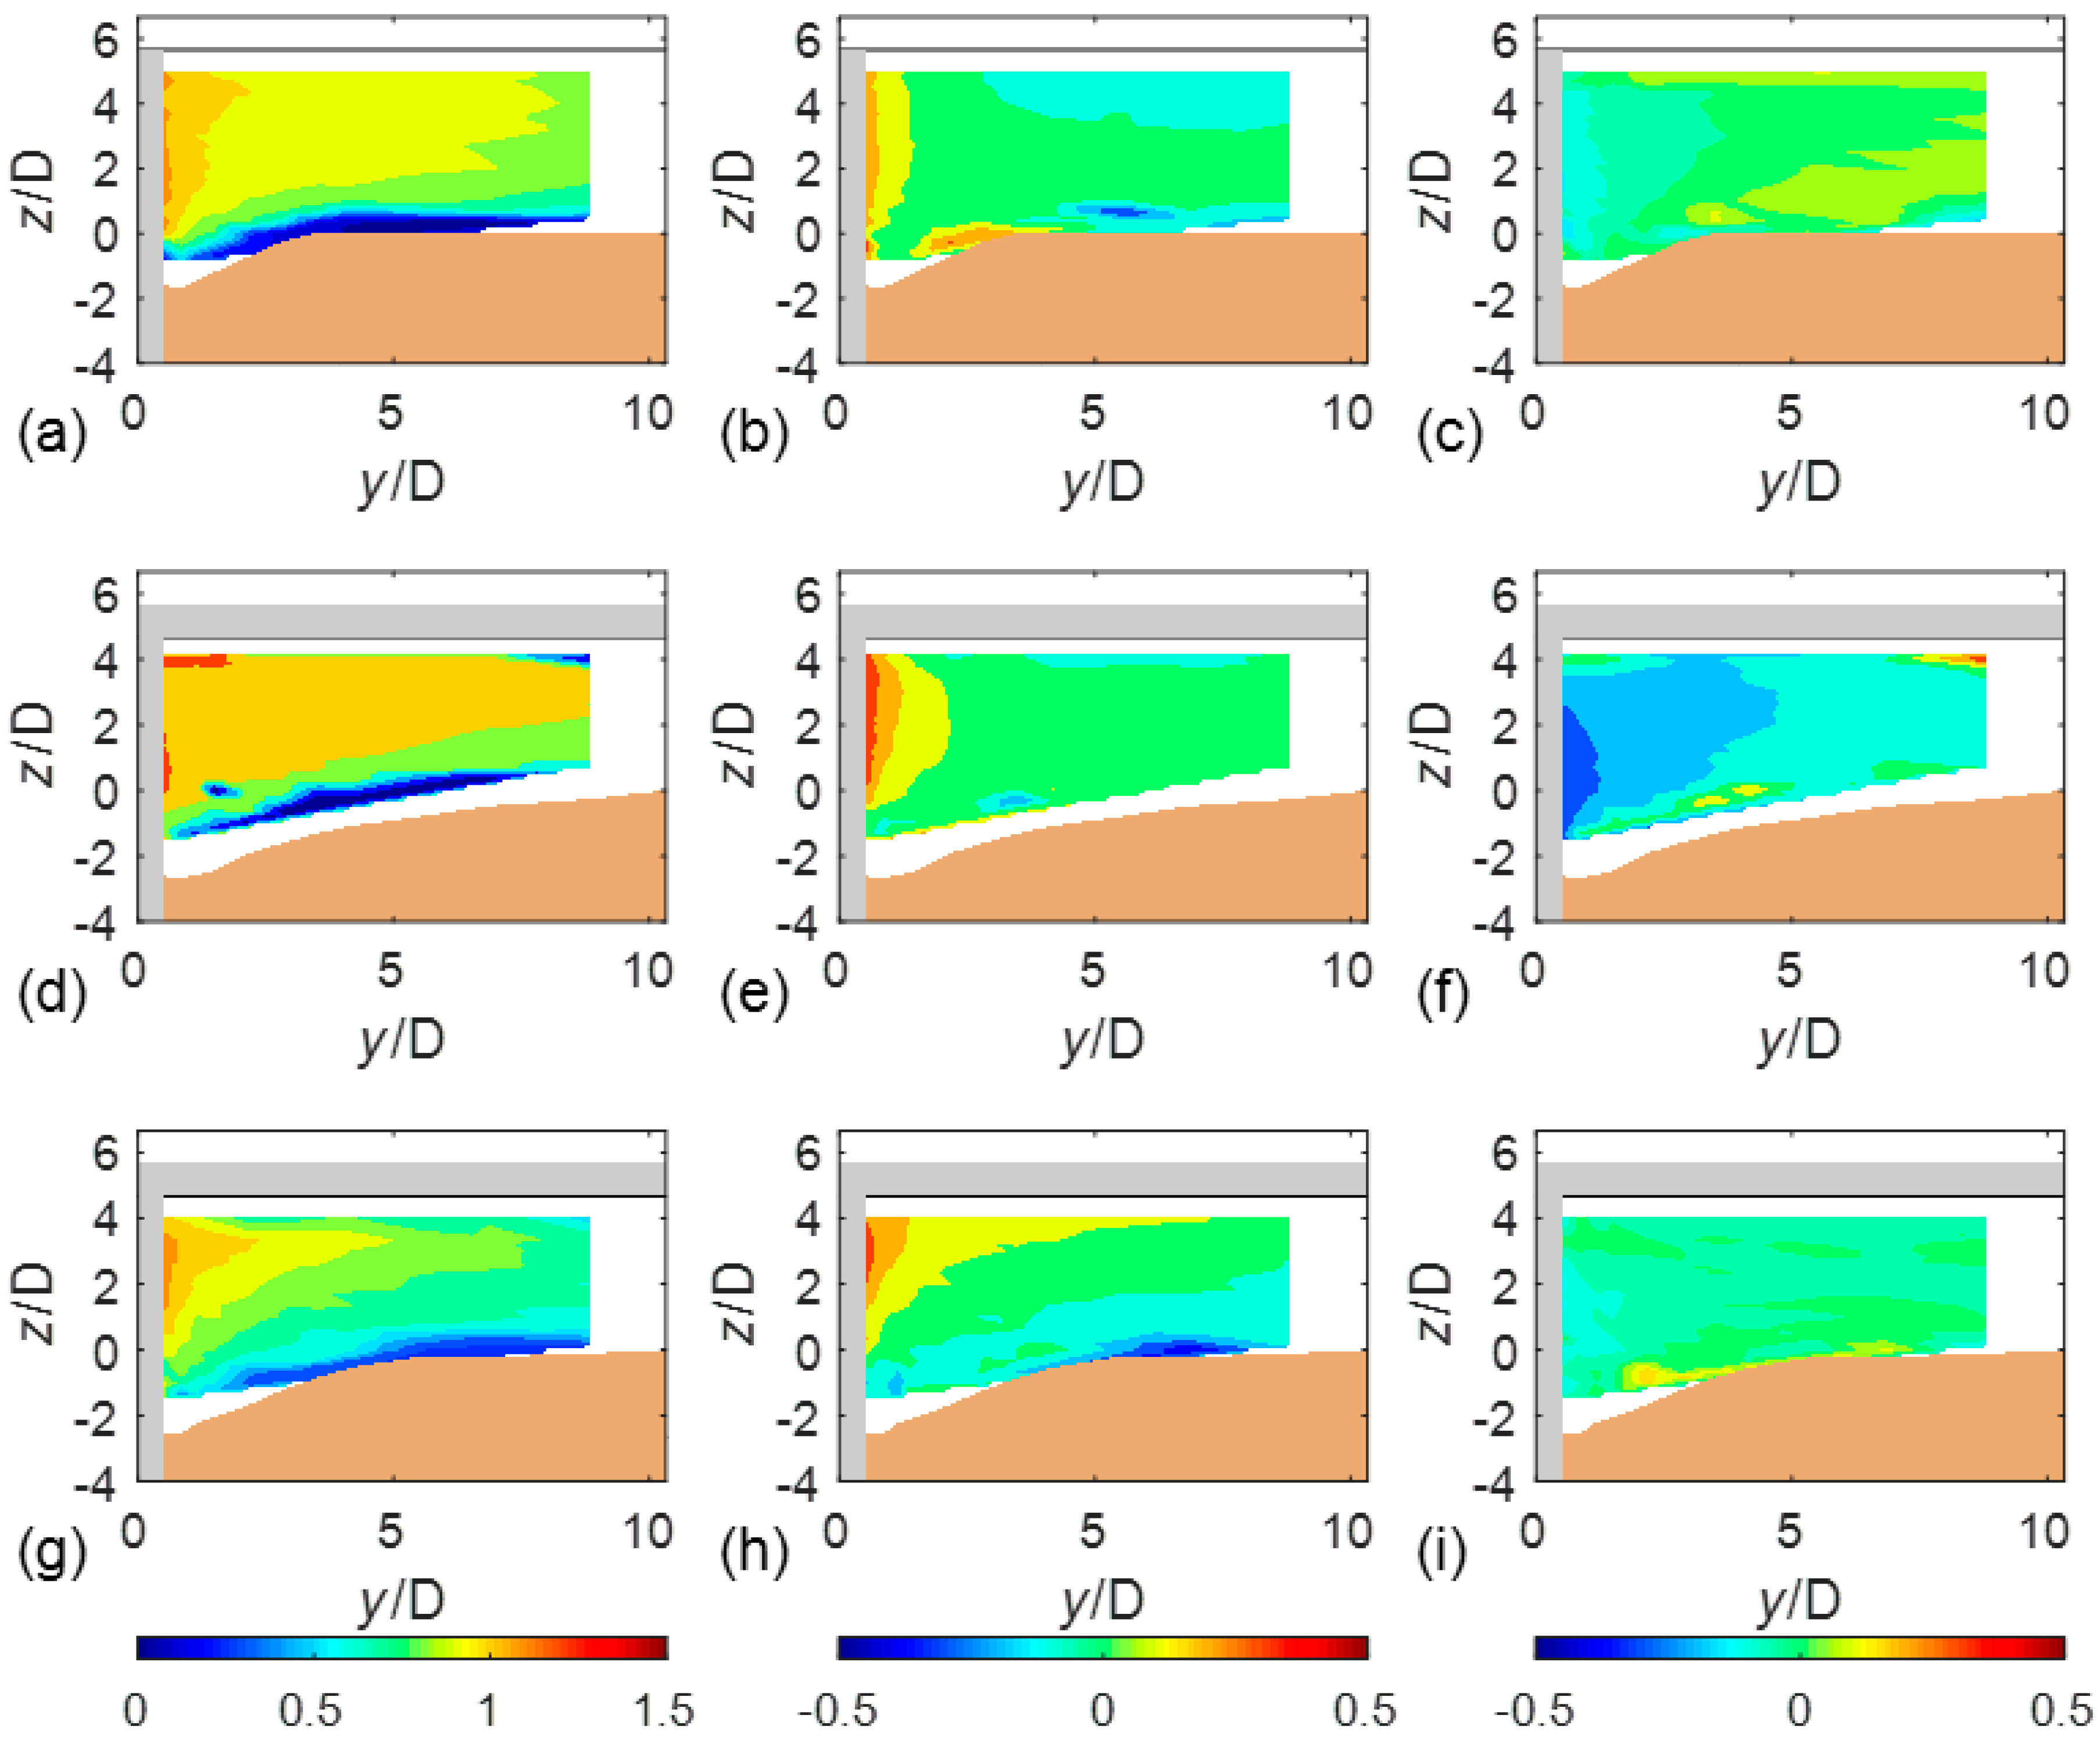
Figure 3a–i show the results for the velocity measurements at t = 0 for the three tested conditions and the three average velocity components, u, v, and w, normalized by the average flow velocity (U0). Data presented in Figure 3 refer to the beginning of the experiments, while Figure 4 shows the same variables after t = 360 min, and once the scour has formed.
From the ADV measurements, and taking as reference the longitudinal component (u), these are defined as the following:
where ui is the instantaneous velocity sample, and N is the number of samples recorded for each location across the cross section (N = 7500).
The flow field shown by the reference test (i.e., a test where a single cylindrical pier was set up in the model without a deck) is similar to that observed by [16]; in this case, the highest velocity values occur near the pier, and a logarithmic velocity profile occurs far from the edges of the pier. In pressure-flow conditions, the maximum velocity components are generally higher, especially near the base of the pier. The value ranges from u/U = 1.2 (pier and free-surface-flow conditions) to u/U > 1.5 in pressure flow. In particular, for a 3D long deck, the longitudinal component shows larger velocities next to the deck in comparison to the 6D long deck. The flow field at the bottom, and near the pier base, shows higher velocity gradients with respect to that of the free surface flow and for 0.25 < y/D < 12. Velocity gradients tend to decrease toward the side walls, for both the free-surface and pressure-flow experiments. Due to the pressure-flow effect, contour lines are generally shifted toward the bottom, and the presence of the deck is responsible for the development of a boundary layer under the deck, with a smaller velocity next to the lower edge of the deck.
Figure 4a–i shows the average velocity components, u, v, and w, this time for mobile bed conditions for the three tested conditions. Additionally, the figures represent the transversal scour profiles for the following conditions: (i) in the presence of the sole bridge pier (free-flow condition), and (ii) with pier and deck (pressurized-flow condition). The figure clearly shows how the reciprocal interaction between deck and pier strongly influences scour features.
In pressure-flow conditions, the scour around the bridge pier is significantly deeper and wider than for free flow. As opposed to pressure-flow conditions, which generally show a 2D contraction scour morphology [10], the presence of the pier forces the scour morphology to assume a more typical three-dimensional configuration. The maximum scour depth, zmax, varies in magnitude compared to the pier in free-surface conditions, which is consistent with what was observed for the temporal scour evolution. While this is not representative of equilibrium conditions, the free-surface-flow test shows a maximum scour zmax/D = 1.58, while, for a deck of ldk = 3D and ldk = 6D, the maximum scour observed was zmax/D = 2.7 and zmax/D = 2.3, respectively. In the latter conditions, the morphology is more expanded, with milder side slopes, but generally deeper depths. This morphology is in line with the larger velocity components observed in Figure 3 at t = 0, which suggests that pressure conditions would result in greater erosive capacity and sediment entrainment. Once the scour is developed (Figure 4), the presence of the scour hole partially reduces the flow velocity around the pier; this velocity decrease is mainly noticeable under pressure-flow conditions, even if the latter case continues to have flow velocity and kinetic energy values higher than under free-surface flow. This latter difference in flow can explain the higher residual scour potential observed in pressure-flow conditions, which still have a much higher scour rate, as demonstrated later in the scour temporal evolution section. Again, the difference in length of the deck seems to affect the distribution in longitudinal velocity across the cross section, with a tendency toward a much less uniform distribution compared to the 3D deck. Peak velocities occur near the side of the pier in proximity to the deck corner at about z/D = 3.5.
3.3. Turbulence Characteristics
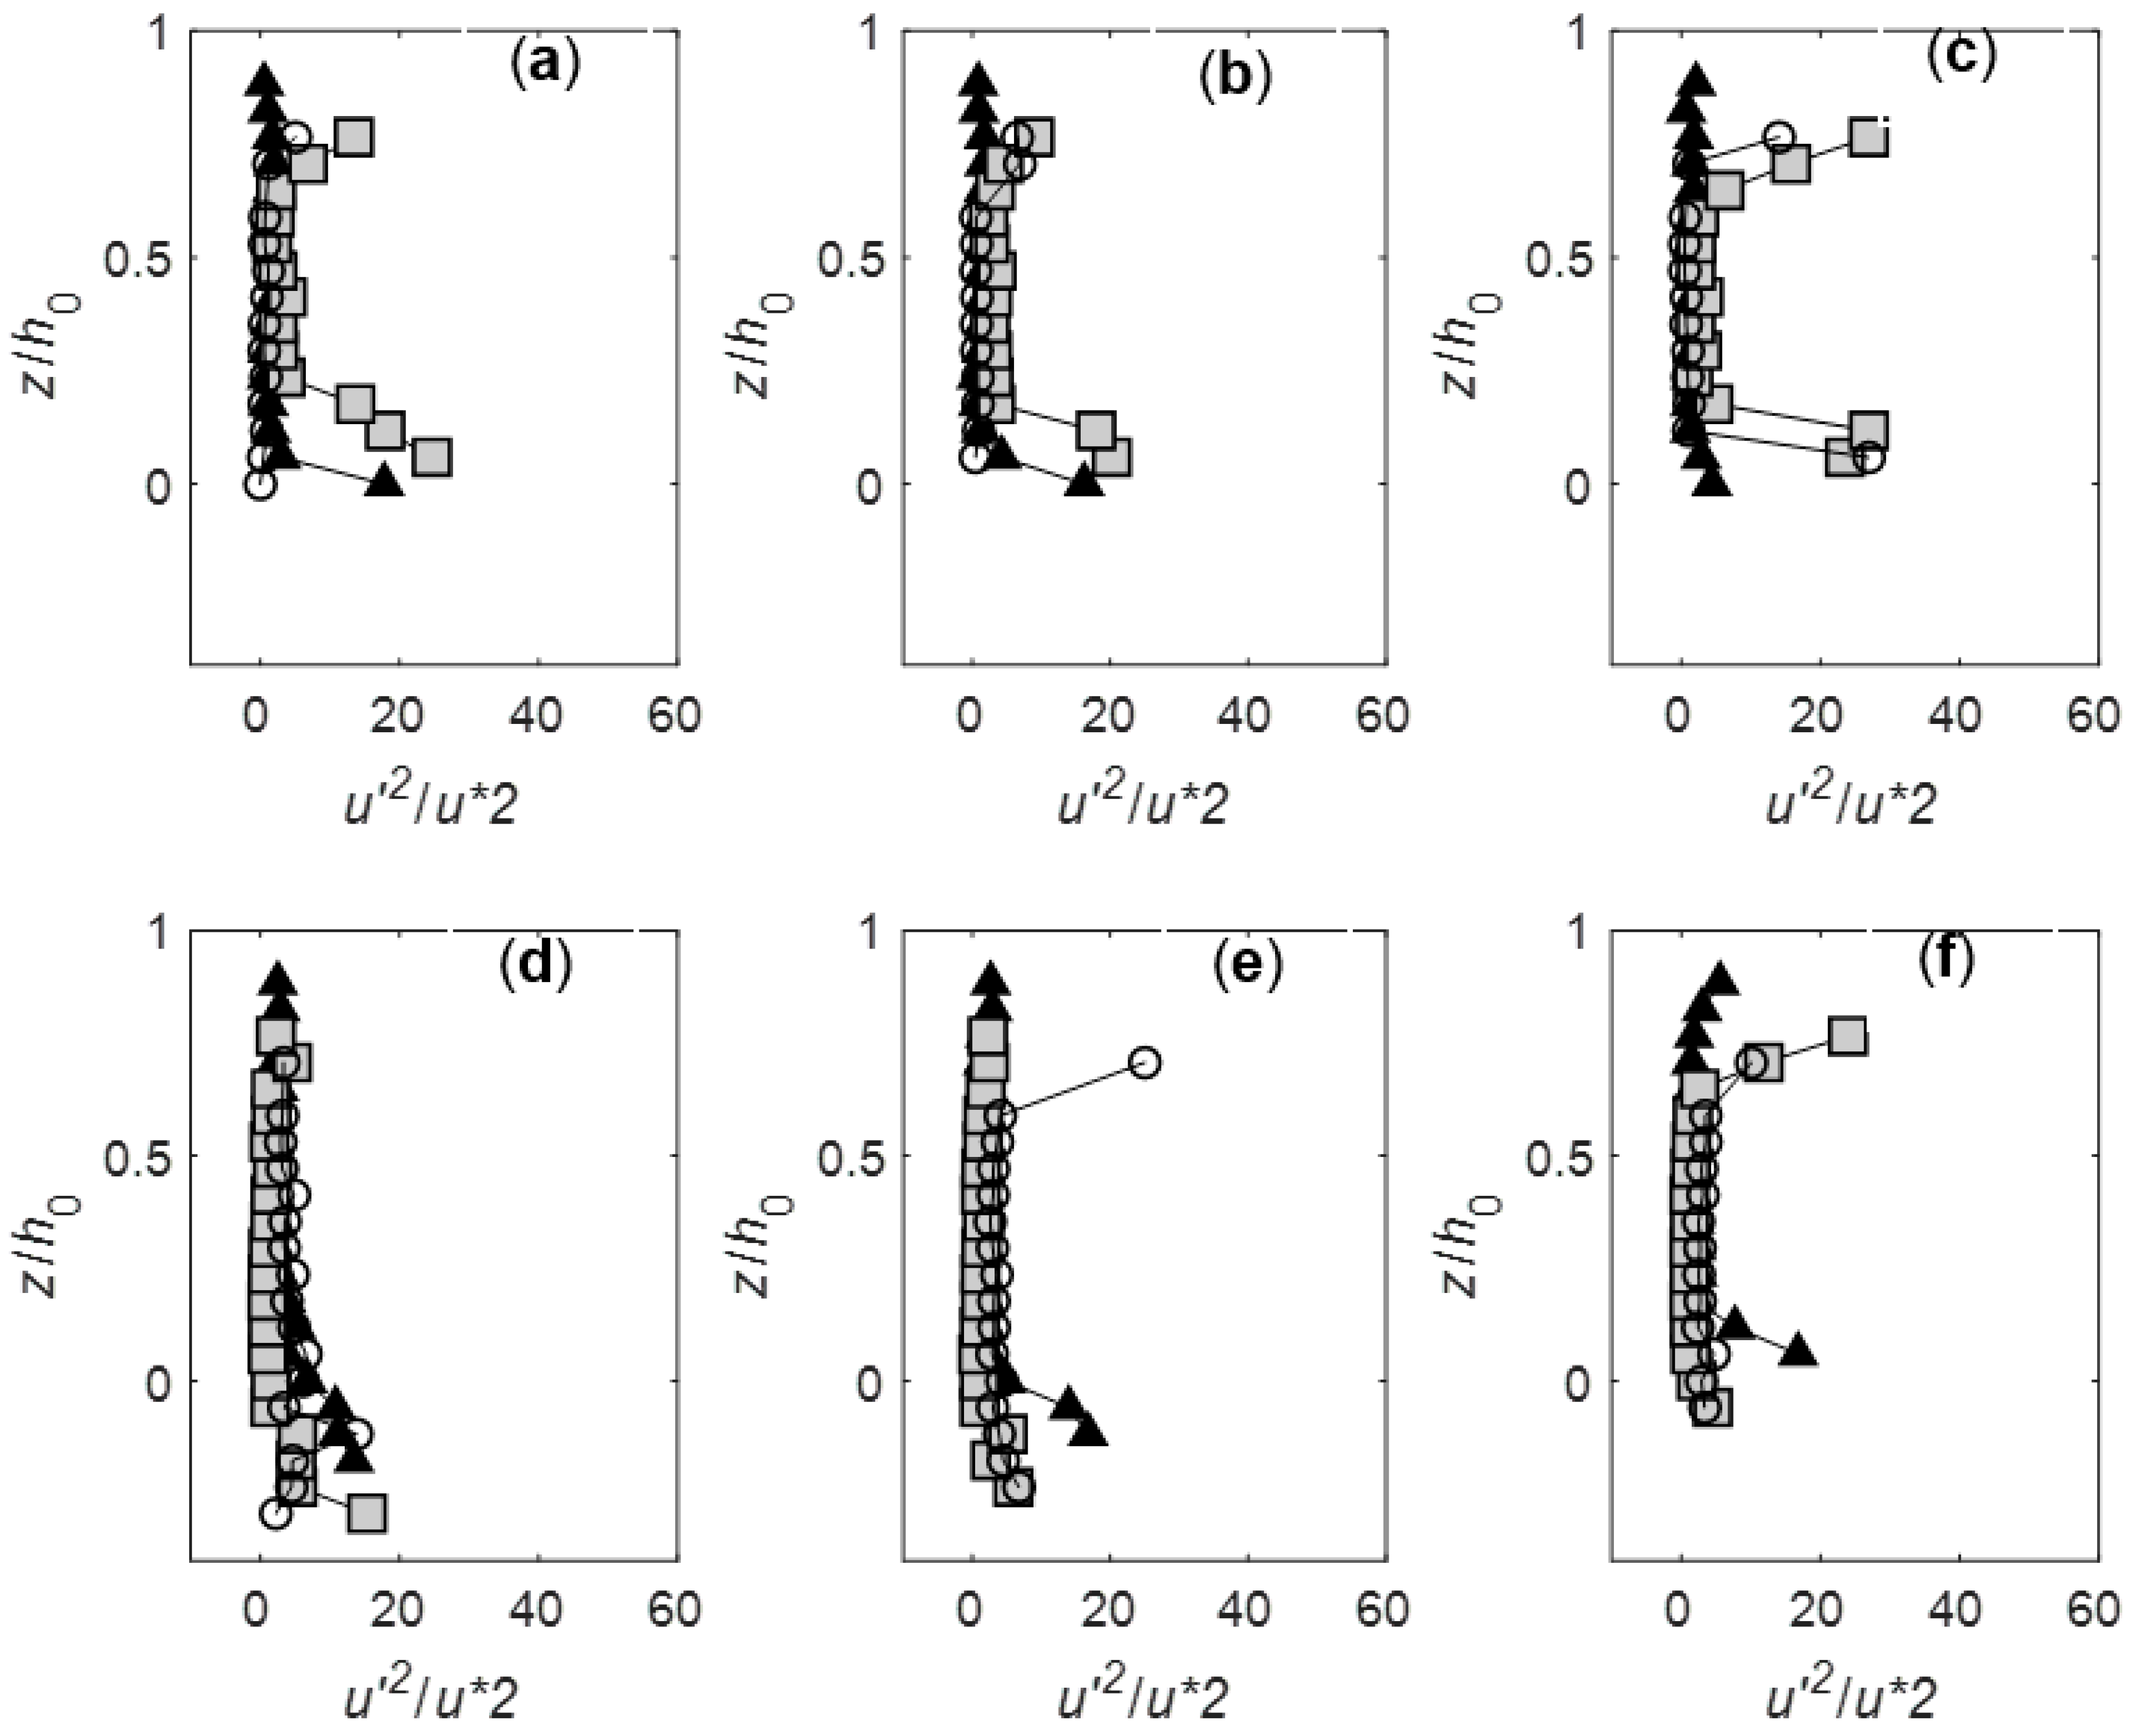
Figure 5d–f shows the turbulence intensity measured for three different verticals (y/D = 0.833, y/D = 1.5, and y/D = 4.2), and for fixed and mobile bed conditions. The turbulence intensity is defined as the following:
From the comparison between the different tests, it is clear how the upper region of the vertical profile is affected by a larger level of turbulence intensity. In particular, the 3D long deck shows the larger level of intensity, due to the shorter distance of the edge of the deck from the measuring location (grey squares). This is confirmed in all the three verticals (a, b, and c), with the value of intensity of the order of 15–20 times the shear velocity. The turbulence intensity next to the edges does not reduce significantly as the scour evolves toward the edges of the pier, while the deck presence does not affect the intensity once it has evolved. This is the opposite of what is observed next to the bottom after the scour has evolved significantly. In fact, the highest intensity occurs at the beginning of the scour, with the value exceeding that next to the deck, particularly next to the pier, while intensity values quickly reduce as the scour deepens. Additionally, a comparison of the bottom intensity shows similar values between the isolated pier and the deck conditions, particularly next to the pier (Figure 5e).
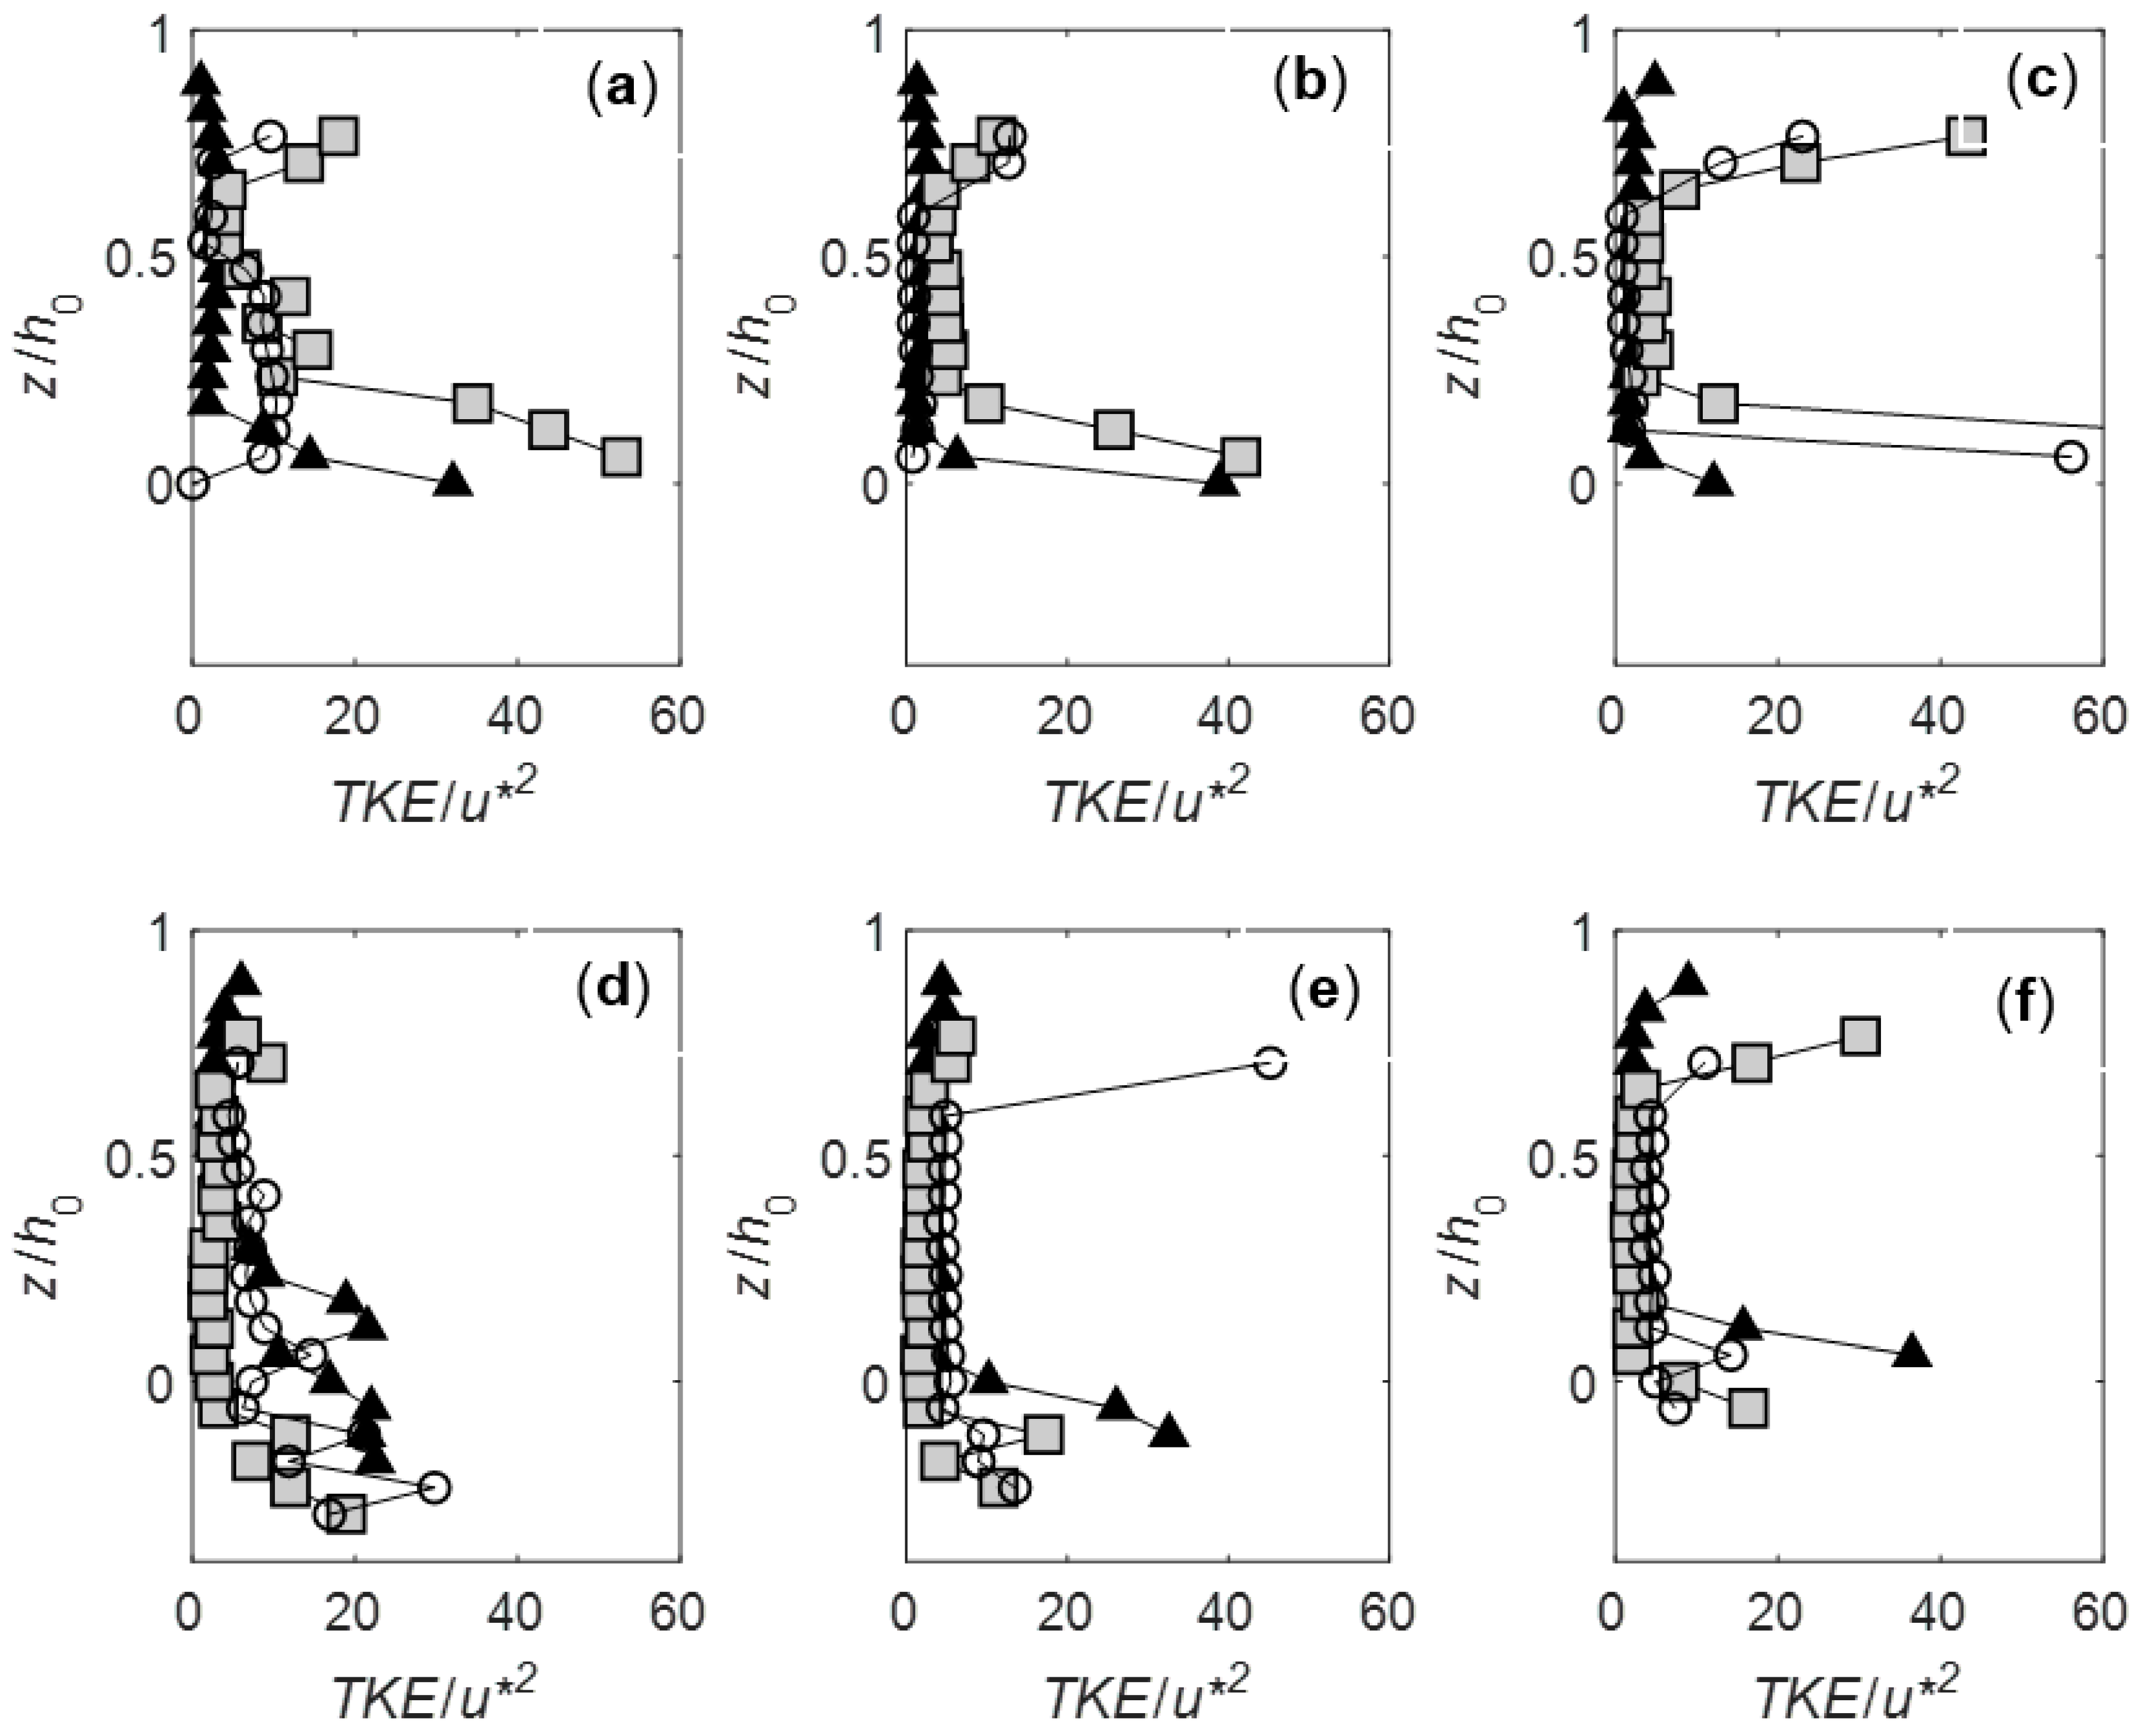
Figure 6a–f and Figure 7a–f show the vertical profiles for the turbulent kinetic energy (TKE) k,
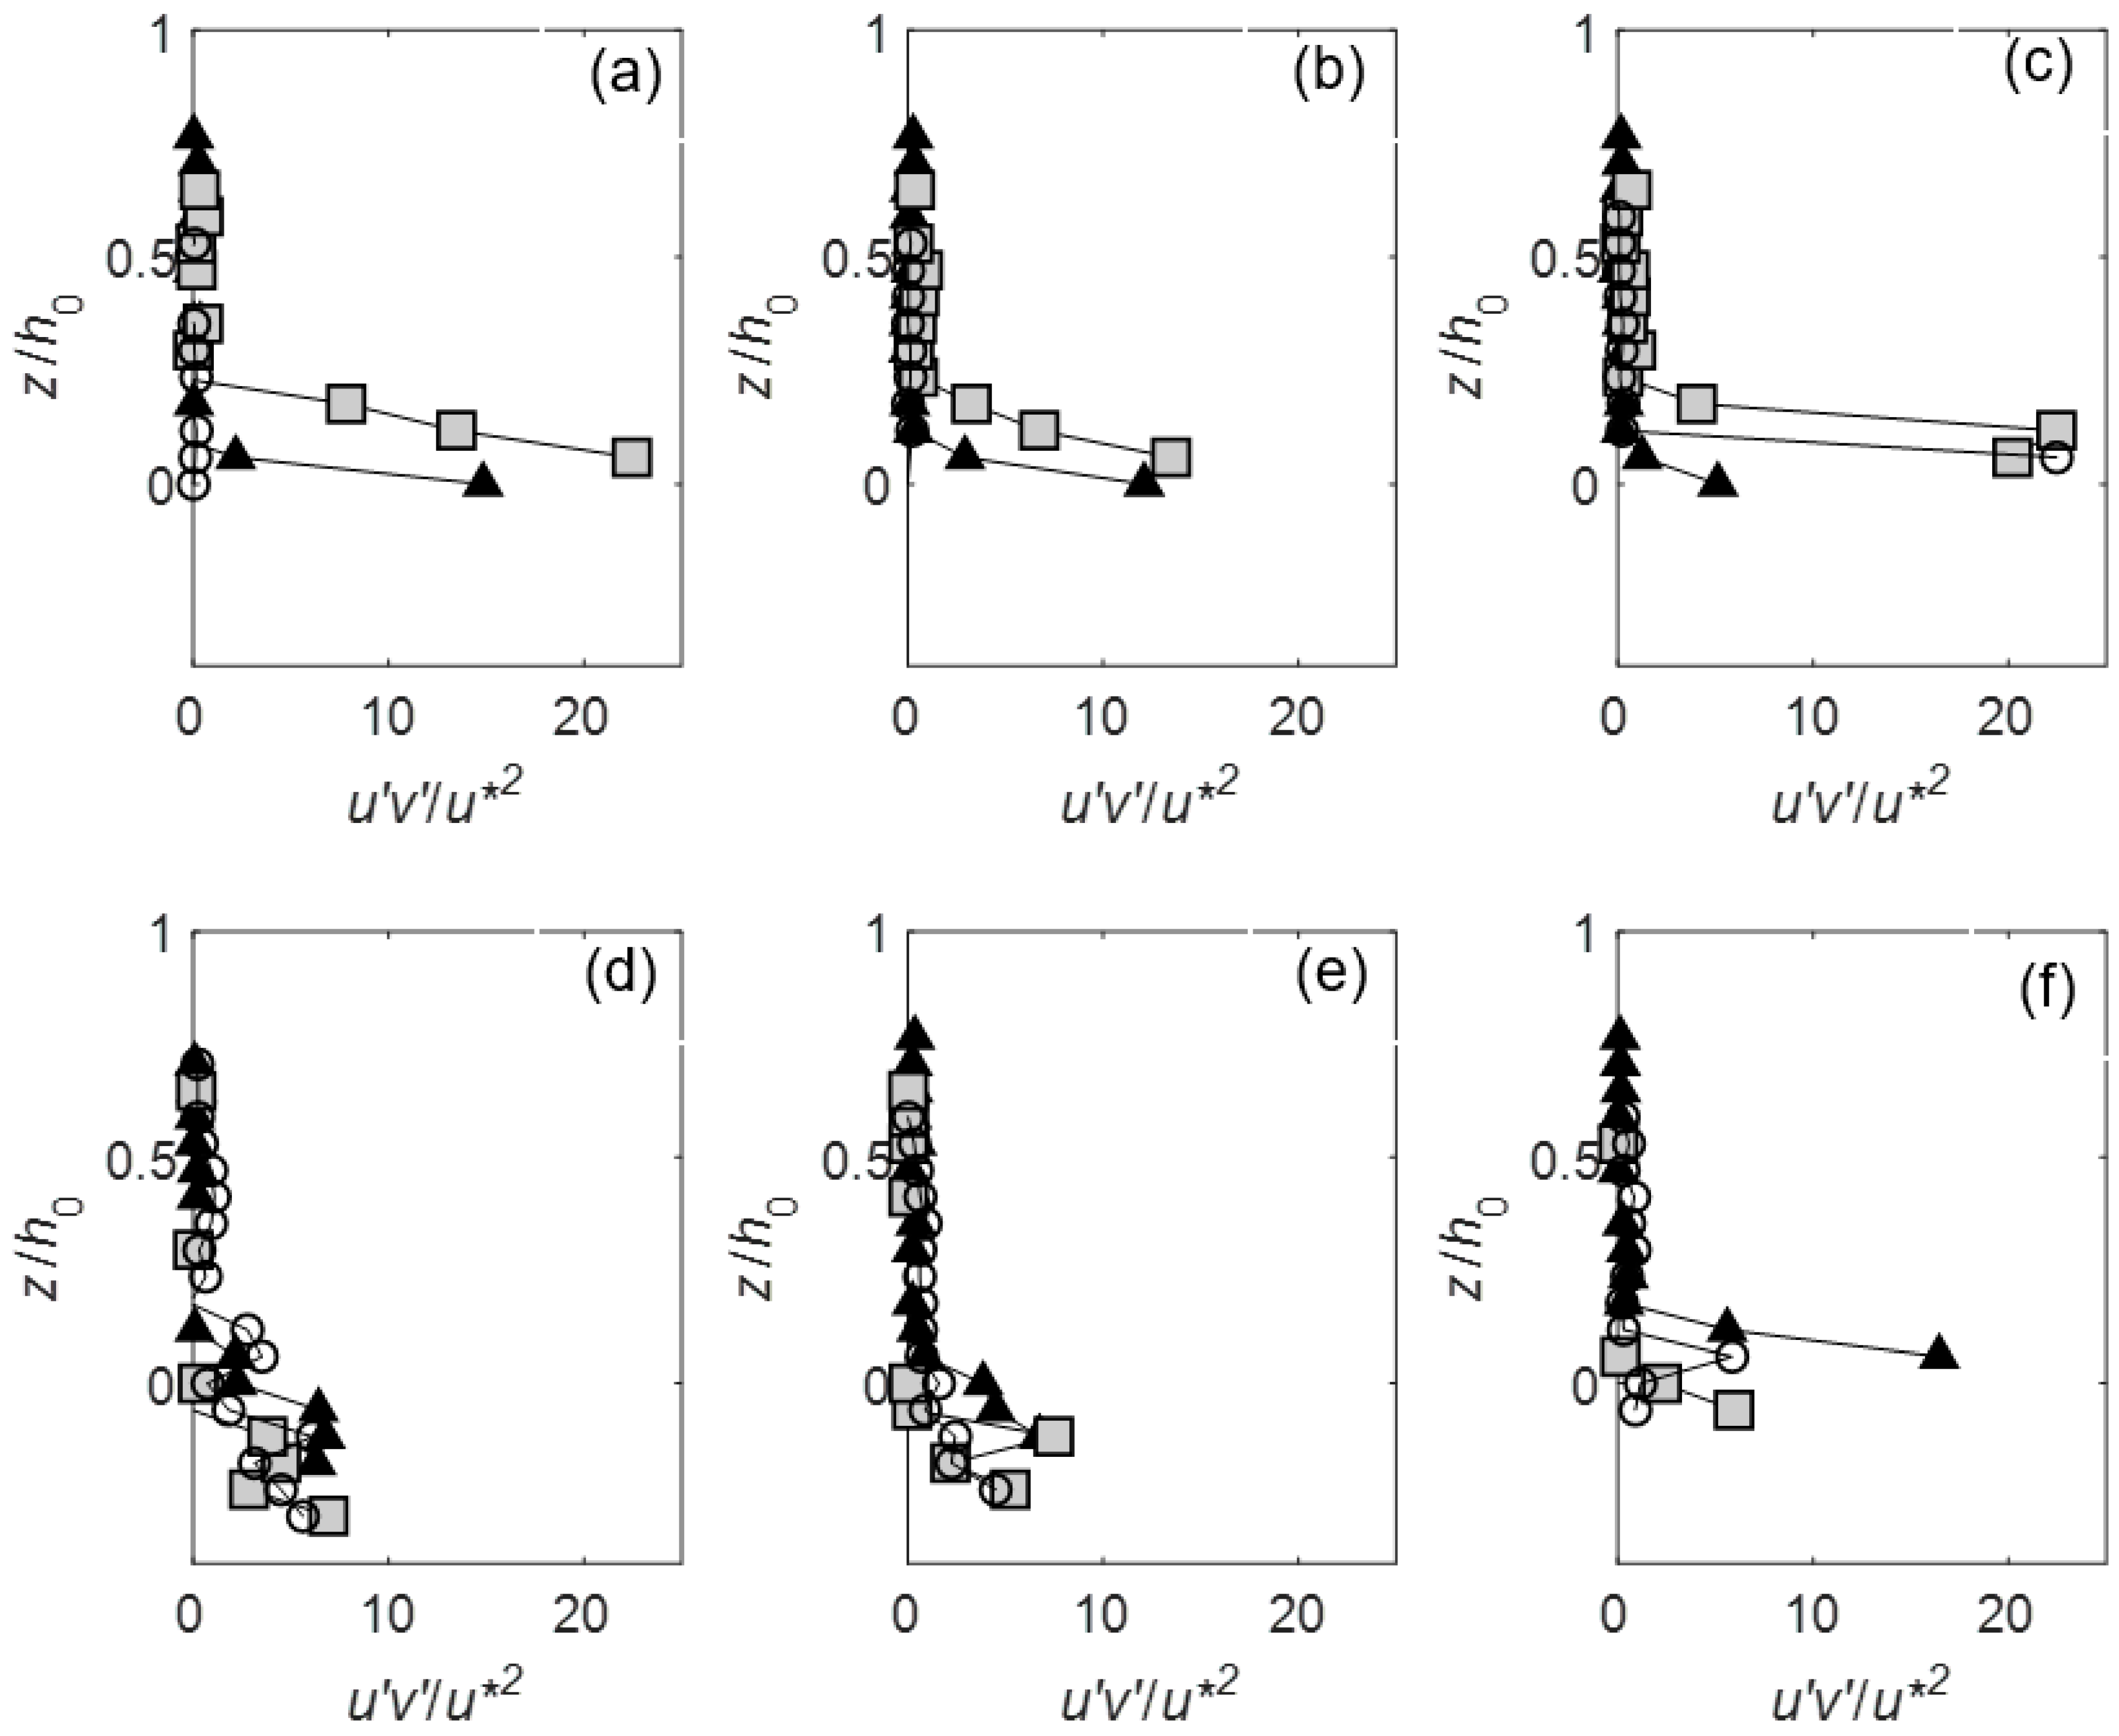
and averaged Reynolds stress component,
where
for the same tests and verticals.
k/u*2 = 0.5(u’2 + v’2 + w’2)/u*2,
<u’w’>/u*2,
The total kinetic energy defines the overall turbulent intensity of the stream regardless of the direction. It provides a slightly different picture from the u’2 component. Again, the turbulent kinetic energy values are larger if compared to that observed for the free surface flow (Figure 6a–c). This is particularly evident far from the pier, where TKE at the bottom is much higher than that next to the edge of the deck. Further away from the pier, TKE becomes more symmetrical. As opposed to the longitudinal component of the turbulence intensity, TKE seems much more affected in the central portion of the water column (Figure 6a), where generally these are higher for the 3D case. After the scour develops, TKEs are reduced significantly, with the larger flow conveyance area left by the scour.
Reynolds stresses are linked to the capability of the stream to transport sediments and indicate the exchange of turbulence momentum between layers of a stream [47]. Interestingly enough, these are limited in intensity next to the deck in both configuration. These show a steep increase in pressure conditions, with value that exceed significantly the free surface test, and characterized by a steep gradient that starts further away from the bottom (z/h0 = 0.25), showing a greater sediment entrainment capacity by the stream. While the Reynolds stresses tend to reduce toward the edge of the flume, this seems not to be the case for the test in pressure flow conditions. This shows the potential for a wider scour morphology when compared to the free-surface conditions. As the scour evolves, Reynolds stresses reduce significantly, with value of the same order of magnitude for the three tested conditions next to the pier.
4. Discussion
The temporal scour evolution under various pressure flow conditions was thoroughly studied by [11]. Among several parameters, the authors found a dependency of the rate of scour from the relative deck length ldk/D. Interestingly, the dependency on the relative deck length tends to reduce for conditions closer to the sediment critical velocity, as observed in these tests.
As previously observed in Section 3.1, the initial temporal scour evolution and morphology clearly show a steeper rate of scour in pressure-flow conditions compared to free-surface pier scour. Further analysis of the temporal evolution also highlights slightly different behavior from free-surface-flow to pressure conditions. Free surface flow shows a linear rate of scour (in logarithmic terms), while, for the two tests in pressure flow, the temporal evolution diverge at around T* = 1000. Thereafter, the longer deck tends to accelerate the rate of temporal evolution and converges back with the shorter one at around T* = 10,000. This result is similar to what observed for debris flow accumulation by [35], where debris of different shape but with similar reduction of conveyance would converge at around T* = 10,000. This can be explained by the increased distance between the deck surface generating additional turbulence and the scour depth. The additional analysis of turbulence properties in this contribution can provide additional elements to explain the observed temporal evolution. In particular, while the mobile bed velocity measurements were not carried out at equilibrium conditions (but roughly around 84% for free surface and 80% of scour, assuming an equilibrium time of T* = 840,000, as suggested by [16]), the measurements were carried out after the temporal rate of scour in pressure conditions converged back to similar rates.
Free surface flow tests with the pier show similar results to what was observed in the literature [16], showing peak flow (u) velocities occurring next to the pier. The u/U0 observed is around 1.38 in proximity of the pier for the section orthogonal to the stream. While the length of the flume is partially representative of a fully developed flow conditions (considered around 10 hydraulic diameter [39,48], compared to the 9.1 of the present study), when considering the cross section in proximity of the center of the pier, velocity patterns correspond to what was observed in [16]. Similarly to what was observed in [16], the velocity gradient next to the bottom reduces as the scour evolves and peak velocities reduced to u/U0 < 1 in mobile bed conditions. Dey et al. [16] also discusses various aspects of kinetic energy, Reynolds stresses, and TKE, observing how turbulence intensity is much more pronounced next to the bottom, where the horseshoe vortex occurs. As the scour evolves, the authors’ results show qualitatively similar patterns to the ones observed in this study for an isolated pier. Undulation in isolines and more complex patterns are linked to the evolution of the scour and its irregularities. The study carried out in [20] shows a shear of similar order of magnitude for isolated pier in rough bed of the order of <u’v’>/u*2 = 15. Unlike free surface flow, pressure-flow condition adds an additional turbulent structure in the shaper of the wake generated by the edge of the deck that interacts with the pier, as can be clearly observed from Figure 3, Figure 4, Figure 5, Figure 6 and Figure 7. The edge of the deck creates a boundary layer that develops along the deck and impinges on the pier. The boundary layer characteristics and thickness varies depending on the type of pressure-flow conditions, as also observed by [32]. This boundary layer generates turbulent structures around the pier that enhance the rate of scour. It appears that the increase in scour can be associated with (a) an increase in peak velocity through a geometric and hydrodynamic flow contraction and (b) an increase in turbulence generated by the deck. The physical and hydrodynamic contraction generates steeper velocity gradients in proximity of the pier base as observed in Figure 3, consequently, higher Reynolds stresses at the base of the pier. Similar flow patterns exist in the presence of ice jams [49]. In this study, ice cover of different roughness, piers ranging from 11 to 22 cm, and ice-sheet cover of 5.6 to 5.8 m were tested. In these conditions, the length of the jam is normally several orders longer than the tested conditions, thus creating a much better developed boundary layer under the jam. Similarly, the presence of a physical lid on the free-surface conditions shifts the maximum flow velocity around the center of the water column and generates higher Reynolds stresses and TKE. Measured differences in peak velocities range from 43% to 52% times the peak velocity without ice cover, depending on its roughness. Increases in average flow velocities generated by the presence of the deck are around 25% and 16% for the 3D and 6D, respectively. Slight inconsistencies can be explained by differences in set up and stage of the scour temporal evolution when measurements were taken. What emerges in general is that the length of the deck produces slight differences in increase in maximum velocity and gradients of velocity. In particular, Reynolds stress at the base of the pier in mobile bed conditions shows comparatively similar values. This seems to explain the similarity in scour rates and depths observed after T* > 10,000. The analysis of Reynolds stress in mobile bed in Figure 7d also shows the scour potential left at this time of the temporal evolution, with Reynolds stress still larger than the shear velocity u*, which, being these tests carried out at the sediment critical velocity, could be approximated with the critical shear velocity.
The increased turbulence intensity and TKE observed in pressure-flow conditions have implications on maximum equilibrium scour analysis. Using a theoretical approach, [18] scales the rate of energy dissipation with the drag force and the pier diameter, with the hypothesis that the dissipation rate could be considered proportional to the work carried out by the drag force on the cylinder. When the free surface hits the deck, the mutual interaction of turbulence generated from the deck and the pier increases both u’2 and TKE. This means that an equivalent diameter should be considered to characterize the impact on scour due to the presence of the deck. As an example, based on dimensional analysis, [35] included the additional conveyance area occluded by the debris as a scaling factor for the temporal evolution.
The spatial distribution of TKE and longitudinal turbulence intensity generally shows a different pattern compared to the Reynolds stress, particularly in proximity of the deck. In fact, next to the deck, both flow intensity and TKE would show higher values compared to the center of the flow and the bottom of the pier, while the Reynolds stress in proximity of the pier does not differ substantially from the center of the pier and peak next to the bottom. This also suggest that, in proximity of the deck, the correlation between the vertical velocity fluctuation and horizontal one is generally weak. Observing that Reynolds stress is proportional to the TKE production rate (together with the average flow gradient), the figures suggest that, in proximity of the deck, there is less production of turbulent kinetic energy compared to the area next to the bottom of the pier, which shows higher gradients of both Reynolds stresses and TKE. Both TKE and Reynolds stress peak at the base of the pier for fixed test conditions and consolidate to similar values in mobile conditions, irrespective of the length of the deck. The small differences in the turbulent structure seem to explain the mild differences observed between the two tested decks toward the end of the tests.
Finally, it is evident that scour protection normally designed against free-surface conditions [50] could catastrophically fail in pressure-flow conditions. It is sufficient to observe the sharp increase in velocity at the base of the pier and turbulence intensity and shear that are several orders of magnitude higher from open channel conditions and that could easily entrain rocks used as elements of riprap protections at the base of the pier. This is particularly the case if we consider Equation (13) in [50], where the riprap diameter is proportional to the cube of the average velocity on the top of the rock of the riprap.
5. Conclusions
This research presents a series of new results related to the impact of pressure-flow conditions on bridge pier scour, i.e., when the free surface flow reached the edge of the deck. Bridge pier scour is a complex phenomenon that bares catastrophic consequences when not addressed properly. This article shows how the mutual interaction of pier scour in pressure-flow conditions affects the characteristics of the hydrodynamic flow field around a cylindrical bridge pier.
In particular, this study showed the following:
- (a)
- Pressure-flow pier scour evolves faster when compared to free-surface pier scour. This is particularly dangerous for bridge resilience during flooding.
- (b)
- The maximum average velocity components are significantly accelerated by the combination of vertical contraction and boundary layer development. In particular, there is a noticeable difference in flow and turbulence intensity between decks of different lengths, albeit not too significant in terms of scour temporal evolution and morphology for well-formed scours (i.e., for T* > 10,000).
- (c)
- Turbulence intensity, TKE, and Reynolds shear stresses show significantly higher values compared to the free-surface tests, additionally explaining the larger scour potential observed. This can have negative effects on scour protection using loose material, such as riprap collars, that can be easily damaged by the larger shear observed next to the pier.
It is clear that several questions remain open. A more detailed analysis of the boundary layer in proximity of the pier and the deck should be carried out, potentially using PTV, as in [29]. The interaction between the boundary layer generated by the deck and the pier should also be investigated at higher Froude numbers for different pressure-flow types ([32]), using different deck geometries, including girders, and for smaller flow intensities. Additionally, the turbulence generated by the deck can change the physical significance of the relative roughness parameter (D/d50) when trying to define a turbulence scaling length capable of defining the maximum equilibrium scour.
Author Contributions
This paper benefited from the following contributions: conceptualization, I.C. and S.P.; methodology, I.C. and S.P.; validation, I.C. and N.L.; formal analysis, I.C. and N.L.; data curation, I.C. and N.L.; writing—original draft preparation, I.C. and N.L.; writing—review and editing, I.C. and N.L.
Funding
This research received no external funding.
Conflicts of Interest
The authors declare no conflict of interest.
References
- Gill, S.E.; Handley, J.F.; Ennos, A.R.; Pauleit, S. Adapting Cities for Climate Change: The Role of the Green Infrastructure. Built Environ. 2007, 33, 115–133. [Google Scholar] [CrossRef]
- NRC. Potential Impacts of Climate Change on U.S. Transportation; National Research Council. Transportation Research Board: Washington, DC, USA, 2008. [Google Scholar]
- Wright, L.; Chinowsky, P.; Strzepek, K.; Jones, R.; Streeter, R.; Smith, J.B.; Mayotte, J.-M.; Powell, A.; Jantarasami, L.; Perkins, W. Estimated effects of climate change on flood vulnerability of U.S. bridges. Mitig. Adapt. Strat. Glob. Chang. 2012, 17, 939–955. [Google Scholar] [CrossRef] [Green Version]
- Goldenberg, S.B.; Landsea, C.W.; Mestas-Nuñez, A.M.; Gray, W.M. The Recent Increase in Atlantic Hurricane Activity: Causes and Implications. Science 2001, 293, 474–479. [Google Scholar] [CrossRef] [Green Version]
- Saunders, M.A.; Lea, A.S. Seasonal prediction of hurricane activity reaching the coast of the United States. Nature 2005, 434, 1005–1008. [Google Scholar] [CrossRef]
- Gregory, J.; Stouffer, R.J.; Molina, M.; Chidthaisong, A.; Solomon, S.; Raga, G.; Friedlingstein, P.; Bindoff, N.L.; Le Treut, H.; Rusticucci, M. Climate Change 2007: The Physical Science Basis; Cambridge University Press: New York, NY, USA, 2007. [Google Scholar]
- Lyddon, C.; Brown, J.M.; Leonardi, N.; Plater, A.J. Flood Hazard Assessment for a Hyper-Tidal Estuary as a Function of Tide-Surge-Morphology Interaction. Estuaries Coasts 2018, 41, 1565–1586. [Google Scholar] [CrossRef] [Green Version]
- Lyddon, C.; Brown, J.M.; Leonardi, N.; Plater, A.J. Uncertainty in estuarine extreme water level predictions due to surge-tide interaction. PLoS ONE 2018, 13, e0206200. [Google Scholar] [CrossRef]
- Hahn, E.M.; Lyn, D.A. Anomalous Contraction Scour? Vertical-Contraction Case. J. Hydraul. Eng. 2010, 136, 137–141. [Google Scholar] [CrossRef] [Green Version]
- Lyn, D.A. Pressure-Flow Scour: A Reexamination of the HEC-18 Equation. J. Hydraul. Eng. 2008, 134, 1015–1020. [Google Scholar] [CrossRef]
- Carnacina, I.; Pagliara, S.; Leonardi, N. Bridge pier scour under pressure flow conditions. River Res. Appl. 2019, 35, 844–854. [Google Scholar] [CrossRef]
- Forde, M.; McCann, D.; Clark, M.; Broughton, K.; Fenning, P.; Brown, A. Radar measurement of bridge scour. NDT E Int. 1999, 32, 481–492. [Google Scholar] [CrossRef]
- Yanmaz, A.M.; Coşkun, F. Hydrological Aspects of Bridge Design: Case Study. J. Irrig. Drain. Eng. 1995, 121, 411–418. [Google Scholar] [CrossRef]
- Melville, B.W.; Chiew, Y.-M. Time Scale for Local Scour at Bridge Piers. J. Hydraul. Eng. 1999, 125, 59–65. [Google Scholar] [CrossRef]
- Dey, S.; Raikar, R.V. Scour in Long Contractions. J. Hydraul. Eng. 2005, 131, 1036–1049. [Google Scholar] [CrossRef]
- Dey, S.; Raikar, R.V. Characteristics of Horseshoe Vortex in Developing Scour Holes at Piers. J. Hydraul. Eng. 2007, 133, 399–413. [Google Scholar] [CrossRef]
- Hager, W.H. Scour in hydraulic engineering. Proc. Inst. Civ. Eng.-Water Manag. 2007, 160, 159–168. [Google Scholar] [CrossRef]
- Manes, C.; Brocchini, M. Local scour around structures and the phenomenology of turbulence. J. Fluid Mech. 2015, 779, 309–324. [Google Scholar] [CrossRef]
- Melville, B.W.; Raudkivi, A.J. Flow characteristics in local scour at bridge piers. J. Hydraul. Res. 1977, 15, 373–380. [Google Scholar] [CrossRef]
- Ahmed, F.; Rajaratnam, N. Flow around Bridge Piers. J. Hydraul. Eng. 1998, 124, 288–300. [Google Scholar] [CrossRef]
- Graf, W.; Istiarto, I. Flow pattern in the scour hole around a cylinder. J. Hydraul. Res. 2002, 40, 13–20. [Google Scholar] [CrossRef]
- Johnson, K.R.; Ting, F.C. Measurements of Water Surface Profile and Velocity Field at a Circular Pier. J. Eng. Mech. 2003, 129, 502–513. [Google Scholar] [CrossRef]
- Muzzammil, M.; Gangadharaiah, T.; Gupta, A.K. An experimental investigation of a horseshoe vortex induced by a bridge pier. Proc. Inst. Civ. Eng.-Water Manag. 2004, 157, 109–119. [Google Scholar] [CrossRef]
- Ettema, R.; Kirkil, G.; Muste, M. Similitude of Large-Scale Turbulence in Experiments on Local Scour at Cylinders. J. Hydraul. Eng. 2006, 132, 33–40. [Google Scholar] [CrossRef]
- Chavan, R.; Gualtieri, P.; Kumar, B. Turbulent Flow Structures and Scour Hole Characteristics around Circular Bridge Piers over Non-Uniform Sand Bed Channels with Downward Seepage. Water 2019, 11, 1580. [Google Scholar] [CrossRef]
- Chen, S.-C.; Tfwala, S.; Wu, T.-Y.; Chan, H.-C.; Chou, H.-T. A Hooked-Collar for Bridge Piers Protection: Flow Fields and Scour. Water 2018, 10, 1251. [Google Scholar] [CrossRef]
- Kumar, A.; Kothyari, U.C.; Raju, K.G.R. Flow structure and scour around circular compound bridge piers —A review. HydroResearch 2012, 6, 251–265. [Google Scholar] [CrossRef]
- Yang, Y.; Qi, M.; Li, J.; Ma, X. Evolution of Hydrodynamic Characteristics with Scour Hole Developing around a Pile Group. Water 2018, 10, 1632. [Google Scholar] [CrossRef]
- Mattioli, M.; Alsina, J.M.; Mancinelli, A.; Miozzi, M.; Brocchini, M.; Torrent, J.M.A. Experimental investigation of the nearbed dynamics around a submarine pipeline laying on different types of seabed: The interaction between turbulent structures and particles. Adv. Water Resour. 2012, 48, 31–46. [Google Scholar] [CrossRef]
- Carnacina, I.; Pagliara, S. Bridge pier flow field in the presence of debris accumulation. Proc. Inst. Civ. Eng.-Water Manag. 2013, 166, 187–198. [Google Scholar] [CrossRef]
- Yoon, K.S.; Lee, S.O.; Hong, S.H. Time-Averaged Turbulent Velocity Flow Field through the Various Bridge Contractions during Large Flooding. Water 2019, 11, 143. [Google Scholar] [CrossRef]
- Lin, C.; Kao, M.-J.; Hsieh, S.-C.; Lo, L.-F.; Raikar, R.V. On the Flow Structures Under a Partially Inundated Bridge Deck. J. Mech. 2012, 28, 191–207. [Google Scholar] [CrossRef]
- Melville, B.W.; Coleman, S.E. Bridge Scour; Water Resources Publications, LLC: Highlands Ranch, CO, USA, 2000. [Google Scholar]
- Oliveto, G.; Unger, J.; Hager, W.H. Discussion of “Design Method of Time-Dependent Local Scour at Circular Bridge Pier” by Md. Faruque Mia and Hiroshi Nago. J. Hydraul. Eng. 2004, 130, 1211–1213. [Google Scholar] [CrossRef]
- Pagliara, S.; Carnacina, I. Temporal scour evolution at bridge piers: Effect of wood debris roughness and porosity. J. Hydraul. Res. 2010, 48, 3–13. [Google Scholar] [CrossRef]
- Pagliara, S.; Carnacina, I. Influence of large woody debris on sediment scour at bridge piers. Int. J. Sediment Res. 2011, 26, 121–136. [Google Scholar] [CrossRef]
- Wu, W.; Wang, S.S.Y. Movable Bed Roughness in Alluvial Rivers. J. Hydraul. Eng. 1999, 125, 1309–1312. [Google Scholar] [CrossRef]
- Raudkivi, A.J.; Ettema, R. Scour at Cylindrical Bridge Piers in Armored Beds. J. Hydraul. Eng. 1985, 111, 713–731. [Google Scholar] [CrossRef]
- Oliveto, G.; Hager, W.H. Further Results to Time-Dependent Local Scour at Bridge Elements. J. Hydraul. Eng. 2005, 131, 97–105. [Google Scholar] [CrossRef]
- Dey, S.; Debnath, K. Sediment Pickup on Streamwise Sloping Beds. J. Irrig. Drain. Eng. 2001, 127, 39–43. [Google Scholar] [CrossRef]
- Wahl, T.L. Discussion of “Despiking acoustic doppler velocimeter data” by Derek G. Goring and Vladimir I. Nikora. J. Hydraul. Eng. 2003, 129, 484–487. [Google Scholar] [CrossRef]
- Carnacina, I.; Lescova, A.; Pagliara, S. A Methodology to Measure Flow Fields at Bridge Piers in the Presence of Large Wood Debris Accumulation Using Acoustic Doppler Velocimeters. In Advances in Water Resources Engineering and Management; Springer: Singapore, 2020; pp. 17–25. [Google Scholar]
- Voulgaris, G.; Trowbridge, J.H. Evaluation of the Acoustic Doppler Velocimeter (ADV) for Turbulence Measurements. J. Atmos. Ocean. Technol. 1998, 15, 272–289. [Google Scholar] [CrossRef]
- Snyder, W.H.; Castro, I.P. Acoustic Doppler Velocimeter Evaluation in Stratified Towing Tank. J. Hydraul. Eng. 1999, 125, 595–603. [Google Scholar] [CrossRef]
- Stefano Pagliara, I.C. Scour and dune morphology in presence of large wood debris accumulation at bridge pier. In Proceedings of the River Flow 2010, Braunschweig, Germany, 8–10 September 2010. [Google Scholar]
- Arneson, L.A.; Abt, S.R. Vertical Contraction Scour at Bridges with Water Flowing Under Pressure Conditions. In Stream Stability and Scour at Highway Bridges: Compendium of Stream Stability and Scour Papers Presented at Conferences Sponsored by the Water Resources Engineering (Hydraulics) Division of the American Society of Civil Engineers; ASCE Publications: Reston, VA, USA, 1999. [Google Scholar]
- Bernard, P.S.; Handler, R.A. Reynolds stress and the physics of turbulent momentum transport. J. Fluid Mech. 1990, 220, 99. [Google Scholar] [CrossRef]
- Çengel, Y.A.; Cimbala, J.M. Fluid Mechanics: Fundamentals and Applications; McGraw-HillHigher Education: New York, NY, USA, 2006. [Google Scholar]
- Hirshfield, F. The Impact of Ice Conditions on Local Scour Around Bridge Piers. Ph.D.’s Thesis, The University of Northern British Columbia, Prince George, BC, Canada, 2015. [Google Scholar]
- Froehlich, D.C. Protecting bridge piers with loose rock riprap. J. Appl. Water Eng. Res. 2013, 1, 39–57. [Google Scholar] [CrossRef]
Figure 1.
Diagram sketch and notation. (a) Perspective view of tested conditions, scour definition, and deck view; (b) longitudinal view with dimension of the two tested decks (in cm); (c) locations of sampled velocities at section x = 0 underneath the deck (in cm).
Figure 1.
Diagram sketch and notation. (a) Perspective view of tested conditions, scour definition, and deck view; (b) longitudinal view with dimension of the two tested decks (in cm); (c) locations of sampled velocities at section x = 0 underneath the deck (in cm).

Figure 2.
(a) Temporal scour evolution measured in proximity of the pier for the three different tested configurations, and (b) longitudinal scour and liquid profiles at maximum scour section and at the end of the tests (6 h).
Figure 2.
(a) Temporal scour evolution measured in proximity of the pier for the three different tested configurations, and (b) longitudinal scour and liquid profiles at maximum scour section and at the end of the tests (6 h).

Figure 3.
Average velocity components (in order left to right) u/U0, v/U0, and w/U0 at t = 0 fixed bed conditions for (a–c) pier without deck; (d–f) 3D deck and pier; and (g–i) 6D deck and pier.
Figure 3.
Average velocity components (in order left to right) u/U0, v/U0, and w/U0 at t = 0 fixed bed conditions for (a–c) pier without deck; (d–f) 3D deck and pier; and (g–i) 6D deck and pier.

Figure 4.
Average velocity components (in order left to right) u/U0, v/U0, and w/U0 after 6 h of testing in mobile conditions for (a–c) pier without deck; (d–f) 3D deck and pier; and (g–i) 6D deck and pier.
Figure 4.
Average velocity components (in order left to right) u/U0, v/U0, and w/U0 after 6 h of testing in mobile conditions for (a–c) pier without deck; (d–f) 3D deck and pier; and (g–i) 6D deck and pier.

Figure 5.
Comparison of longitudinal velocities turbulence intensity for three different verticals, (a,d) y/D = 0.833, (b–e) y/D = 1.5, and (c–f) y/D = 4.2, for fixed (top rows) and mobile beds (bottom rows). Symbols are the same symbols as in Figure 2.
Figure 5.
Comparison of longitudinal velocities turbulence intensity for three different verticals, (a,d) y/D = 0.833, (b–e) y/D = 1.5, and (c–f) y/D = 4.2, for fixed (top rows) and mobile beds (bottom rows). Symbols are the same symbols as in Figure 2.

Figure 6.
Comparison of total kinetic energy (TKE) for three different verticals, (a,d) y/D = 0.833, (b–e) y/D = 1.5, and (c–f) y/D = 4.2, for fixed (top rows) and mobile beds (bottom rows). Symbols are the same symbols as in Figure 2. Note that in (c) the values outside the plot are TKE/u*2 = 64.4 at z/h0 = 0.05 and TKE/u*2 = 65.14 at z/h0 = 0.12.

Figure 7.
Comparison of Reynolds shear stress <u’v’>/u*2 for three different verticals, (a,d) y/D = 0.833, (b–e) y/D = 1.5, and (c–f) y/D = 4.2, for fixed (top rows) and mobile beds (bottom rows). Symbols are the same symbols as in Figure 2.
Figure 7.
Comparison of Reynolds shear stress <u’v’>/u*2 for three different verticals, (a,d) y/D = 0.833, (b–e) y/D = 1.5, and (c–f) y/D = 4.2, for fixed (top rows) and mobile beds (bottom rows). Symbols are the same symbols as in Figure 2.


Table 1.
Experimental conditions.
| Test Name | U0 (m/s) | ldk (cm) | h0 (cm) | zmax (cm) | T (h) |
|---|---|---|---|---|---|
| Pier | 0.32 | - | 17 | 4.59 | 6 |
| Pier + ldk = 3D deck | 0.32 | 9 | 17 | 7.59 | 6 |
| Pier + ldk = 6D deck | 0.32 | 18 | 17 | 7.29 | 6 |
© 2019 by the authors. Licensee MDPI, Basel, Switzerland. This article is an open access article distributed under the terms and conditions of the Creative Commons Attribution (CC BY) license (http://creativecommons.org/licenses/by/4.0/).
Share and Cite
MDPI and ACS Style
Carnacina, I.; Leonardi, N.; Pagliara, S. Characteristics of Flow Structure around Cylindrical Bridge Piers in Pressure-Flow Conditions. Water 2019, 11, 2240. https://doi.org/10.3390/w11112240
AMA Style
Carnacina I, Leonardi N, Pagliara S. Characteristics of Flow Structure around Cylindrical Bridge Piers in Pressure-Flow Conditions. Water. 2019; 11(11):2240. https://doi.org/10.3390/w11112240
Chicago/Turabian StyleCarnacina, Iacopo, Nicoletta Leonardi, and Stefano Pagliara. 2019. "Characteristics of Flow Structure around Cylindrical Bridge Piers in Pressure-Flow Conditions" Water 11, no. 11: 2240. https://doi.org/10.3390/w11112240
Note that from the first issue of 2016, this journal uses article numbers instead of page numbers. See further details here.