Article

Assessing the Impact of Cyanuric Acid on Bather’s Risk of Gastrointestinal Illness at Swimming Pools

by
Richard A. Falk
1,*,
Ernest R. Blatchley III
2,
Thomas C. Kuechler
3,
Ellen M. Meyer
4,
Stanley R. Pickens
5 and
Laura M. Suppes
6
1
The Council for the Model Aquatic Health Code Ad-Hoc Committee, P.O. Box 3121, Decatur, GA 30031-3121, USA
2
Lyles School of Civil Engineering and Division of Environmental & Ecological Engineering, Purdue University, 550 Stadium Mall Drive, West Lafayette, IN 47907-2051, USA
3
Tom Kuechler, LLC, 531 Westernmill Drive, Chesterfield, MO 63017-2736, USA
4
Innovative Water Care, LLC, P.O. Box 800, 1200 Old Lower River Road NW, Charleston, TN 37310-0800, USA
5
Swim-Chem Consulting Services, LLC, 1241 Northwestern Drive, Monroeville, PA 15146-4403, USA
6
Environmental Public Health Program, University of Wisconsin–Eau Claire, Hibbard Humanities Hall 360, 124 Garfield Ave., Eau Claire, WI 54701-4042, USA
*
Author to whom correspondence should be addressed.
Water 2019, 11(6), 1314; https://doi.org/10.3390/w11061314
Submission received: 31 May 2019 / Revised: 20 June 2019 / Accepted: 20 June 2019 / Published: 25 June 2019

Abstract

:
Current regulatory codes for swimming pool disinfection separately regulate free chlorine (FC) and cyanuric acid (CYA). It is well-known that CYA affects disinfection rates by reversibly binding to FC in aqueous solutions. However, limits for these regulated parameters have neither systematically accounted for this chemistry nor been based on the risk of gastrointestinal illness. This study was intended to determine the minimum concentration of FC relative to CYA based on the risk of gastrointestinal illness from normal fecal sloughing of selected pathogens and to find a simple regulatory rule for jointly managing FC and CYA for consistent disinfection. Literature data on CYA’s effect on microbial inactivation rates were reanalyzed based on the equilibria governing hypochlorous acid (HOCl) concentration. A model was developed that considers the rates of pathogen introduction into pool water, disinfection, turbulent diffusive transport, and pathogen uptake by swimmers to calculate the associated risk of illness. Model results were compared to U.S. Environmental Protection Agency (EPA) untreated recreational water acceptable gastrointestinal illness risk. For Cryptosporidium, correlation between log inactivation and Chick–Watson Ct was far better when C refers to HOCl concentration than to FC (r = −0.96 vs. −0.06). The HOCl concentration had a small variation (± 1.8%) at a constant CYA/FC ratio for typical FC and CYA ranges in swimming pools. In 27 U.S. states, the allowed FC and CYA results in HOCl concentrations spanning more than a factor of 500. Using conservative values for a high bather load pool with 2 mg/L FC and 90 mg/L CYA, the model predicted a 0.071 annual probability of infection for Giardia, exceeding the EPA regulatory 0.036 limit for untreated recreational waters. FC and CYA concentrations in swimming pools should be jointly regulated as a ratio. We recommend a maximum CYA/FC ratio of 20.

1. Introduction

Swimming pools are a form of communal bathing where multiple people share the same body of water. To prevent disease transmission, pool water must be disinfected to inactivate microbial pathogens. The most common disinfectant used in public pools is chlorine. Chlorine is capable of inactivating a broad range of bacteria, viruses, and protozoa and is capable of maintaining a residual disinfectant. However, chlorine is susceptible to degradation by solar ultraviolet (UV) radiation. Cyanuric acid (CYA) is used in outdoor pools to bind chlorine and to protect it from UV degradation. The association of chlorine with CYA is governed by reversible reactions, such that as unbound chlorine is used, more is released. As a result of these equilibria, CYA functions as a free chlorine buffer. However, binding of chlorine to CYA reduces the concentration of the most biocidal form of chlorine, hypochlorous acid (HOCl), and increases the time required to inactivate microbial pathogens.
The maximum recommended concentration of CYA to be used in pools has been debated for decades because it is difficult to determine at what point the reduction in HOCl activity becomes an unacceptable public health risk. Numerous studies have demonstrated increased inactivation times of enteric pathogens with chlorine in the presence of CYA, but none have quantified the corresponding increased risk of acute gastrointestinal illness (AGI) to swimmers. The central goal of this paper is to assess the impact of CYA application in chlorinated swimming pools on swimmer AGI risk.
This paper includes a review of the literature for each of the model components, including the chemical equilibria that govern the concentration of HOCl and the effects of CYA on microbial inactivation rates (independent of the type of chlorinating product). A model is presented which calculates the steady-state concentration of pathogens in pool water under various conditions and estimates the risk of AGI to swimmers. Since one input parameter is the CYA concentration, the model can provide guidance on its application in swimming pools. As such, this model may be used to inform public health policies for swimming pool management in such codes as the Model Aquatic Health Code [1].

2. Methods

The logic of the overall risk model is presented in Figure 1, with a more detailed diagram in the Supplementary Materials (Section S1). As a conservative measure, HOCl was assumed to be the only form of free chlorine to express antimicrobial activity. Components of the model were developed to allow estimation of the pathogen introduction rate and the concentration of HOCl in solution. The Chick–Watson model was used to simulate disinfection kinetics. These components were linked to a transport model to allow estimation of steady-state concentrations of model pathogens in pool water. In turn, the pathogen concentration was linked to an estimate of the ingestion rate and a disease dose-response model to allow estimation of the risk of infection for the microbial pathogens that were included in the simulations. Presented below are details of the components used to develop risk estimates. Justifications for the selection of E. coli O157:H7, Giardia, and Cryptosporidium as model pathogens are also presented.
The overall model consists of several components linked in sequence. The model operates as follows:
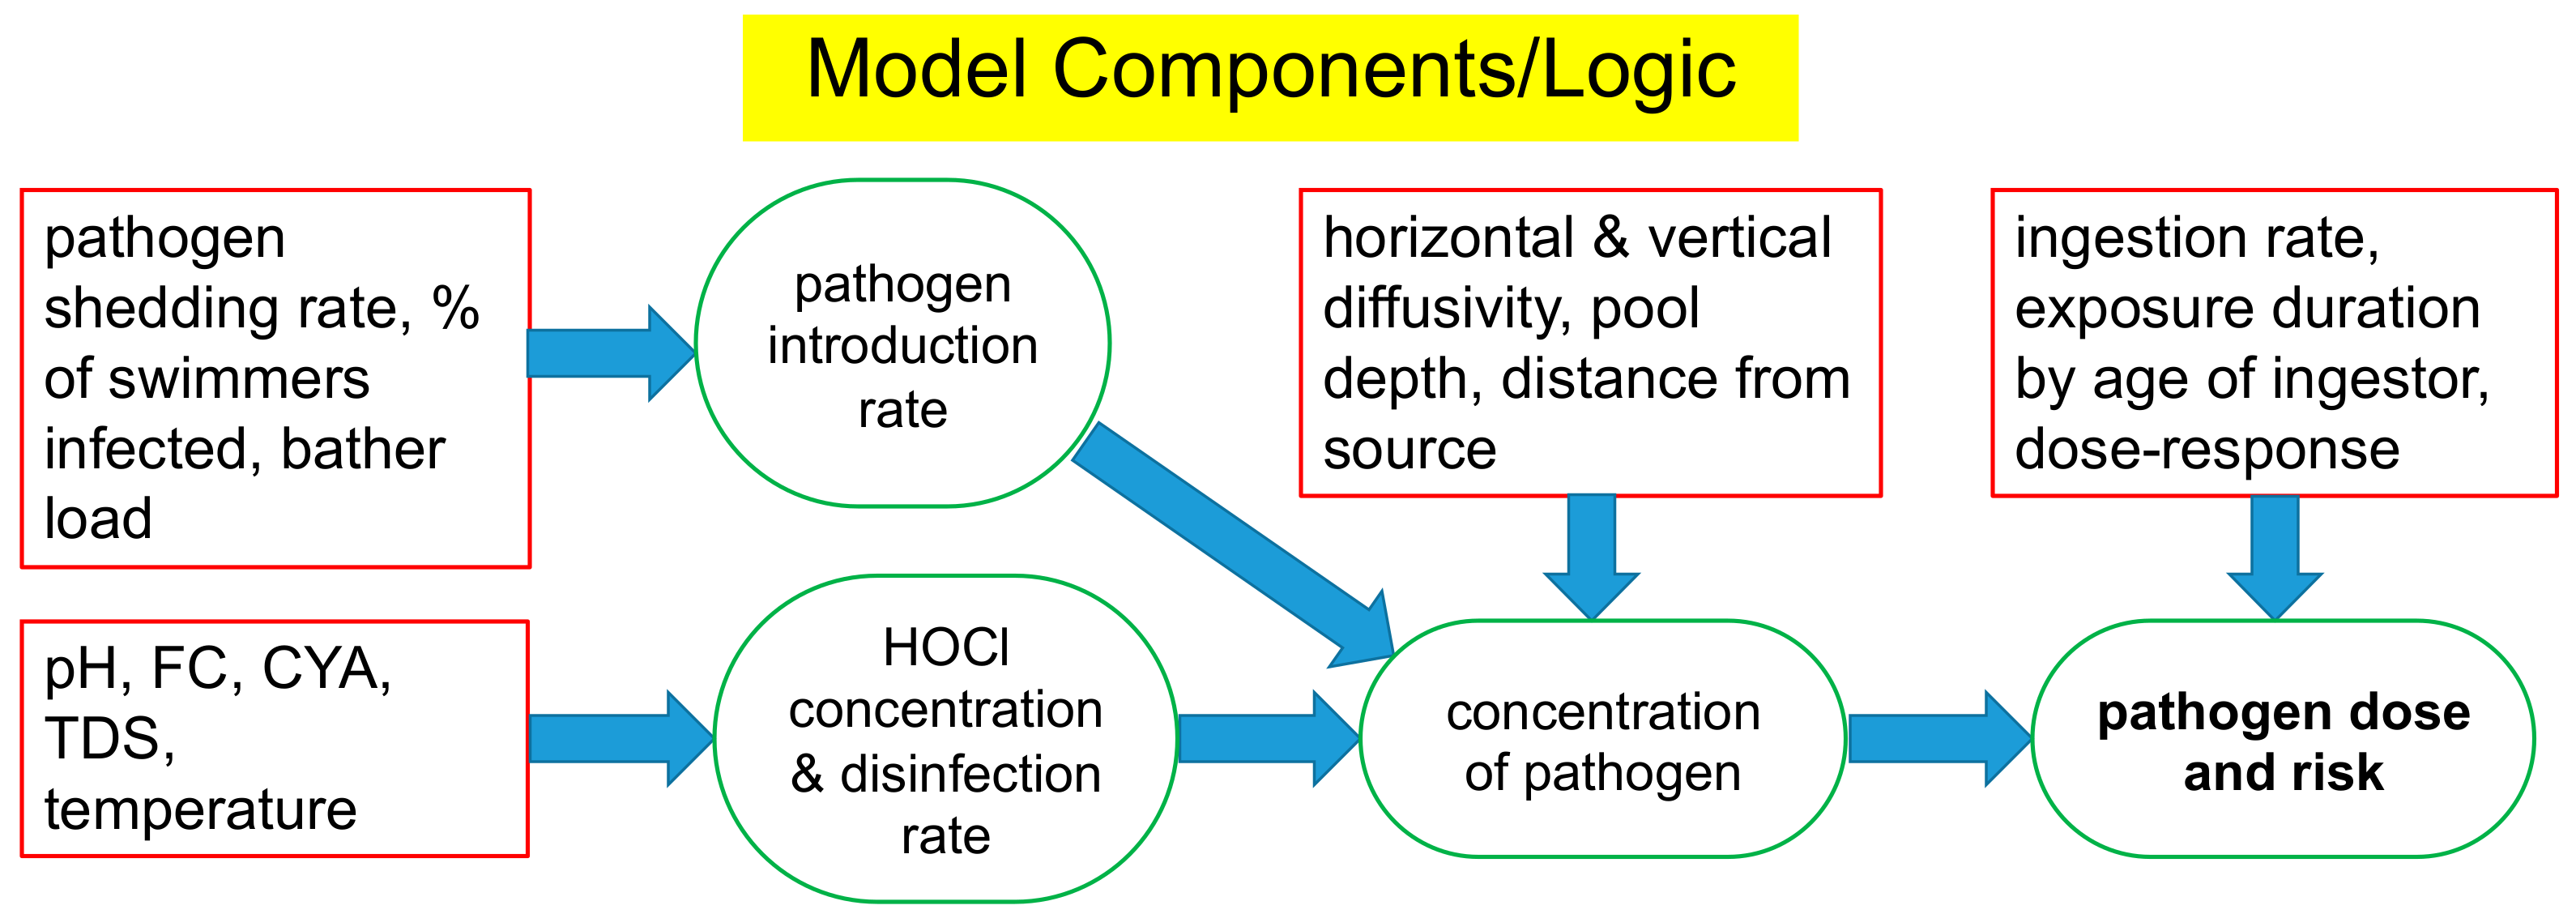
  • Infected bathers shed pathogens at a specific shedding rate.
  • Pathogens in the water are inactivated by the active disinfectant (HOCl) and have natural die-off.
  • Pathogens are mixed/dispersed via turbulent diffusion from the infected bathers to other bathers.
  • Bathers ingest surviving pathogens and are infected according to a dose-response model.

2.1. Cyanurate Chemistry

O’Brien et al. [2] described the reaction of CYA with chlorine in detail, specifically covering stepwise deprotonation and chlorination of CYA. There are three acidic protons that can be removed from the cyanurate ring in aqueous solution, though the pKa values for the second and third protons (~11.4 and ~13.5, respectively) indicate that the di-negative and tri-negative ions constitute negligible fractions of the total cyanurate composition at normal pool water pH (7.2–7.8). Each deprotonation is characterized by a corresponding equilibrium constant:
H 3 Cy H + + H 2 Cy K H 3 Cy , a = H + × H 2 Cy H 3 Cy ,
where H3Cy represents the fully protonated, unchlorinated CYA (C3H3N3O3) and Cy represents the C3N3O3 portion of the molecule. Similarly, each hydrolysis/chlorination reaction pair is characterized by a hydrolysis equilibrium:
H 2 O + H 2 ClCy H 3 Cy + HOCl K H 2 ClCy , h = HOCl × H 3 Cy H 2 ClCy ,
where the symbol for the equilibrium constants in both cases above uses a shorthand subscript to represent the cyanurate species on the left side of the equilibrium, followed by a for acid deprotonation reaction or h for hydrolysis of a chlorinated form. The concentrations of HOCl, OClˉ, and each of the possible cyanurate species can be calculated using the six independent deprotonation equilibrium constants and three independent hydrolysis/chlorination equilibrium constants, the HOCl dissociation constant (pKa ≈ 7.5), plus the pH, the total cyanurate concentration, and the measured Free Chlorine (FC) concentration. At a pH above 6.5 and chloride concentrations less than 10,000 mg/L, the concentration of dissolved molecular chlorine, Cl2, will be insignificant and can be ignored. O’Brien et al. [2] reported the best available estimates of the cyanurate equilibrium constants at 25 °C, and these estimates are used in this paper. Recently, Wahman [3] and Wahman and Alexander [4] have reported the temperature dependence of the three equilibrium constants (K6, K7a, and K9a) which are most relevant at swimming pool pH.
Swimming pool operators use test kits that measure what is referred to as FC [5]. The measured free chlorine is the sum of the concentrations of HOCl, OCl, Cl2, and the various chlorinated cyanurates [2]. Since the HOCl concentration will generally not be known initially but rather only a measured FC concentration will be known, calculating the concentrations of the individual species is less direct, requiring an initial guess of HOCl concentration and iterative correction to find a value that simultaneously satisfies the nine cyanurate-related equilibrium equations mentioned above, the HOCl dissociation equilibrium equation, a mass balance equation for the cyanurate species, and a mass balance equation for chlorine. Details on calculating the HOCl concentration are included in the Supplementary Materials (Section S2) along with ionic strength correction (Section S3) and temperature compensation (Section S4).

2.2. Effect of Cyanurate on Disinfection Kinetics

Laboratory studies of the effect of CYA on chlorine disinfection rates have been conducted with various microorganisms, including bacteria [6,7,8], protozoa [9,10], viruses [11,12], algae [13], and amoeba [14]. Various reports on the effects of CYA have also been published from field studies [15,16,17]. The literature generally shows that CYA reduces the rate of microbial inactivation because CYA reversibly binds chlorine and reduces the aqueous concentration of HOCl.
It has been established as far back as the 1940s [18] that HOCl is a much more potent biocide than OCl so most of the biocidal activity of chlorine is due to HOCl. For the purposes of this model, it was assumed that HOCl is the only active biocide in chlorinated pool water containing CYA. This assumption was tested by evaluation of inactivation data for a number of microorganisms with particular focus on Streptococcus faecalis [6,7,8] and Cryptosporidium [9]. Additional information on disinfection kinetics is provided in Supplementary Materials S5.

2.3. Pathogen Selection

Microbiological agents causing illness in treated recreational water have been well-documented [19,20,21,22,23]. Surveillance reports issued by the Centers for Disease Control and Prevention (CDC) on treated recreational water have reported the same outbreak agents over the past 10 years: the non-enteric pathogens Pseudomonas aeruginosa and Legionella pneumophila and the enteric pathogens Cryptosporidium, Giardia, E. coli, Shigella, and Norovirus. This study aimed to simulate the risk of infection from enteric pathogens associated with normal fecal sloughing (addressed by so-called “routine disinfection”) not accidental fecal releases (AFRs). The three pathogens selected for this study were E. coli O157:H7, Giardia, and Cryptosporidium.
E. coli O157:H7 was chosen because it has caused outbreaks in treated recreational water and is associated with elevated morbidity and mortality rates among children [19,24,25,26]. Twenty-one of 4826 (0.435%) laboratory-confirmed E. coli O157:H7 cases in the U.S. were associated with treated recreational water from 2010 to 2011 [19,25,26]. Two and a half percent of AGI outbreaks in treated recreational water venues were associated with E. coli from 2003 to 2012 [19]. The E. coli O157:H7 infection incidence at venues with free chlorine >1.0 mg/L is unknown. The severity of symptoms and likelihood of dying from an E. coli O157:H7 infection are greater than the severity of symptoms and probability of death from giardiasis and cryptosporidiosis. Disability Adjusted Life Years (DALYs) are used to measure and compare the burden of different diseases and to account for both the morbidity and mortality associated with a disease or infection [27]. The DALYs for E. coli O157:H7 infection, cryptosporidiosis, and giardiasis are 6.5, 0.3, and 0.2 per 100 infections, respectively [28]. Thus, E. coli O157:H7 has a greater burden on human health. This should be kept in mind when comparing the risks of infection between these microorganisms.
Giardia was selected because it is the most resistant pathogen to chlorine among the CDC’s chlorine-susceptible pathogens and has been found in treated recreational water [21,29,30]. Twenty-one of 31,981 (0.066%) reported giardiasis cases were linked to treated recreational water from 2011 to 2012 [19,31]. Three and a half percent of AGI outbreaks associated with treated recreational water were caused by Giardia from 2003 to 2012 [19].
Cryptosporidium was selected because it is responsible for the majority of AGI outbreaks in treated recreational water venues [32].
Giardia and Cryptosporidium are obligate parasites incapable of reproducing in treated recreational water environments. E. coli can replicate in some environments [33], but without data indicating that E. coli reproduces in treated recreational water environments, this study assumed that no replication occurs. Pool users are the likely source of contamination when Giardia, Cryptosporidium, and E. coli O157:H7 are present in treated recreational water. Only enteric pathogens introduced by bathers were considered for this study.
In healthy individuals, symptoms of AGI last for a short period of time and manifest as acute diarrhea [34]. Individuals with acute diarrhea sometimes resume normal activities, like swimming, after symptoms end despite continued shedding of enteric pathogens. The duration and rate of shedding can be variable. For modeling purposes in this study, a constant concentration of pathogen shedding by infected individuals was assumed and self-reinfection was excluded as a model variable.

2.4. Steady-State Model of Pathogen Risk

Assessment of the risk of infection in swimming pools has typically been based on average pathogen concentrations using a homogeneous isotropic well-mixed assumption [35,36,37,38] but has not used position-dependent mixing models such as turbulent diffusion. Computational fluid dynamics (CFD) has been used for swimming pool design and chemical mixing analysis [39,40], but CFD results are specific to a pool’s unique design, whereas this paper focusses on the effect of CYA on the risk of infection. To address this issue, a steady-state turbulent diffusion model was developed to provide estimates of the concentration of target microbial pathogens in suspension in pool water in a hypothetical pool with non-distinct dimensions (i.e., a rectangular box). Introduction of target microbial pathogens was assumed to be attributable to regular continuous sloughing of pathogens from infected bathers. The model is not appropriate for AFRs. The model is made available in the Supplementary Materials as a Microsoft Excel workbook with adjustable parameters. Details of each component of the model are described below.

2.4.1. Simulation of Bather Shedding Pathogens

Pathogen shedding was simulated as a continual point release of fecal matter from one or more infected bathers into the water. The pathogens in the fecal matter were assumed to be planktonic upon release (not clumped and not in biofilm). Pathogens were assumed to fail to reproduce in pool water after their release. Representative concentrations in fecal matter were taken from studies for E. coli O157 of 28 children (ages 7 months to 9 years) [41], for Giardia of 15 infected children [42], and for Cryptosporidium parvum of 29 challenged healthy adult volunteers [43]. The values are shown in Table 1.
The fecal matter shedding rate was estimated by dividing the number of E. coli per bather during 30-second showers [45] before swimming from 25 adults at an indoor pool [46] by the concentration of E. coli from Table 1. The maximum box plot value in Keuten et al.’s Figure 10 [46] was divided by the high concentration, the median was divided by the geometric mean concentration, and the lowest quartile was divided by the low concentration. This assumed that most of the variation is due to differences in bacterial concentration in fecal matter among individuals, with the rest coming from variations in the rate of fecal matter release. An alternative estimate is available in the model using 15-min shower graywater data for the quantity of fecal coliforms divided by their concentration [47]. These rates are shown in Table 2.
The pathogen concentration in fecal matter was multiplied by the fecal shedding rate to obtain a pathogen shedding rate (infective unit/bather/min) for infected bathers. During a swimming or bathing event, the pathogen shedding rate has been observed to be time-dependent, based on the measured release of enterococci as an indicator for fecal matter over four 15-min intervals in a swimming pool [48]. To address this behavior, an average release rate over the period of bather exposure was calculated using the following formula:
AverageRate = InitialRate 1 e kt kt ,
where t is time in minutes and k is the rate constant for decline in min−1. Elmir’s data [48] were fit to an exponentially declining release rate model to obtain a k value of 0.0309 min−1. The derivation of the formula is given in the Supplementary Materials S6. This rate of decline corresponds to halving the rate every 20 min.

2.4.2. Simulation of Subject Pathogen Inactivation and Natural Die-Off

Inactivation of subject pathogens by HOCl was simulated using the Chick–Watson disinfection model with a coefficient of dilution (n) of 1 with the addition of a die-off rate shown in Equation (4). In part, this was done to keep the pathogen mixing/dispersion model solvable in closed form and linear with respect to superposition. The model does not account for chlorine demand; therefore, the HOCl concentration was assumed to remain constant and spatially uniform throughout the pool.
dP dt = α C + d P ,
where P is the concentration of infective units (i.e., pathogens), t is time (typically in minutes), α is the inactivation rate constant. and C is the concentration of active disinfectant (typically in mg/L, implicitly with an exponent “n” of 1). The inactivation rate constant α for Escherichia coli O157:H7 was 1.36 × 10 2 (mg/L)−1 min−1 for normal strains [49], for Giardia was 2.78 × 10 1 (mg/L)−1 min−1 from the U.S. EPA Giardia table with “C” from “Ct” based on HOCl [50], and for Cryptosporidium parvum was 9.25 × 10 4 (mg/L)−1 min−1 [51]. The die-off rate constant d for Escherichia coli O157:H7 was 4.09 × 10 4 min−1 and for Giardia was 4.64 × 10 5 min−1 [52], where the source paper’s Table 4 for water in artificial wetland was converted from log10 reduction per day to ln reduction per minute. The die-off rate constant d for Cryptosporidium parvum was 4.75 × 10 5 [53], using river water from source paper’s Table 1 converted from per day to per minute and adjusted from 4 °C to 25 °C using the source paper’s “λ” with the paper’s Equation (4). For some pathogens, the references on disinfection data included information on FC, pH, and, if present, CYA concentrations such that the HOCl concentration could be calculated. For other pathogens, only the product of concentration and time (Ct) values were provided and the HOCl concentration was estimated. Ct values from the literature were normalized to 25 °C and to be relative to the HOCl concentration instead of FC. When CYA was not present, the HOCl concentration was calculated from the pH; otherwise, when HOCl was explicitly calculated, only a temperature adjustment was made. Details are presented in the Supplementary Materials S7 for adjustment of Ct from EPA tables and in the Supplementary Materials S8 for temperature compensation.
The Inactivation Rate constant, α, was calculated as follows from the Chick–Watson equation (with die-off), recognizing that Log Reduction (LogRed) = −log10(P/P0).
α = ln P / P 0 + d × t Ct = ln 10 LogRed Ct d C
Under the CDC Model Aquatic Health Code (MAHC), all increased risk aquatic venues must include a secondary disinfection system in addition to the primary halogen disinfectant [1]. The model can account for secondary disinfections as specified by the MAHC (e.g., ozone or ultraviolet) or filtration of pathogens, but the results in this paper do not include these effects. More information is available in the Supplementary Materials S9.

2.4.3. Simulation of Pathogen Mixing/Dispersion

Pathogen mixing/dispersion was simulated using a turbulent (eddy) diffusivity model with an advective-diffusion equation that included a term for first-order decay. The governing equation is given by
P t + U x P x = D x 2 P x 2 + D y 2 P y 2 + D z 2 P z 2 α C + d P
for homogenous, anisotropic turbulence, where the constant first-order decay rate, k , in the original equation was replaced with α C + d from the disinfection model. There is also an option within the model to include a steady velocity U x in one direction, for example, to simulate one swimmer swimming behind another or bathers in a unidirectional flow [54].
Since the model was developed to assess risk from continual sloughing of pathogens from infected bathers and not from an AFR, a steady-state solution to the advective reacting diffusion of Equation (6) for a continuous point source was used to calculate the pathogen concentration at any location away from the source [54]:
τ = x x 0 2 D x + y y 0 2 D y + z z 0 2 D z .
P x , y , z = m ˙ × e x x 0 U x 2 D x τ U x 2 4 D x + α C + d / 4 π τ D x D y D z .
Equations (7) and (8) were adapted to be in a form that is computationally stable in situations of high advective velocity. τ is a kind of diffusion time (min); m ˙ is the rate of pathogen injection (infective units/min, IU/min); ( x 0 , y 0 , z 0 ) is the position of pathogen release from the infected bather (cm); ( x , y , z ) is the position of the ingesting bather (cm); U x is the advective velocity (Euler mean current) in one direction (cm/min); D x , D y , and D z are the turbulent (eddy) diffusivity constants in each direction (i.e., anisotropic) (cm2/min); α is the inactivation rate constant ((mg/L)−1 min−1); C is the concentration of disinfectant (mg/L); d is the die-off rate constant (min−1); and the result P x , y , z is the concentration of pathogen as a function of position (IU/cm3 or IU/mL).
In a swimming pool, multiple infected bathers may be present. The diffusion model took advantage of the linearity of Equation (6) to sum the pathogen concentration contributions from all infected bathers. These bathers were placed on an equidistant grid of infinite extent spaced according to the product of bather load with the percent of infected bathers. To improve accuracy from a limited computational grid size of 21 × 21 infected bathers, a geometric series projection was used. The derivation is described in the Supplementary Materials S10.
The following values were used in the model for the default prevalence of infected bathers, expressed as a percentage, for each pathogen. The prevalence for Shiga toxin-producing Escherichia coli (STEC) (0.0935%) was based on incidence studies in the WHO AMR A subregion [55]. This value was based on annual incidence not prevalence, so it is overestimated. The prevalence for Giardia (4.4%) was based on 293 formed stool samples in U.S. swimming pools [29]. For Cryptosporidium, the prevalence (0.4%) was based on a study of the fecal specimens of 1093 asymptomatic individuals in Australia [56]. Additional information is provided in the Supplementary Materials S11.
Three types of risk are calculated with the model: (1) the per-visit risk for ingestors swimming next to shedders, (2) the average per-visit risk (averaged over the entire pool population), and (3) the annual risk. The per-visit risk is a worst-case scenario because it does not predict the risk for everyone in the pool, just for the ingestors closest to the shedders. Furthermore, the model assumes that the ingestor stays near an infected bather for the duration of the visit. The average per-visit risk describes the risk for the entire pool population. The annual risk was calculated from the average-per-visit risk. Unless stated otherwise, the results presented will be for the worst-case scenario of per-visit risk.
Boundary conditions were applied to account for the pool floor and water surface by adding planes of (reflected) image sources repeated through higher-order image planes until the relative error was 1 × 10 10 or when 100 iterations were reached. Details of the image source calculations are described in the Supplementary Materials S12. If the geometric series ratio or relative error from image sources exceeded certain thresholds, either of which can occur at levels of high diffusivity, then the solution for a well-mixed model equivalent to infinite diffusivity was used. This steady-state well-mixed solution, Equation (9), was derived by equating the pathogen shedding rate to the net disinfection rate (including die-off) for a fixed water volume ( V ) associated with each infected bather.
P = m ˙ / V α C + d
The thresholds and equation derivation are described in the Supplementary Materials S13.

2.4.4. Simulation of Dose-Response Infection Risk

Upper-limit infection risk estimates from waterborne pathogen exposure can be produced using proxy-pathogens found previously in a water source [57]. Single-hit infection probability models combine dose-response data from feeding studies with pathogen dose estimates from exposure data. Single-hit models use point-estimates (mean, maximum, etc.) to characterize upper-limit risk. Risk estimates were developed assuming a single exposure and exposure over one year to E. coli O157:H7, Giardia, and Cryptosporidium in swimming pool water with a range of cyanuric acid and free chlorine concentrations for children (5–18 years) and adults (>18 years).
To quantify the risk of infection, maximum-likelihood estimators from dose-response models for E. coli O157:H7, Giardia duodenalis, and Cryptosporidium parvum were applied. The following equation was used to calculate the pathogen dose:
N = I × D × P ,
where P is the concentration of pathogen, I is the pool water ingestion rate (mL/h), D is swim duration (h), and N is per-visit dose (IU). The model parameters for calculating pathogen dose used an ingestion rate of 24.2 mL/h for children and 6.3 mL/h for adults, a swim duration of 1.9 h for children and 1.2 h for adults, and an annual frequency of 72.9 visits/year for children and 77.8 visits/year for adults [38].
One of the most widely used single-hit models to estimate infection probability in Quantitative Microbial Risk Assessment is the exponential model shown in Equation (11) [57,58]:
Π v = 1 exp k v × N ,
which was used to estimate the per-visit risk of infection (Πv). Maximum-likelihood estimators in the exponential model are kv and N, where kv describes the dose-response curve [59]. Equation (12) was applied to estimate the annual risk of infection (ΠA):
Π A = 1 ( 1 Π v ) F ,
where F represents the annual frequency of pool visits (visits/year) but used the average per-visit risk as described in Supplementary Materials S14.
Pathogens have unique kv parameters that are estimated by fitting dose-response data to appropriate models that best describe the data sets. The recommended best-fit models for E. coli O157:H7, Giardia, and Cryptosporidium are exponential, with kv parameters of 2.18 × 10⁻⁴ [60], 1.99 × 10⁻² [61], and 5.72 × 10⁻² [62], respectively.

2.4.5. Model Limitations

The disinfection model’s accuracy is limited by the assumption that the pathogens are planktonic and not clumped or in biofilm. Microbial clusters from biofilms can be more resistant to disinfection by HOCl than their planktonic forms [63]. Furthermore, clusters of cells that remain intact may be ingested by another bather, resulting in a higher dose and therefore increasing the risk of infection, or may not be ingested at all. The net effect is that pathogen clustering may introduce uncertainty or scatter in the results.
The disinfection model also assumed HOCl to be the sole disinfectant and ignored the small contribution to disinfection from hypochlorite ion, OCl. Also, in pools with bathers, chlorine can combine with ammonia from sweat and urine to form monochloramine and other chloramines. Modeling the contribution of monochloramine to disinfection is described in Supplementary Materials S15.
The turbulent diffusion model depended on a scale separation to create the advective reactive diffusion equation that assumes the time and length scales of the turbulent velocity fluctuations are much smaller than the scales of the mean velocity field. The Fickian assumption of a constant diffusivity tensor was not realistic in areas of high turbulence, where the diffusion coefficients are strongly flow-dependent. Furthermore, the diffusion equation was derived by setting all but the diagonal components of the diffusivity tensor to zero as a homogeneity assumption. The intent was to examine the effect of CYA on risks of infection by using a model which gave a reasonable simulation of mixing in a swimming pool without attempting to model the complex fluid dynamics or geometry of a given swimming pool. Therefore, the model does not accurately simulate areas of higher turbulence, such as near a return inlet. The model conservatively assumes continual sloughing 24 h/day, 7 days/week at a constant bather load, thus not accounting for partial diurnal recovery from overnight disinfection.
Because the risk of infection is calculated from the steady-state concentration of pathogens with bathers at fixed distances, it neither accounts for the instantaneous exposure that can occur when a swimmer approaches an infected bather nor calculates the risk for patrons of a splash pad or other water feature.

3. Results

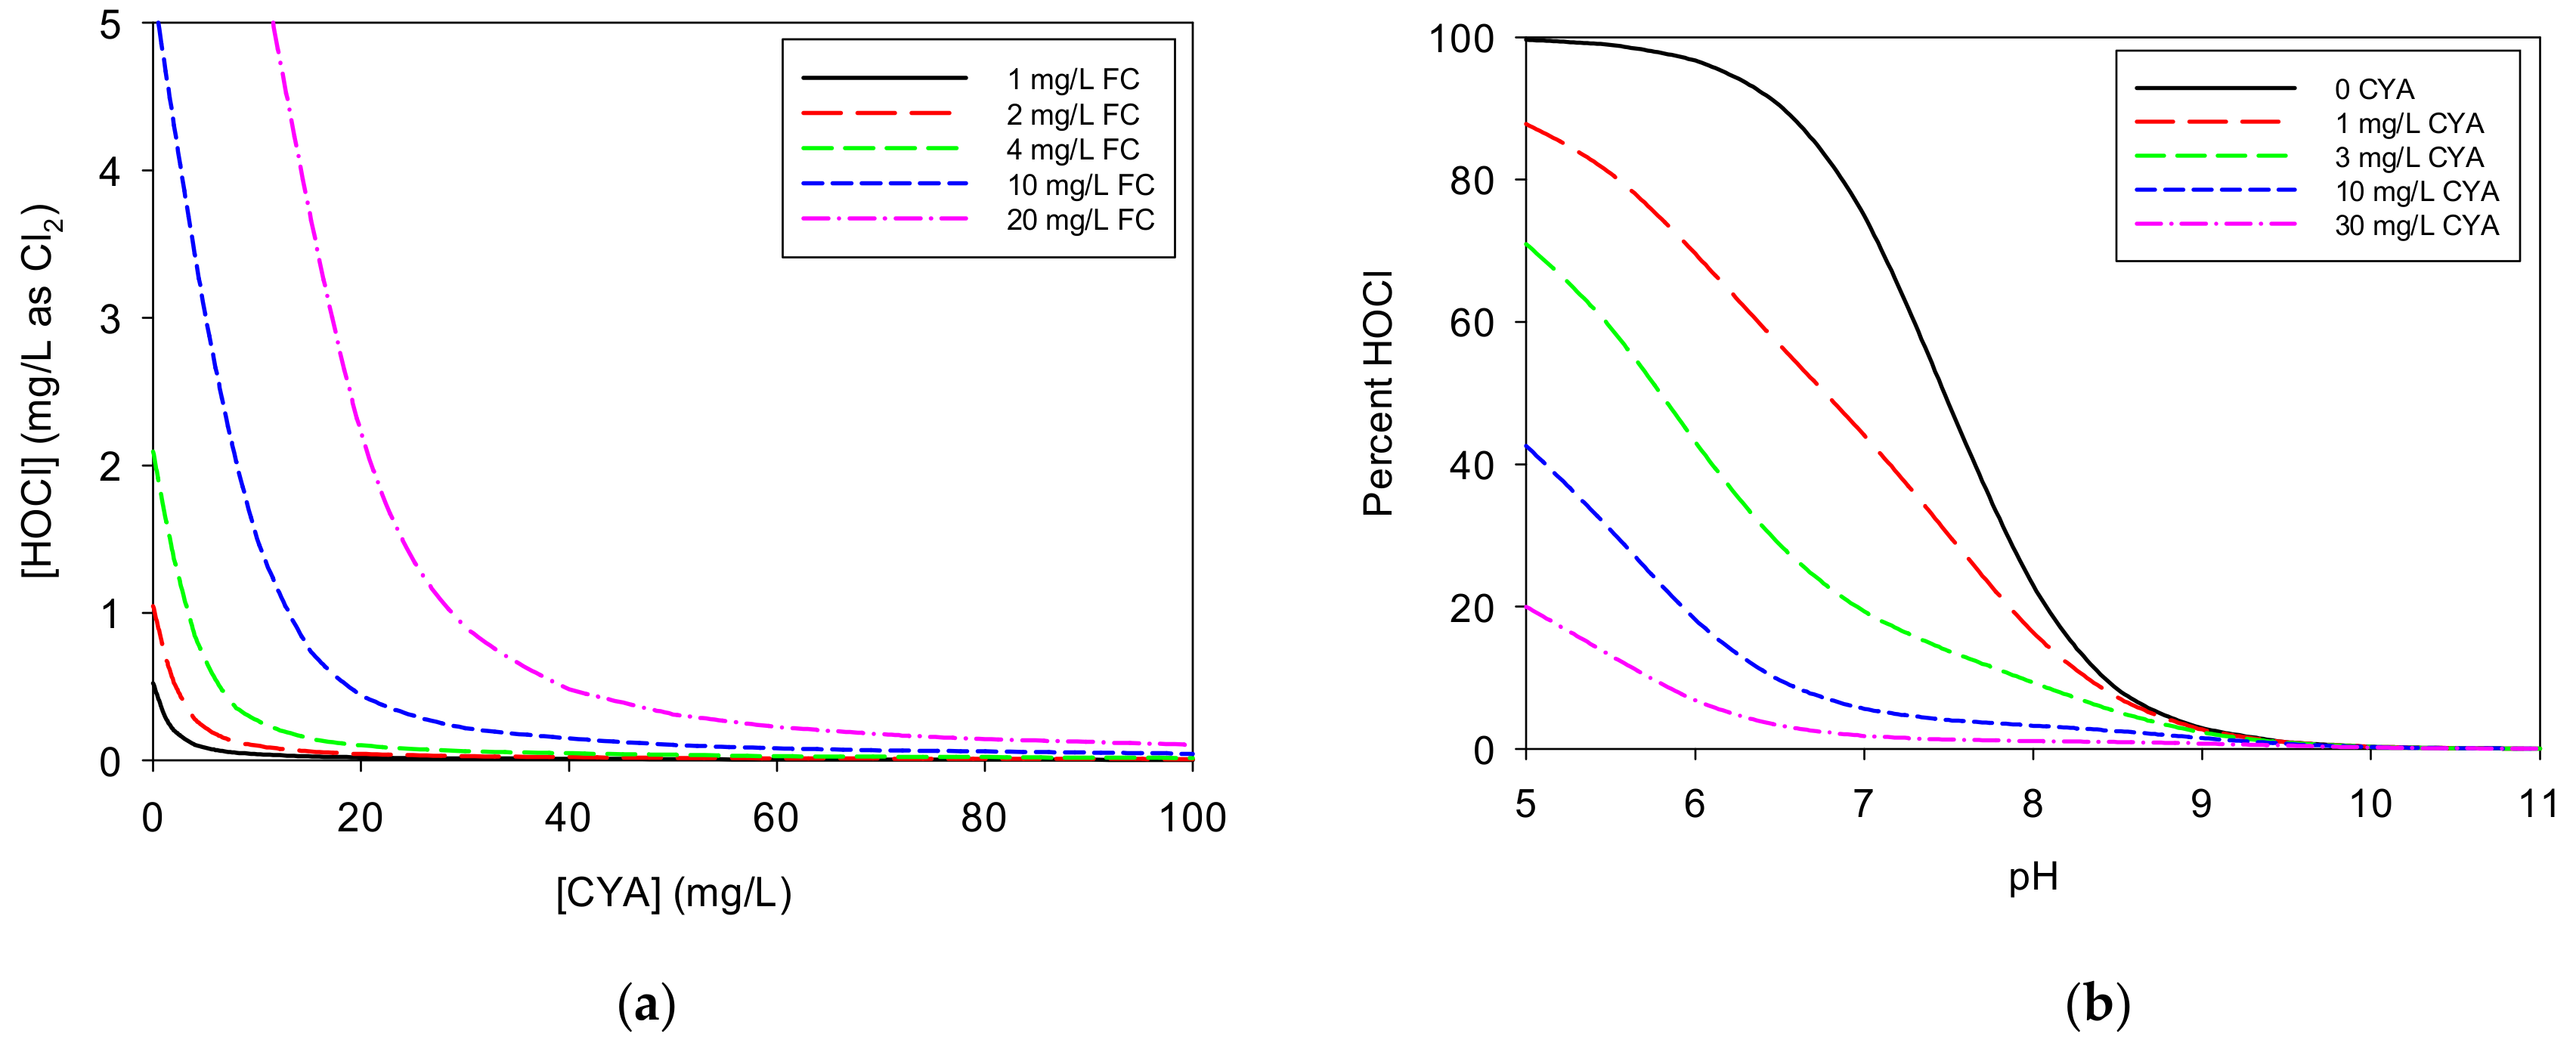
3.1. Cyanurate Chemistry

Unless otherwise specified, the results that follow are at 25 °C, with a Total Dissolved Solids concentration (TDS) of 1000 mg/L (an ionic strength of approximately 0.025 M) and a pH of 7.5.

3.1.1. HOCl vs. CYA and pH

Figure 2a illustrates the impact of CYA on HOCl concentration for various concentrations of FC. The initial addition of CYA causes a steep drop in HOCl concentration for any given “free” chlorine concentration because most of the “free” chlorine becomes bound to isocyanurate. Continued CYA addition yields further reduction of the HOCl concentration but to a diminishing degree. As shown in Figure 2b, as the CYA concentration increases, the fraction of available chlorine present as HOCl decreases, but this effect depends on the pH. The curves flatten at CYA concentrations above approximately 10 mg/L in the pH 7-8 range. Whereas the HOCl concentration drops by 53% from pH 7.5 to 8.0 with no CYA present, it only drops by 15% with 30 mg/L CYA.

3.1.2. HOCl vs. CYA/FC Ratio

As illustrated in Table 3, the HOCl concentration is nearly constant (± 1.8%) with varying FC and CYA concentrations as long as the CYA/FC ratio is constant.

3.1.3. HOCl Range in Regulatory Code

Nearly all current U.S. state swimming pool codes as well as the MAHC separately limit FC and CYA. As a result, in 27 states and the MAHC, the range of allowed HOCl concentration spans more than a factor of 500. A detailed table of FC, CYA, and calculated HOCl for swimming pool codes is presented in the Supplementary Materials S16.

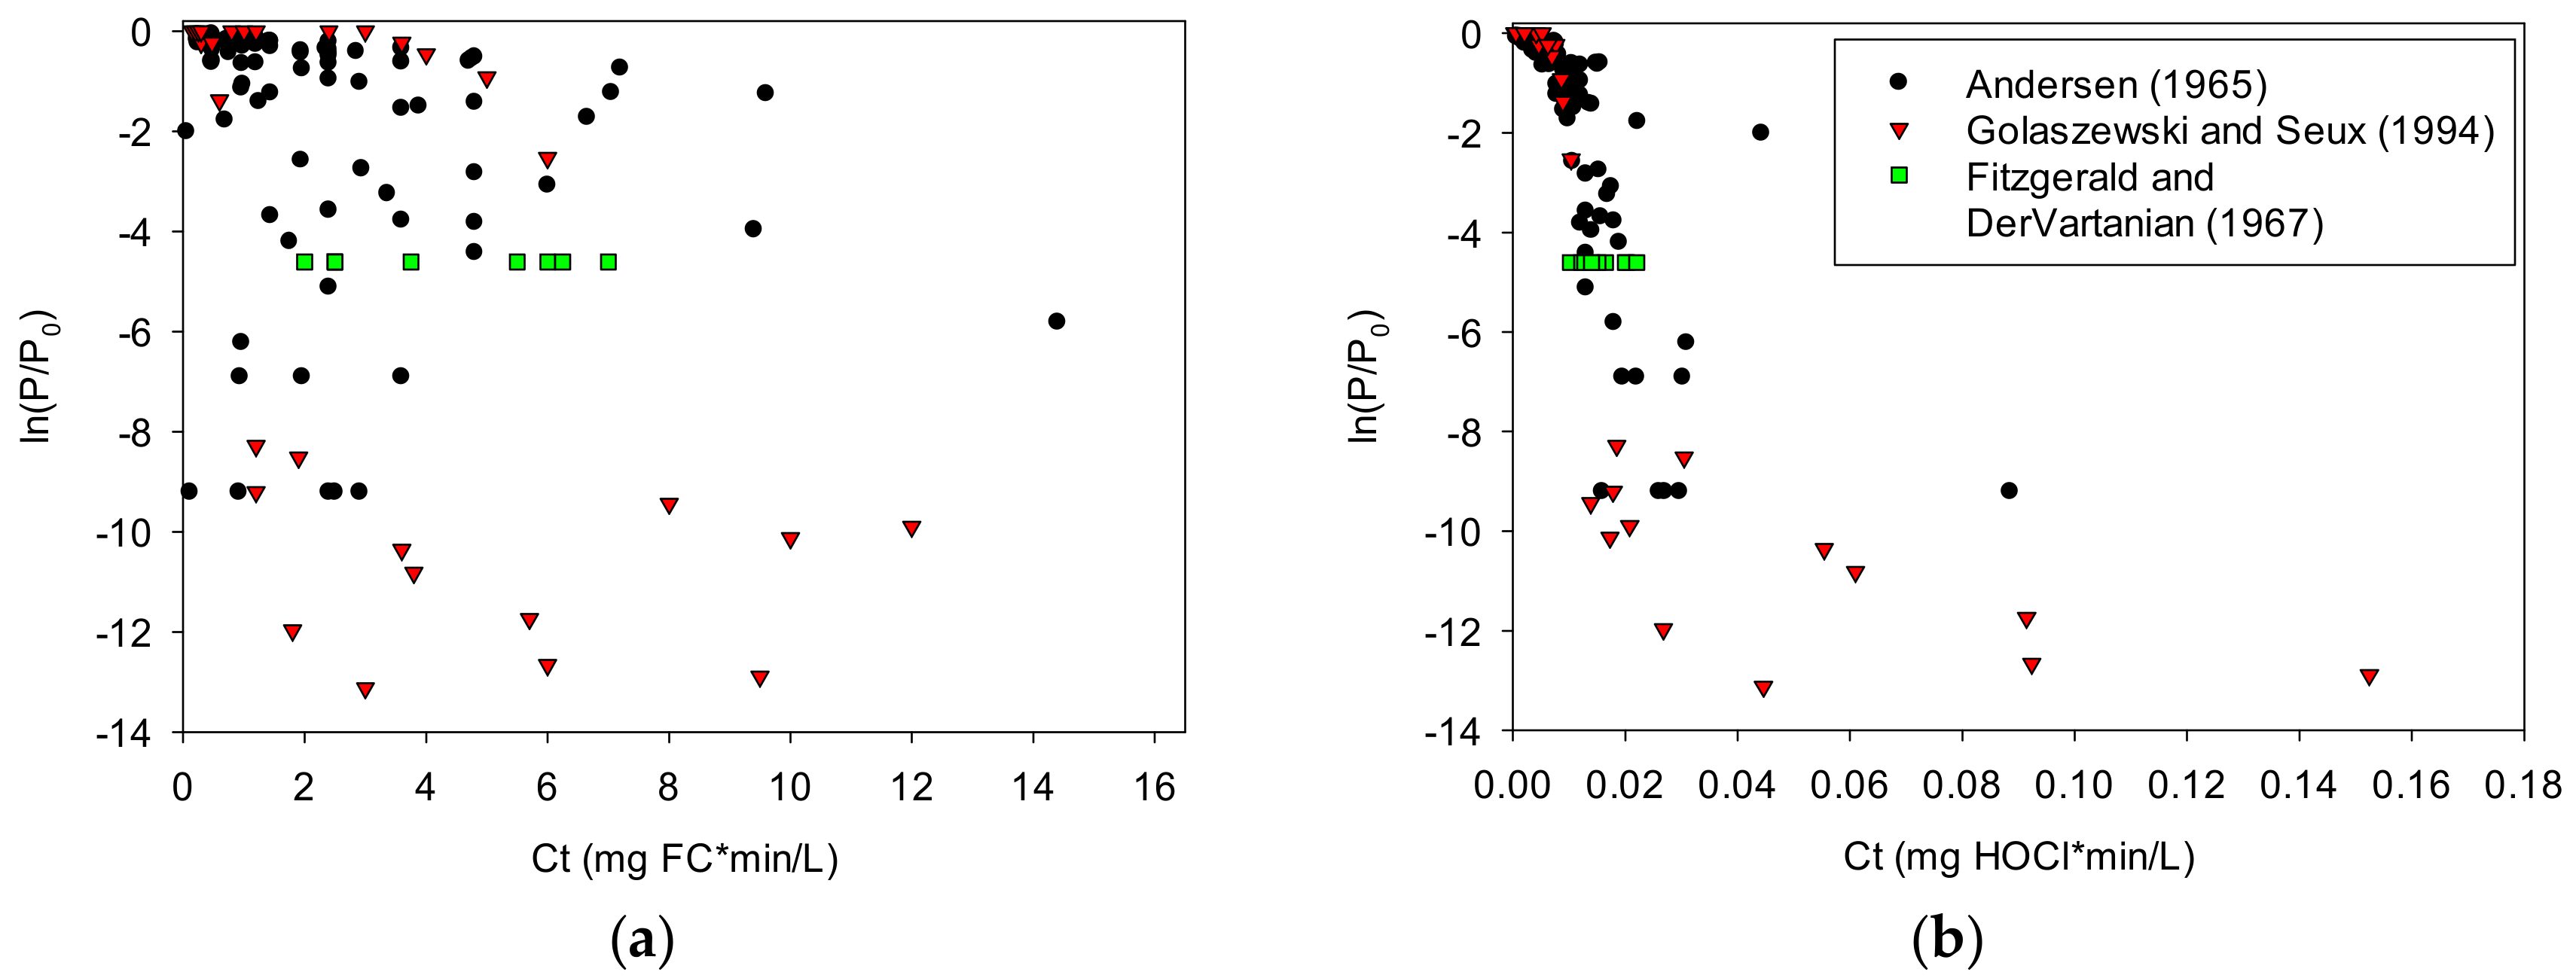
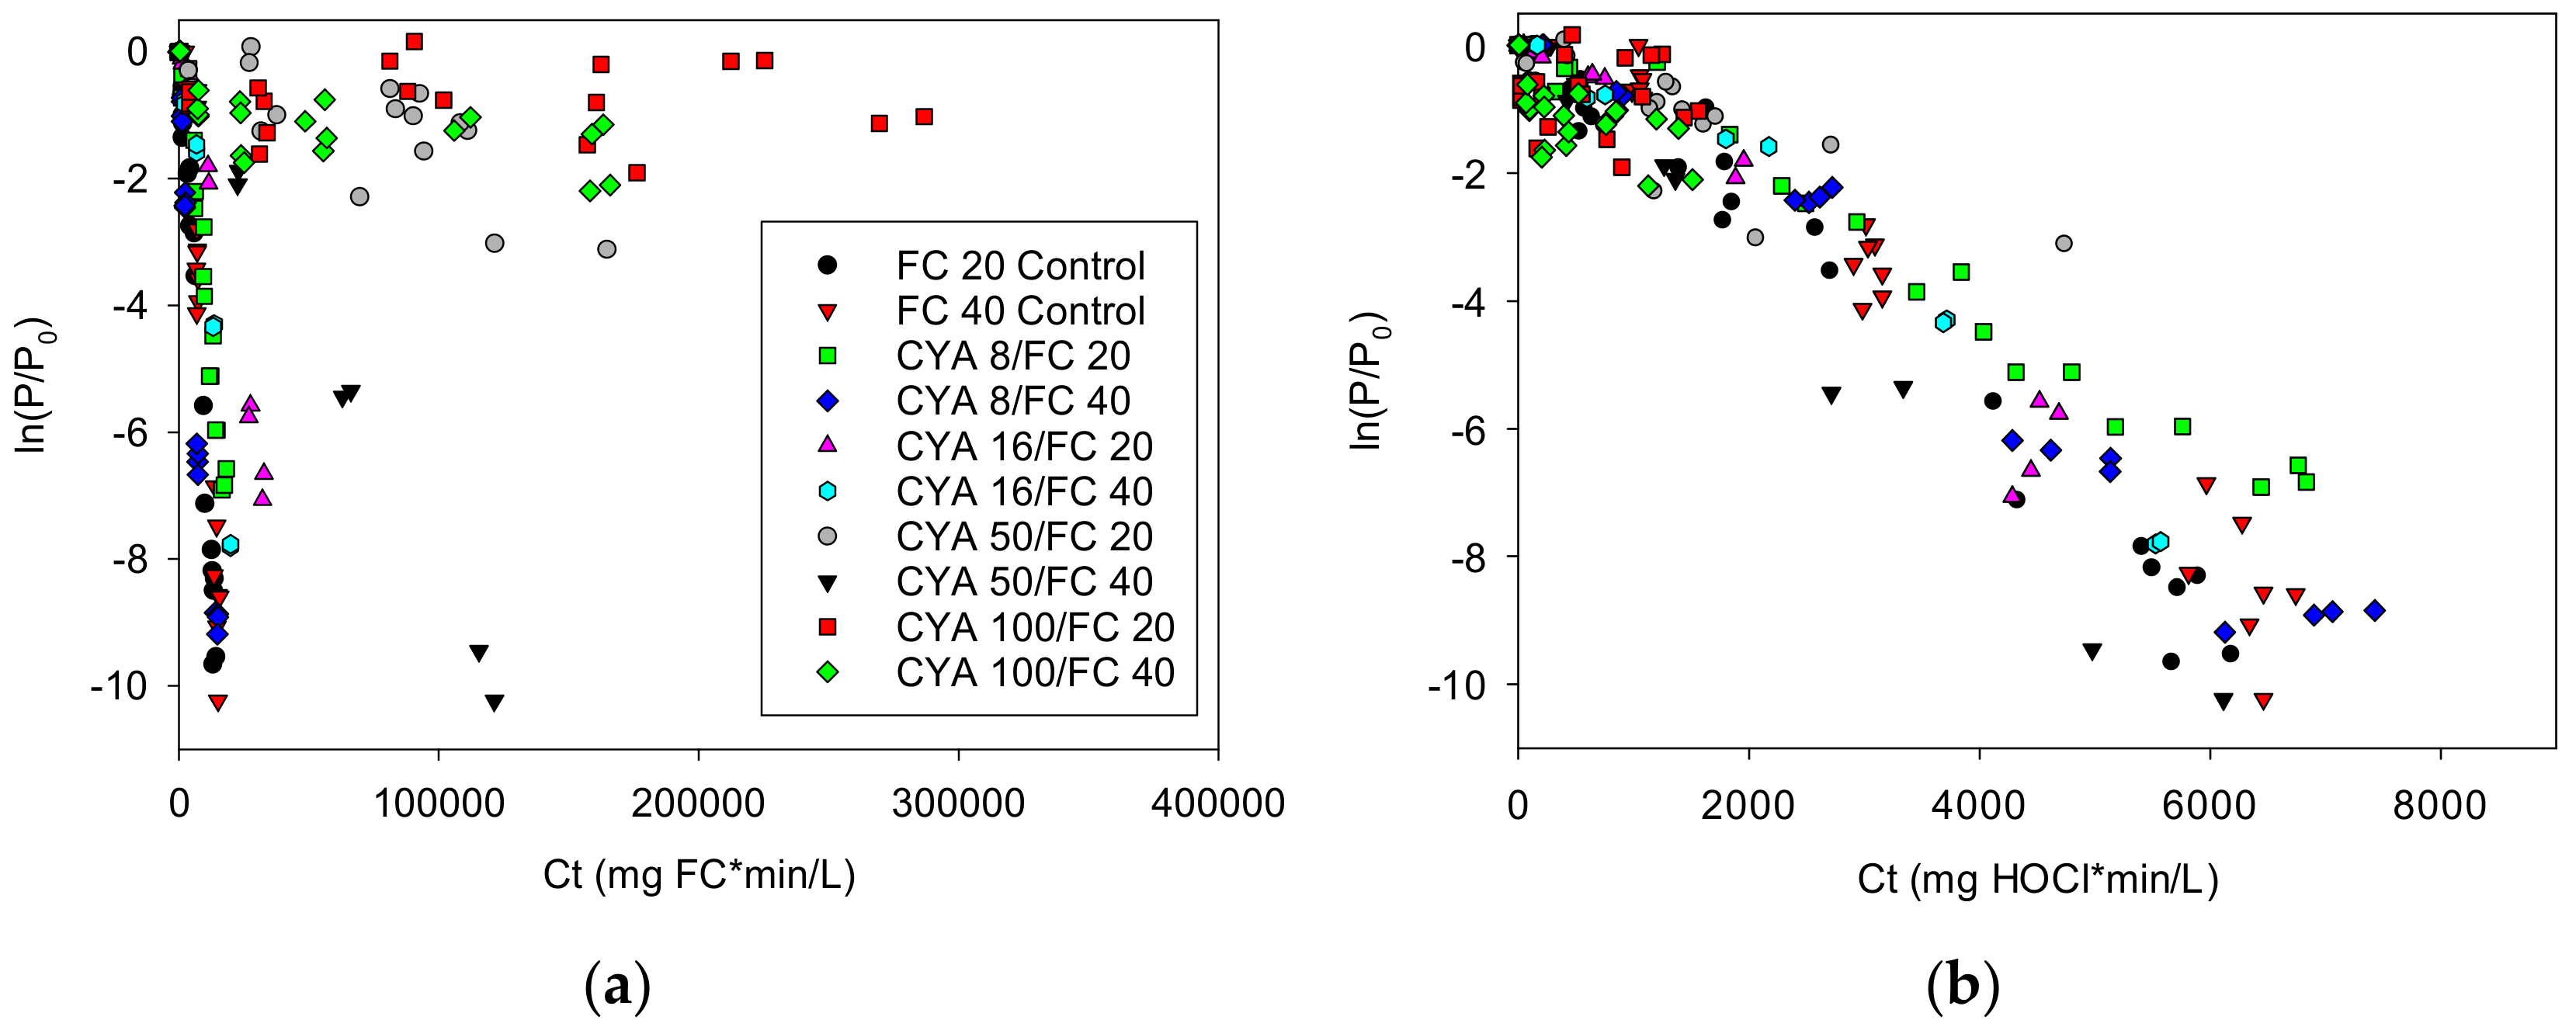
3.2. Effect of Cyanurate on Disinfection Kinetics

Figure 3 illustrates the dependence of inactivation on HOCl rather than FC using three studies examining Streptococcus faecalis [6,8,64]. Note the Ct scale difference between these graphs. The data presented in Figure 3 indicate a weak dependence of bacterial inactivation on FC concentration. The same data, based on calculated values of HOCl, present less scatter, indicating a stronger dependence of bacterial inactivation on HOCl.
The Pearson correlation coefficients for the Streptococcus faecalis data in Figure 3 show that the log reduction correlates better with Ct based on HOCl than with Ct based on free chlorine (−0.75 and −0.74 versus −0.38 and −0.56 for Andersen [6] and Golaszewski and Seux [8], respectively) (−1.0 would be a perfect decreasing linear correlation). Likewise, for the single log-reduction dataset from Fitzgerald and Dervartanian [7], the coefficient of variation is lower (better) with Ct based on HOCl (0.25) than with Ct based on free chlorine (0.46).
The proposition that the primary biocide in chlorine solutions with CYA is HOCl is further supported by the Cryptosporidium data from Murphy [9] (see Figure 4). The ln(P/P0) were adjusted for die-off. See the Supplementary Materials S17.
With the Murphy data, it is clear that HOCl, with a correlation coefficient of −0.96, correlates very well with inactivation of Cryptosporidium, while FC, with a correlation coefficient of −0.061, does not. Further supporting data may be found in the Supplementary Materials S18.

3.3. Steady-State Model of Pathogen Risk

3.3.1. Model Accuracy

The calculation of the HOCl concentration from water chemistry parameters was based on well-known equilibrium chemistry. The equilibrium constants from O’Brien [65] were adjusted to 0 M ionic strength, and the reported standard deviations were converted to ± 95% confidence intervals. The dominant equations at pool pH were the hydrolysis of HClCy to H2Cy, which has a pKh of 5.62 ± 0.035, along with the acid dissociation of H3Cy to H2Cy, which has a pKa of 6.94 ± 0.013, and the hydrolysis of Cl2Cy to HClCy, which has a pKh of 4.51 ± 0.058. With 3 mg/L FC and 30 mg/L CYA at pH 7.5, 25 °C, and 1000 mg/L TDS, the calculated HOCl was 0.0430 (95% CI 0.0395, 0.0467).

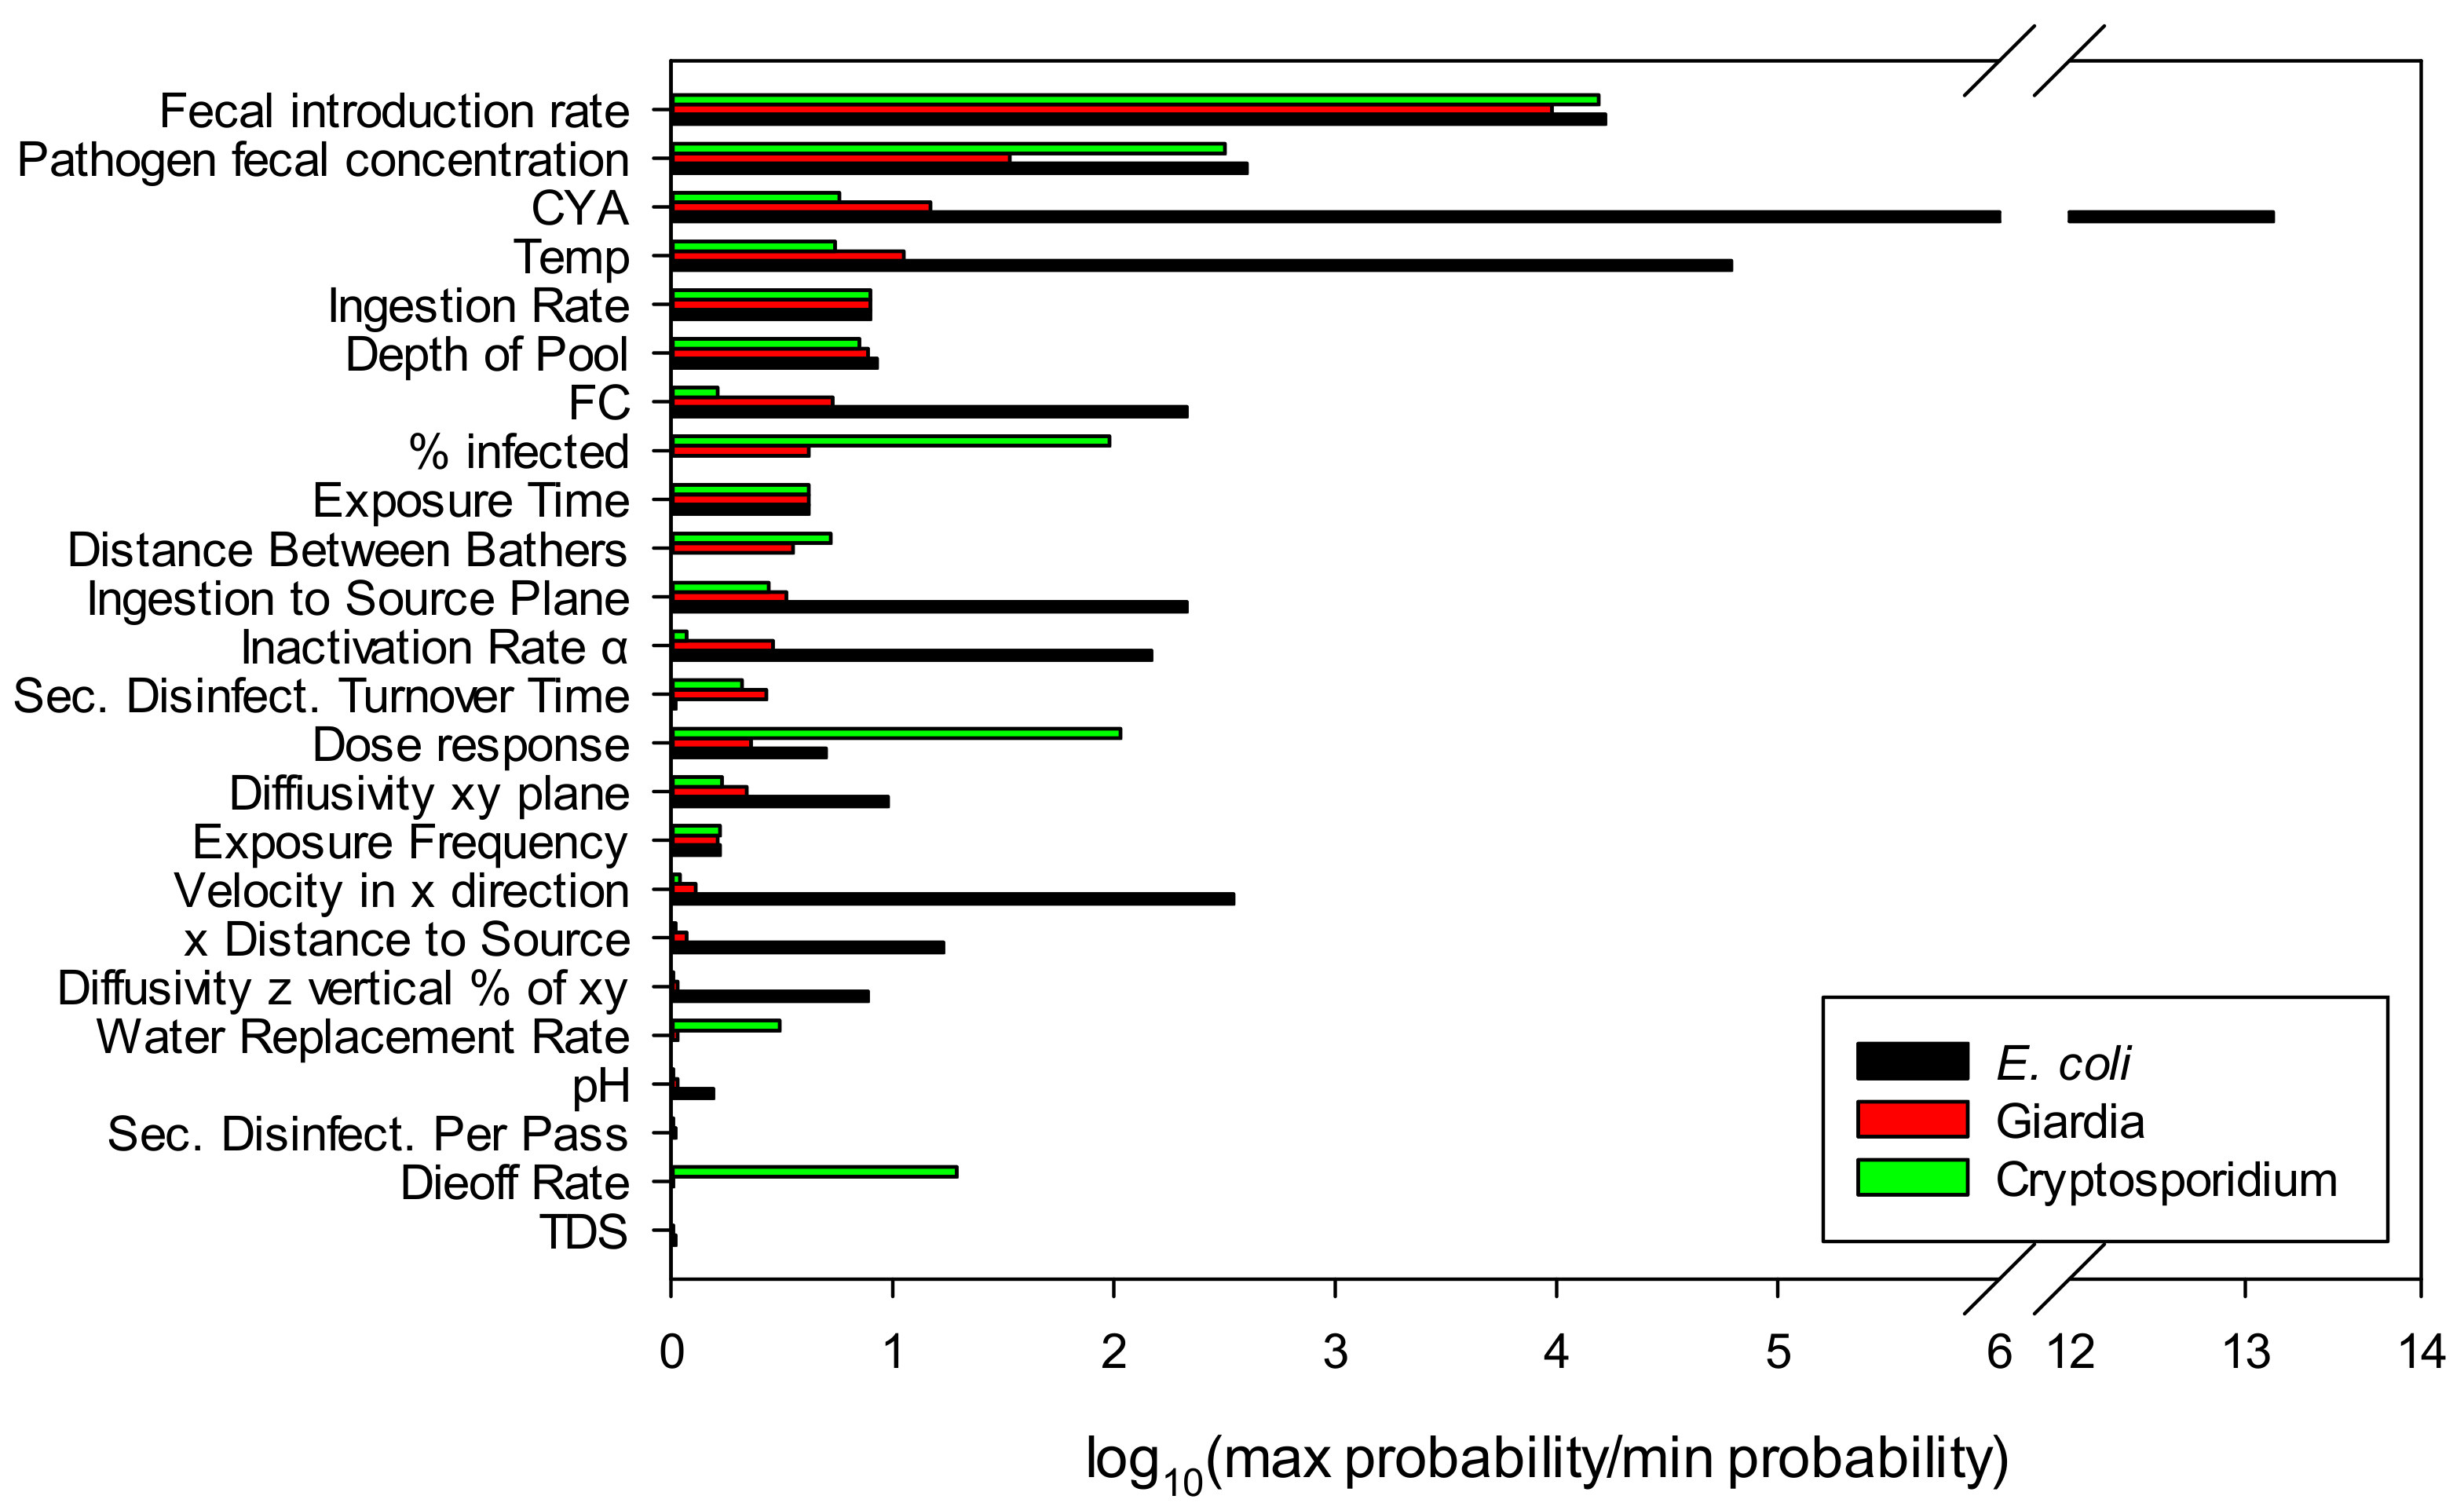
3.3.2. Model Sensitivity

A sensitivity analysis was performed to evaluate the effect of each parameter in the model on the calculated probability of infection. For all parameters, except for the exposure frequency, the probability of infection was calculated for a single swimming event for each of the three pathogens. For the exposure frequency parameter, the sensitivity analysis compared the annual probability of infection. Table 4 and Table 5 provide the selected, minimum, and maximum values used in the sensitivity analysis. These selected values were used for all subsequent results unless stated otherwise. The choice of these values is discussed in Supplementary Materials S19.
The large range of reported pathogen concentrations in fecal matter and the large range of the fecal shedding rates led to corresponding large ranges in their product, as shown in Table 6. Uncertainty in the pathogen shedding rate may represent the greatest source of error in the model results.
Figure 5 shows the sensitivity analysis of each of the model parameters and shows the log of the maximum probability divided by the minimum probability for each parameter. In addition to showing the importance of the input parameter choice, the sensitivity analysis also allows prioritization of actions that can be taken to minimize risk. It is clear that keeping ill swimmers and fecal material out of the pool are a priority. For water treatment, CYA and FC concentrations must be controlled.
The low sensitivity to pH is due to the high selected value chosen for cyanuric acid (90 ppm). As shown in Figure 2b, the HOCl concentration shows little variation between pH 7.2 and 7.8 when more than 10 ppm of CYA is present. Without CYA, variations in pH can have a significant effect where the Log (max probability/min probability) is 5.01 for Escherichia coli O157, 0.11 for Giardia, and 0.10 for Cryptosporidium parvum. For E. coli, pH is the second most influential parameter behind CYA. By comparison, with 90 ppm CYA, the Log (max probability/min probability) is 0.19 for Escherichia coli O157, 0.03 for Giardia, and 0.01 for Cryptosporidium parvum.
As seen in this analysis, Cryptosporidium is the only organism for which the natural die-off rate and water replacement rate have a significant influence. This is expected due to the high Ct values for Cryptosporidium and has implications for pool operation and remediation practices.

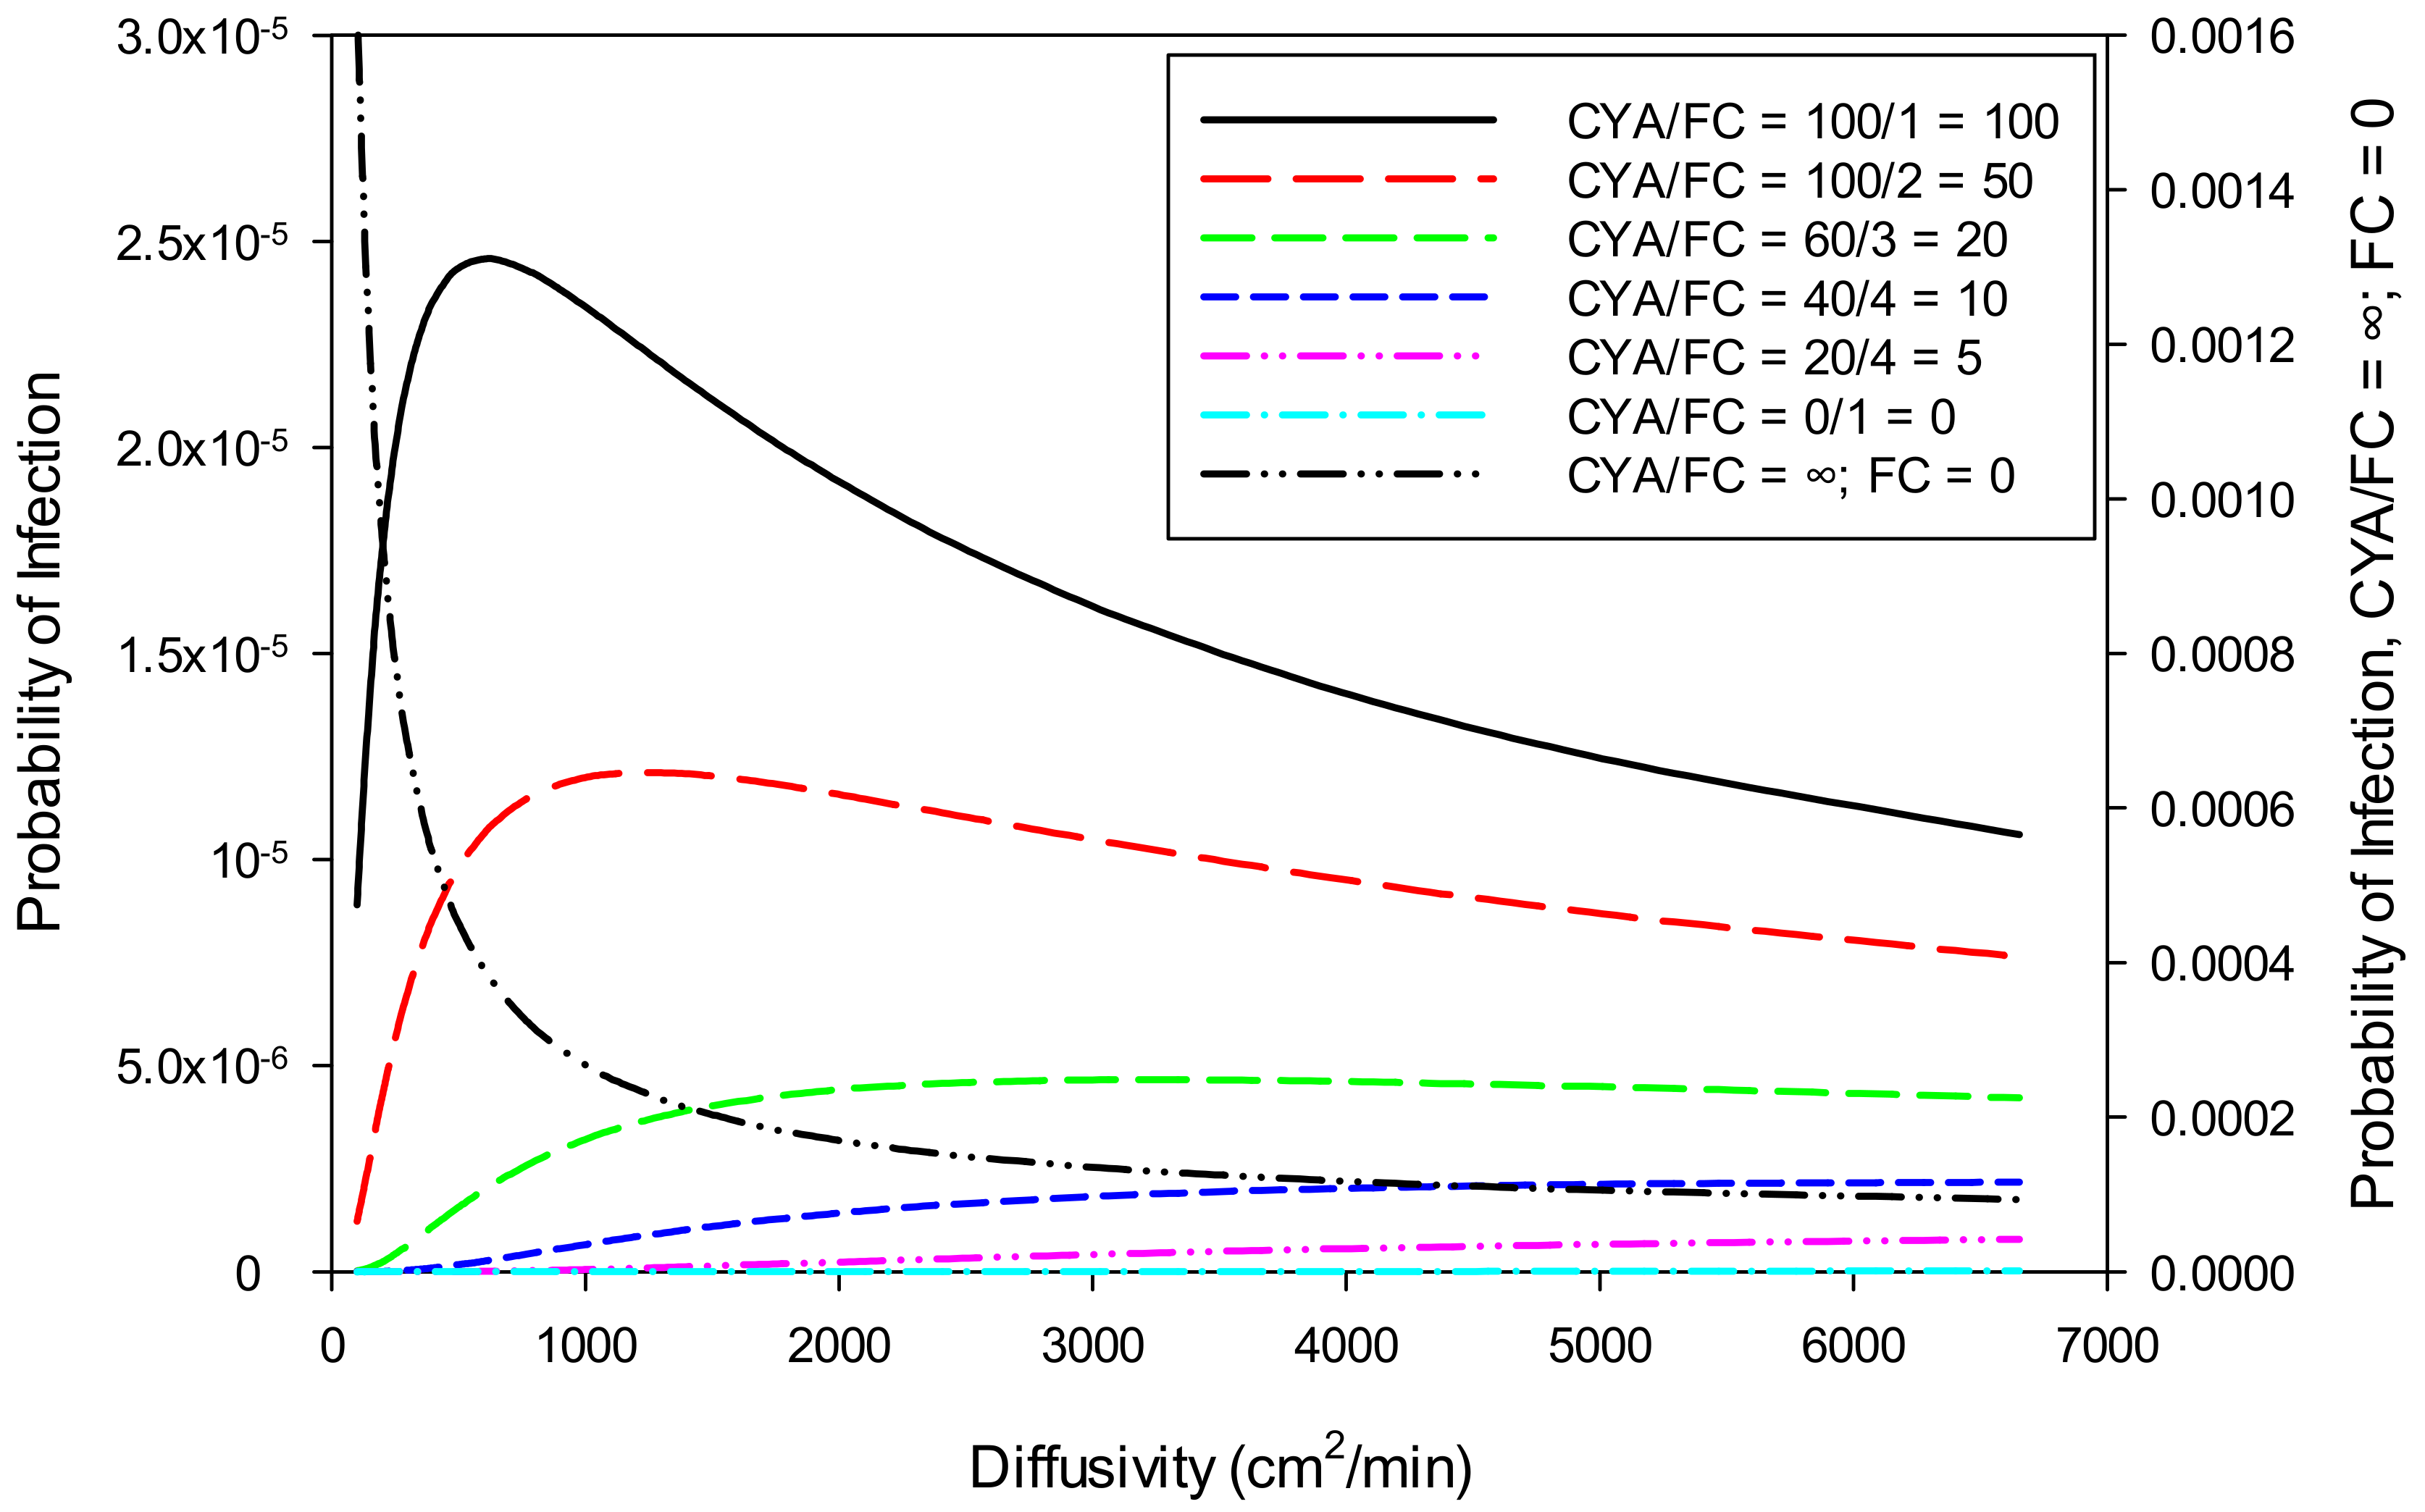
3.3.3. Effect of Diffusivity on Risk

Water velocity, diffusivity, and ingestion to source plane variations have a large effect on the probability of E. coli infection. E. coli is killed rapidly with chlorine, so more rapid transport from the source to the point of ingestion represents a significant increase in the probability of infection. However, as shown in Figure 6, at high diffusivity (>500 cm2/min), the probability of infection decreases due to the organism being diluted rapidly to low concentrations. At low diffusivity, transport from the source to the ingestor is slow enough to allow inactivation of the organism before ingestion. The larger the Ct value, the less these parameters influence the result. The model has an option to allow the diffusivity to vary to obtain the highest probability of infection. Using all the selected values, the maximum probability of infection for E. coli (0.001088%) occurs at a diffusivity of 1,377 cm2/min. For Giardia and Cryptosporidium, the maximum probability of infection occurs at very low diffusivity values (<100 cm2/min).

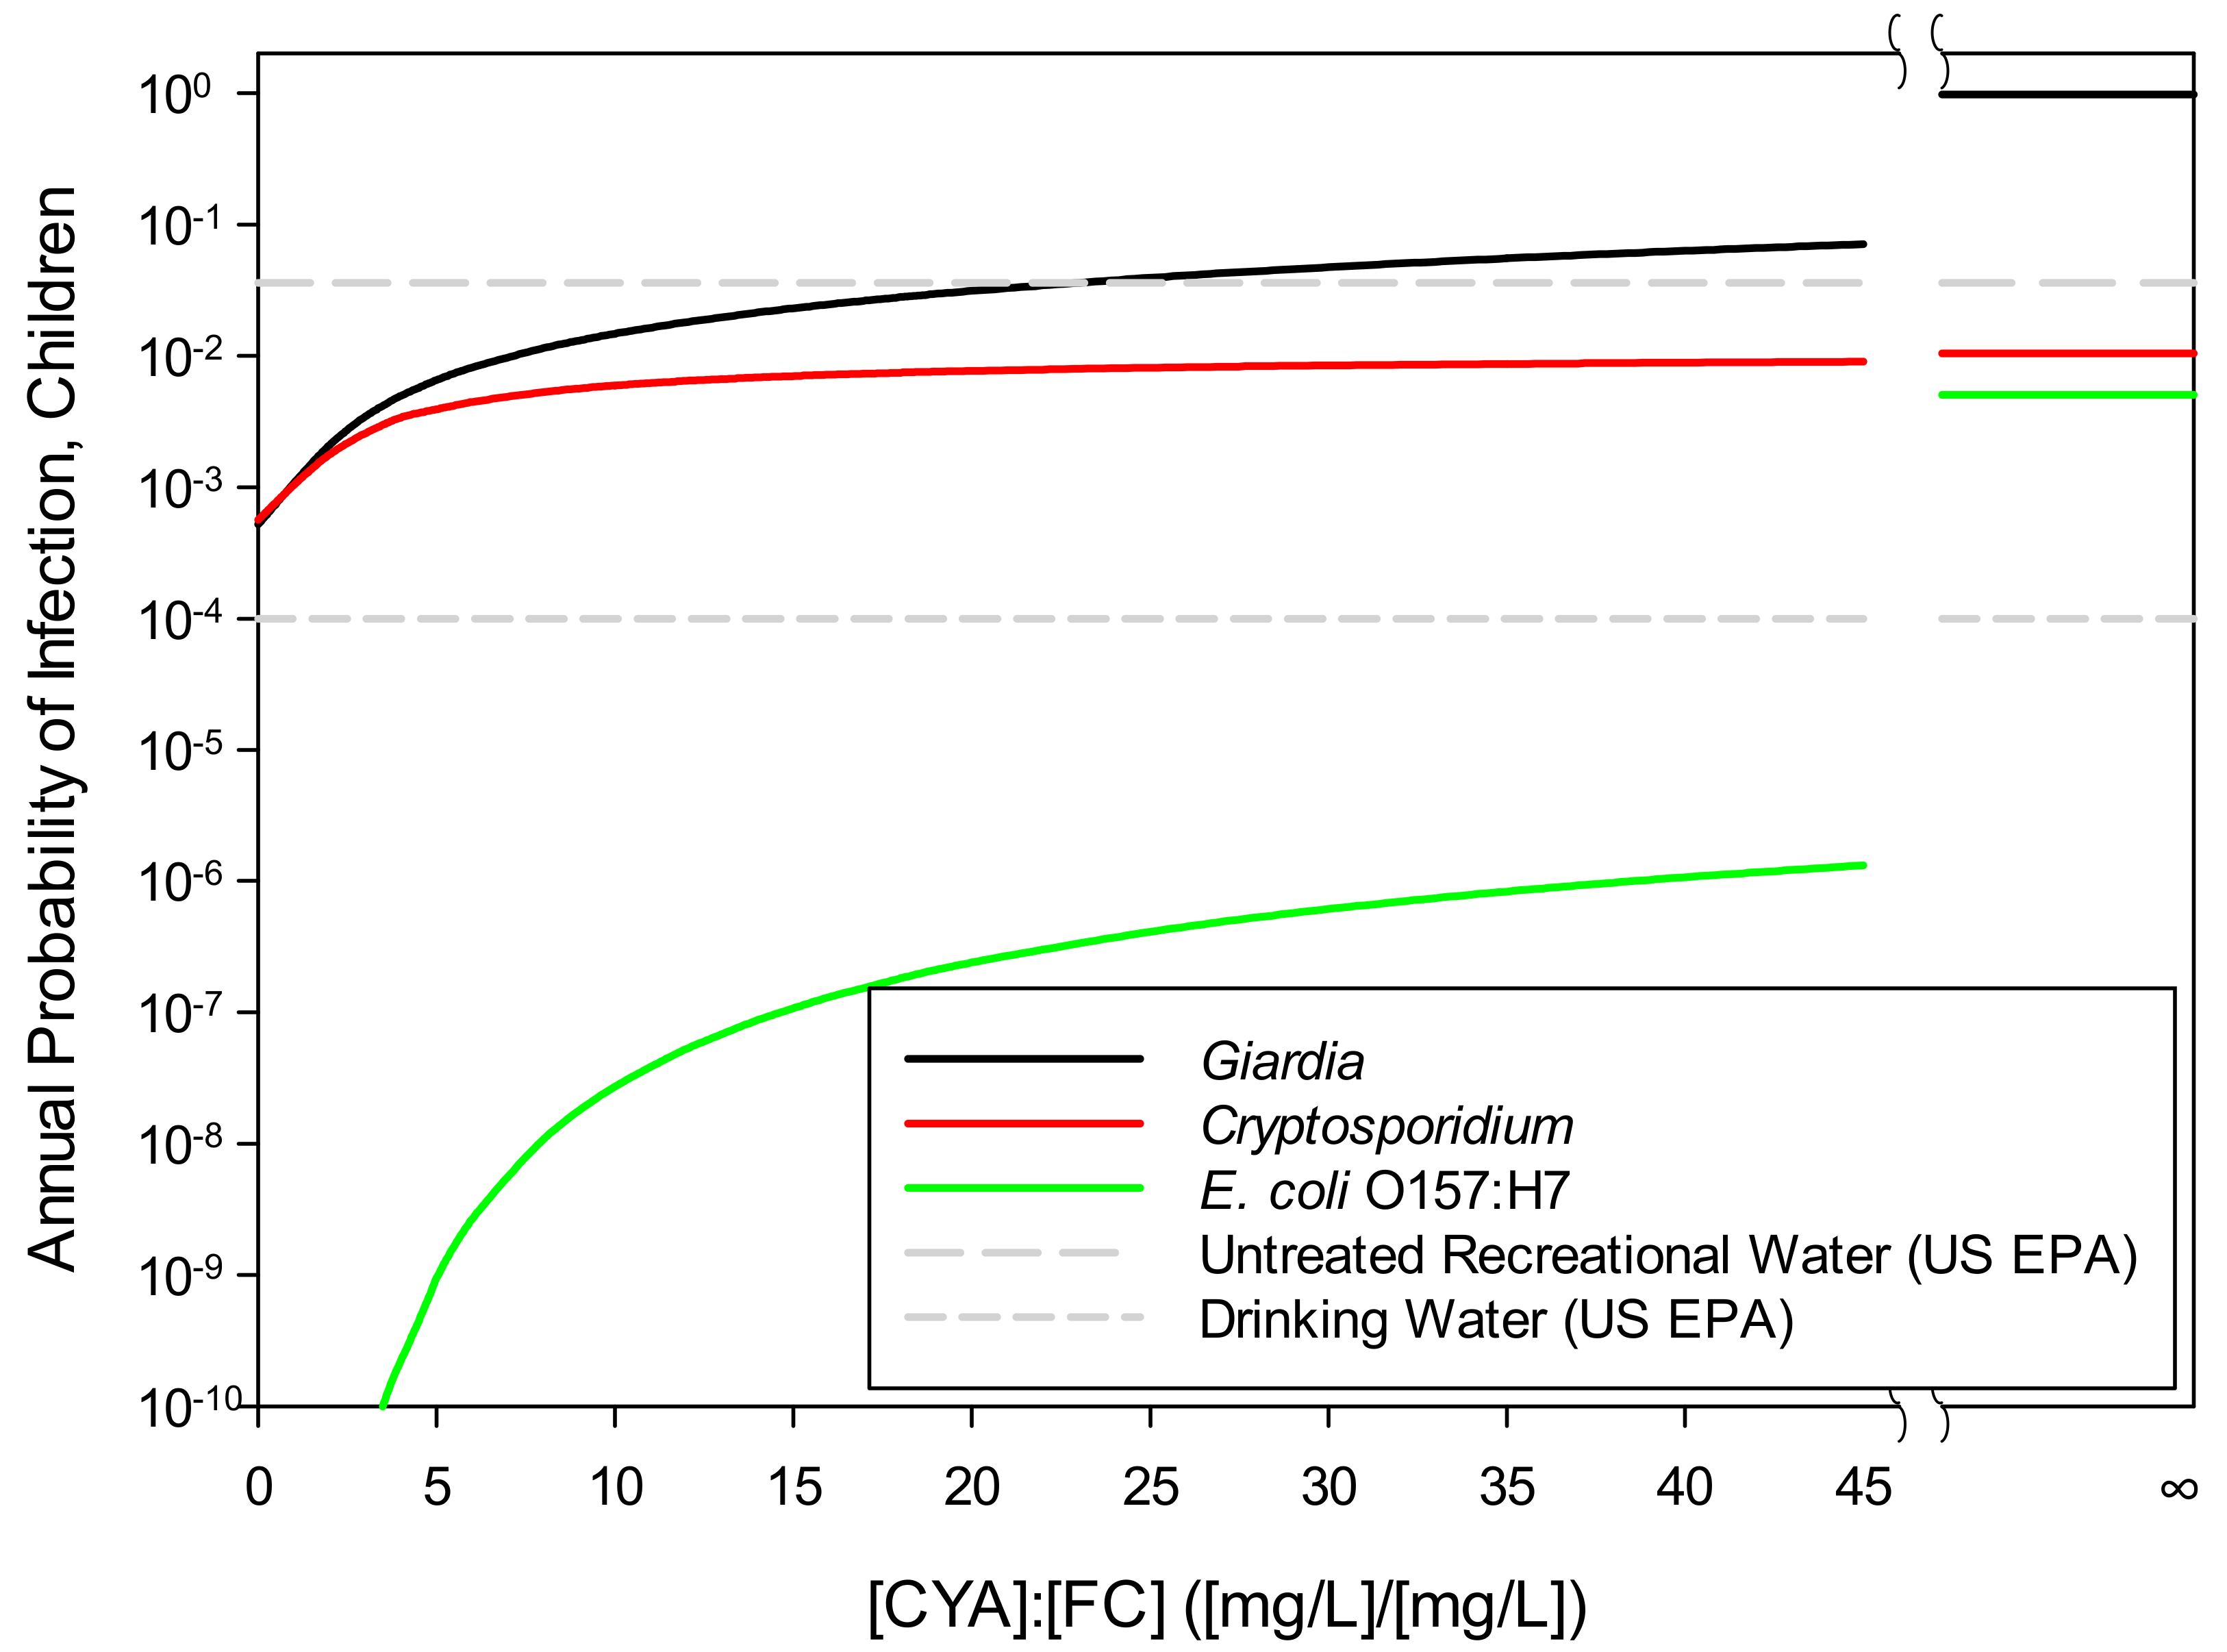
3.3.4. Probability of Infection Risk vs. CYA/FC Ratio

Table 3 demonstrates that the HOCl concentration is nearly constant with a constant CYA/FC ratio, even when CYA and FC vary individually, except for very low CYA/FC ratios. If all other input parameters are held constant so that the calculated risk of infection depends only on the HOCl concentration, then the risk of infection from any particular organism will also be nearly constant for a given CYA/FC ratio, even when CYA and FC vary individually. Therefore, a graph of infection risk versus the CYA/FC ratio should give nearly the same curve for all values of FC and CYA, except at very low CYA/FC ratios.
Figure 7 illustrates the effect of the CYA/FC ratio on the annual probability of infection, which is the major focus of this paper, for the three pathogens of interest. These results were based on the selected values listed in Table 4 and Table 5, except that CYA was varied to provide a range of CYA/FC ratios. In Figure 7, FC was held at 2 mg/L.
For all three pathogens, the infection risk increases as the CYA/FC ratio increases and the slopes of the curves decrease as the CYA/FC ratio increases. The curve for E. coli O157:H7 has the steepest slope at all CYA/FC ratios, showing that E. coli 0157:H7 is more sensitive to the concentration of HOCl than the other two pathogens. In contrast, Cryptosporidium has the smallest slope of all CYA/FC ratios, showing that Cryptosporidium is the least sensitive to the HOCl concentration.
The data points in Figure 7 where CYA/FC = ∞ represent the annual risk where no free chlorine is present. The horizontal line in Figure 7 at 36/1000 is the acceptable per-season infection risk set by the U.S. EPA for untreated recreational waters, such as beaches [67]. The line at 1/10,000 is the acceptable infection risk set by the U.S. EPA for drinking water [66].
Table 7 shows the probability of infection (1.0 = 100%) among children in terms of per-visit risk and annual risk. The FC concentration of 0 has a risk limited by the balance of natural die-off with the shedding rate.

3.3.5. Model Validation

The measurement of total coliform, Giardia, and Cryptosporidium concentrations in 60 water samples taken from the central area of 35 swimming pools in Beijing, China, during evening peak swimmer numbers allowed a comparison of the model predictions to field measurements. Note that oocysts/cysts were enumerated without regard to infectivity. FC was 0.6 ± 0.3 mg/L. and the pH was 7.2 ± 0.2 [68]. The model used the mean values of FC and pH as input, and CYA was assumed to be zero. A comparison of the concentration measurements with the model is shown in Table 8.
Field observations of total coliform concentrations were compared against model results for E. coli, assuming 100% prevalence. The well-mixed model, where instant distribution of organisms occurs, produced microorganism concentrations similar to that measured in swimming pools. However, when diffusion of the organisms is taken into account, the values are much lower. Because coliforms are killed with chlorine more readily than Giardia and Cryptosporidium, the effects of diffusivity are much greater.
The model results for Giardia gave a range of pathogen concentrations of 0.023 to 1.9 cysts/10L, depending on the distance from the infected bather. This range contains the mean from the swimming pools of 0.27 cysts/10L.
However, the model results for Cryptosporidium were lower than found in the Chinese study. The well-mixed concentration of 0.067 oocysts/10 L was lower than, but within a factor of 5 of, the mean from the swimming pools of 0.30. The model would match the swimming pools’ mean if the percent of infected bathers with Cryptosporidium in Beijing, China was 1.79% rather than the 0.4% used in the model for the U.S.

4. Discussion

4.1. Previous Studies

Previous per-visit infection risk estimates for Cryptosporidium [38] are 0.5 to 14 times higher than estimates in this study depending on the CYA/FC level. This may be because the Suppes study used Cryptosporidium concentrations from Schets [36] to estimate infection probability. In the Schets study, Cryptosporidium oocysts/volume was determined by sampling filter backwash water and “the learner pool was probably contaminated” with Cryptosporidium prior to sampling. Since filtration concentrates pool water contaminants, backwash water would have more Cryptosporidium oocysts than the same volume of swimming pool water.

4.2. Use of CYA/FC Ratio

The HOCl concentration is a more accurate predictor of disinfection rate, but pool operators and regulators are generally not prepared to calculate HOCl concentration from pH, FC, and CYA concentrations. A surrogate for HOCl is to specify an upper limit to the CYA/FC ratio instead of specifying independent limits for FC and CYA when CYA is present. The model indicates that reductions in infection risk are possible by reducing the allowed CYA/FC ratio. However, the reductions in infection risk need to be balanced with the practical operation of public pools. Restricting the ratio to too low of a value will effectively eliminate the use of chlorinated isocyanurates from public pools and result in greater chlorine consumption. Furthermore, if the ratio is too low, operators may have difficulty maintaining a chlorine residual.
The current MAHC (3rd Edition) allows up to 90 mg/L CYA with as low as 2 mg/L FC in normal risk aquatic venues. resulting in a de facto ratio of 45:1 CYA:FC. Swimmers using pools with a CYA/FC ratio of 45 are approximately two and five times as likely to become infected with Giardia and E. coli O157:H7, respectively, as swimmers using pools with a CYA/FC ratio of 20 (Table 7). The annual infection risk for E. coli O157:H7 with a CYA/FC ratio of 45 is already very low (<0.001%), so the 5-fold difference in infection risk between ratios of 45 and 20 is an insignificant absolute reduction in infection risk. Although the absolute risk is low for E. coli O157:H7, if a swimmer were to become infected with any of the three pathogens analyzed in this study, E. coli O157:H7 presents the most danger. E. coli O157:H7 has a greater ability to cause chronic sequelae and mortality compared to Giardia and Cryptosporidium. The burden of disease (DALY) for E. coli O157:H7 is about 25 times that of Giardia and Cryptosporidium. The higher burden of an E. coli O157:H7 infection on human health, therefore, should be considered when interpreting the low absolute risk. If a single swimmer becomes infected with E. coli O157:H7 from swimming in a pool, they could die or be disabled for the remainder of their life.

4.3. Risk Assessment

Given the sources of model error described in the Results section, it was not possible to develop a model that provides accurate estimates of absolute risk. However, the modeling approach used herein is believed to provide meaningful estimates of relative risk.
The 98% risk of Giardia infection, 1% risk of Cryptosporidium infection, and 0.5% risk of E. coli O157:H7 infection in the absence of chlorine emphasize the importance of maintaining a chlorine residual. The high rate of Giardia infection is not realistic but results from the assumptions used in this model: concentration of Giardia in feces, percent of population infected with Giardia, every visit to a pool with no chlorine and constant 24 h/day 7 day/week high bather load, and no filtration of cysts.
The effective risk for E. coli ( 4.5 × 10 4 ) is significantly reduced by even small amounts of chlorine. Note that an infection may not result in symptoms, as there are asymptomatic carriers. Cryptosporidium is only mildly chlorine susceptible. But its risk is generally lower than Giardia due to the significantly lower Cryptosporidium pathogen fecal concentration and percent infected values used in this model. There are limited data available that provide pathogen concentrations in feces, and even with the limited data available, the sensitivity analysis shows the differences in risk due to the shedding rate uncertainty are larger than the differences in risk between Giardia and Cryptosporidium. The discrepancy between risk calculations in this study and cryptosporidiosis outbreak statistics may be due to the limited data available for model calculations or due to any number of factors that are outside the scope of this model, such as the effect of AFRs on outbreak statistics (Supplementary Materials S20), outbreak reporting bias, and pathogen removal by means other than chlorine disinfection.

4.4. Setting a Standard

The goal of this work was to provide a sound scientific basis for recommending a limit on the concentration of CYA in public swimming pools. Meeting this objective was difficult because no guidelines for acceptable risk exist for treated recreational water. We, thus, based our recommendation for a CYA/FC ratio in swimming pools on CYA/FC ratios calculated by analyzing several risk and pool operations scenarios. The remainder of this section outlines those scenarios and describes how each was considered in the determination of a CYA/FC standard for swimming pools.
The CYA/FC ratio of 45:1 was considered a starting point because this ratio corresponds to the highest CYA and lowest FC concentrations suggested in the current version of the MAHC. However, arguments for maintaining the current MAHC 45:1 ratio are based on the absence of documented cases where this or higher ratios have resulted in a demonstrated health hazard, such as the inability to adequately control pathogen concentrations in pool water. CYA is rarely measured during an outbreak, so there are no published data to confirm or deny that CYA has been a contributing factor in outbreaks or that lower ratios would prevent future outbreaks.
The maximum concentration of CYA recommended by the MAHC and maximum concentration of FC required by the U.S. EPA were considered in establishing a CYA/FC ratio. The FC concentration should be increased as the CYA concentration increases. Thus, as the CYA concentration nears the current MAHC limit of 90 mg/L, the FC concentration should also increase to the maximum allowed, which is 4 mg/L according to the U.S. EPA. This would result in a CYA/FC ratio of 22.5 (90/4). Based on this argument, 22.5 would be consistent with these limits. However, a ratio of 22.5 would be more difficult to administer than a rounded value. Furthermore, this argument is not based on the model risk calculations but rather is a logical argument based on current limits from EPA and the MAHC.
The lowest amount of CYA needed to achieve chlorine stability was considered. Arguments for the prohibition of CYA in indoor pools and using as little CYA as possible in outdoors pools assume that it is prudent to reduce risk wherever practical. It is certainly practical to add as little CYA as needed to obtain the desired amount of chlorine stability with unstabilized sanitizers such as sodium hypochlorite or calcium hypochlorite. A CYA/FC ratio of 5–10 provides most of the stabilization with diminishing returns in additional stabilization at higher CYA/FC ratios [69]. The benefits of any incremental increase in stability should be balanced against reduced efficacy with additional CYA.
Since monochloramine is known to be a less effective (slower) disinfectant than free chlorine, the free chlorine efficacy should be maintained in pool water at least equivalent to that of monochloramine. Based on the Ct values for free chlorine and monochloramine for Giardia at pool conditions (Appendix E in U.S. EPA [70]), a limiting CYA/FC ratio of 15 would ensure the inactivation time for Giardia in a stabilized pool is at least equivalent to 1 mg/L monochloramine (Supplementary Materials S21). However, monochloramine and free chlorine have very different relative efficacies for different microorganisms, even for closely related strains. Rose [71,72] and O’Connell [73] compared the efficacy of monochloramine and free chlorine for several different bacteria. Based on their Cts at 25 °C for a 3-log reduction of twelve species/strains of bacteria, the median CYA/FC ratio that provides equivalent efficacy to monochloramine for bacteria is 99. Based on EPA’s Ct tables [70] for 3-log reduction of viruses by free chlorine or monochloramine at 25 °C, the CYA/FC ratio that provides equivalent efficacy to monochloramine for viruses is 253. The ratio for Giardia of 15 represents the ratio for the highest risk organism as seen in these model calculations and will provide better protection against bacteria and viruses.
Infection probabilities from this study were compared to the annual risk of infection for drinking water (1/10,000) and per-season risk for untreated recreational water (36/1000) acceptable to the EPA to estimate a CYA/FC ratio that corresponded to infection probabilities acceptable to the public (i.e., “acceptable risk”). It is not reasonable that swimming pools be required to obtain an annual infection risk of 1/10,000, since swimming is a voluntary activity and drinking water is not. There is no guidance in the MAHC on acceptable microbial quality in swimming pool water, although maximum acceptable microbial concentrations are provided in the WHO Guidelines for pools [74]. Swimmer exposures in treated and untreated recreational water (pool visit frequency, swim duration, and water ingestion) are more aligned than drinking water exposures. Therefore, the U.S. EPA acceptable risk of 36/1000 for untreated recreational waters is the best available comparator for establishing a CYA/FC risk-based standard for swimming pools. It is worth noting that U.S. EPA based untreated recreational water acceptable risk on indicator organisms (E. coli and Enterococci) and NGI (National Epidemiological and Environmental Assessment of Recreational Water-GI Illness) rather than a specific etiological agent or gastrointestinal illness like giardiasis. If the U.S. EPA study [67] were replicated in swimming pools, E. coli, Enterococci, and fecal coliforms would likely be below detection limits in pools with acceptable FC levels. Therefore, a different set of pathogens (such as Giardia) should be used to define risk-based water treatment standards for treated swimming pools.
Establishing a risk-based CYA/FC standard based on the Giardia curve (Figure 7) reflects a worst-case risk scenario since the probability of infection is higher for Giardia than for Cryptosporidium or E. coli O157:H7. The Giardia curve is, thus, the most appropriate for establishing a risk-based CYA/FC standard. In Figure 7, the untreated recreational water acceptable risk (36/1,000) line crosses the Giardia curve at a CYA/FC ratio of 22, suggesting a ratio of 22 is a reasonable CYA/FC standard in swimming pools. Although the sensitivity analysis showed the Giardia curve can shift up or down for different values of each input parameter, resulting in the curve crossing the untreated recreational water acceptable risk line at different CYA/FC ratios, the curve is based on the selected input parameters and represents conservative operating conditions for a public pool. A CYA/FC ratio of 22 could be considered as a standard in swimming pools despite the uncertainty associated with using point-estimates (maximum, minimum, mean, etc.) in the risk model.
If the maximum CYA/FC ratio in the MAHC would be reduced, the arguments above provide several possible values for the recommended CYA/FC ratio, namely, 5–10, 15, 22, and 22.5. The value chosen should be a round number for convenience of use by pool operators and public health officials. A maximum CYA/FC ratio of 20 is recommended as a compromise between the various suggested values and provides a modest reduction in infection risk from the currently allowed value of 45 without imposing major changes in pool operations.
Using a ratio is slightly more complicated than a simple limit on CYA but makes more sense for risk reduction. Using a round value of 20 makes implementation of a ratio easy; thus, if FC is 1 mg/L, CYA should not exceed 20 mg/L, and if FC is 2 mg/L, CYA should not exceed 40 mg/L, etc. (Table 9).
The results in Table 7 indicate that lowering the maximum allowed CYA/FC ratio from 45 to 20 would reduce the annual probability of Giardia infection by about a factor of two and E. coli infection by about a factor of five. The U.S. EPA criteria for beaches are based on an annual illness rate of 3.6 × 10⁻², which has a history of acceptance by the public. With a ratio of 20:1, the U.S. EPA criteria are met for the three pathogens included in this study.
Regulations with low FC < 1.0 mg/L, such as Deutsches Institut für Normung (DIN)19643 used in Germany and some other countries in Europe, do not use any stabilized chlorine sources or any added cyanuric acid; 19643-1 with a low of 0.3 FC with no CYA and a pH up to 7.5 has the same HOCl concentration (HOCl ~0.15 mg/L) as a pool with a CYA/FC ~3.9 and so is well within our recommendation of CYA/FC ≤ 20 (HOCl ≥ 0.02 mg/L) when CYA is present. If there are countries using 0.3 to 1.0 mg/L with CYA, then they should consider raising their required minimum FC based on the CYA level.

5. Conclusions

The risk-based model described herein supports the standard practice of swimming pool chlorination for protection of public health. The use of CYA with free chlorine in outdoor pools results in the formation of CYA-FC complexes. This provides protection of free chlorine from the effects of solar UV exposure but also alters the forms of +1-valent chlorine that are available for disinfection. Available data indicate that HOCl is the dominant disinfectant in swimming pool applications. The modeling results from this investigation indicate that the ratio of CYA/FC can be used as an inverse proxy for the concentration of the active biocidal agent (HOCl); the CFA/FC ratio can also be measured easily by pool personnel using available analytical methods.
The MAHC currently allows a CYA/FC ratio up to 45. While there are no outbreaks where documentation has shown a link to cyanuric acid use, reductions in infection risk can be achieved by reducing the allowed CYA/FC ratio. A maximum CYA/FC ratio of 20 is recommended because this simple value provides a modest reduction in infection risk from the currently allowed value of 45 without imposing major changes in pool operation and is based on consideration of CYA/FC ratios associated with relevant risk and pool operation scenarios.
Future investigations of this topic should include information pertaining to water quality that will aid in the calculation of free chlorine speciation in water, including FC concentration, pH, temperature, and CYA/FC ratio. HOCl concentration, based on equilibrium calculations, should be reported in all such studies. Additional information is also needed regarding rates of fecal sloughing and acceptable risk of infection at public swimming pools. In addition, simulations based on more comprehensive descriptions of mixing behavior in pools, accidental fecal release, and adverse effects of high HOCl concentration may be warranted.

Supplementary Materials

The following are available online at https://www.mdpi.com/2073-4441/11/6/1314/s1, Supplementary Materials to Assessing Impact CYA.pdf, Steady-State Pathogen Dose-Response Model.xlsb, Computing HOCl.pdf, Literature calculations HOCl vs kill time.xlsm, Crypto Raw Data from CDC_122116 with calcs.xlsm, ElmirFit.xlsx, Monochloramine comparison.xlsx.

Author Contributions

Conceptualization, R.A.F., E.R.B.III., T.C.K., E.M.M., S.R.P., and L.M.S.; methodology, R.A.F., E.R.B.III., T.C.K., E.M.M., S.R.P., and L.M.S.; software, R.A.F.; validation, R.A.F., T.C.K, E.M.M., S.R.P., and L.M.S.; formal analysis, R.A.F., T.C.K., E.M.M., S.R.P., and L.M.S.; investigation, R.A.F., E.R.B.III., T.C.K., E.M.M., S.R.P., and L.M.S.; writing—original draft, R.A.F., T.C.K., E.M.M., S.R.P., and L.M.S.; writing—review and editing, R.A.F., E.R.B.III., T.C.K., E.M.M., S.R.P., and L.M.S.; visualization, R.A.F., E.R.B.III., T.C.K., E.M.M., S.R.P., and L.M.S.

Funding

This research received no external funding.

Acknowledgments

The authors are grateful to the Council for the Model Aquatic Health Code and the CDC for initiating this endeavor and for the administrative assistance of Elaine Curtiss. The authors would like to thank Michael Beach and Jennifer Murphy of CDC for their technical guidance, for reviewing of this manuscript, and for sharing the raw data from the Murphy paper [9] for our analysis of the relationship between HOCl and chlorine efficacy.

Conflicts of Interest

This paper was produced by a committee formed by the U.S. Centers for Disease Control and Prevention (CDC) Council for the Model Aquatic Health Code (CMAHC) with the intent of settling a controversial issue in the swimming pool industry with cyanuric acid by putting together a team of experts of various backgrounds and employment. In order to give a balanced approach, there were people recruited from companies that produce sanitizers based on and not based on cyanuric acid. Specific potential conflicts for each author are identified below. Richard Falk–Chief Guru at WaterGuru, Inc. WaterGuru is not a manufacturer of chemicals but intends to use calcium hypochlorite as a chlorine source in a measuring and dosing system for residential swimming pools. Ernest Blatchley III–no actual or potential competing financial interests. Thomas Kuechler–currently retired, but was a Technical Service Specialist employed by Occidental Chemical Corporation which is a manufacturer of chlorinated isocyanurate (CYA-containing) chlorine chemicals. Ellen Meyer–Product Safety and Government Affairs Manager at Innovative Water Care which is a manufacturer of calcium hypochlorite chlorine chemicals. Stanley Pickens–owner of Swim-Chem Consulting Services, LLC after retiring in 2016 from Axiall Corporation, a manufacturer of calcium hypochlorite and other chlorine-based chemicals. Laura Suppes–no actual or potential competing financial interests.

References

  1. CDC. Model Aquatic Health Code, 3rd Edition. Available online: https://www.cdc.gov/mahc/index.html (accessed on 23 June 2019).
  2. O’Brien, J.E.; Morris, J.C.; Butler, J.N. Equilibria in Aqueous Solutions of Chlorinated Isocyanurate. In Chemistry of Water Supply, Treatment, and Distribution; Rubin, A.J., Ed.; Ann Arbor Science Publishers: Ann Arbor, MI, USA, 1974; pp. 333–358. ISBN 0-250-40036-7. [Google Scholar]
  3. Wahman, D.G. First acid ionization constant of the drinking water relevant chemical cyanuric acid from 5 to 35 °C. Environ. Sci. Water Res. Technol. 2018, 4, 1522–1530. [Google Scholar] [CrossRef] [PubMed]
  4. Wahman, D.G.; Alexander, M.T. A Drinking Water Relevant Water Chemistry Model for the Free Chlorine and Cyanuric Acid System from 5°C to 35°C. Environ. Eng. Sci. 2019, 36, 283–294. [Google Scholar] [CrossRef] [PubMed]
  5. Wajon, J.E.; Morris, J.C. The analysis of free chlorine in the presence of nitrogenous organic compounds. Environ. Int. 1980, 3, 41–47. [Google Scholar] [CrossRef]
  6. Andersen, J.R. A Study of the Influence of Cyanuric Acid on the Bactericidal Effectiveness of Chlorine. Am. J. Public Health 1965, 55, 1629–1637. [Google Scholar] [CrossRef] [PubMed]
  7. Fitzgerald, G.P.; DerVartanian, M.E. Factors Influencing the Effectiveness of Swimming Pool Bactericides. Appl. Microbiol. 1967, 15, 504–509. [Google Scholar] [PubMed]
  8. Golaszewski, G.; Seux, R. The Kinetics of the Action of Chloroisocyanurates on Three Bacteria: Pseudomonas aeruginosa, Streptococcus faecalis and Staphylococcus aureus. Water Res. 1994, 28, 207–217. [Google Scholar] [CrossRef]
  9. Murphy, J.L.; Arrowood, M.J.; Lu, X.; Hlavsa, M.C.; Beach, M.J.; Hill, V.R. Effect of Cyanuric Acid on the Inactivation of Cryptosporidium parvum under Hyperchlorination Conditions. Environ. Sci. Technol. 2015, 49, 7348–7355. [Google Scholar] [CrossRef]
  10. Shields, J.M.; Arrowood, M.J.; Hill, V.R.; Beach, M.J. The effect of cyanuric acid on the disinfection rate of Cryptosporidium parvum in 20-ppm free chlorine. J. Water Health 2009, 7, 109–114. [Google Scholar] [CrossRef]
  11. Yamashita, T.; Sakae, K.; Ishihara, Y.; Isomura, S.; Inoue, H. Virucidal effect of chlorinated water containing cyanuric acid. Epidemiol. Infect. 1988, 101, 631–639. [Google Scholar] [CrossRef]
  12. Saita, K.; Tachikawa, M.; Tezuka, M.; Sawamura, R. Effects of Isocyanuric Acid on the Poliovirus Inactivation with Hypochlorous Acid. Jpn. J. Toxicol. Environ. Heal. 1998, 44, 442–450. [Google Scholar] [CrossRef]
  13. Sommerfeld, M.R.; Adamson, R.P. Influence of stabilizer concentration on effectiveness of chlorine as an algicide. Appl. Environ. Microbiol. 1982, 43, 497–499. [Google Scholar] [PubMed]
  14. Engel, J.P.; Rubin, A.J.; Sproul, O.J. Inactivation of Naegleria gruberi cysts by Chlorinated Cyanurates. Appl. Environ. Microbiol. 1983, 46, 1157–1162. [Google Scholar] [PubMed]
  15. Black, A.P.; Keirn, M.A.; Smith, J.U., Jr.; Dykes, G.M.; Harlan, W.E. The Disinfection of Swimming Pool Water Part II. A Field Study of the Disinfection of Public Swimming Pools. Am. J. Public Health 1970, 60, 740–750. [Google Scholar] [CrossRef] [PubMed]
  16. Kowalski, X.; Hilton, T.B. Comparison of Chlorinated Cyanurates with Other Chlorine Disinfectants. Public Health Rep. 1966, 81, 282–288. [Google Scholar] [CrossRef] [PubMed]
  17. Le Guyader, M.; Grateloup, I. Relative Weight of Bacteriological Parameters in Swimming Pool Water Treated by Hypochlorite or Chloroisocyanurates. J. Fr. Hydrol. 1988, 19, 241–250. [Google Scholar] [CrossRef]
  18. Butterfield, C.T.; Wattie, E.; Megregian, S.; Chambers, C.W. Influence of pH and Temperature on the Survival of Coliforms and Enteric Pathogens When Exposed to Free Chlorine. Public Heal. Rep. 1943, 58, 1837–1866. [Google Scholar] [CrossRef]
  19. Hlavsa, M.C.; Roberts, V.A.; Kahler, A.M.; Hilborn, E.D.; Mecher, T.F.; Beach, M.J.; Wade, T.J.; Yoder, J.S. Outbreaks of Illness Associated with Recreational Water—United States, 2011–2012. Morb. Mortal. Wkly. Rep. 2015, 64, 668–672. [Google Scholar]
  20. Hlavsa, M.C.; Roberts, V.A.; Kahler, A.M.; Hilborn, E.D.; Wade, T.J.; Backer, L.C.; Yoder, J.S. Recreational Water–Associated Disease Outbreaks—United States, 2009–2010. Morb. Mortal. Wkly. Rep. 2014, 63, 1–5. [Google Scholar]
  21. Hlavsa, M.C.; Roberts, V.A.; Anderson, A.R.; Hill, V.R.; Kahler, A.M.; Orr, M.; Garrison, L.E.; Hicks, L.A.; Newton, A.; Hilborn, E.D.; et al. Surveillance for Waterborne Disease Outbreaks and Other Health Events Associated with Recreational Water—United States, 2007–2008 and Surveillance for Waterborne Disease Outbreaks Associated with Drinking Water—United States, 2007–2008. Morb. Mortal. Wkly. Rep. 2011, 60, 38–68. [Google Scholar]
  22. Yoder, J.S.; Hlavsa, M.C.; Craun, G.F.; Hill, V.; Yu, P.A.; Hicks, L.A.; Alexander, N.T.; Calderon, R.L.; Roy, S.L.; Beach, M.J. Surveillance for Waterborne Disease and Outbreaks Associated with Recreational Water Use and Other Aquatic Facility-Associated Health Events—United States, 2005–2006. Morb. Mortal. Wkly. Rep. Surveill. Summ. 2008, 57, 1–38. [Google Scholar]
  23. Dziuban, E.; Liang, J.; Craun, G.; Hill, V.; Yu, P.; Painter, J.; Moore, M.; Calderon, R.; Roy, S.; Beach, M. Surveillance for Waterborne Disease and Outbreaks Associated with Recreational Water—United States, 2003–2004. Morb. Mortal. Wkly. Rep. Surveill. Summ. 2006, 55, 31–65. [Google Scholar]
  24. Gould, L.H.; Demma, L.; Jones, T.F.; Hurd, S.; Vugia, D.J.; Smith, K.; Shiferaw, B.; Segler, S.; Palmer, A.; Zansky, S.; et al. Hemolytic Uremic Syndrome and Death in Persons with Escherichia coli O157:H7 Infection, Foodborne Diseases Active Surveillance Network Sites, 2000–2006. Clin. Infect. Dis. 2009, 49, 1480–1485. [Google Scholar] [CrossRef] [PubMed]
  25. CDC. National Enteric Disease Surveillance: Shiga Toxin-Producing Escherichia coli (STEC) Annual Report, 2011. Available online: https://www.cdc.gov/ncezid/dfwed/PDFs/national-stec-surv-summ-2011-508c.pdf (accessed on 23 June 2019).
  26. CDC. National Enteric Disease Surveillance: Shiga Toxin-Producing Escherichia coli (STEC) Annual Report, 2012. Available online: https://www.cdc.gov/ncezid/dfwed/PDFs/national-stec-surv-summ-2012-508c.pdf (accessed on 23 June 2019).
  27. World Health Organization. Quantitative Microbial Risk Assessment: Application for Water Safety Management, WHO Press: Geneva, Switzerland, 2016; ISBN 978 92 4 156537 0.
  28. Van Lier, A.; McDonald, S.A.; Bouwknegt, M.; Kretzschmar, M.E.; Havelaar, A.H.; Mangen, M.-J.J.; Wallinga, J.; de Melker, H.E. Disease burden of 32 infectious diseases in the Netherlands, 2007–2011. PLoS ONE 2016, 11, e0153106. [Google Scholar] [CrossRef] [PubMed]
  29. CDC. Prevalence of parasites in fecal material from chlorinated swimming pools—United States, 1999. Morb. Mortal. Wkly. Rep. 2001, 50, 410–412. [Google Scholar]
  30. Shields, J.M.; Gleim, E.R.; Beach, M.J. Prevalence of Cryptosporidium spp. and Giardia intestinalis in swimming pools, Atlanta, Georgia. Emerg. Infect. Dis. 2008, 14, 948–950. [Google Scholar] [CrossRef] [PubMed]
  31. Painter, J.E.; Gargano, J.W.; Collier, S.A.; Yoder, J.S. Giardiasis Surveillance—United States, 2011–2012. Morb. Mortal. Wkly. Rep. Surveill. Summ. 2015, 64, 15–25. [Google Scholar]
  32. Hlavsa, M.C.; Cikesh, B.L.; Roberts, V.A.; Kahler, A.M.; Vigar, M.; Hilborn, E.D.; Wade, T.J.; Roellig, D.M.; Murphy, J.L.; Xiao, L.; et al. Outbreaks Associated with Treated Recreational Water—United States, 2000–2014. Morb. Mortal. Wkly. Rep. 2018, 67, 547–551. [Google Scholar] [CrossRef] [PubMed]
  33. Ishii, S.; Sadowsky, M. Escherichia coli in the Environment: Implications for Water Quality and Human Health. Microbes Environ. 2008, 23, 101–108. [Google Scholar] [CrossRef] [Green Version]
  34. Guandalini, S.; Frye, R.E.; Tamer, M.A. Diarrhea. Available online: https://emedicine.medscape.com/article/928598-overview (accessed on 23 June 2019).
  35. Pintar, K.D.M.; Fazil, A.; Pollari, F.; Charron, D.F.; Waltner-Toews, D.; McEwen, S.A. A risk assessment model to evaluate the role of fecal contamination in recreational water on the incidence of cryptosporidiosis at the community level in Ontario. Risk Anal. 2010, 30, 49–64. [Google Scholar] [CrossRef]
  36. Schets, F.; Engels, G.; Evers, E. Cryptosporidium and Giardia in swimming pools in the Netherlands. J. Water Health 2004, 2, 191–200. [Google Scholar] [CrossRef] [Green Version]
  37. Schets, F.M.; Schijven, J.F.; de Roda Husman, A.M. Exposure assessment for swimmers in bathing waters and swimming pools. Water Res. 2011, 45, 2392–2400. [Google Scholar] [CrossRef]
  38. Suppes, L.M.; Canales, R.A.; Gerba, C.P.; Reynolds, K.A. Cryptosporidium risk from swimming pool exposures. Int. J. Hyg. Environ. Health 2016, 219, 915–919. [Google Scholar] [CrossRef] [PubMed]
  39. Cloteaux, A.; Gérardin, F.; Midoux, N. Influence of Swimming Pool Design on Hydraulic Behavior: A Numerical and Experimental Study. Engineering 2013, 5, 511–524. [Google Scholar] [CrossRef] [Green Version]
  40. Lewis, L.; Chew, J.; Woodley, I.; Colbourne, J.; Pond, K. The application of computational fluid dynamics and small-scale physical models to assess the effects of operational practices on the risk to public health within large indoor swimming pools. J. Water Health 2015, 13, 939–952. [Google Scholar] [CrossRef] [PubMed] [Green Version]
  41. Karch, H.; Rüssmann, H.; Schmidt, H.; Schwarzkopf, A.; Hessemann, J. Long-Term Shedding and Clonal Turnover of Enterohemorrhagic Escherichia coli O157 in Diarrheal Diseases. J. Clin. Microbiol. 1995, 33, 1602–1605. [Google Scholar] [PubMed]
  42. Danciger, M.; Lopez, M. Numbers of Giardia in the Feces of Infected Children. Am. J. Trop. Med. Hyg. 1975, 24, 237–242. [Google Scholar] [CrossRef] [PubMed]
  43. Chappell, C.L.; Okhuysen, P.C.; Sterling, C.R.; DuPont, H.L. Cryptosporidium parvum: Intensity of infection and oocyst excretion patterns in healthy volunteers. J. Infect. Dis. 1996, 173, 232–236. [Google Scholar] [CrossRef] [PubMed]
  44. Rendtorff, R.C.; Kashgarian, M. Stool patterns of healthy adult males. Dis. Colon Rectum 1967, 10, 222–228. [Google Scholar] [CrossRef] [PubMed]
  45. Keuten, M.; Delft University of Technology, Delft, The Netherlands. Personal communication, 2017.
  46. Keuten, M.G.A.; Schets, F.M.; Schijven, J.F.; Verberk, J.Q.J.C.; van Dijk, J.C. Definition and quantification of initial anthropogenic pollutant release in swimming pools. Water Res. 2012, 46, 3682–3692. [Google Scholar] [CrossRef]
  47. Gerba, C.P. Assessment of enteric pathogen shedding by bathers during recreational activity and its impact on water quality. Quant. Microbiol. 2000, 2, 55–68. [Google Scholar] [CrossRef]
  48. Elmir, S.M.; Wright, M.E.; Abdelzaher, A.; Solo-Gabriele, H.M.; Fleming, L.E.; Miller, G.; Rybolowik, M.; Shih, M.-T.P.; Pillai, S.P.; Cooper, J.A.; et al. Quantitative evaluation of bacteria released by bathers in a marine water. Water Res. 2007, 41, 3–10. [Google Scholar] [CrossRef] [Green Version]
  49. Zhao, T.; Doyle, M.P.; Zhao, P.; Blake, P.; Wu, F.-M. Chlorine inactivation of Escherichia coli O157:H7 in water. J. Food Prot. 2001, 64, 1607–1609. [Google Scholar] [CrossRef]
  50. U.S. EPA. LT1ESWTR Disinfection Profiling and Benchmarking Technical Guidance Manual; National Service Center for Environmental Publications: Washington, DC, USA, 2003.
  51. Shields, J.M.; Hill, V.R.; Arrowood, M.J.; Beach, M.J. Inactivation of Cryptosporidium parvum under chlorinated recreational water conditions. J. Water Health 2008, 6, 513–520. [Google Scholar] [CrossRef] [Green Version]
  52. Karim, M.R.; Manshadi, F.D.; Karpiscak, M.M.; Gerba, C.P. The persistence and removal of enteric pathogens in constructed wetlands. Water Res. 2004, 38, 1831–1837. [Google Scholar] [CrossRef] [PubMed]
  53. Peng, X.; Murphy, T.; Holden, N.M. Evaluation of the effect of temperature on the die-off rate for Cryptosporidium parvum oocysts in water, soils, and feces. Appl. Environ. Microbiol. 2008, 74, 7101–7107. [Google Scholar] [CrossRef]
  54. Socolofsky, S.A.; Jirka, G.H. Environmental Fluid Mechanics Part I: Mass Transfer and Diffusion; Engineering Lectures. Available online: http://www.ifh.uni-karlsruhe.de/lehre/envflu_I/Downloads/course_script/ed2/script_ed2.pdf (accessed on 23 June 2019).
  55. Majowicz, S.E.; Scallan, E.; Jones-Bitton, A.; Sargeant, J.M.; Stapleton, J.; Angulo, F.J.; Yeung, D.H.; Kirk, M.D. Global incidence of human Shiga toxin-producing Escherichia coli infections and deaths: A systematic review and knowledge synthesis. Foodborne Pathog. Dis. 2014, 11, 447–455. [Google Scholar] [CrossRef] [PubMed]
  56. Hellard, M.E.; Sinclair, M.I.; Hogg, G.G.; Fairley, C.K. Prevalence of enteric pathogens among community based asymptomatic individuals. J. Gastroenterol. Hepatol. 2000, 15, 290–293. [Google Scholar] [CrossRef] [PubMed]
  57. Haas, C.N.; Rose, J.B.; Gerba, C.; Regli, S. Risk Assessment of Radon in Drinking Water; National Academies Press: Washington, DC, USA, 1993; Volume 13, ISBN 978-0-309-06292-3. [Google Scholar]
  58. Nilsen, V.; Wyller, J. QMRA for Drinking Water: 1. Revisiting the Mathematical Structure of Single-Hit Dose-Response Models. Risk Anal. 2016, 36, 145–162. [Google Scholar] [CrossRef]
  59. Rose, J.B.; Gerba, C.P. Use of Risk Assessment for Development of Microbial Standards. Water Sci. Technol. 1991, 24, 29–34. [Google Scholar] [CrossRef]
  60. Cornick, N.A.; Helgerson, A.F. Transmission and Infectious Dose of Escherichia coli O157:H7 in Swine. Appl. Environ. Microbiol. 2004, 70, 5331–5335. [Google Scholar] [CrossRef]
  61. Rendtorff, R.C. The Experimental Transmission of Human Intestinal Protozoan Parasites II. Giardia Lamblia Cysts Given in Capsules. Am. J. Epidemiol. 1954, 59, 209–222. [Google Scholar] [CrossRef]
  62. Messner, M.J.; Chappell, C.L.; Okhuysen, P.C. Risk Assessment for Cryptosporidium: A Hierarchical Bayesian Analysis of Human Dose Response Data. Water Res. 2001, 35, 3934–3940. [Google Scholar] [CrossRef]
  63. Behnke, S.; Parker, A.E.; Woodall, D.; Camper, A.K. Comparing the chlorine disinfection of detached biofilm clusters with those of sessile biofilms and planktonic cells in single- and dual-species cultures. Appl. Environ. Microbiol. 2011, 77, 7176–7184. [Google Scholar] [CrossRef] [PubMed]
  64. Fitzgerald, G.P.; DerVartanian, M.E. Pseudomonas aeruginosa for the evaluation of swimming pool chlorination and algicides. Appl. Microbiol. 1969, 17, 415–421. [Google Scholar] [PubMed]
  65. O’Brien, J.E. Hydrolytic and Ionization Equilibria of Chlorinated Isocyanurate in Water; Harvard University: Cambridge, MA, USA, 1972. [Google Scholar]
  66. U.S. EPA. Use of Micobial Risk Assessment in Setting EPA Drinking Water Standards; National Service Center for Environmental Publications: Washington, DC, USA, 1992.
  67. U.S. EPA. Recreational Water Quality Criteria; National Service Center for Environmental Publications: Washington, DC, USA, 2012.
  68. Xiao, S.; Yin, P.; Zhang, Y.; Hu, S. Occurrence of cryptosporidium and giardia and the relationship between protozoa and water quality indicators in swimming pools. Korean J. Parasitol. 2017, 55, 129–136. [Google Scholar] [CrossRef] [PubMed]
  69. Canelli, E. Chemical, Bacteriological, and Toxicological Properties of Cyanuric Acid and Chlorinated Isocyanurates as Applied to Swimming Pool Disinfection. Am. J. Public Heal. 1974, 64, 155–162. [Google Scholar] [CrossRef]
  70. U.S. EPA. Guidance Manual for Compliance with the Filtration and Disinfection Requirements for Public Water Systems Using Surface Water Sources; National Service Center for Environmental Publications: Washington, DC, USA, 1991.
  71. Rose, L.J.; Rice, E.W.; Jensen, B.; Murga, R.; Peterson, A.; Donlan, R.M.; Arduino, M.J. Chlorine inactivation of bacterial bioterrorism agents. Appl. Environ. Microbiol. 2005, 71, 566–568. [Google Scholar] [CrossRef]
  72. Rose, L.J.; Rice, E.W.; Hodges, L.; Peterson, A.; Arduino, M.J. Monochloramine inactivation of bacterial select agents. Appl. Environ. Microbiol. 2007, 73, 3437–3439. [Google Scholar] [CrossRef]
  73. O’Connell, H.A.; Rose, L.J.; Shams, A.; Bradley, M.; Arduino, M.J.; Rice, E.W. Variability of Burkholderia pseudomallei strain sensitivities to chlorine disinfection. Appl. Environ. Microbiol. 2009, 75, 5405–5409. [Google Scholar] [CrossRef]
  74. World Health Organization. Guidelines for Safe Recreational Water Environments—Volume 2: Swimming Pools and Similar Environments; WHO Press: Geneva, Switzerland, 2006; ISBN 92 4 154680 8. [Google Scholar]
Figure 1. Input variables (rectangles) and calculated results (ovals) for each component of the steady-state turbulent diffusion model of pathogen risk.
Water 11 01314 g001
Figure 2. (a) Impact of cyanuric acid (CYA) on HOCl concentration for various concentrations of free chlorine (FC): The curves were calculated using a pH of 7.5. Ionic strength was not taken into account, as it would have little impact on the shapes of the curves. (b) Impact of pH on HOCl concentration for various concentrations of CYA: The curves were calculated using 1.0 mg/L of FC.
Water 11 01314 g002
Figure 3. Relationship between log reduction, ln(P/P0), and Ct for Streptococcus faecalis, where C represents the concentration of (a) free chlorine or (b) hypochlorous acid: The HOCl concentrations were calculated using values for free chlorine, pH, CYA, and temperature from the source data references.
Water 11 01314 g003
Figure 4. Relationship between log reduction ln(P/P0) and Ct for Cryptosporidium parvum, where C represents the concentration of (a) free chlorine or (b) hypochlorous acid: The HOCl concentrations were calculated using values for free chlorine, pH, CYA, and temperature from Murphy [9].
Water 11 01314 g004
Figure 5. Sensitivity analysis: The sensitivity is shown by the log of the maximum probability divided by the minimum probability for each parameter.
Water 11 01314 g005
Figure 6. Sensitivity of probability of infection from E. coli to diffusivity at various ratios of CYA/FC.
Water 11 01314 g006
Figure 7. Annual probability of infection with Giardia, E. coli O157:H7, or Cryptosporidium parvum as a function of CYA/FC: For calculation purposes, FC was 2 mg/L for all points except CYA/FC = ∞, for which FC was set at zero. The U.S. EPA limits for drinking water (10−4, U.S. EPA [66]) and beaches (36/1,000, U.S. EPA [67]) are included for reference.
Water 11 01314 g007
Table 1. Bather shedding pathogen concentrations.
Pathogen (Units)LowMeanHigh
Escherichia coli O157 a (CFU/g) 1.0 × 10 6 2.0 × 10 7 4.0 × 10 8
Giardiab (cysts/g) 3.8 × 10 4 4.1 × 10 5 1.3 × 10 6
Cryptosporidium parvumc (oocysts/g) 2.6 × 10 2 4.5 × 10 3 8.1 × 10 4
a The low and high concentrations are from 7 long-term shedders (asymptomatic at end of period); the mean is from the geometric mean. b The average is from formed stools in each group of 5 low, 5 mixed (used as the mean), and 5 high excretors. c The lowest, geometric mean, and highest concentrations are from 7 asymptomatic but infected individuals; assumes one 123.6 gram stool per person [44].
Table 2. Initial fecal shedding rate (mg/bather/min).
Model SourceAge GroupLowMeanHigh
[46]All a0.040.703.5
[47]Children b0.6721.1 c667
[47]Adult0.00670.21 c6.67
a Values for 25 adults aged 20–84 in indoor pool C. Similar results were seen in the referenced study for the only child (10 years old) in outdoor pool D. b Families with small children 18 months to 9 years of age. c Geometric mean of the low and high rates.
Table 3. HOCl at constant CYA/FC ratio.
CYA (mg/L)FC (mg/L Cl2)HOCl (mg/L Cl2)
201.00.01962
301.50.01991
402.00.02006
502.50.02015
603.00.02021
703.50.02025
804.00.02029
904.50.02031
Table 4. Selected, minimum, and maximum values used in the sensitivity analysis for all three pathogens.
Parameter (Units)SelectedMinMax
FC (mg/L)2110
CYA (mg/L)900100
pH7.57.27.8
Temp (°C)252040
TDS (mg/L)10005005000
Sec. disinfect. per pass (%/pass)99.99099.9
Sec. disinfect. turnover time (min)030360
Water replacement rate (L/bather)0030
Diffusivity xy plane (cm2/min)5001005000
Diffusivity z vertical % of xy (%)10020100
Velocity in x direction (cm/min)0010,000
Depth of pool (cm)91.4430.48250
Distance between bathers (cm)118.0580240
Ingestion to source plane (cm)45.72090
x distance to source (cm)45.723090
Ingestion rate (ml/hr)24.26.350
Exposure time (hrs/visit)1.91.25
Exposure frequency (visits/year)72.972.6120
Fecal introduction rate (g/bather/min)0.00070.000040.666667
Table 5. Selected, minimum, and maximum values used in the sensitivity analysis for E. coli, Giardia, and Cryptosporidium a.
Parameter (Inits)PathogenSelectedMinMax
% infected
(%)
E. coli
Giardia
Cryptosporidium
0.0935
4.4
0.4
0
0
0
10
10
10
Inactivation Rate
α (/ppm min)
E. coli
Giardia
Cryptosporidium
1.36 × 10 2
2.78 × 10 1
9.25 × 10 4
1.41 × 10 1
1.31 × 10 1
4.62 × 10 4
4.76 × 10 2
5.56 × 10 1
1.85 × 10 3
Die-off Rate Constant,
(/min)
E. coli
Giardia
Cryptosporidium
4.09 × 10 4
4.64 × 10 5
4.75 × 10 5
0
0
0
8.19 × 10 4
9.27 × 10 5
2.56 × 10 4
Dose response
(/Infective unit)
E. coli [60]
Giardia [61]
Cryptosporidium [62]
2.18 × 10 4
1.99 × 10 2
5.72 × 10 2
1.20 × 10 4
1.26 × 10 2
2.46 × 10 2
5.99 × 10 4
2.92 × 10 2
2.65
a For pathogen fecal concentrations, see Table 1.
Table 6. Initial pathogen shedding rate.
Pathogen (Units)LowMeanHigh
Escherichia coli O157 (CFU/bather/min) 4.0 × 10 1 1.4 × 10 4 1.4 × 10 6
Giardia (cysts/bather/min) 2.5 × 10 0 2.3 × 10 2 4.2 × 10 3
Cryptosporidium parvum (oocysts/bather/min) 1.0 × 10 2 3.2 × 10 0 2.8 × 10 2
Table 7. Probability of infection.
Pathogen/Per-Visit Risk aFCCYA/FC RatioFC, no CYA
0 mg/L90/2 = 4540/2 = 2020/2 = 1010/2 = 52 mg/L
Escherichia coli O157 4.5 × 10 4 8.3 × 10 6 1.6 × 10 6 1.8 × 10 7 6.5 × 10 9 6.7 × 10 19
Giardia 5.2 × 10 2 1.3 × 10 3 7.2 × 10 4 4.7 × 10 4 3.3 × 10 4 9.7 × 10 5
Cryptosporidium parvum 1.6 × 10 4 1.4 × 10 4 1.2 × 10 4 1.0 × 10 4 7.2 × 10 5 2.5 × 10 5
Pathogen/Annual Risk b0 mg/L90/2 = 4540/2 = 2020/2 = 1010/2 = 52 mg/L
Escherichia coli O157 5.0 × 10 3 1.3 × 10 6 2.4 × 10 7 2.7 × 10 8 9.5 × 10 10 < 10 19
Giardia 9.8 × 10 1 7.1 × 10 2 3.1 × 10 2 1.5 × 10 2 6.6 × 10 3 5.2 × 10 4
Cryptosporidium parvum 1.0 × 10 2 9.0 × 10 3 7.7 × 10 3 6.0 × 10 3 3.9 × 10 3 5.6 × 10 4
a Risk with ingestor near shedder. b Risk averaged over varying distance from shedder to ingestor.
Table 8. Model comparison to swimming pools.
MicroorganismUnitsSwimming Pools [68]Model a
% pos.Mean ± SDNear Bather bIn-Between cWell-Mixed
Total coliforms dMPN/L36.72.7 ± 5.7 1.3 × 10 8   e 1.6 × 10 12 0.057
Giardiacysts/10L15.00.27 ± 0.711.90.0230.28
Cryptosporidiumoocysts/10L16.70.30 ± 0.790.140.0580.067
a Model used the mean FC of 0.6 and pH of 7.2 from Xiao [68]. b Ingestors (sampling) next to shedders. c In the middle of the grid, at an x and y distance of 59.03 cm (1.94 feet) between shedding bathers for total coliforms (E. coli in model), at 281.39 cm (9.2 feet) for Giardia and at 933.27 cm (30.6 feet) for Cryptosporidium. d Model for total coliforms used 100% bathers infected since all bathers are shedding coliforms. e Very sensitive to diffusivity (0.0026 MPN/L at 5000 cm2/min) and distance (0.30 MPN/L at 15 cm at shedding depth).
Table 9. Required minimum free chlorine for given cyanuric acid concentration.
CYA (ppm)Min. FC (ppm)
201.0
301.5
402.0
502.5
603.0
703.5
804.0
904.5

