Temporal and Vertical Relations between Various Environmental Factors in the Largest Lake of Łęczna-Włodawa Lake District (Eastern Poland)


1
Department of Hydrobiology and Protection of Ecosystems, University of Life Sciences, 13 Akademicka St, 20-950 Lublin, Poland
2
Department of Hydrology and Climatology, Maria Curie-Skłodowska University, Aleja Kraśnicka 2 cd, 20-718 Lublin, Poland
*
Author to whom correspondence should be addressed.
Water 2019, 11(6), 1263; https://doi.org/10.3390/w11061263
Submission received: 1 June 2019
/
Revised: 12 June 2019
/
Accepted: 13 June 2019
/
Published: 17 June 2019
(This article belongs to the Section Water Quality and Contamination)
Abstract
:Due to global warming and increasing water eutrophication, understanding in-lake relationships is paramount to prevent excessive pollution and further negative changes in lakes. The physico-chemical and biological parameters, as well as nutrient variabilities, both temporal and vertical (in the water column), were studied in the largest Łęczna-Włodawa lake. The study was conducted during two consecutive water years, from November 2015 to September 2017. The non-parametric Kruskal–Wallis ANOVA, test H was used to detect variability between years, and among seasons and lake depths in water temperature, electrical conductivity, pH, ORP, concentration of dissolved oxygen as well as concentration of NO3−, PO43−, TP and chlorophyll a. One-way analysis of variance (ANOVA) was used to detect any differences in Secchi depth (SD) and concentration of NH4+, NO2−, and TN. Ordination techniques: Detrended correspondence analysis (DCA), and Principal Components Analysis (PCA) were used to describe the relationships among 13 environmental variables and distribution of samples. Results showed significant differences (P < 0.05) between two years of the study for most variables except of water temperature, visibility, concentration of PO43−, TN and TP, which corresponded with highly different weather conditions in both years. All of the tested variables, except for nutrients, differed significantly among seasons. Most parameters showed fluctuation in depth, especially in summer and in winter, despite the fact that no hypolimnion or long-lasting thermocline was observed in the study period. However, variability of Chl-a was statistically significant only. The results emphasized complex and multi-directional relations between tested variables, dependent on both external (catchment) and internal (in-lake) processes.
1. Introduction
In recent decades, global warming and increasing water eutrophication have become a reason for investigation of different in-lake and catchment-lake processes [1]. A temporal and spatial heterogeneity of environmental parameters (temperature, oxygen concentration, pH, etc.) is a common feature of most aquatic ecosystems [2]. The lake surface water temperature (LSWT), shaped mostly by weather conditions, significantly influences the entire lake ecosystem [3]. Hence, understanding thermal stratification is important for management of water resources, since the thermocline controls a distribution of the heat, dissolved substances, and nutrients in the water column [4]. A relation of seasonal variability of the water temperature and dissolved oxygen (DO) in various water bodies has been established [5,6]. On the other hand, seasonal changes of the environmental variables affect a seasonal variation of phytoplankton communities [7]. Especially DO concentration is known to be correlated with the phytoplankton standing stock, often expressed as a chlorophyll a (Chl-a) concentration [8,9]. It reflects progression of eutrophication processes, which, in conditions of the Łęczna-Włodawa lakes catchments, significantly depends on the intensity of human pressure [10]. Planktonic photosynthesis may increase DO concentration, especially in the surface water layer [11]. However, in shallow lakes, DO concentration is often forced by wind [12]. Nutrient concentration and load from the catchment are also of great importance, especially in shallow, highly fluctuating lakes [13]. Furthermore, DO and Chl-a are the two parameters associated with poor water quality [14]. A seasonal thermal stratification in deep lakes brings about vertical variation in phytoplankton composition [15,16]. In shallow water bodies, stratification is rarely observed [17], thus constant mixing of water column favour nutrient release from sediments [18]. Physico-chemical variables of lake water are the key components of water quality criteria for various uses, thus providing good indications of stressors in lake ecosystems [19]. The dominant processes that influence a lake’s ecology may be distinguished by analysing spatial and temporal variability of water quality parameters; biologically, chemically or physically [20].
The aim of this study was to investigate the variability in the water quality of the largest of the Łęczna-Włodawa lakes, as well as its corresponding driving factors and relations of environmental factors. Intra- and inter-annual parameter and nutrient variation were tested. The paper presents not only a temporal variation of the selected parameters, but also their vertical variation in the water column. In terms of continuous deterioration of the lake water quality, which became a worldwide problem [21] the knowledge is crucial to prevent further degradation of lake water quality. Shallow lakes are highly dynamic systems, thus studies on the relationship between physic-chemical and biological parameters are of paramount importance. We hypothesised that (i) parameters of eutrophication may show high seasonality and a paramount shift in the warm season, and (ii) despite a shallow lake basin, significant differences in some physico-chemical parameters in terms of the lake depths may occur.
2. Study Area
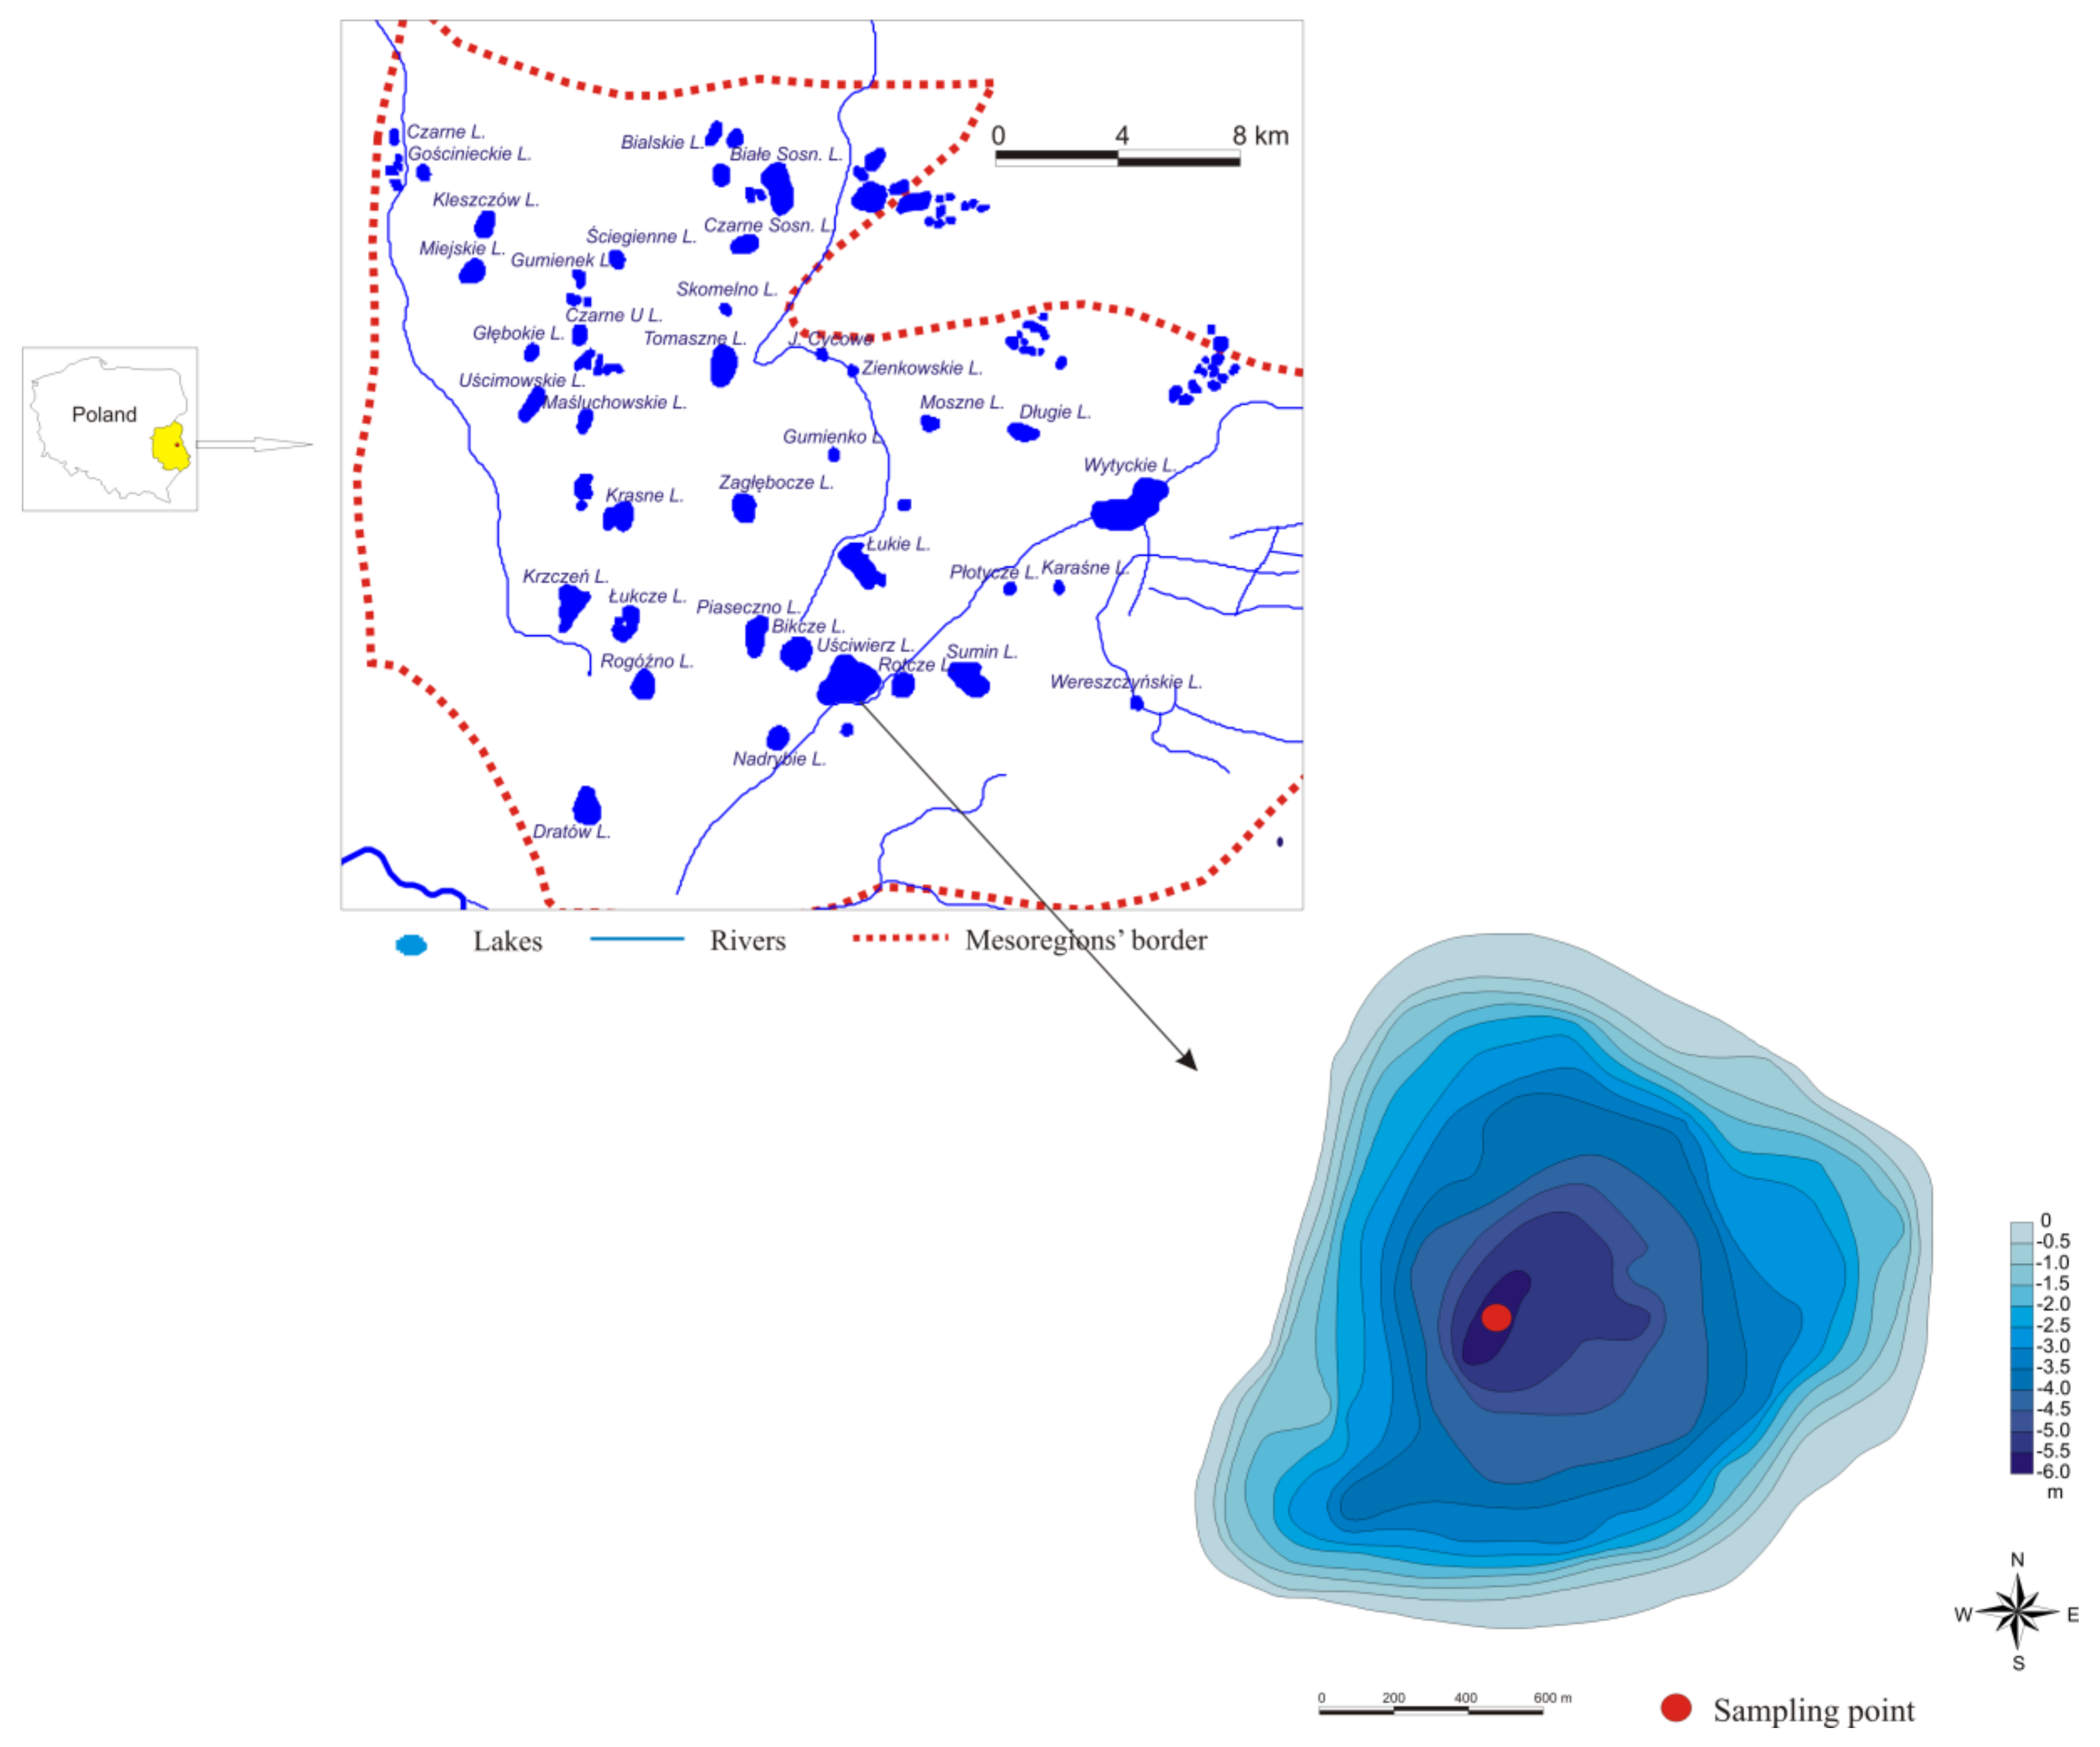
Lake Uściwierz is the largest (2.68 km2) but shallow (5.92 m maximum depth) Łęczna-Włodawa lake. The co-called Łęczna-Włodawa Lakes are located to the south of the line of the last glaciation. Lake volume, calculated based on measurements conducted in February 2017, amount to 6,585,600 m3. The lake’s catchment area is flat, with shallow groundwater table. Hence, only a very poor drainage system has been developed. Due to intensive meliorations of the Łęczna-Włodawa Lakes area, Lake Uściwierz is now a closed water body, lacking surface inflows and outflows. The flat-bottom lake basin is the deepest in the central part (Figure 1). Lake catchment is mostly extensively used as pastures, and only a small percentage are arable lands [22].
The lake water has been classified as eutrophic [23]. Presently, Uściwierz Lake is exposed to intense human pressure, due to the abundance of summerhouses adjacent to the lakeshores.
3. Methods
Field research was conducted during two water years, from November 2015 to September 2017. Water year 2016 started in November 2015 and ended in September 2016, whereas water year 2017 began in November 2016 and ended in September 2017. Weather condition parameters were air temperature, precipitation, and wind velocity, all obtained from Polish Institute of Meteorology and Water Management. Measurements of physico-chemical (water temperature (WT), dissolved oxygen concentration DO, pH, ORP and electrical conductivity (EC)) as well as biological (chlorophyll a concentration (Chl-a)) parameters were taken in the water column in the deepest part of the lake at 0.5 m intervals. Location of a sampling point at the deepest point of the lake is expected to provide the most reliable data, as it is least affected by local impacts from the catchment area [24]. Physico-chemical parameters were measured using YSI 6600 V2-4 Multi-parameter Water Quality Sonde (YSI Incorporated, Yellow Springs, OH, USA). Chlorophyll fluorescence measurements were compared with extracted chlorophyll-a, to calculate Chl-a concentration according to standard methods of chlorophyll quantification. In addition, concentration of biogens (NO3−, NO2−, NH4+, PO43−, TP and TN) was determined using a Slandi LF300 photometer. Samples for TP and TN measurements were preserved with sulphuric acid solution and mineralized before analysis.
Statistical Analyses
The distribution of normality (Kolmogorov–Smirnov test) and homogeneity of variance (Levene’s test) were tested for all the data obtained. This made it possible to select appropriate statistical tests. The non-parametric Kruskal–Wallis ANOVA test H was used to detect any variability in the water temperature, electrical conductivity, pH, concentration of oxygen and Chl-a between years, and compared these among seasons and lake depths. The same test was used to detect any variability in concentration of NO3−, PO43− and TP between years and seasons, whereas a two-way analysis of variance (ANOVA, Tukey test) was used to detect any differences in Secchi depth (SD) and concentration of NH4+, NO2− and TN. All analyses and statistical tests described above were performed using the Statsoft Statistica package v. 12 for Windows at a significance level of P < 0.05.
Ordination techniques were used to describe the relationships among 13 environmental variables (WT, EC, pH, ORP, SD, and concentration of DO, Chl-a, NH4+, NO3−, PO43−, NO2−, TN and TP in lake water) and distribution of samples. An indirect multivariate method, DCA, was used to measure and illustrate gradients indicated by environmental variables. Because the length of the gradient was <3 standard deviations, a principal component analysis (PCA) was used to describe the separation of samples during the study period, distribution and separation of the environmental variables, as well as samples in particular years of the study [25]. As there were no statistically significant differences for most variables in terms of lake depths, and samples for nutrients concentrations were collected from one water layer only (0.5 m), results obtained for samples collected at the depth of 0.5 m were considered reliable for the analyses. The ordination analyses were performed by means of CANOCO 4.5 for Windows.
4. Results
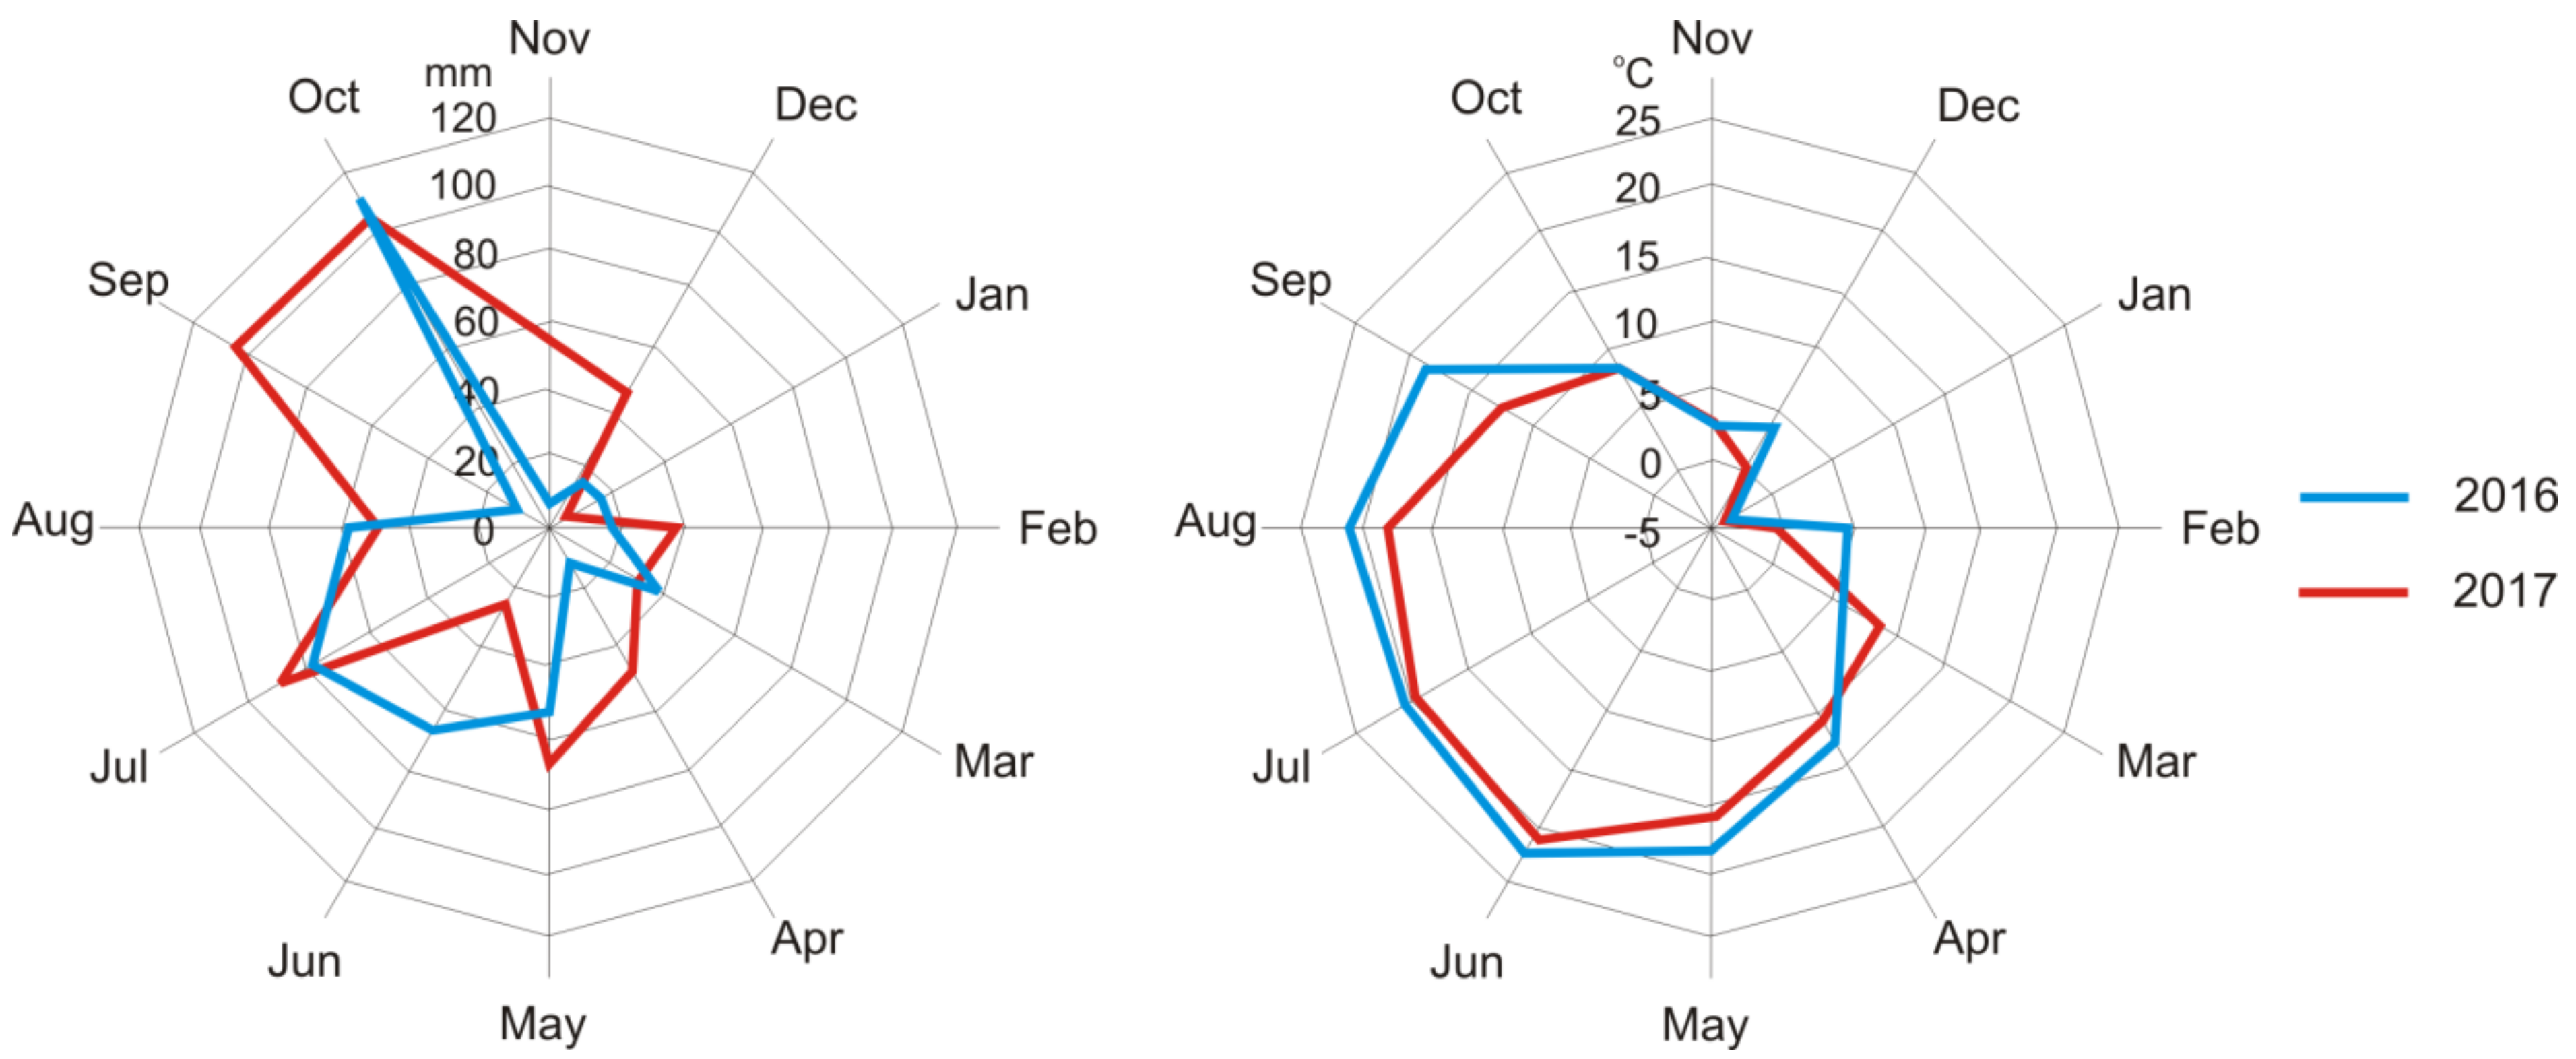
The study years differed in terms of the weather conditions. Both air temperature and precipitation distribution varied significantly (Figure 2). The first year of the study appeared rather dry, with the total sum of precipitation amounted to 493 mm, whereas 663 mm of precipitation were noted in the second water year.
A monthly sum of precipitation exceeding 50 mm was observed from May to August 2016, and 117 mm in October. In the water year 2017, an elevated quantity of precipitation was observed more frequently. In terms of air temperature, water year 2016 was warmer from November to February and colder from March to October than 2017 (Figure 2). Water temperature did not follow that pattern. Air temperature in the first year of study was constantly (except July) higher than in the second year. A winter monthly average differences amounted to circa 2 °C and resulted in ice cover occurrence in 2017.
Table 1 presents range of measured physico-chemical parameters. An increase in data variability with depth was observed in the majority parameters. However, as statistical analysis have confirmed, seasonal significant differences between particular intervals were found only for Chl-a concentration. The highest seasonal variability of WT was observed in the surface layer of the water column, and amounted from 0.6 °C in February to 24.6 °C in June. Termocline occurred briefly, in May 2016. Vertical homogenization of temperature existed in autumn and spring (Table 1).
The pH showed the lowest variability in both time (months) and space (water column), and elevated values of pH were observed in summer. The highest fluctuation was observed in ORP. Consistently high values were observed in the 2016 water year, whereas from December 2016 significant decrease of OPR values were observed. DO showed, generally, higher values in winter and lower values in summer. An exception was December 2016, when depletion of oxygen was observed. Variability of many of the parameters depended on the season. Winter was a season of the highest stability of WT (SD = 0.93) and Chl-a (SD = 4.9) (Table 1). The highest pH stability (SD = 0.3) was observed in spring, in which DO also showed a rather low variability. The lowest values of SD in conductivity and oxygen were observed in autumn, 10.5 and 1.2, respectively (Table 1). Statistical relations showed differences in both years. Significant relations in both years were found in pH and ORP, pH and DO, and pH and Chl-a (Table 2). Some parameters showed significant correlations in only one of the study year, whereas ORP correlated positively with WT in 2016, but negatively in 2017.
High variability in some environmental, mostly physical, parameters among the two studied years and particular seasons was confirmed by statistical analyses. Significant differences (Kruskal–Wallis test: H or Tukey test; P < 0.05) between two water years of study were found for most variables except of WT, SD, PO43−, TN and TP. All of the tested variables, except of biogenic compounds, differed significantly among seasons (P ≤ 0.05), whereas in case of season and year interaction, statistically significant differences (P < 0.001) were found for pH, ORP, Chl-a, NO3− and DO concentration (Figure 3). On the other hand, there were statistically significant differences found between depths and years for Chl-a, ORP, and pH, whereas WT, DO, ORP, and pH values differed significantly (P ≤ 0.01) among lake depths, seasons and years.
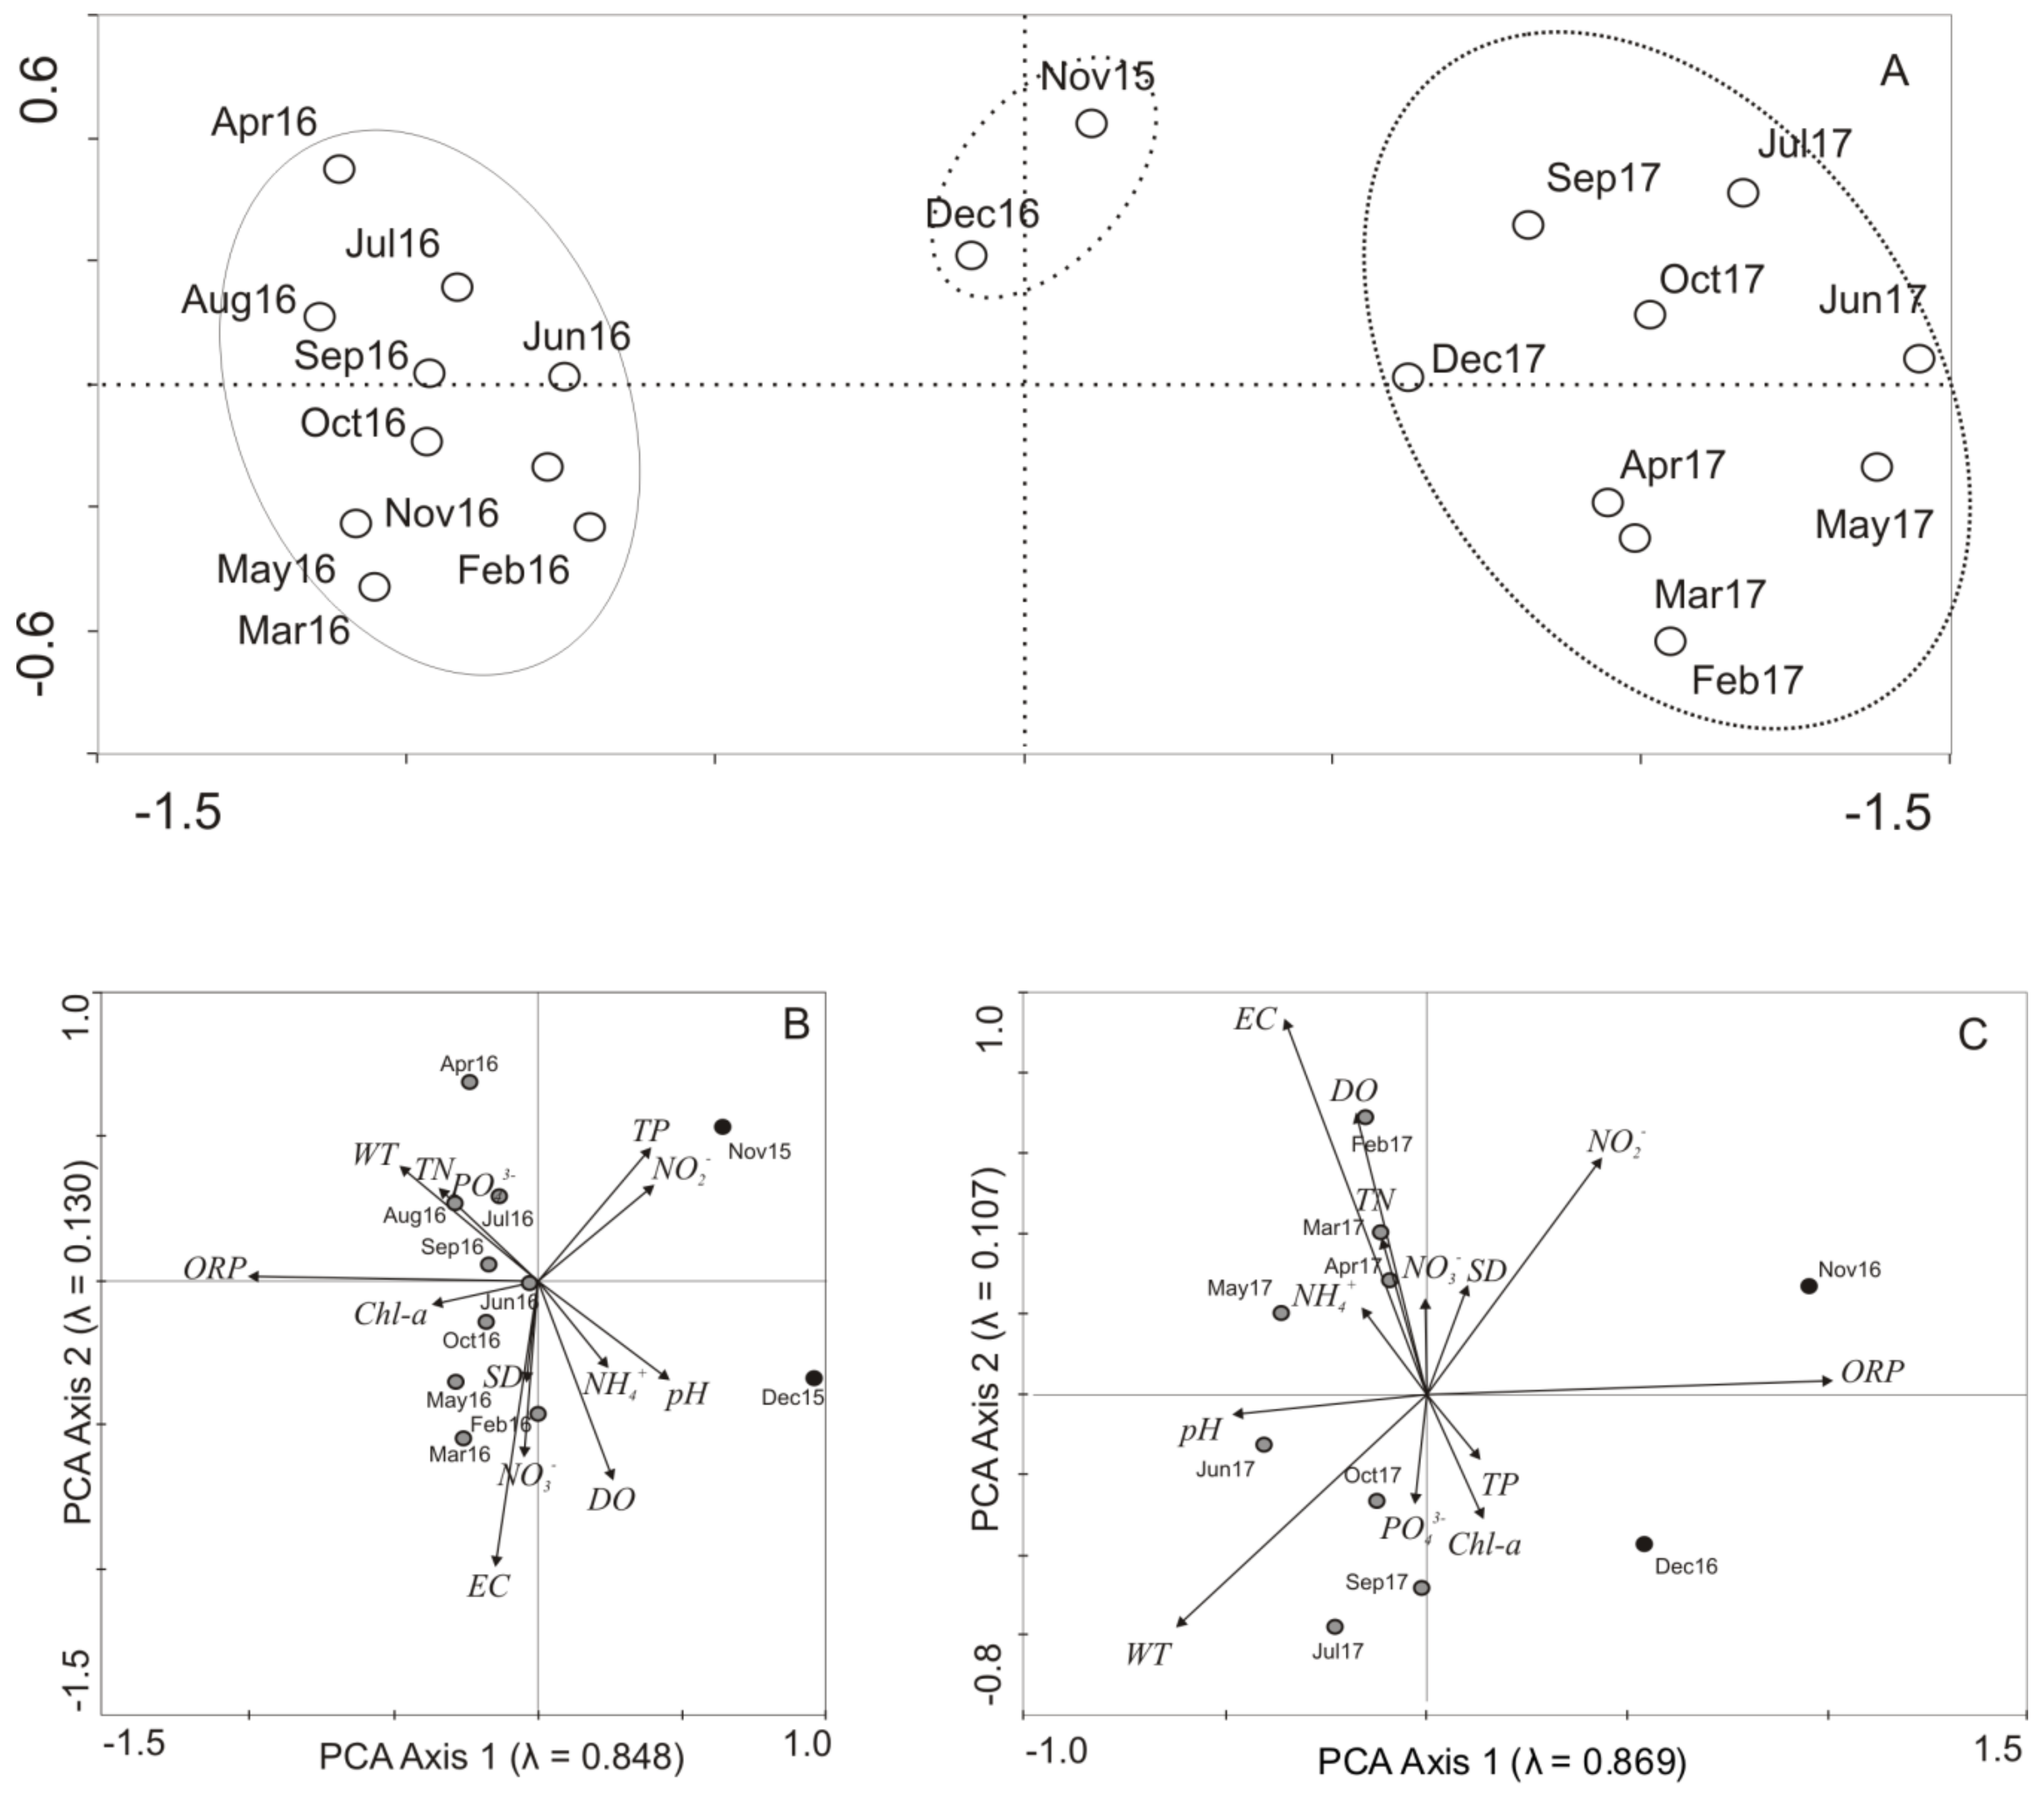
The principal component analysis (PCA) showed that samples collected in the first year of the study were separated from samples collected in the second year, and, in general, these two groups were separated from samples collected in winter period of 2015 and 2016 (Figure 4A). Therefore, and due to statistically significant differences (ANOVA, P < 0.05) between two years of the study found for six from 13 tested physico-chemical parameters, two analyses for two different years were performed to describe the distribution of environmental variables and samples (Figure 4B,C). PCA axis 1 (λ = 0.848) and axis 2 (λ = 0.130) explained 97.8% of the total variance in the distribution of the environmental variables in the first year of the study, whereas in the second year, PCA axis 1 (λ = 0.870) and axis 2 (λ = 0.107) explained 97.6% of the total variance in the variables distribution. The analyses showed some differences in the distribution and correlation of variables between years. In the first year of the study, Chl-a and ORP were most strongly correlated with the main direction of variation (axis 1), with samples collected in June, September and October (Figure 4B). Axis 2 was the most strongly correlated with NO3− concentration, SD, and EC and DO, and with samples collected in February, March and May.
In the second water year of the study, pH and ORP were most strongly correlated with axis 1 (Figure 4C), whereas Axis 2 was the most strongly correlated with TN, NO3−, PO43−, TP, Chl-a, DO, SD and EC, with samples collected mainly in February, March, April, and October. Interestingly, in the first year of the study, ORP correlated negatively, whereas in the second year it correlated positively, with samples collected in November and December. In both years, the first two axes showed a clear separation of samples (Figure 4B,C); axis 2 separated samples collected in the June–October period from those collected in November and December.
5. Discussion
In shallow lakes exposed to wind, chlorophyll-a and oxygen are considered as very important parameters that influence ecosystem stability [26,27,28]. However, our results show that lake water quality in shallow water bodies varies significantly in both time (seasons, years) and space (water column). A high dynamic, as well as the complexity of relations between physico-chemical and biological parameters, makes water management of lakes more difficult. Due to the high instability of shallow lakes, universal methods of improving lake water quality are often insufficient. Thus, studies on relations between environmental factors in lake waters are crucial to prevent further deterioration of water quality.
Our studies confirmed previous findings [29] that most the limnological variables are dependent on hydrological and climate conditions. Variability of meteorological conditions, both intra- and inter- annual, favoured significant differences of tested variables, between the two years and among seasons. An influence of inter-annual distribution of precipitation and air temperature on environmental factors was observed. A clear separation of each year’s data, indicating various physical and chemical condition of lake waters, resulted from highly different weather conditions, which is supported by previous findings of Sass et al. [20], Liu et al. [30], and Jeppesen et al. [31]. Significant seasonal differences found in our study in water quality parameters have also been lastly reported in other Łęczna-Włodawa lakes [32] as well as in other temperate lakes [33].
On average, a higher median in summer than in winter was observed in terms of WT and Chl-a, whereas lower in EC and DO correspond to the results reported by Poudel et al. [34]. However, in the colder and wetter water year of 2017, Chl-a maxima were observed in autumn, something often observed in colder temperate lakes [35]. Variation in air temperature between the two consecutive years brought about distinct differences in winter in the measured parameters. Water temperature, as expected, showed typical pattern of seasonal variability, shaped by local climate [36,37]. The temporal variation of WT is usually governed by natural environmental processes, such as air temperature and solar radiation [38]. Vertical fluctuation, which is usually noted in temperate lakes, in terms of seasonal thermal stratification [39], was hardly observed in the Lake Uściwierz. The influence of water temperature on oxygen solubility was observed in winter, when the highest DO concentration was observed. On the contrary, an increase in temperature caused a two to three-fold increase in bacterial activity, leading to the depletion of DO concentration [40]. Clear DO fluctuation with depth in summer and in winter is typical for temperate lakes [41]. However, in Lake Uściwierz, not only summer but also winter oxygen depletion near the bottom was observed. During the colder winter 2017, due to ice coverage, gas exchange with the atmosphere was compromised [42], and during such conditions, the DO concentration was altered only by the in-lake processes at that time [43].
Summer maxima of pH values were probably due to the high biological activity [44] and high water evaporation [45]. Low pH values in winter are usually observed in temperate lakes [37]; however, in case of the Lake Uściwierz, lowest values occurred in autumn. High water temperatures in summer lead to an increase in pH due to CO2 conversion to organic carbon by photosynthesis [46]. However, no correlation between WT and pH was observed through the study period. A pH inter-annual distribution in lake waters may be related to wet and dry periods or to snow meltdown [47], due to low pH value of both rain and snow. DO and pH correlations, observed in our study, often occur in temperate lakes [48]. However, pH and DO correlations with NH4+ and NO3− are not commonly observed [49].
Inter- and intra-annual variability in values of rarely studied ORP parameter showed a strong relationship with genetic form of lake supply (atmospheric precipitation or groundwater). A continuous increase in oxidation conditions was observed in water year 2016. It could have resulted from the lake basin supply with atmospheric water, due to the fact that both rain and snow redox potential is high; this was confirmed by a distribution of precipitation that year. A lower quantity of precipitation in autumn 2016 has been compensated by groundwater recharge, which resulted in an ORP decrease. Groundwater drained a Cretaceous lake catchment, hence input of alkaline waters [50] with low redox potential [51]. Low ORP values in summer 2017 were probably determined by a prevalence of groundwater input over atmospheric one. The shift of rainfall maximum to the turn of summer and autumn influenced the increase of the redox potential. During the study period, there was a statistically significant negative correlation between ORP and pH.
Studies on relationships between phytoplankton and environmental factors show a strong positive correlation between chlorophyll a and water temperature [52], as high WT affect the metabolic activity and accelerate phytoplankton development [53]. However, such a relationship was not observed in the studied lake. Also, a positive correlation between Chl-a and dissolved oxygen is often observed in lake waters [54], but it has not occurred in Lake Uściwierz. Furthermore, a significant negative correlation (r = −0.78, P < 0.01) was noted in winter.
Our results show a weak negative Chl-a correlation with pH, as well as a positive correlation of pH and DO, similar to other findings [55]. Yang et al. [56] also observed a negative Chl-a correlation with pH, based on an 11-year study investigation. In Lake Uściwierz, both pH and DO showed a positive correlation, but no statistical relations between pH and EC were found.
Author Contributions
Conceptualization, B.F. and J.D.; Methodology, B.F. and M.T.; Software, B.F. and M.T.; Validation, M.T.; Formal Analysis, B.F. and M.T.; Investigation, B.F. and J.D.; Resources, B.F.; Data Curation, B.F., M.T. and J.D.; Writing-Original Draft Preparation, B.F., M.T., and J.D.; Writing-Review & Editing, B.F. and M.T.; Visualization, B.F. and M.T; Supervision, B.F.; Project Administration, B.F.; Funding Acquisition, B.F.
Funding
The research has been supported by grant No. NCN 2015/17/D/ST10/02105 of National Science Centre (NCN), Poland.
Conflicts of Interest
The authors declare no conflict of interest.
References
- Toporowska, M.; Ferencz, B.; Dawidek, J. Impact of lake—catchment processes on phytoplankton community structure in temperate shallow lakes. Ecohydrology 2018, 11, 1–12. [Google Scholar] [CrossRef]
- Pannard, A.; Planas, D.; Beisner, B.E. Macrozooplankton and the persistence of the deep chlorophyll maximum in a stratified lake. Freshw. Biol. 2015, 60, 1717–1733. [Google Scholar] [CrossRef]
- Jacquet, S.; Domaizon, I.; Anneville, O. The need for ecological monitoring of freshwaters in a changing world: A case study of Lakes Annecy, Bourget, and Geneva. Environ. Monit. Assess. 2013, 186, 3455–3476. [Google Scholar] [CrossRef] [PubMed]
- Elçi, I.S. Effects of thermal stratification and mixing on reservoir water quality. Limnology 2008, 9, 135–142. [Google Scholar] [CrossRef] [Green Version]
- Eckert, W.; Imberger, J.; Saggio, A. Biogeochemical evolution in response to physical forcing in the water column of a warm monomictic lake. Biogeochemistry 2002, 61, 291–307. [Google Scholar] [CrossRef]
- Hanson, P.C.; Weathers, K.C.; Kratz, T.K. Networked lake science: How the global lake ecological observatory network (GLEON) works to understand, predict, and communicate lake ecosystem response to global change. Inl. Waters 2016, 6, 543–554. [Google Scholar] [CrossRef]
- Farahani, F.; Korehi, H.; Mollakarami, S.; Skandari, S.; Zaferani, S.G.G.; Shashm, Z.M.C. Phytoplankton diversity and nutrients at the Jajerood River in Iran. Pak. J. Biol. Sci. 2006, 9, 1787–1790. [Google Scholar]
- Zhang, M.; Yu, Y.; Yang, Z.; Shi, X.L.; Kong, F.X. The distribution of phytoplankton along trophic gradients and its mediation by available light in the pelagic zone of large eutrophic lakes. Can. J. Fish. Aquat. Sci. 2012, 69, 1935–1946. [Google Scholar] [CrossRef]
- El-Otify, A.M. Evaluation of the physicochemical and chlorophyll-a conditions of a subtropical aquaculture in Lake Nasser area, Egypt. Beni Suef Univ. J. Basic Appl. Sci. 2015, 4, 327–337. [Google Scholar] [CrossRef] [Green Version]
- Pasztaleniec, A.; Kutyła, S. The ecological status of lakes in national and landscape parks: Does the location of a lake and its catchment within a protected area matter? Pol. J. Environ. Stud. 2015, 24, 227–240. [Google Scholar] [CrossRef]
- Friedrich, J.; Janssen, F.; Aleynik, D.; Bange, H.W.; Boltacheva, N.; Çagatay, M.N.; Dale, A.W.; Etiope, G.; Erdem, Z.; Geraga, M.; et al. Investigating hypoxia in aquatic environments: Diverse approaches to addressing a complex phenomenon. Biogeosciences 2014, 11, 1215–1259. [Google Scholar] [CrossRef]
- Boehrer, B.; Golmen, L.; Løvik, J.E.; Rahn, K.; Klaveness, D. Thermobaric stratification in very deep Norwegian freshwater lakes. J. Gt. Lakes Res. 2013, 39, 690–695. [Google Scholar] [CrossRef]
- Jul-Larsen, E.; Kolding, J.; Overa, R.; Nielsen, J.R.; van Zwieten, P. Management, Co-Management or No Management? Major Dilemmas in Southern African Freshwater Fisheries; Food and Agriculture Organization: Rome, Italy, 2003; p. 127. [Google Scholar]
- Macuiane, M.; Hecky, R.; Guildford, S. Temporal and spatial changes in water quality in Lake Malawi/Niassa, Africa: Implications for cage aquaculture management. Oceangr. Fish. 2016, 1, 555552. [Google Scholar]
- Halstvedt, C.B.; Rohlack, T.; Andersent, T.; Skulberg, O.; Edvardsen, B. Seasonal dynamics and depth distribution of Planktothrix spp. in Lake Steinsfjorden (Norway) related to environmental factors. J. Plankton Res. 2007, 29, 471–482. [Google Scholar] [CrossRef] [Green Version]
- Grabowska, M.; Mazur-Marzec, H. Vertical distribution of cyanobacteria biomass and cyanotoxin production in the polymictic Siemianówka Dam Reservoir (eastern Poland). Arch. Pol. Fish. 2014, 22, 41–51. [Google Scholar] [CrossRef]
- Rücker, J.; Wiedner, C.; Zippel, P. Factors controlling the dominance of Planktothrix agardhii and Limnothrix redekei in eutrophic shallow lakes. Hydrobiologia 1997, 342, 107–115. [Google Scholar] [CrossRef]
- Kangur, M.; Puusepp, L.; Buhvestova, O.; Haldna, M.; Kangur, K. Spatio-temporal variability of surface sediment phosphorus fractions and water phosphorus concentration in Lake Peipsi (Estonia/Russia). Est. J. Earth Sci. 2013, 62, 171–180. [Google Scholar] [CrossRef]
- Ouma, H.; Mwamburi, J. Spatial variations in nutrients and other physicochemical variables in the topographically closed Lake Baringo freshwater basin (Kenya). Lakes Reserv. Res. Manag. 2014, 19, 11–23. [Google Scholar] [CrossRef]
- Sass, G.Z.; Creed, I.F.; Bayley, S.E.; Devito, K.J. Interannual variability in trophic status of shallow lakes on the Boreal Plain: Is there a climate signal? Water Resour. Res. 2008, 44, W08443. [Google Scholar] [CrossRef]
- Ferral, A.; Luccini, E.; Solis, V.; Frery, A.C.; Aleksinko, A.; Bernasconi, I.; Scavuzzo, C.M. In-situ and satellite monitoring of water quality of an eutrophic lake with an artificial air diffusion system. IEEE Lat. Am. Trans. 2018, 16, 627–633. [Google Scholar] [CrossRef]
- Demetraki-Paleolog, A. Planktonic rotifers of four dimictic lakes of Łęczyńsko-Włodawskie Lakeland (Eastern Poland). Teka Arch. Comm. Prot. Form. Nat. Environ. 2008, 5, 58–66. [Google Scholar]
- Mieczan, T. Periphytic ciliates in littoral zone of three lakes of different trophic status. Pol. J. Ecol. 2005, 53, 489–502. [Google Scholar]
- Cavanagh, N.; Nordin, R.N.; Pommen, L.W.; Swain, L.G. Guidelines for Designing and Implementing a Water Quality Monitoring Program in British Columbia. Ministry of Environment, Lands and Parks; Government Publication No. 7680000554; 1998. Available online: http://www.ilmb.gov.bc.ca/ risc/pubs/aquatic/ (accessed on 27 April 2012).
- Ter Braak, C.J.F.; Smilauer, P. CANOCO Reference Manual and CanoDraw for Windows User’s Guide: Software for Canonical Community Ordination (Version 4.5); Biometris: Wageningen, The Netherlands, 2002. [Google Scholar]
- Thomaz, S.M.; Lansac-Tôha, F.A.; Roberto, M.C.; Esteves, F.A.; Lima, A.F. Seasonal variation of some limnological features of lagoa do Guaraná, a várzea lake of the High Rio Paraná, State of Mato Grosso do Sul, Brazil. Rev. Hydrobiol. Trop. 1992, 25, 269–276. [Google Scholar]
- Soares, M.G.M.; Menezes, N.A.; Junk, W.J. Adaptation of fish species to oxygen depletion in a central Amazonian floodplain lake. Hydrobiologia 2006, 568, 353–367. [Google Scholar] [CrossRef]
- De Melo, S.M.; Takeda, A.M.; Grzybkowska, M.; Monkolski, A. Distribution of ephemeropteran nymphs associated with different stolon sections of Eichhornia azurea (Schwartz) in two floodplain lakes of the upper Paraná River (Brazil). Pol. J. Ecol. 2004, 52, 369–376. [Google Scholar]
- Masud, M.; Ferdous, B.; Faramarzi, J. Projected changes in hydrological variables in the agricultural region of Alberta, Canada. Water 2018, 10, 1810. [Google Scholar] [CrossRef]
- Liu, J.; Zhang, X.; Xia, J.; Wu, S.; She, D.; Zou, L. Characterizing and explaining spatio-temporal variation of water quality in a highly disturbed river by multistatistical techniques. Springer Plus 2016, 5, 117–134. [Google Scholar]
- Jeppesen, E.; Søndergaard, M.; Liu, Z. Lake restoration and management in a climate change perspective: An introduction. Water 2017, 9, 122. [Google Scholar] [CrossRef]
- Ferencz, B.; Toporowska, M.; Dawidek, J.; Sobolewski, W. Hydro-chemical conditions of shaping the water quality of shallow Łęczna-Włodawa Lakes (Eastern Poland). CLEAN Soil Air Water 2017, 45, 1600152. [Google Scholar] [CrossRef]
- Scheffer, M.; Carpenter, S.R.; Foley, J.A.; Folke, C.; Walker, B. Catastrophic shifts in ecosystems. Nature 2001, 413, 591–596. [Google Scholar] [CrossRef]
- Poudel, D.D.; Lee, T.; Srinivasan, R.; Abbaspour, K.; Jeong, C.Y. Assessment of seasonal and spatial variation of surface water quality, identification of factors associated with water quality variability, and the modeling of critical nonpoint source pollution areas in an agricultural watershed. J. Soil Water Conserv. 2013, 68, 155–171. [Google Scholar] [CrossRef] [Green Version]
- Winter, J.G.; DeSellas, A.M.; Fletcher, R.; Heintsch, L.; Morley, A.; Nakamoto, L.; Utsumi, K. Algal blooms in Ontario, Canada: Increases in reports since 1994. Lake Reserv. Manag. 2011, 27, 107–114. [Google Scholar] [CrossRef] [Green Version]
- Thakur, S.S.; Bais, V.S. Seasonal variation of temperature, alkalinity and dissolved oxygen in the Sagar Lake. Acta Hydrochim. Hydrobiol. 2006, 15, 143–147. [Google Scholar] [CrossRef]
- Singh, N.; Sumaiya, K.M. Chlorophyll-a and dissolved oxygen concentration of lake Varhala. Pharm. Chem. 2016, 8, 37–39. [Google Scholar]
- Zhu, S.; Nyarko, E.K.; Hadzima-Nyarko, M. Modelling daily water temperature from air temperature for the Missouri River. Peer J. 2018, 6, e4894. [Google Scholar] [CrossRef] [Green Version]
- Romanescu, G.; Stoleriu, C. The seasonal variation of temperature, pH and dissolved oxygen concentration in Lake Rosu, Romania. CLEAN Soil Air Water 2013, 42, 236–242. [Google Scholar] [CrossRef]
- Rocha, R.R.A.; Thomaz, S.M. Variação temporal de fatores limnológicos em ambientes da planície de inundação do alto rio Paraná (PR/MS-Brasil). Acta Scientiarum. Biol. Sci. 2004, 26, 261–271. [Google Scholar]
- Catalan, J.; Donato Rondón, J.C. Perspectives for an integrated understanding of tropical and temperate high-mountain lakes. J. Limnol. 2016, 75, 215–234. [Google Scholar] [CrossRef]
- Kirillin, G.; Lepparanta, M.; Terzhevik, A.; Granin, N.; Bernhardt, J.; Engelhardt, C.; Efremova, T.; Golosov, S.; Palshin, N.; Sherstyankin, P.; et al. Physics of seasonally ice-covered lakes: A review. Aquat. Sci. 2012, 74, 659–682. [Google Scholar] [CrossRef]
- Obertegger, U.; Obrador, B.; Flaim, G. Dissolved oxygen dynamics under ice: Three winters of high-frequency data from Lake Tovel, Italy. Water Resour. Res. 2017, 53, 7234–7246. [Google Scholar] [CrossRef] [Green Version]
- Scott, D.M.; Lucas, M.C.; Wilson, R. The effect of high pH on ion balance, nitrogen excretion and behaviour in freshwater fish from an eutrophic lake: A laboratory and field study. Aquat. Toxicol. 2005, 73, 31–43. [Google Scholar] [CrossRef] [PubMed]
- Govindasamy, C.; Kannan, L.; Azariah, J. Seasonal variation in physico-chemical properties and primary production in the coastal water biotopes of Coromandel coast, India. J. Environ. Biol. 2000, 21, 1–7. [Google Scholar]
- Araoye, P.A. The seasonal variation of pH and dissolved oxygen (DO2) concentration in Asa lake IIorin, Nigeria. Int. J. Phys. Sci. 2009, 4, 271–274. [Google Scholar]
- Laudon, H.; Westling, O.; Bishop, K. Cause of pH decline in stream water during spring melt runoff in northern Sweden. Can. J. Fish. Aquat. Sci. 2000, 57, 1888–1900. [Google Scholar] [CrossRef]
- Romanescu, G.; Michu-Pintilie, A.; Trifanov, C.; Stoleriu, C.C. The variations of physico-chemical parameters during summer in Lake Eurenciuk from the Danube Delta (Romania). Limnol. Rev. 2018, 18, 21–29. [Google Scholar] [CrossRef]
- Heini, A.; Puustinen, I.; Tikka, M.; Jokiniemi, A.; Leppäranta, M.; Arvola, L. Strong dependence between phytoplankton and water chemistry in a large temperate lake: Spatial and temporal perspective. Hydrobiologia 2014, 731, 139–150. [Google Scholar] [CrossRef]
- Ferencz, B.; Dawidek, J.; Toporowska, M. Hydrochemical versus biological conditions of the functioning of three shallow lakes in Łeczna-Włodawa. Water Environ Res. 2014, 86, 269–276. [Google Scholar] [CrossRef]
- Naudet, V.; Revil, A.; Rizzo, E.; Bottero, J.-Y.; Bégassat, P. Groundwater redox conditions and conductivity in a contaminant plume from geoelectrical investigations. Hydrol. Earth Syst. Sci. 2004, 8, 8–22. [Google Scholar] [CrossRef]
- Long, S.X.; Chen, C.; Liu, Z.W.; Ye, X.Y. Relationship between phytoplankton and environment factors in Lake Hongfeng. J. Environ. Biol. 2013, 34, 445–449. [Google Scholar]
- Khan, R.M.; Jadhav, M.J.; Ustad, I.R. Physical analysis of Triveni Lake water of Amravati district in [MS] India. Biosci. Discov. 2012, 3, 64–66. [Google Scholar]
- Robarts, R.D.; Waiser, M.J.; Arts, M.T.; Evans, M.S. Seasonal and diel changes of dissolved oxygen in a hypertrophic prairie lake. Lakes Reserv. Res. Manag. 2005, 10, 167–177. [Google Scholar] [CrossRef]
- Rocha, R.R.A.; Thomaz, S.M.; Carvalho, P.; Gomes, L.C. Modeling chlorophyll-a and dissolved oxygen concentration in tropical floodplain lakes (Parana’ River, Brazil). Braz. J. Biol. 2009, 69, 491–500. [Google Scholar] [CrossRef] [PubMed]
- Yang, L.B.; Lei, K.; Meng, W.; Fu, G.; Yan, W.J. Temporal and spatial changes in nutrients and chlorophyll-a in a shallow lake, Lake Chaohu, China: An 11-year investigation. J. Environ. Sci. 2013, 25, 1117–1123. [Google Scholar] [CrossRef]
Figure 1.
Location and bathymetric scan of Lake Uściwierz.

Figure 2.
Meteorological conditions of the study periods. Inter-annual distribution of precipitation (mm) and air temperature (°C).
Figure 2.
Meteorological conditions of the study periods. Inter-annual distribution of precipitation (mm) and air temperature (°C).

Figure 3.
Seasonal changes in physico-chemical and biological parameters of water in Lake Uściwierz during two years of study. Lower case letters indicate statistically significant differences between the seasons in the study period (P < 0.05). A—water temperature, B—Chl-a concentration, C—electric conductivity, D—DO concentration, E—ORP, F—pH.

Figure 4.
Principal Components Analysis (PCA) plots for axes 1 and 2 showing distribution of samples in the study period (A), distribution of environmental variables and samples in the first year (B) and second year of the study (C). WT—water temperature, SD—Secchi depth, EC—electrical conductivity, ORP—redox potential, DO—oxygen concentration, TN—total nitrogen, TP—total phosphorus, NH4+, NO3−, PO43−, NO2−—concentrations of ions, Feb—February, Mar—March, Apr—April, Jun—June, Jul—July, Sep—September, Nov—November, Dec—December. Gray dots—samples collected from February to October, separated from samples collected in November and December (black dots).


Table 1.
Range of values of selected physico-chemical parameters, minimum–maximum ± standard deviation (SD).
Table 1.
Range of values of selected physico-chemical parameters, minimum–maximum ± standard deviation (SD).
| WT (°C) | EC (µS cm−1) | pH | ORP (mV) | Chl-a (µg L−1) | DO (mg L−1) | |
|---|---|---|---|---|---|---|
| Study period | ||||||
| SL | 2.9–24.6 ± 8.1 | 228–275 ± 13.5 | 6.6–8.4 ± 0.6 | 92.3–230.2 ± 39.3 | 3.3–33.6 ± 6.3 | 8.8–15.0 ± 2.0 |
| 0.5 | 2.9–24.6 ± 7.9 | 227.7–279.3 ± 16 | 6.6–8.4 ± 0.6 | 96.8–231.7 ± 40.3 | 3.7–31.5 ± 5.8 | 9.0–14.5 ± 1.9 |
| 1.0 | 2.9–24.5 ± 7.9 | 227.6–275.4 ± 15.4 | 6.6–8.4 ± 0.6 | 96.4–233.1 ± 41.2 | 3.2–29.1 ± 5.6 | 9–14.8 ± 1.9 |
| 1.5 | 2.9–24.4 ± 7.8 | 227.7–275.4 ± 15.1 | 6.6–8.4 ± 0.6 | 94.8–232.6 ± 42 | 3.1–32.1 ± 6.1 | 8.8–14.7 ± 1.9 |
| 2.0 | 2.9–24.1 ± 7.8 | 234.8–277.8 ± 12.9 | 6.6–8.4 ± 0.6 | 96.1–233.7 ± 42.2 | 2.8–41.4 ± 8.0 | 8.8–14.6 ± 1.9 |
| 2.5 | 2.9–23.8 ± 7.7 | 236.6–277.9 ± 12.6 | 6.6–8.4 ± 0.6 | 96.3–235.5 ± 42.6 | 2.1–40.5 ± 7.9 | 8.5–14.7 ± 1.9 |
| 3.0 | 2.9–22.3 ± 7.3 | 238.1–277.9 ± 12.2 | 6.6–8.4 ± 0.6 | 96.4–236.8 ± 42.9 | 6.1–43.8 ± 8.4 | 7.5–14.6 ± 2.1 |
| 3.5 | 2.9–22.1 ± 7.1 | 238.9–325.0 ± 21.2 | 6.6–8.4 ± 0.6 | 96.4–237.6 ± 43.6 | 0.9–49.5 ± 9.7 | 1.5–14.8 ± 3.4 |
| 4.0 | 2.9–21.9 ± 7.0 | 240.1–325.0 ± 22.6 | 6.6–8.4 ± 0.6 | 28.9–237.6 ± 58.4 | 2.1–41.7 ± 8.7 | 0.3–14.5 ± 3.9 |
| 4.5 | 2.9–21.8 ± 7.0 | 247.0–323.0 ± 21.2 | 6.6–8.4 ± 0.6 | 37.2–231.3 ± 62.0 | 0.9–45.3 ± 10.1 | 0.2–13.0 ± 4.2 |
| 5.0 | 4.0–21.8 ± 6.6 | 247.0–327 ± 30.3 | 7.3–8.2 ± 0.3 | 51.2–231.5 ± 72.9 | 3.9–46.5 ± 25.7 | 0.2–9.1 ± 3.1 |
| Spring | ||||||
| WC | 4.78–19.75 ± 5 | 277.6–288 ± 12.73 | 7.4–8.6 ± 0.3 | 39.7–237.6 ± 80.5 | 4.8–33.6 ± 5.8 | 5.3–14.3 ± 1.6 |
| Summer | ||||||
| WC | 20.1–24.6 ± 1.1 | 246–325 ± 18.8 | 6.8–8.7 ± 0.6 | 31.8–233.5 ± 85.9 | 0.9–31.2 ± 7.1 | 0.2–9.8 ± 2.2 |
| Autumn | ||||||
| WC | 2.9–17.9 ± 5.02 | 228–267 ± 10.5 | 6.6–8.6 ± 0.7 | 65.4–230.9 ± 65.8 | 2.1–49.5 ± 11.7 | 9.2–12.9 ± 1.2 |
| Winter | ||||||
| WC | 0.6–4.21 ± 0.93 | 245–328 ± 24.5 | 7.2–8.4 ± 0.5 | 28.9–200.6 ± 53.9 | 5.7–23.4 ± 4.9 | 2.1–15 ± 5.3 |
SL—surface layer, WC—water column.
Table 2.
Correlations between physico-chemical parameters.
| Water Year 2016 | Water Year 2017 | |||||||||||
|---|---|---|---|---|---|---|---|---|---|---|---|---|
| WT | EC | pH | ORP | DO | Chl-a | WT | EC | pH | ORP | DO | Chl-a | |
| WT | 1.00 | −0.15 | −0.18 | 0.53 | −0.64 | 0.36 | 1.00 | −0.33 | 0.75 | −0.63 | 0.06 | 0.01 |
| EC | 1.00 | 0.28 | 0.05 | −0.17 | −0.11 | 1.00 | 0.02 | −0.30 | 0.36 | −0.22 | ||
| pH | 1.00 | −0.35 | 0.23 | −0.22 | 1.00 | −0.44 | 0.61 | −0.24 | ||||
| ORP | 1.00 | −0.09 | 0.34 | 1.00 | −0.09 | 0.00 | ||||||
| DO | 1.00 | −0.25 | 1.00 | −0.10 | ||||||||
| Chl-a | 1.00 | 1.00 | ||||||||||
Significant correlations (P < 0.001) in red. Units as in Table 1.
© 2019 by the authors. Licensee MDPI, Basel, Switzerland. This article is an open access article distributed under the terms and conditions of the Creative Commons Attribution (CC BY) license (http://creativecommons.org/licenses/by/4.0/).
Share and Cite
MDPI and ACS Style
Ferencz, B.; Toporowska, M.; Dawidek, J. Temporal and Vertical Relations between Various Environmental Factors in the Largest Lake of Łęczna-Włodawa Lake District (Eastern Poland). Water 2019, 11, 1263. https://doi.org/10.3390/w11061263
AMA Style
Ferencz B, Toporowska M, Dawidek J. Temporal and Vertical Relations between Various Environmental Factors in the Largest Lake of Łęczna-Włodawa Lake District (Eastern Poland). Water. 2019; 11(6):1263. https://doi.org/10.3390/w11061263
Chicago/Turabian StyleFerencz, Beata, Magdalena Toporowska, and Jarosław Dawidek. 2019. "Temporal and Vertical Relations between Various Environmental Factors in the Largest Lake of Łęczna-Włodawa Lake District (Eastern Poland)" Water 11, no. 6: 1263. https://doi.org/10.3390/w11061263
Note that from the first issue of 2016, this journal uses article numbers instead of page numbers. See further details here.