Water Quality Changes during the Initial Operating Phase of Riverbank Filtration Sites in Upper Egypt


1
Holding Company for Water and Waste Water, 1200 Corniche El Nile, Rod-El-Farag, 12622 Cairo, Egypt
2
Environmental Science Division, National Research Centre, 12622 Cairo, Egypt
3
Division of Water Sciences, University of Applied Sciences Dresden, 01069 Dresden, Germany
*
Author to whom correspondence should be addressed.
Water 2019, 11(6), 1258; https://doi.org/10.3390/w11061258
Submission received: 15 May 2019
/
Revised: 4 June 2019
/
Accepted: 13 June 2019
/
Published: 15 June 2019
(This article belongs to the Special Issue Efficiency of Bank Filtration and Post-Treatment)
Abstract
:To meet the increasing water demand and to provide safe drinking water in Egypt, the Holding Company for Water and Wastewater (HCWW) and its affiliated companies have started a program to develop riverbank filtration (RBF) sites in all Egyptian governorates. The paper gives an overview of water quality changes as a result of RBF, during the initial phase of operation at three sites in Upper Egypt, between 2015 and 2018. Significant changes were observed for chloride, sulfate, iron, manganese, ammonium, and in the bacterial counts. After the initiation of pumping from the RBF wells, it took 2 to 8 months until stable water quality was observed for the hydrochemical parameters and 2 to 14 months for the microbiological parameters. The results showed that RBF wells should be operated continuously, to maintain the advantage of lower Fe and Mn concentrations achieved by the wash-out effect in the aquifer zone, between the river bank and the RBF wells.
1. Introduction
Egypt’s freshwater consumption is growing ten times faster than its freshwater production [1], and the current ballooning demographics show no sign of abating any time soon. The total population of Egypt increased from 22 million in 1950 to around 88 million in 2015 [2]. This rapid increase in population growth will continue for decades to come and it is likely to increase to between 120–150 million, by 2050. A high population growth rate would exaggerate the problems associated with water allocation.
Egypt is not only facing problems with an increase in water demand but also with pollution of the River Nile water through industrial, agricultural and municipal inflows. In Egypt, large amounts of untreated or poorly treated sewage are discharged into surface waters [3]. Along the River Nile, there are a total of 56 large drains that discharge water and transfer pollutants from industrial and settlement areas, and 72 drains that discharge water mainly from agricultural areas. The exports from agricultural areas and domestic wastes are considered to be the main sources of water pollutants in the River Nile [4]. The water quality of the River Nile mainly depends on the water quality in the Lake Nasser reservoir and the volume of water released from it. Despite the overall water quality of the River Nile being suitable for drinking water production using conventional treatment, accidental (oil) spills and flash floods occur frequently, which affect the operations of water treatment plants [5]. Additionally, from December to January, irrigation canals are put under maintenance (winter closure) and the water released from the Aswan dam is reduced, such that less dilution of sewage inputs occur, and some large water treatment plants suffer from higher siltation at the intake points. During this period, several small surface water abstraction units suffer from the lower river water level and use that time for maintenance, resulting in a decrease in drinking water supply [6].
Egypt relies on the River Nile for 95% of its freshwater needs for irrigation, drinking, and industrial purposes. Egypt’s aquifers, which contain large amounts of fossil water that experiences little to no replenishment, cannot be abstracted easily. Additionally, while desalination of seawater is slowly picking up in the country, it still represents a very negligible amount of freshwater production overall, and comes with its own set of environmental issues. New strategies have to be developed by the governorates to overcome the water shortage. One strategy is to opt for riverbank filtration (RBF), which has been used for over 150 years in Germany and other European countries, to produce large quantities of drinking and industrial water with low cost and high quality, even during floods and droughts [7].
Riverbank filtration is the abstraction of water from aquifers that are hydraulically connected to the river, through pumping wells adjacent to the river [8]. The pumping lowers the groundwater table, such that the river water infiltrates into the aquifer. The bank filtrate percolates through the aquifer sediments towards the production wells, where it mixes with groundwater. Figure 1 shows an RBF cross-section with typical conditions from Upper Egypt. Favorable conditions include a good hydraulic connection between the river and the aquifer, erosive river flow conditions to prevent riverbed clogging, sufficient aquifer thickness (>10 m) and hydraulic conductivity (K > 1 × 10⁻⁴ m/s), and a low natural (pre-RBF) gradient of groundwater flow towards the river [8,9,10]. Such favorable hydrogeological conditions for RBF have been identified for Upper Egypt [11].
The technology in itself is quite simple, is cheaper than conventional water treatment systems, and requires little maintenance. Identifying the right location for an RBF site is a key issue. Therefore, water quality tests of river and groundwater need to be conducted at each specific site, and the composition of the riverbed and thickness and hydraulic conductivity of the adjacent aquifer need to be examined to assess the viability of a site. If an RBF scheme is properly designed, the subsurface passage of surface water through the riverbed and aquifer material provides several natural treatment processes, including filtration, biodegradation, adsorption, chemical precipitation, and improvement of water quality through redox processes [12].
According to [13], four stages of site investigation should be followed:
- Initial site assessment, including visual reconnaissance by site visits, documentation of verbal and archived information, and in-situ sampling of river water and groundwater.
- Basic site survey and installation of basic infrastructure: Identifying possible well locations, determining ground elevations and datum, river and groundwater monitoring locations, and construction of exploratory and monitoring wells.
- Monitoring and determining aquifer parameters: Monitoring of river and groundwater levels and quality, river channel geometry and grain size analysis, and pumping tests.
- Analytical or numerical groundwater flow modeling: Determining flow paths, travel times, and portions of bank filtrate and groundwater in the extracted water.
The aim of this study was to give an overview of the initiation of RBF processes at three recently developed RBF sites near Luxor and Sohag, Upper Egypt. While water quality changes during RBF, redox-zonation, and removal rates have been discussed by many authors (e.g., [14,15,16]), little information is available on the initial operation phase of new RBF schemes. For example, the wash-out effect of iron and manganese in aquifers between the riverbank and the production wells has been described for longer periods (in terms of years) [17,18], based on long-term monitoring, but no description has yet been provided for the initial phase. The new RBF sites in Upper Egypt make it possible to study the behavior of organic compounds and redox sensitive parameters during the initial operation phase and to draw conclusions on the required post-treatment.
2. Materials and Methods
2.1. Site Description
Results from investigations at three sites in Upper Egypt have been presented—Alsaayda near Luxor (Site L), and Eltawael (Site T) and Al-maragha (Site M) near Sohag (Figure 2).
Luxor Company for Water and Wastewater (LCWW) is an affiliated body of the Holding Company for Water and Wastewater (HCWW) that provides drinking water (according to the Egyptian standards) from 9 water treatment plants (WTPs), with a total design capacity of 3.5 Mm3/day. In the Governorate Luxor, 57% of the drinking water production is based on surface water from the River Nile and the irrigation canals, and the remaining 43% is abstracted from shallow groundwater. The Alsaayda site is located in Northern Luxor (Figure 2). One exploratory well was drilled in March 2018 and three production wells were drilled in May 2018. The production wells were located at a distance of 5 to 13 m from the right river bank (Table 1). The distance between well L1 and L2 was 25 m and the distance between well L2 and L3 was 19 m. The borehole diameter was 20 inches and the diameter of the well casing was 14 inches.
The submersible pumps were operated at a rate of about 35 L/s each. The static groundwater depth was 1.5 to 2.0 mbgs (meter below ground surface), when pumping 5 to 6 mbgs. The aquifer had a thickness of about 30 m. During drilling, soil profiles were taken; the results are summarized in Table 2.
The Sohag Company for Water and Wastewater (SCWW) is another affiliated body of the HCWW that produces drinking water from 12 large WTPs, 60 small WTPs, and 450 groundwater wells, all over the governorate, with a total design capacity of 0.9 Mm3/day. Here, 60% of the drinking water production is based on surface water and 40% on groundwater. The aquifer has a thickness of about 36 m, lithological profiles from drilling are summarized in Table 2.
At the RBF site in Eltawael (Site T) (26°38′51 N, 31°38′51 E), one exploratory well was drilled in March 2015 and three production wells were drilled in May 2015. The wells were located at a distance of 6 m from the right river bank (Table 1, Figure 2). The distances between the wells T1, T2, and T3 were 10 m. The borehole diameter was 20 inches; the diameter of the well casing was 14 inches. The submersible pumps were operated at a rate of about 35 L/s each. The static groundwater depth was 2.2 to 2.4 mbgs, when pumping 5 to 6 mbgs.
At the RBF site in Al-maragha (Site M) (26°41′28 N, 31°36′48 E), one exploratory was drilled in December 2017 and two production wells were drilled in February 2018. The wells were located at a distance of 5 m from the right river bank (Table 1, Figure 2). The distance between wells M1 and M2 was 12 m. The static groundwater depth was 2.5 mbgs, when pumping 6 mbgs.
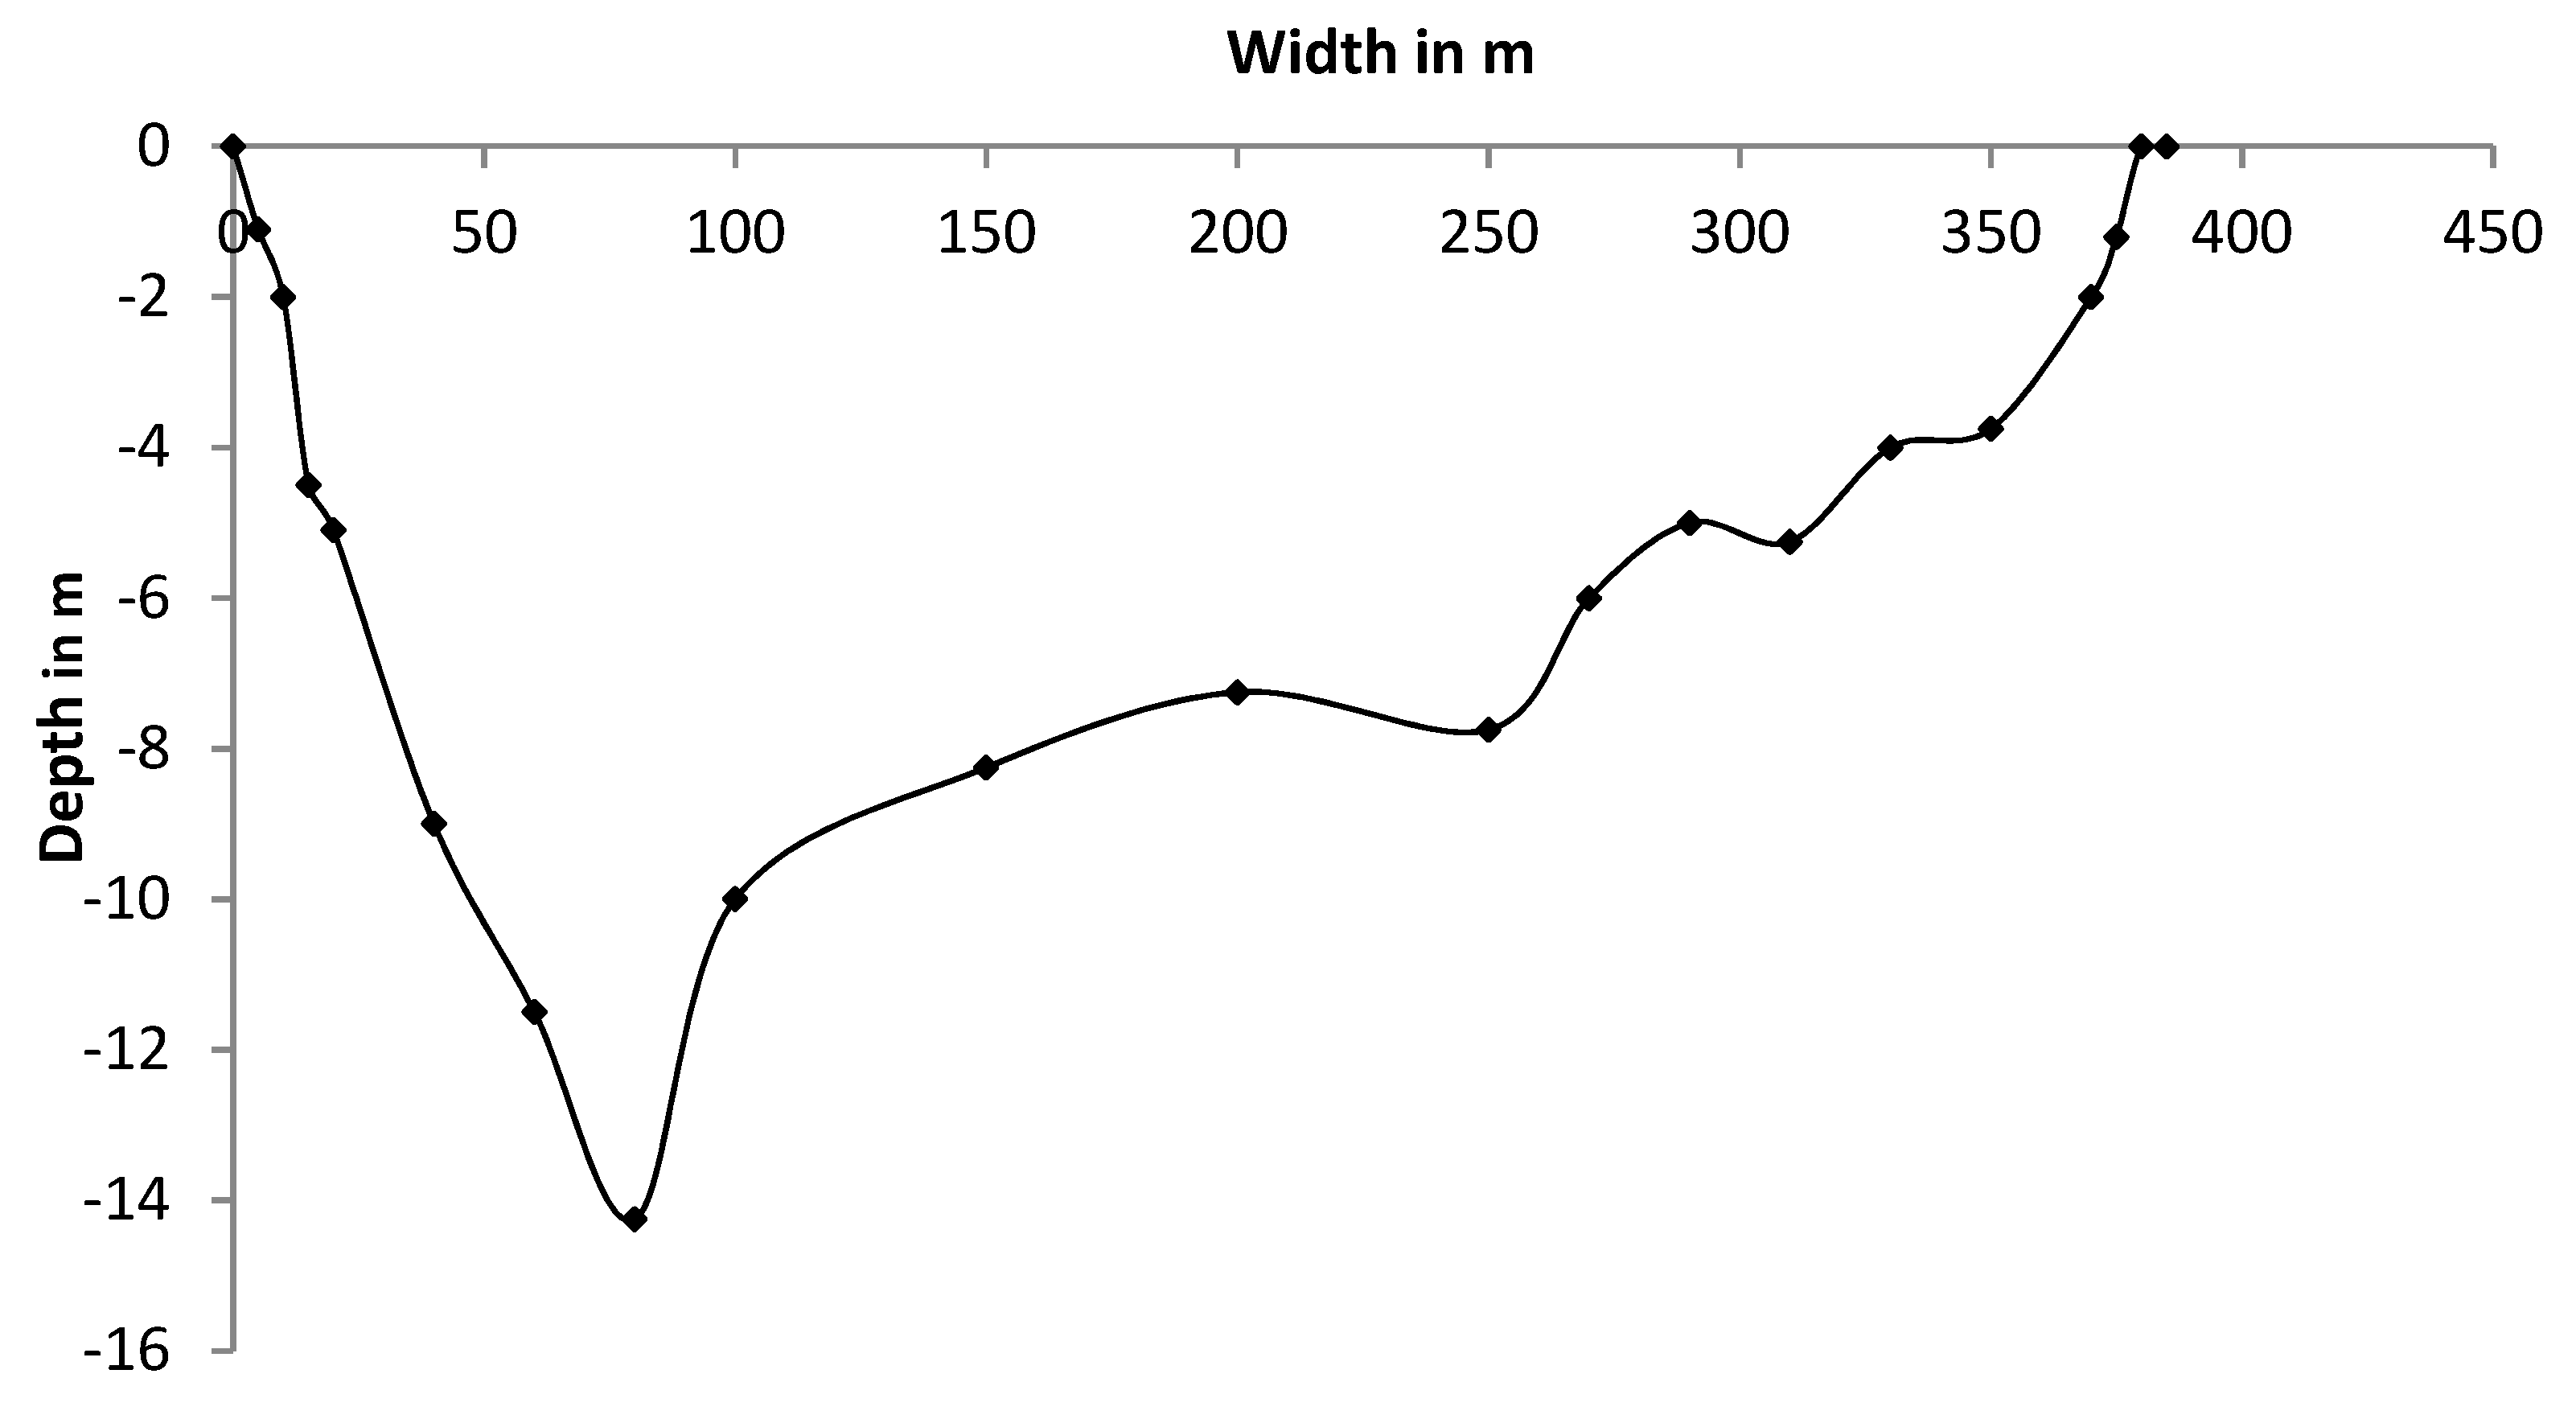
The depth of River Nile at Luxor is about 8 m, with a maximum of 14 m. Figure 3 shows a cross-section of River Nile, which was prepared in May 2018.
2.2. Water Sampling and Analysis
Water sampling from the river and the wells was carried out following the Egyptian guidelines and standards [19,20]. The River Nile was sampled daily for its major parameters, such as pH, EC, turbidity, and microbiological parameters, and weekly for further parameters such as major ions. Every well in operation was sampled regularly (at least weekly) from its sampling tap. Table 3 provides all analytical methods for determining the discussed parameters.
The River Nile was sampled at the intake of several water treatment plants, along its flowpath from Luxor to Sohag. The river water quality decreased towards Sohag and further downstream, due to industrial and domestic wastewater input. Water analysis was conducted by different laboratories (local company labs and central labs). Groundwater was sampled from different wells in the catchments of the three sites, at different depths and distances from the RBF wells. Here, the differences in water quality were mainly driven by spatial differences.
From the collected dataset, the minimum, median, and maximum values were extracted. This was done, so that the outliers and short-term events such as spills or flash floods would not seriously affect the median values that were used to discuss the general effect of RBF processes and water quality.
Due to the limited budget, no extra monitoring wells could be installed. All samples were taken from the production wells. Thus, it has to be taken into account that the sampled well water was a mixture of the bank filtrates (of different age depending on the location of infiltration in the riverbed, the depth of the flow path in the aquifer, and the pumping rate of the well) and the land-side groundwater.
3. Results and Discussion
3.1. The Quality of River Nile and the Ambient Groundwater in Luxor and Sohag
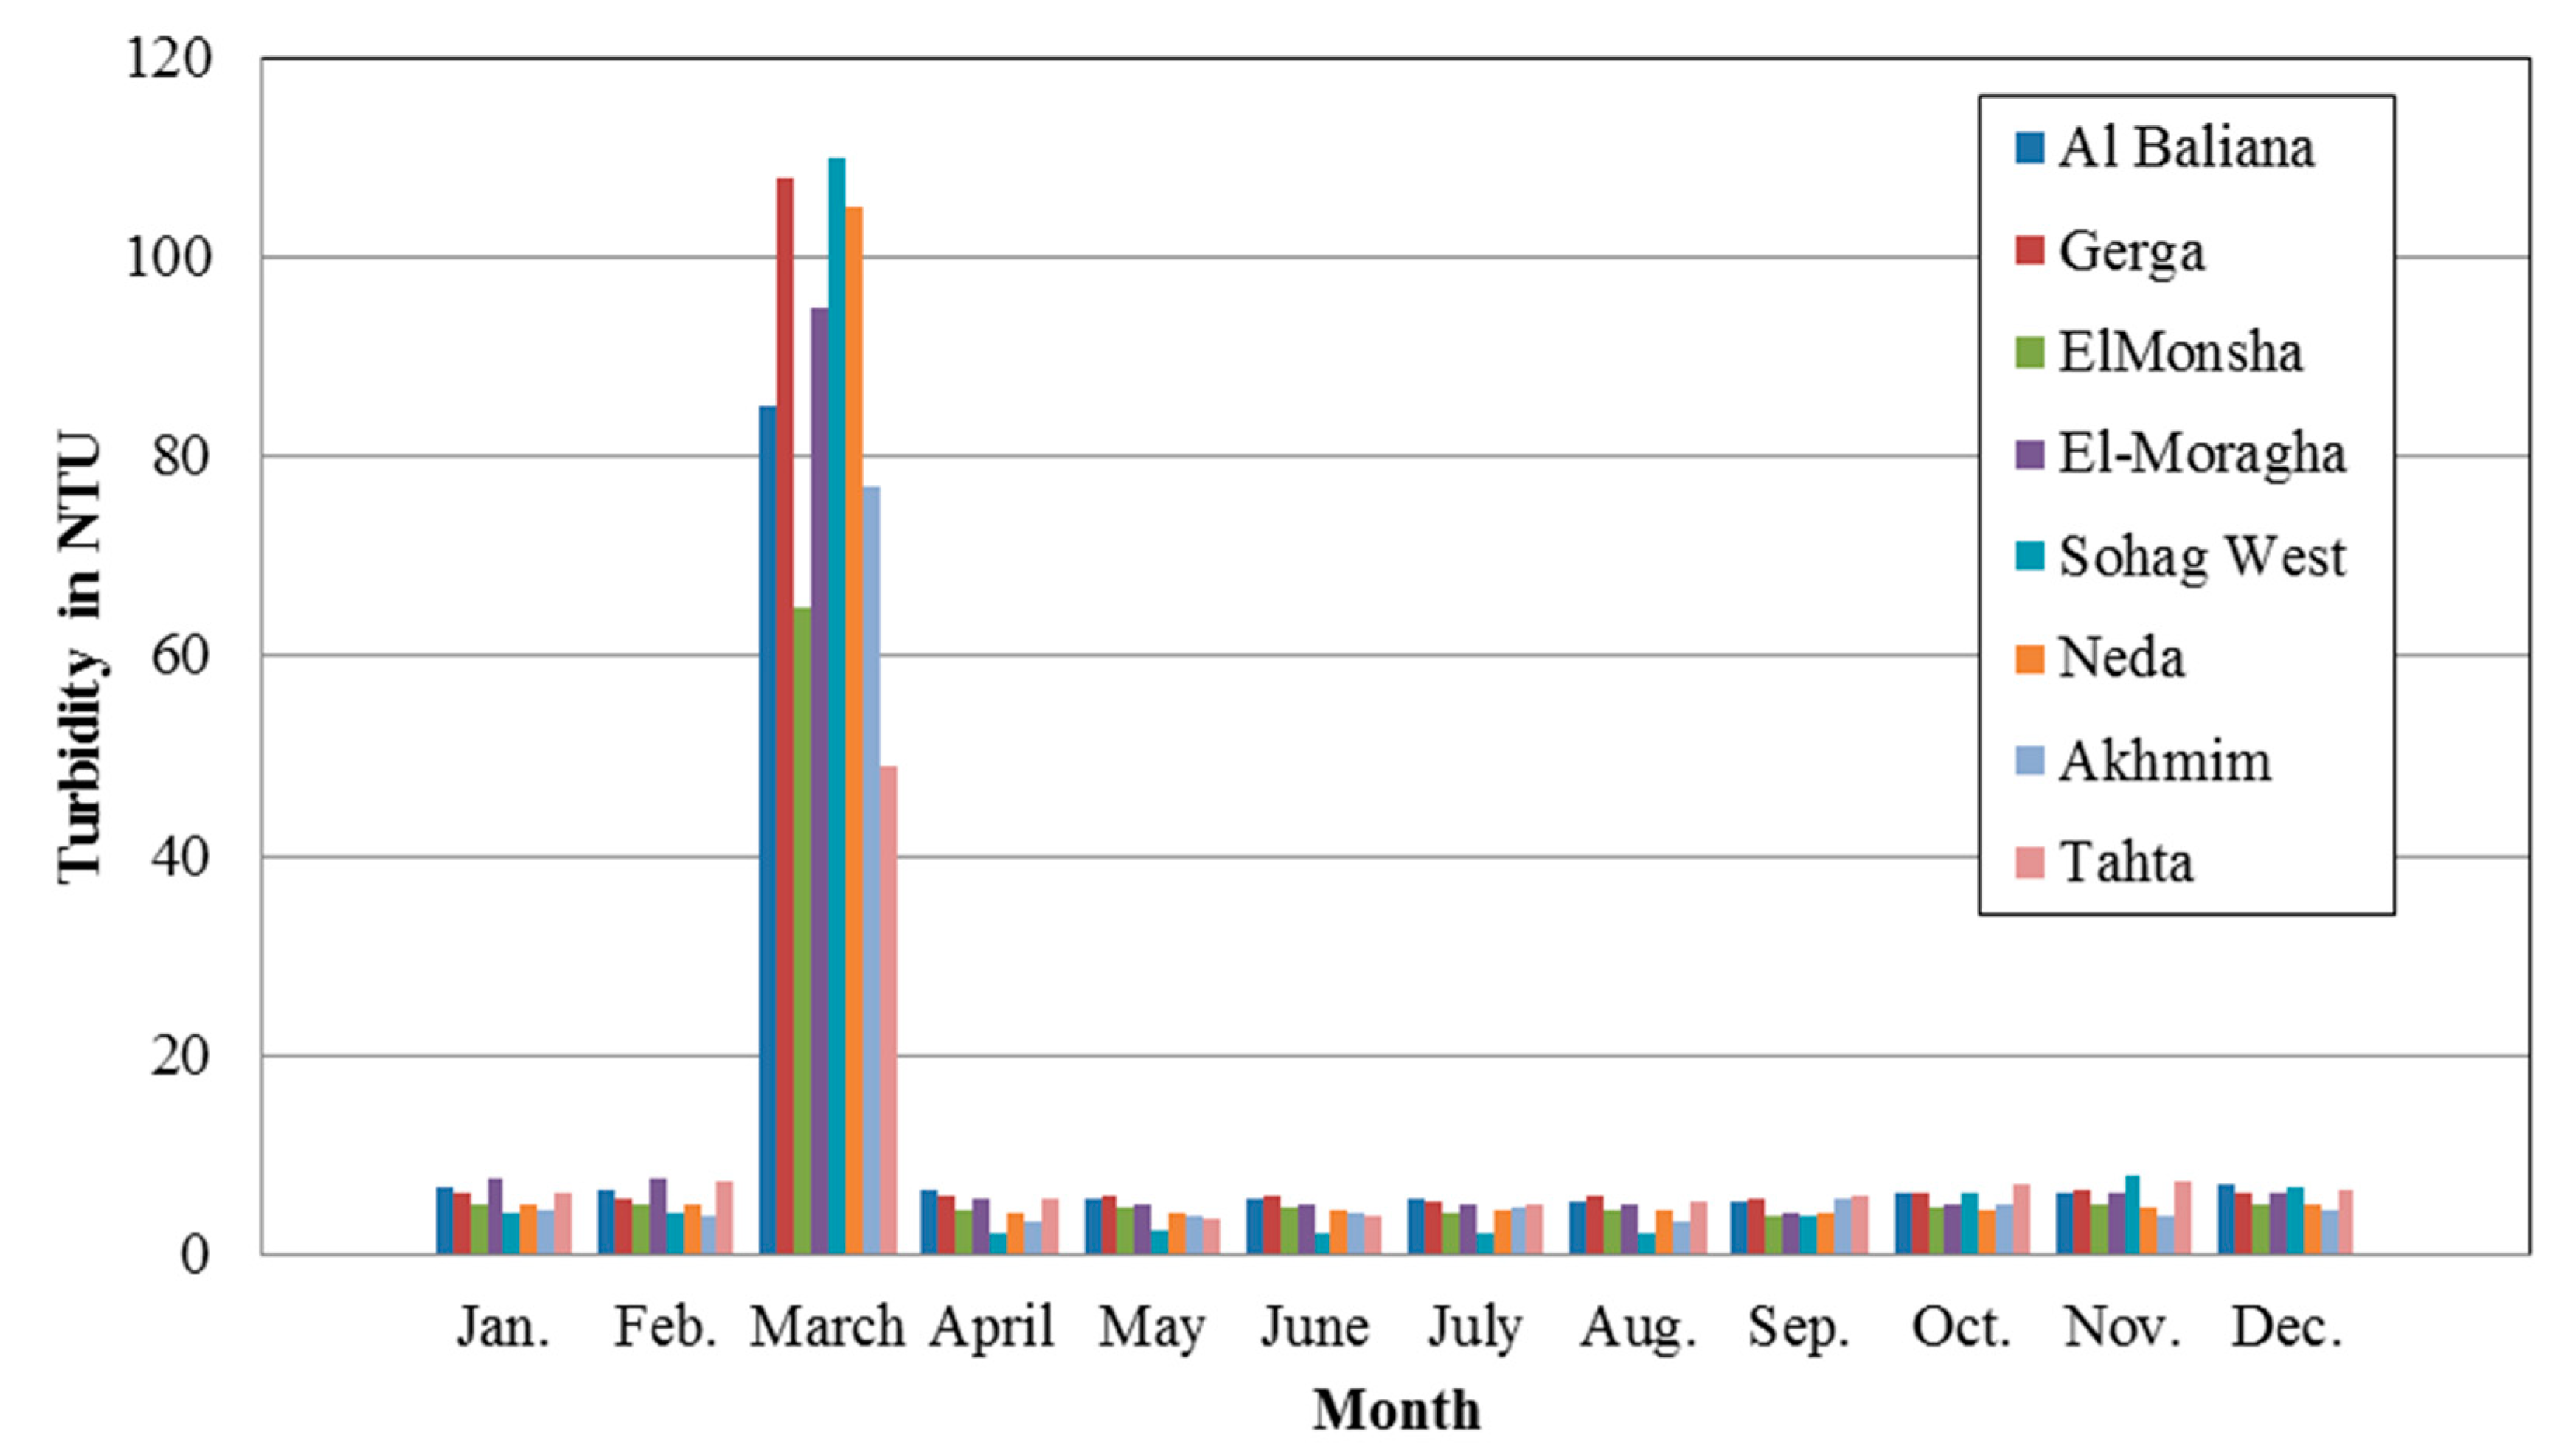
Mean river water temperatures varied from 19.5–28.6 °C. The salinity of River Nile water showed an increase in the downstream direction; the electric conductivity (EC) ranged from 273–461 µS/cm (median 322 µS/cm) and the chloride concentrations were 11–27 mg/L (median 15 mg/L). Water in the main canals (Nag Hammadi West and Nag Hammadi East) had the same chemical composition as water in the river. Nevertheless, water quality deteriorated in the downstream direction, due to the disposal of municipal and industrial effluents, the inflow of agricultural drainage, as well as the decreasing water flow. Turbidity was relatively low but was above the drinking water limits, ranging from 0.3–8.5 NTU. During flash floods, turbidity could increase by a hundred-fold. This happened during a flash flood in March 2014 [21] (Figure 4) and in November 2016, when a shock load extended for about 15 days and severely affected all water treatment plants in Sohag. During those periods, the level of turbidity in River Nile reached a maximum of about 100 NTU in 2014 and 300 NTU in 2016. This caused the temporary closure of all conventional surface water treatment plants in Sohag, while the RBF wells at the Eltawael site could still be operated during flash floods periods. The surface water abstraction of the Elmonsha WTP in the Elmonsha city was shut down for 7 days during the flash flood.
The significant influence of heavy rains on the water turbidity of river water is shown in Figure 4, where the spike in March was caused by heavy rain.
The unprecedented level of turbidity exceeded the tolerance capacity of the WTPs. As a result, all WTPs had to be shut down to a maximum of 72 h (conventional WTPs) and 100 h (compact water treatment plants).
All major ions in Nile water were generally within the limits for drinking water supply. The Nile water was alkaline and predominantly of the bicarbonate type. Total hardness ranged from 88 to 192 mg/L (as CaCO3), with calcium as the main hardness constituent. The main problem in drinking water treatments is the high load of microbiological contaminants.
The ambient groundwater in the River Nile valley, near the current River Nile track, has EC values ranging from 341–1039 µS/cm with a median value of 634 µS/cm and, correspondingly, a TDS (Total Dissolved Solids) ranging from 218–665 mg/L with a median value of 406 mg/L (Table 4). The EC of the groundwater is more than twice as high as the EC of the river water. Additionally, chloride concentrations are also much higher, with a median of 30 mg/L.
In Egypt, risks might arise from the land-side part of the aquifer as it is subject to contamination, mainly from the unsecure conventional systems for sewage disposal in villages (latrines and septic tanks) but also from seepage of irrigation water containing nitrogen fertilizers [22]. However, median concentrations for ammonium and nitrate in the groundwater were found to be 0.68 mg/L and 1 mg/L, respectively, and did not indicate groundwater pollution. Maximum ammonium and nitrate concentrations found in the groundwater, at the studied sites, were 1.38 mg/L and 5.7 mg/L, respectively. Total coliform counts in some wells exceeded the drinking water standards. The median value for total coliforms in the River Nile valley aquifer was <1 CFU/100 mL. Besides pathogens and ammonium, primarily iron and manganese concentrations are relevant for water treatment design. Iron and manganese concentrations were found to be 0.012–0.76 mg/L and 0.07–1.0 mg/L, respectively.
3.2. Quality of the Pumped Water from RBF Units Near Luxor and Sohag
At many RBF sites worldwide, seasonal temperature changes in river water and bank filtrates and flow-related changes in EC could be used to estimate the travel times of bank filtrate [23,24]. The temperature curve of River Nile has a comparatively low amplitude, which is not feasible for using temperature as a tracer to determine the travel times of bank filtrates. EC also does not show much fluctuation, except in the maximum values during the low-flow period of December/January. During this period, the water levels change, so the travel times are also affected by the changing gradients in the aquifer. However, the EC values of groundwater and river water differ significantly, offering the potential to use EC measurements to determine the portion of bank filtrates and land-side groundwater in the pumped water and residence times. Chloride concentration measurements might also be used, as described in [25,26]. In any case, installation of an observation well, land-side of the pumping well, is required. In this article, initial EC values and anion concentrations at the start of the well operation were assumed to be representative for groundwater quality and were used for the mixing calculations, as shown in Equation (1), where CPW is the concentration in the pumped well water, CRiver is the concentration in river water, and CGW is the concentration in groundwater.
Portion of bank filtrate in % = (CPW − CRiver)/(CGW − CRiver) × 100
The removal of organic compounds is relevant for the dissolution and release of iron and manganese along the flow path and for the required post-treatment and to inhibit the potential formation of disinfection by-products. The total organic carbon (TOC) concentration in River Nile ranges from 2.1 to 3.2 mg/L (Table 4), and has a median similar to that of the River Danube at Budapest [24], and about half of the concentration in the River Elbe [23]. Despite the low input concentration, the removal rate for TOC is relatively high, with about a 56% median and up to 62% at the RBF site Eltawael (site T), Sohag. As the samples were taken from the production well, the decrease in the TOC concentration could also be affected by a portion of land-side groundwater, presumably having a lower TOC than river water.
3.3. Water Quality Changes during the Initial Phase of RBF near Luxor and Sohag
Figure 5, Figure 6, Figure 7, Figure 8, Figure 9, Figure 10, Figure 11, Figure 12, Figure 13 and Figure 14 show water quality changes during the initial phase of RBF operation for the three sites in Upper Egypt.
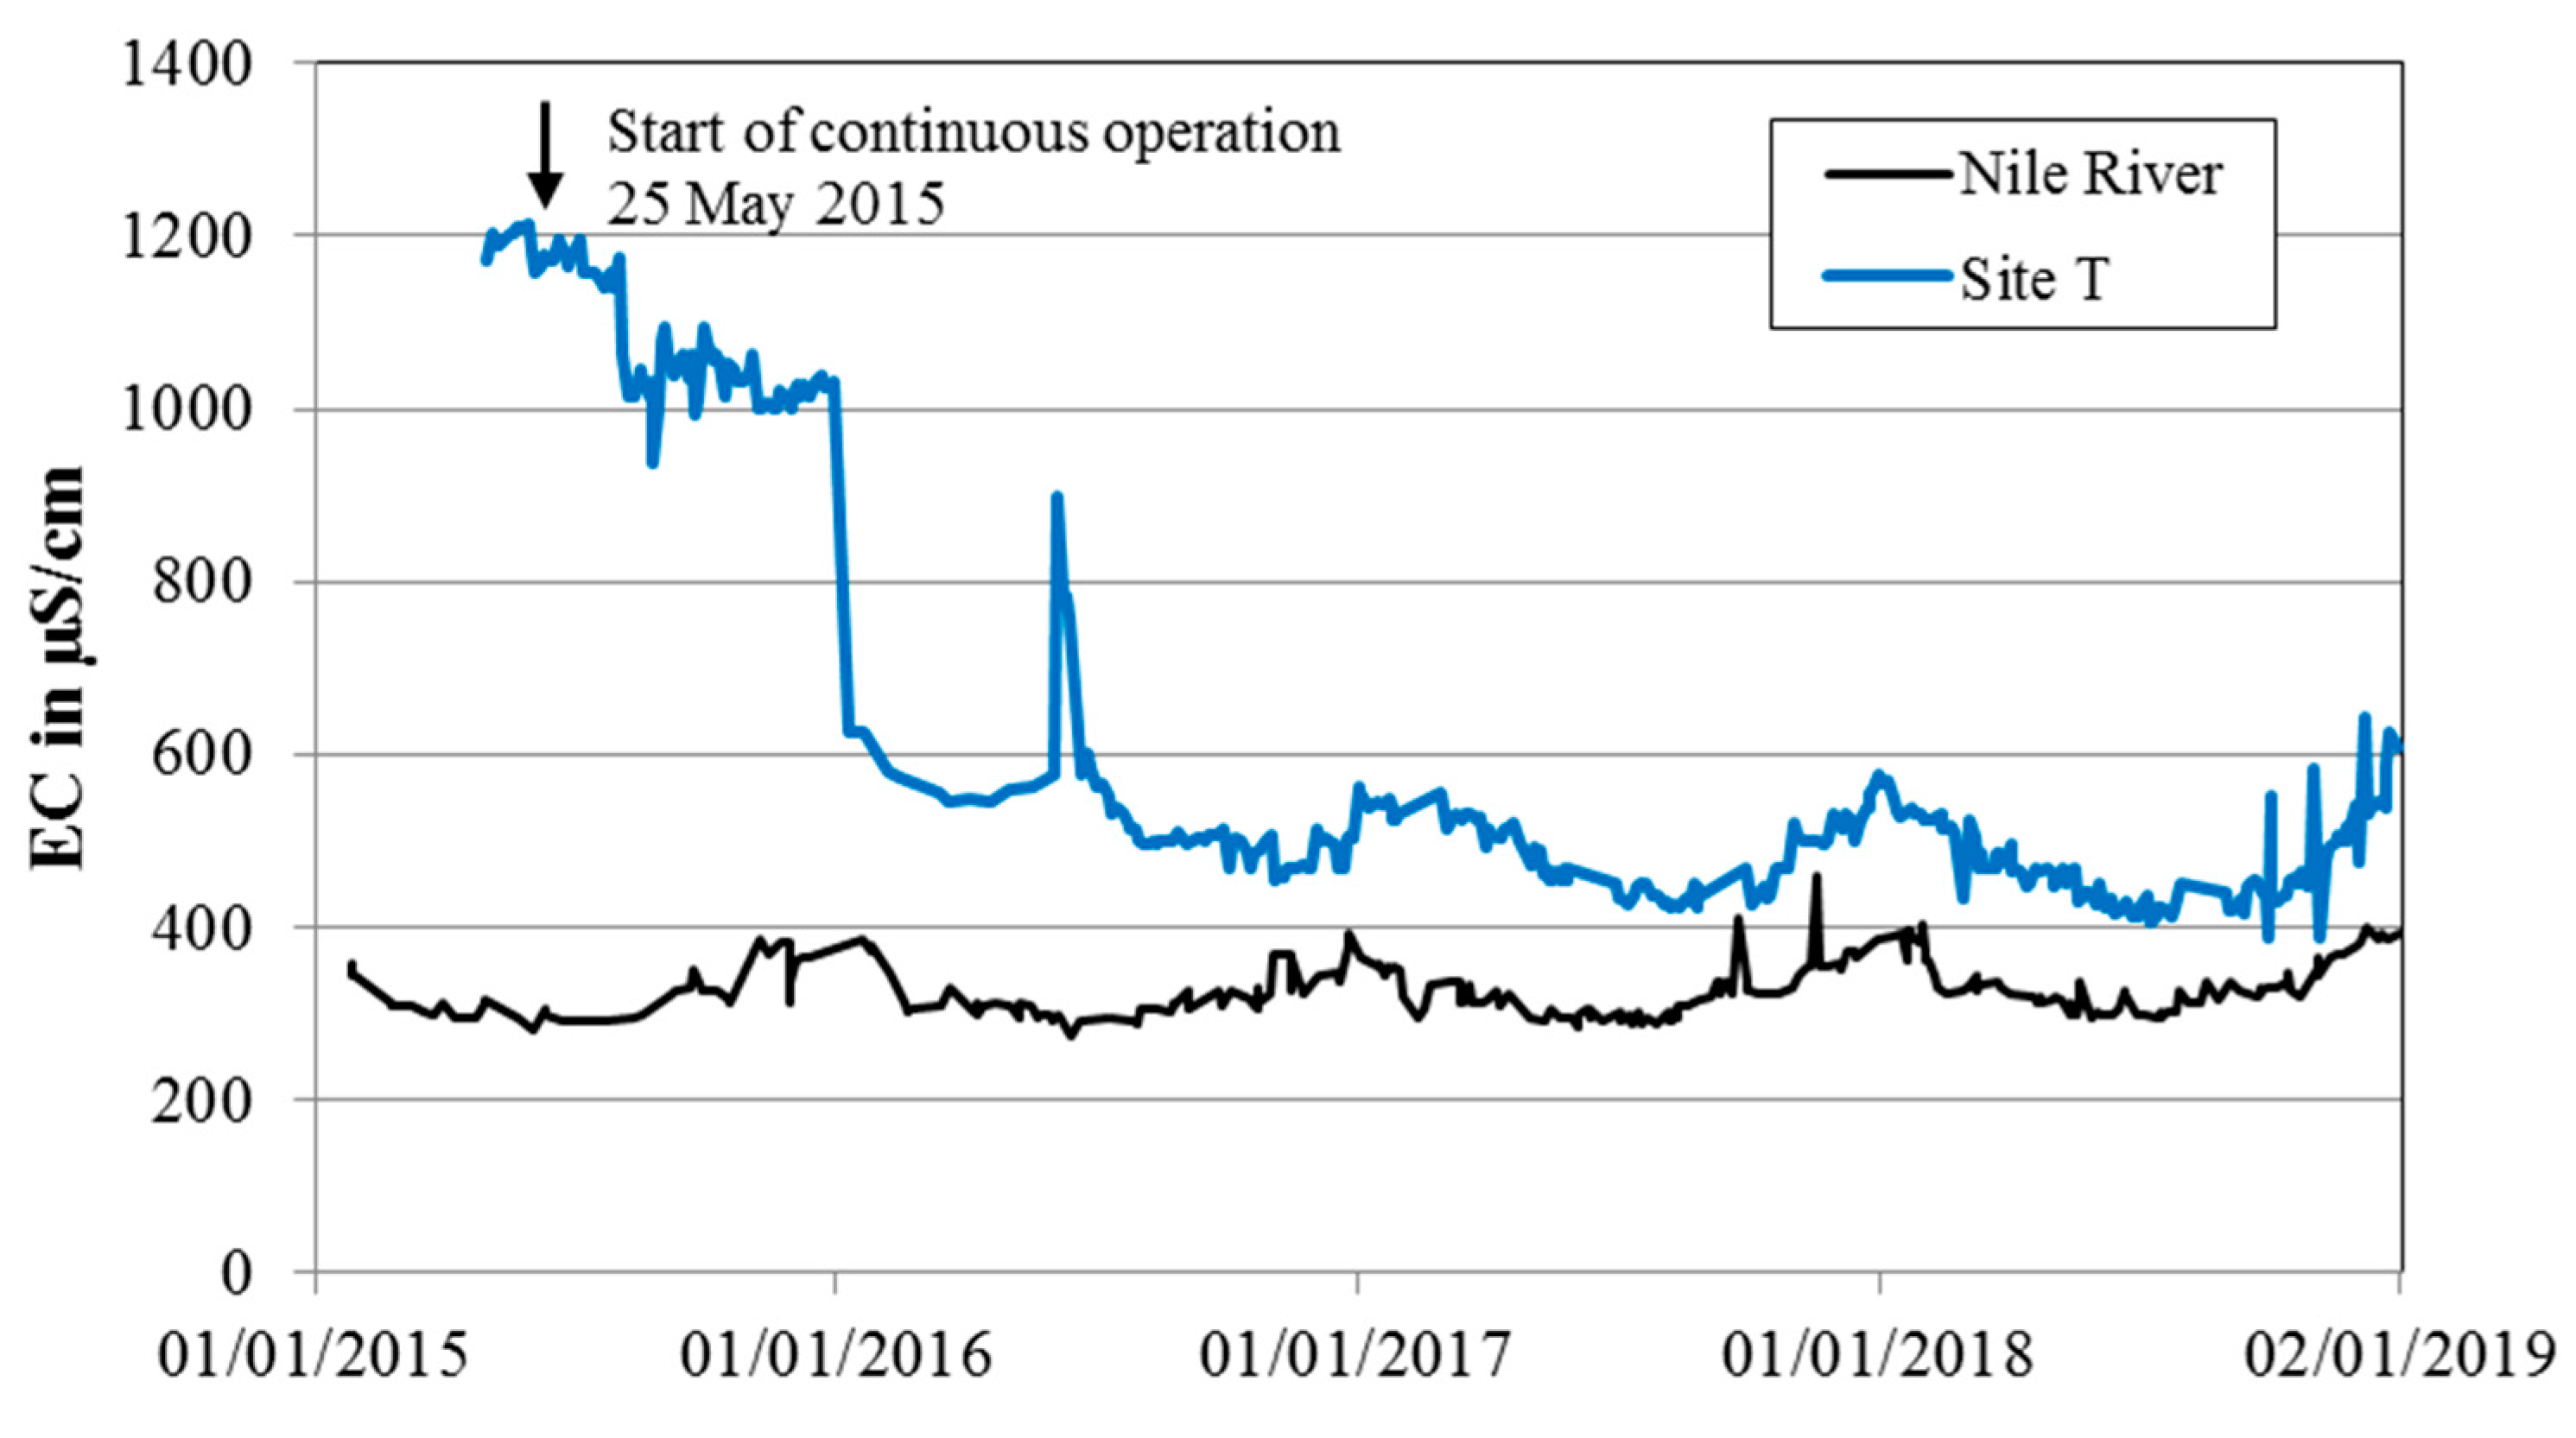
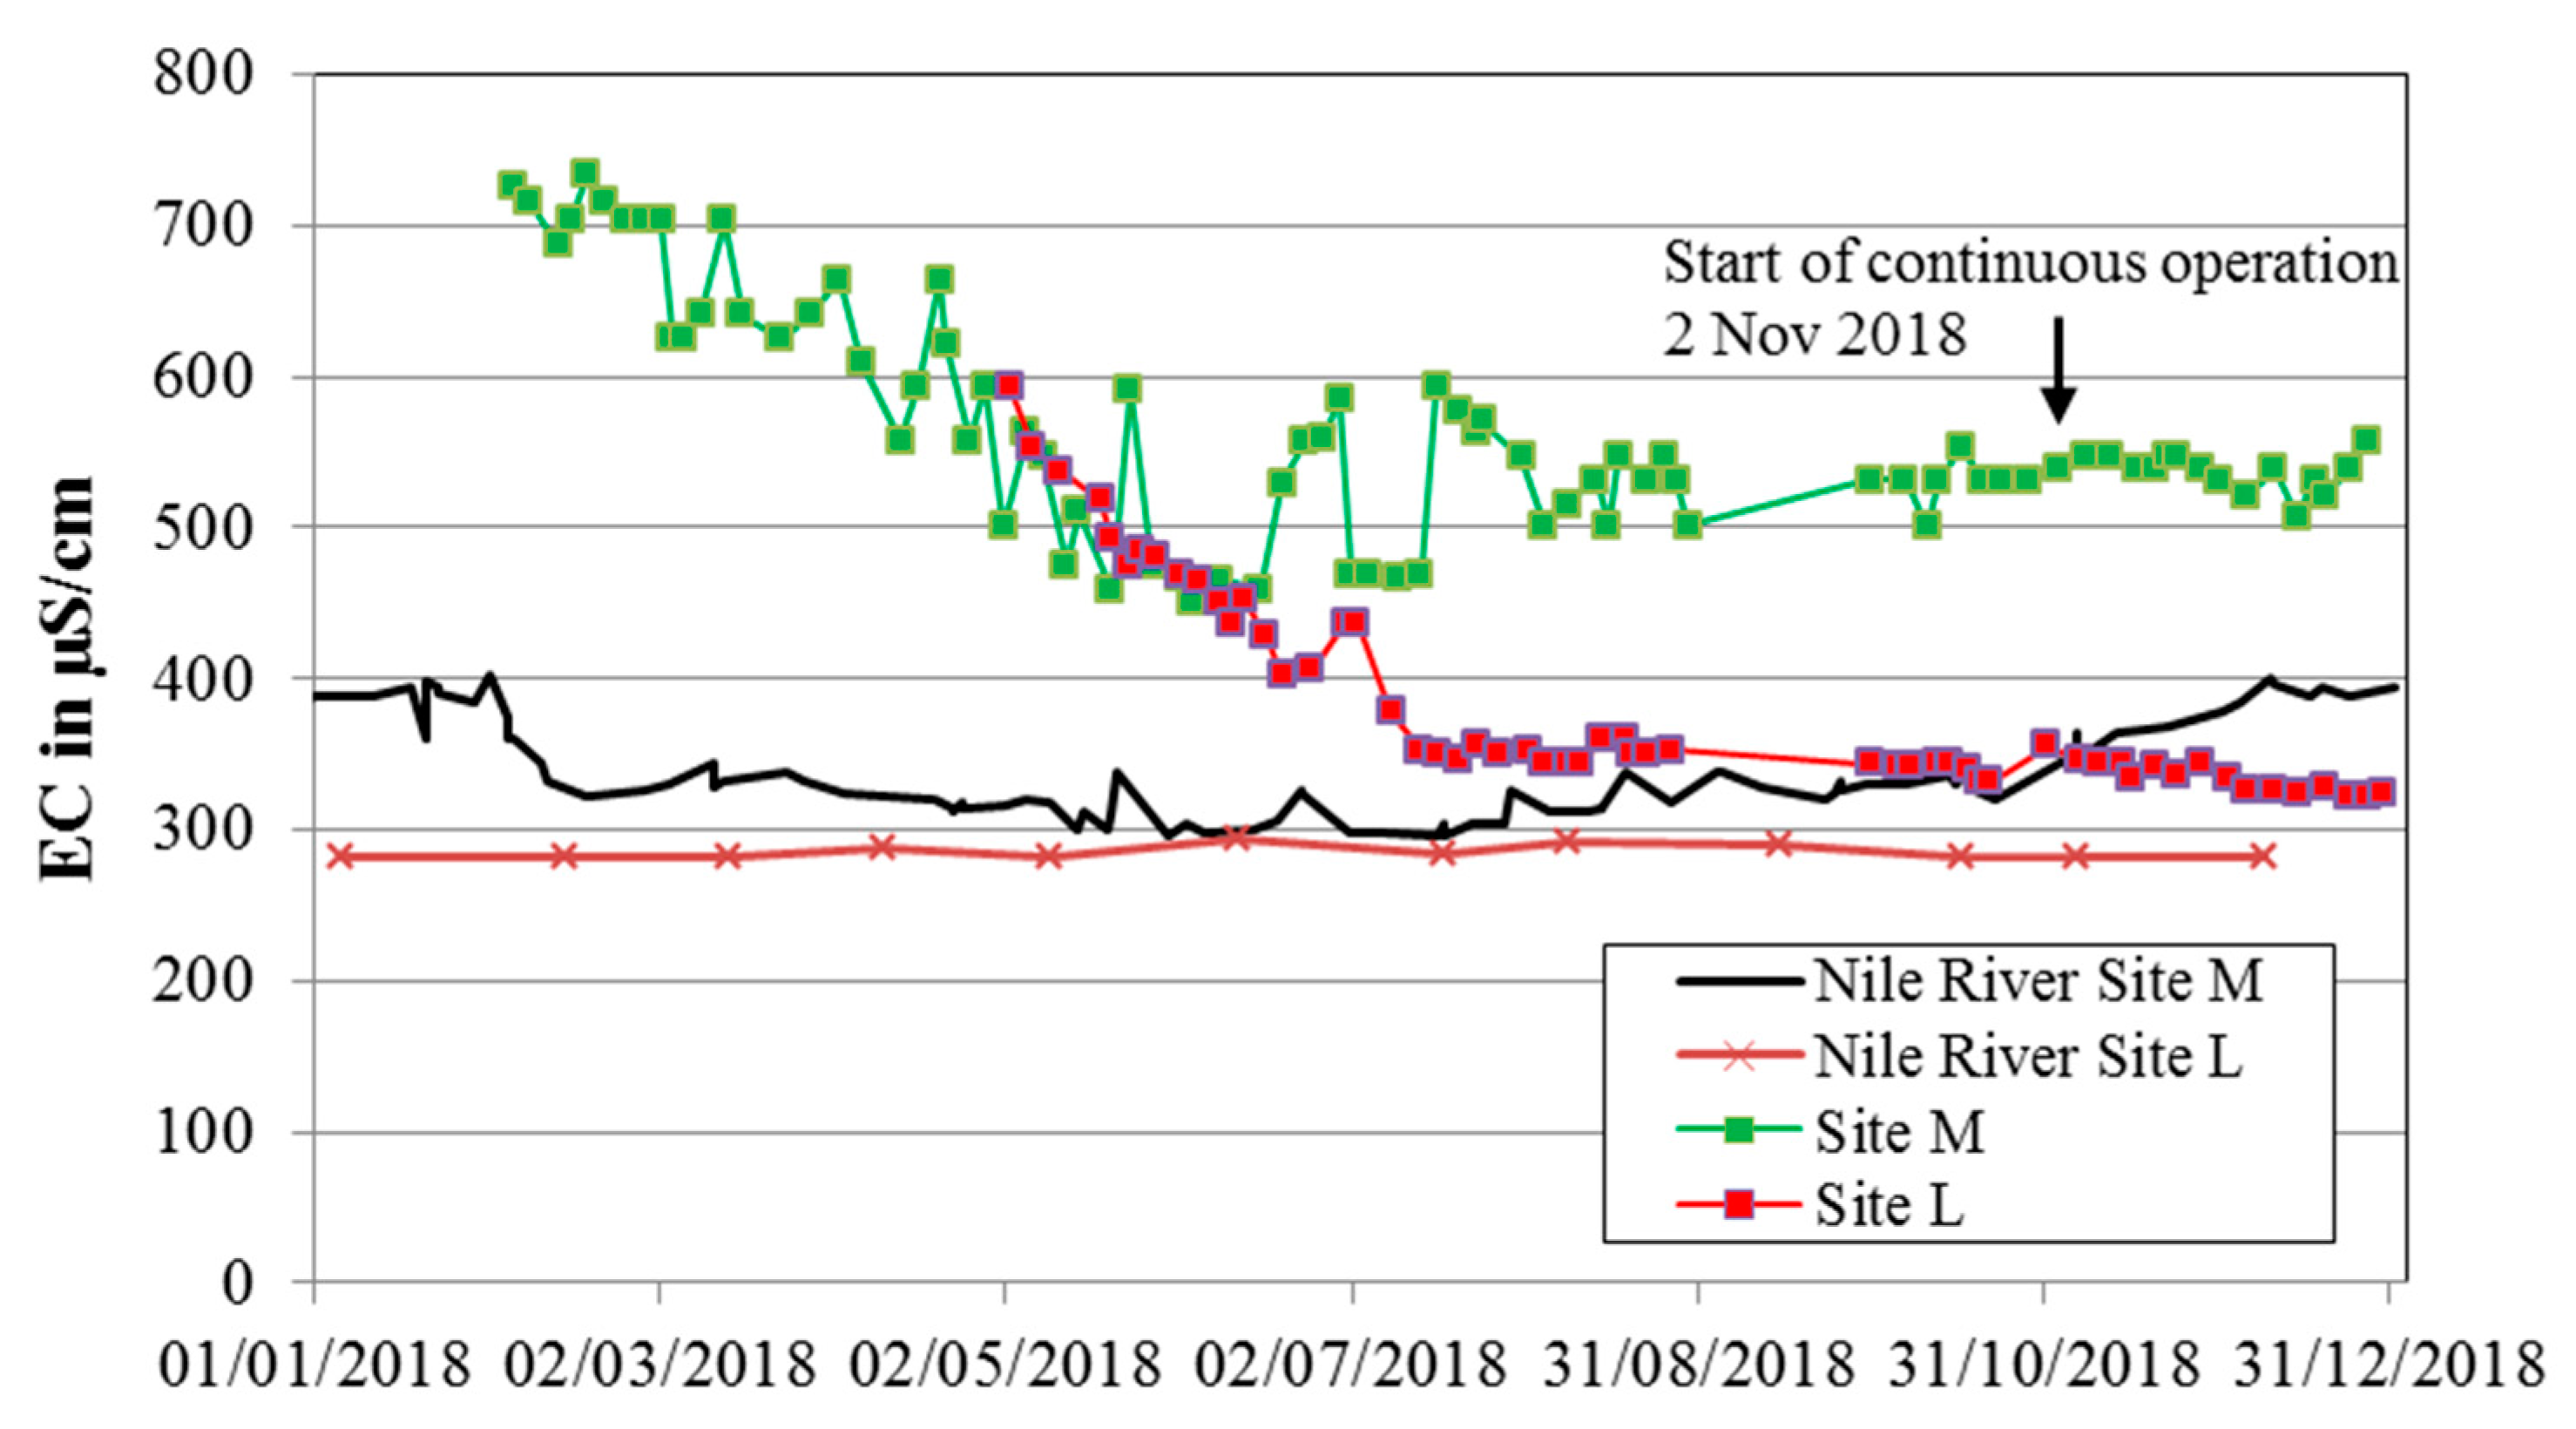
According to electric conductivity (EC) values (Table 4) the portion of bank filtrate is highest at the RBF site Alsaayda near Luxor (site L). Assuming that the EC value of 594 µS/cm in the first portion of the pumped water in May 2018, after the installation of wells, and an EC for River Nile water of 283 µS/cm (median from 2018, n = 12) were sufficiently representative to be used in the mixing calculations, the bank filtrate portion was more than 80% in the pumped RBF well water. At the other two sites at Sohag, the portion of bank filtrate was lower on average, with up to 80% at site T and about 50% at site M. Figure 5 and Figure 6 show that the EC of the pumped water decreased with time, indicating an increasing portion of bank filtrate. This effect was most obvious for site T, where first, the groundwater was pumped and later a mixture of the groundwater and bank filtrate was pumped. A short peak in June 2016 indicated the effect of a short pause in pumping, which caused land-side groundwater flow towards the river, resulting in a high portion of groundwater with a high EC, after a restart of pumping (Figure 5).
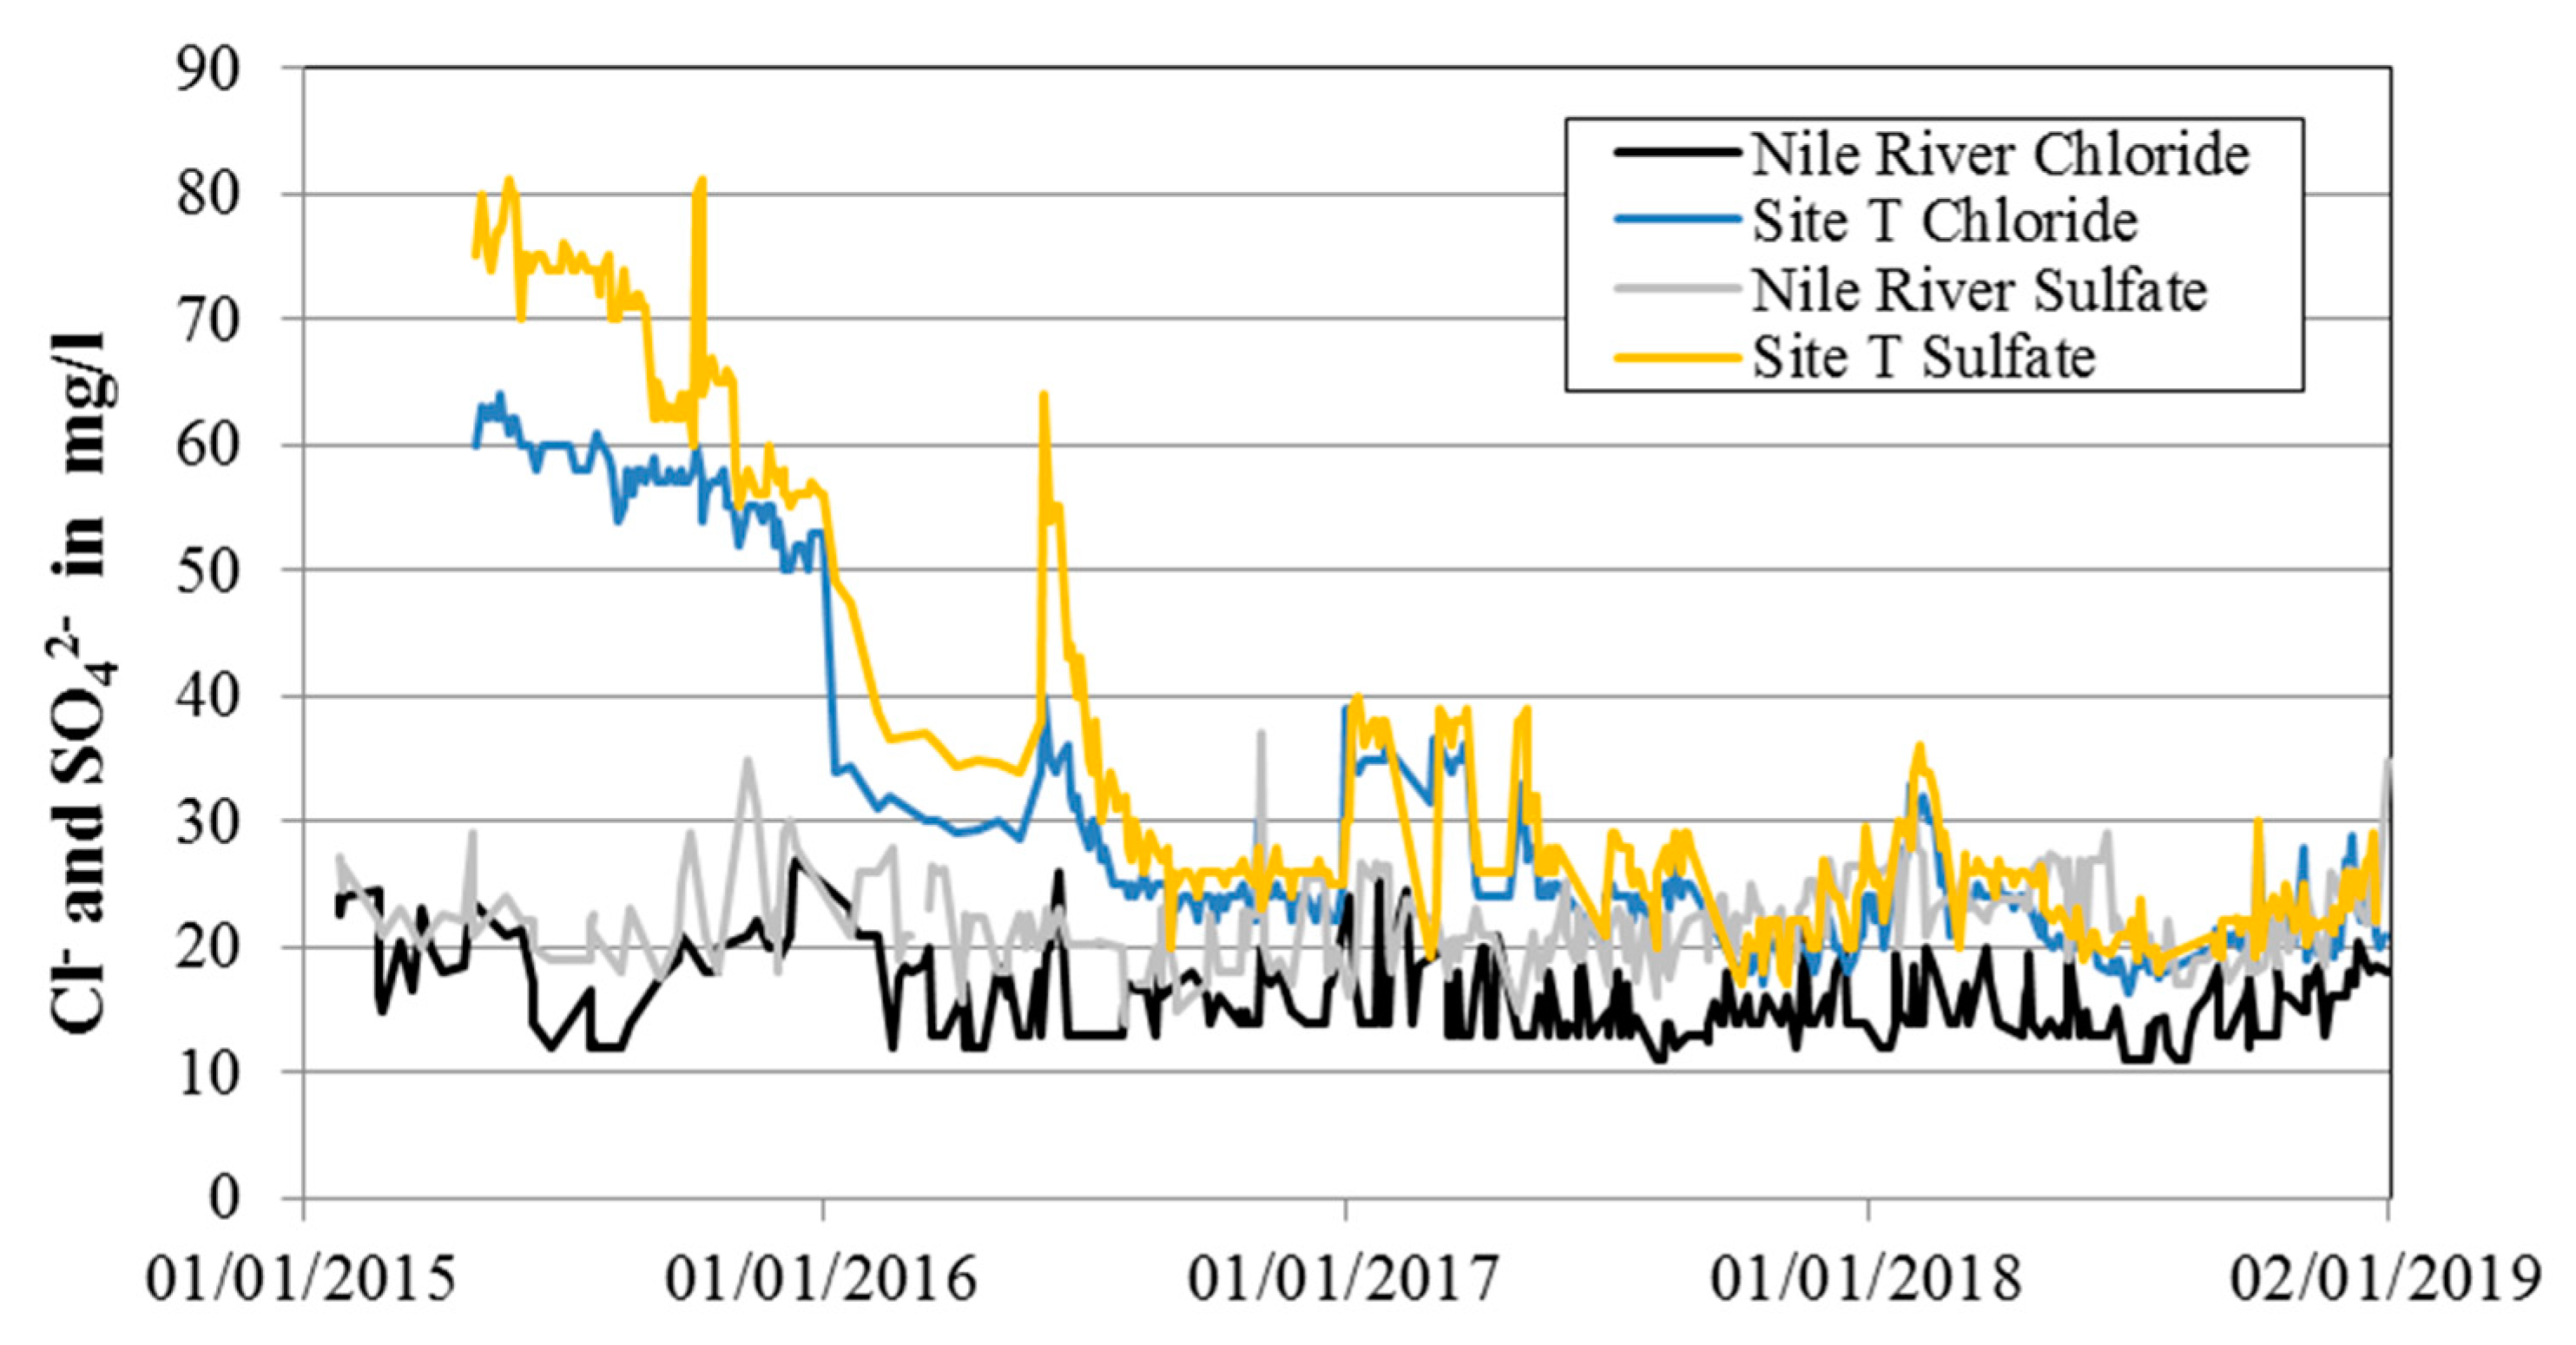
Chloride, bromide, and iodide are conservative water constituents and can be used for the mixing calculations and to identify the water origin, with less ambiguity than other dissolved species [25]. The median chloride concentration of the river water was 15 mg/L. The initial chloride concentration of about 62 mg/L showed that the median chloride concentration given in Table 4 for ambient groundwater did not apply for site T. The chloride concentration in the pumped water at site T started at about 62 mg/L, and decreased after 30 weeks to about 30 mg/L, and later to a minimum of 16 mg/L (Figure 7, Table 4). This was in agreement with the observed changes in EC (Figure 5) and sulfate concentration (Figure 7). When the bank filtrate arrived at the well and comprised a major portion of the pumped water, the EC, chloride, and sulfate concentrations dropped. The time period of 30 weeks underlined that it might take months until the wells can truly abstract a certain portion of bank filtrate. The calculated portion of the pumped bank filtrate at site T (based on the calculations using the EC values) was supported by a calculation based on chloride concentrations. Taking 62 mg/L chloride for ambient groundwater, 15 mg/L as a reliable median for the river water (Table 4), and about 20 mg/L for the pumped water (Figure 7), the portion of bank filtrate would be about 90% at site T. This, in turn, underlined >50% stable removal of TOC during riverbank filtration at site T.
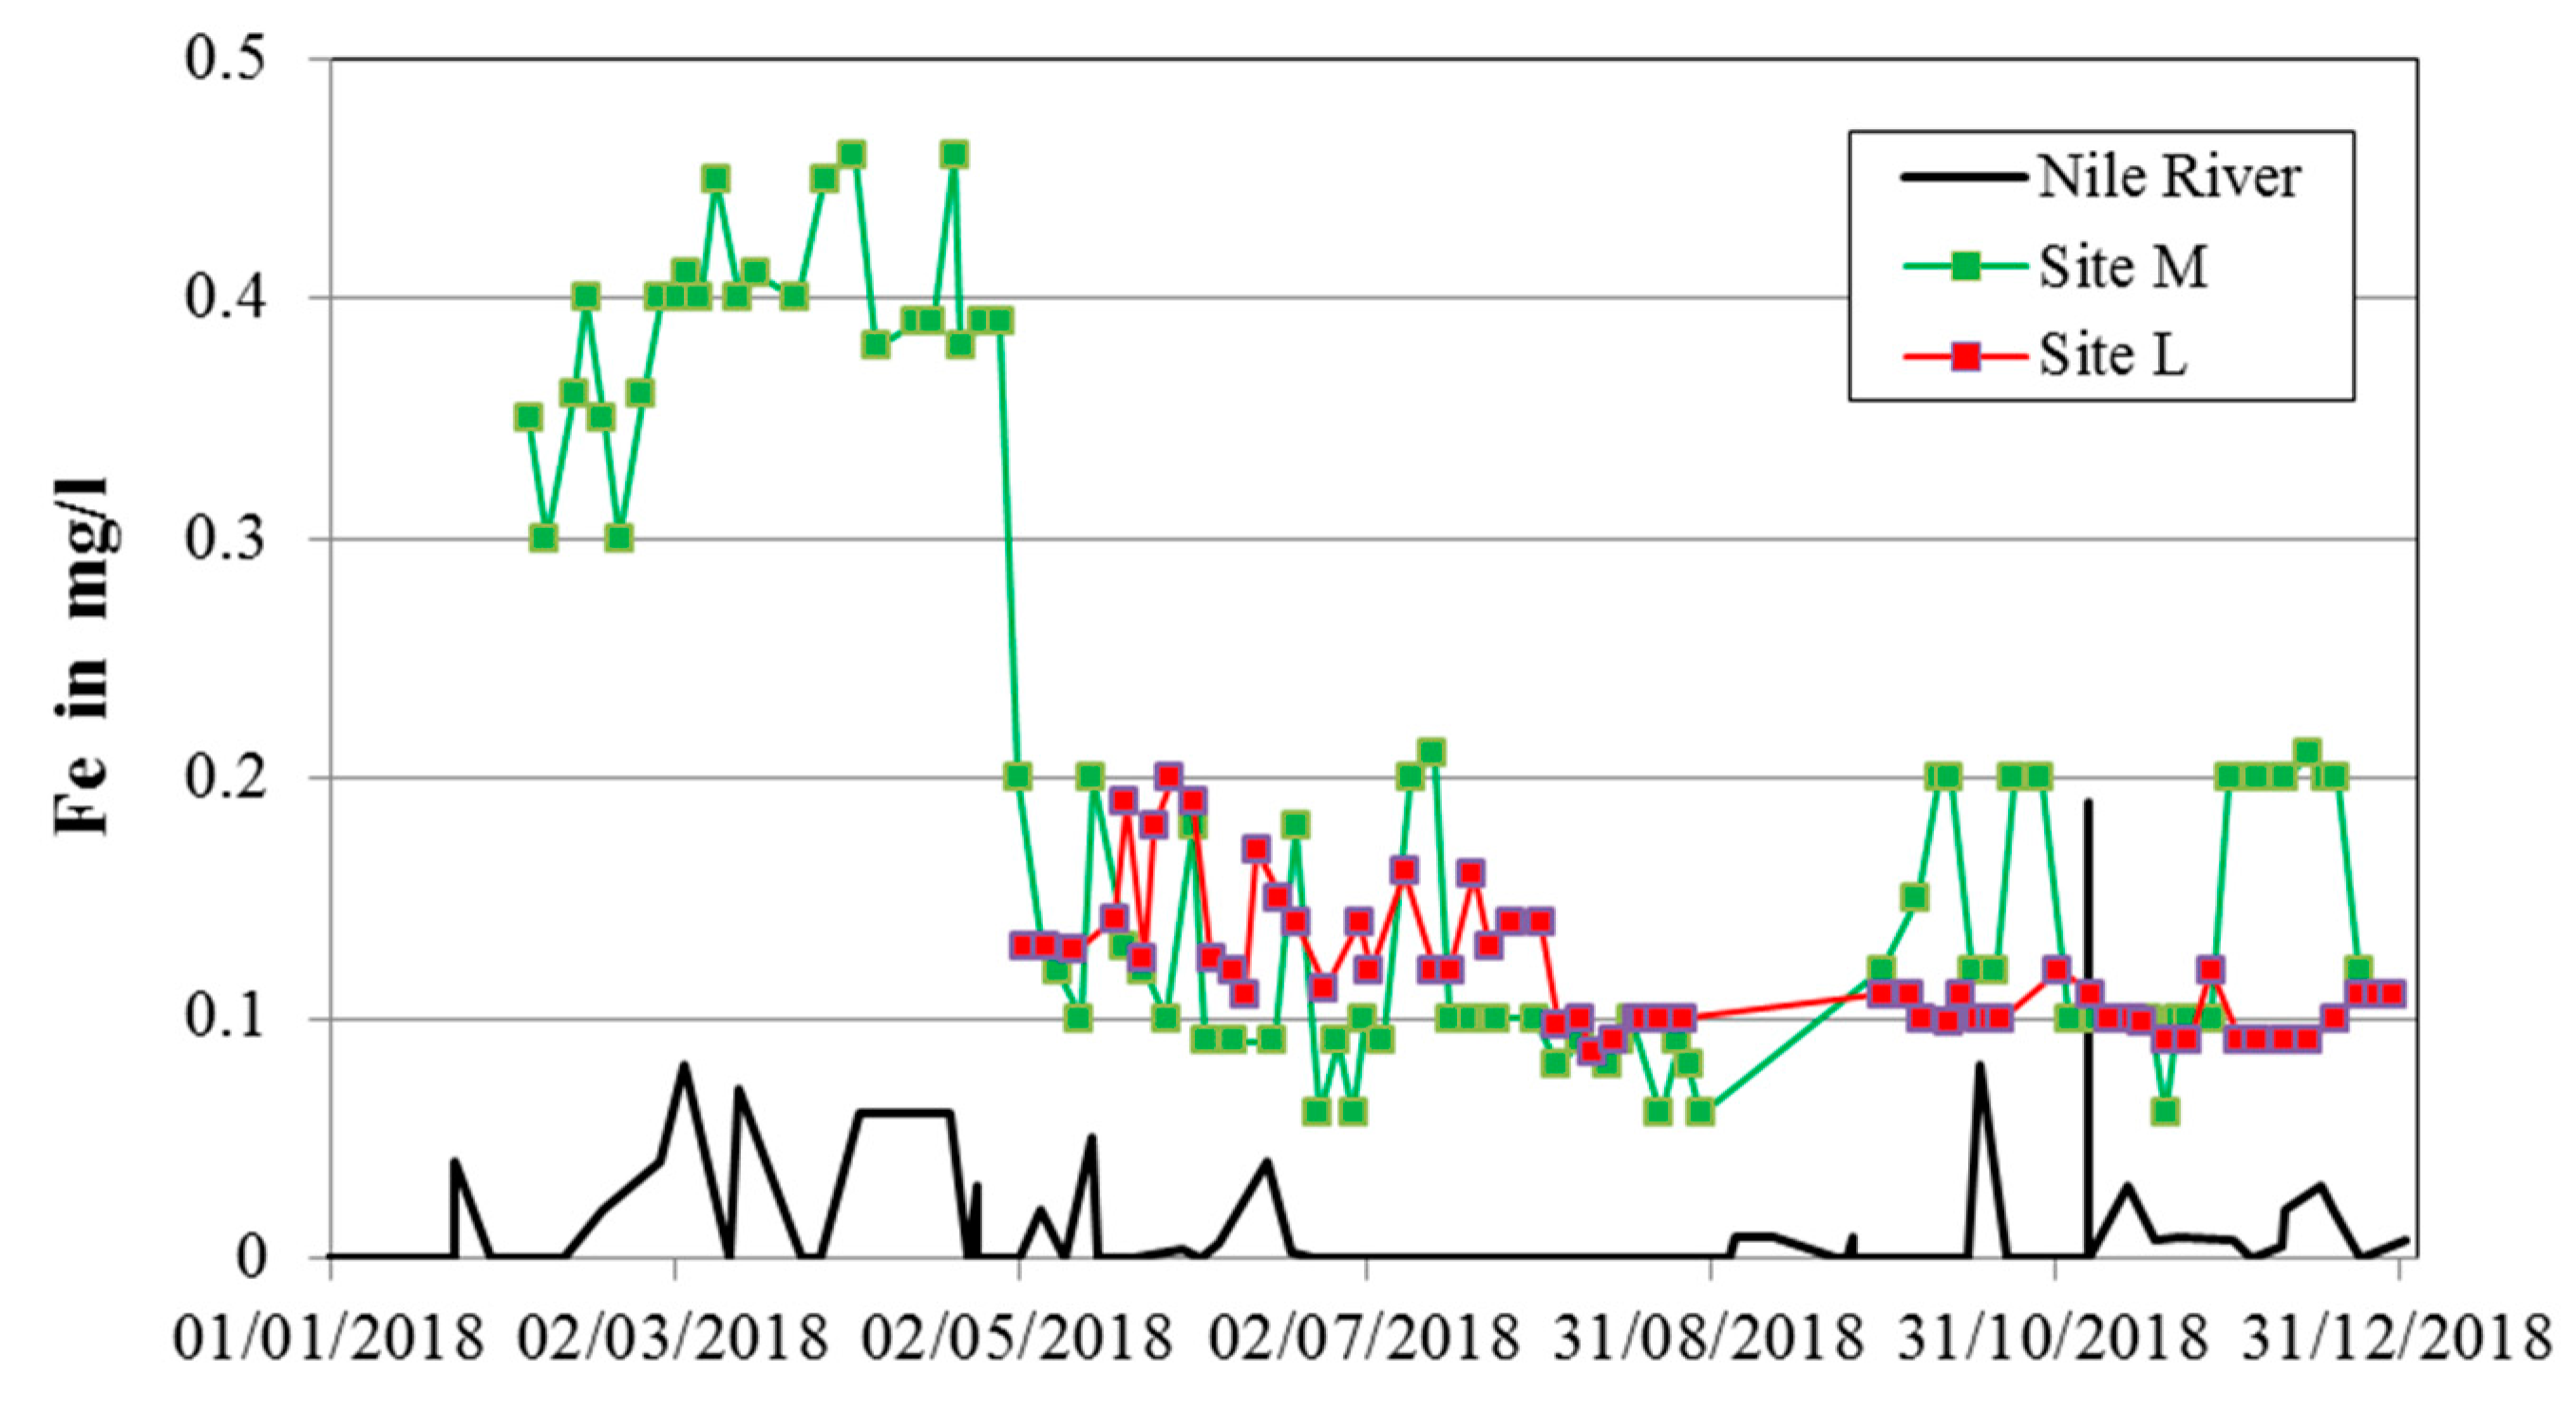
The observed decrease in EC was in agreement with a delayed decrease in Fe and Mn concentration in the pumped water (Figure 8, Figure 9 and Figure 10). The delay could be caused by cation exchange processes along the flow path, but was not too long because the distance between the wells and the river was quite short. There were many little peaks where Fe was about 0.1 mg/L higher than the average base line. This might be caused by the discontinuous operations of some wells at the sites. If the pumping was stopped, the land-side groundwater flowed towards the river, filling part of the aquifer between the wells and the river bank. If the pumps were switched on again, the groundwater was pumped back, causing a short-term increase in Fe and Mn concentration in the pumped water, before the average mixing determined the metal concentration. Thus, it is of utmost importance to continuously operate the RBF units (24/7).
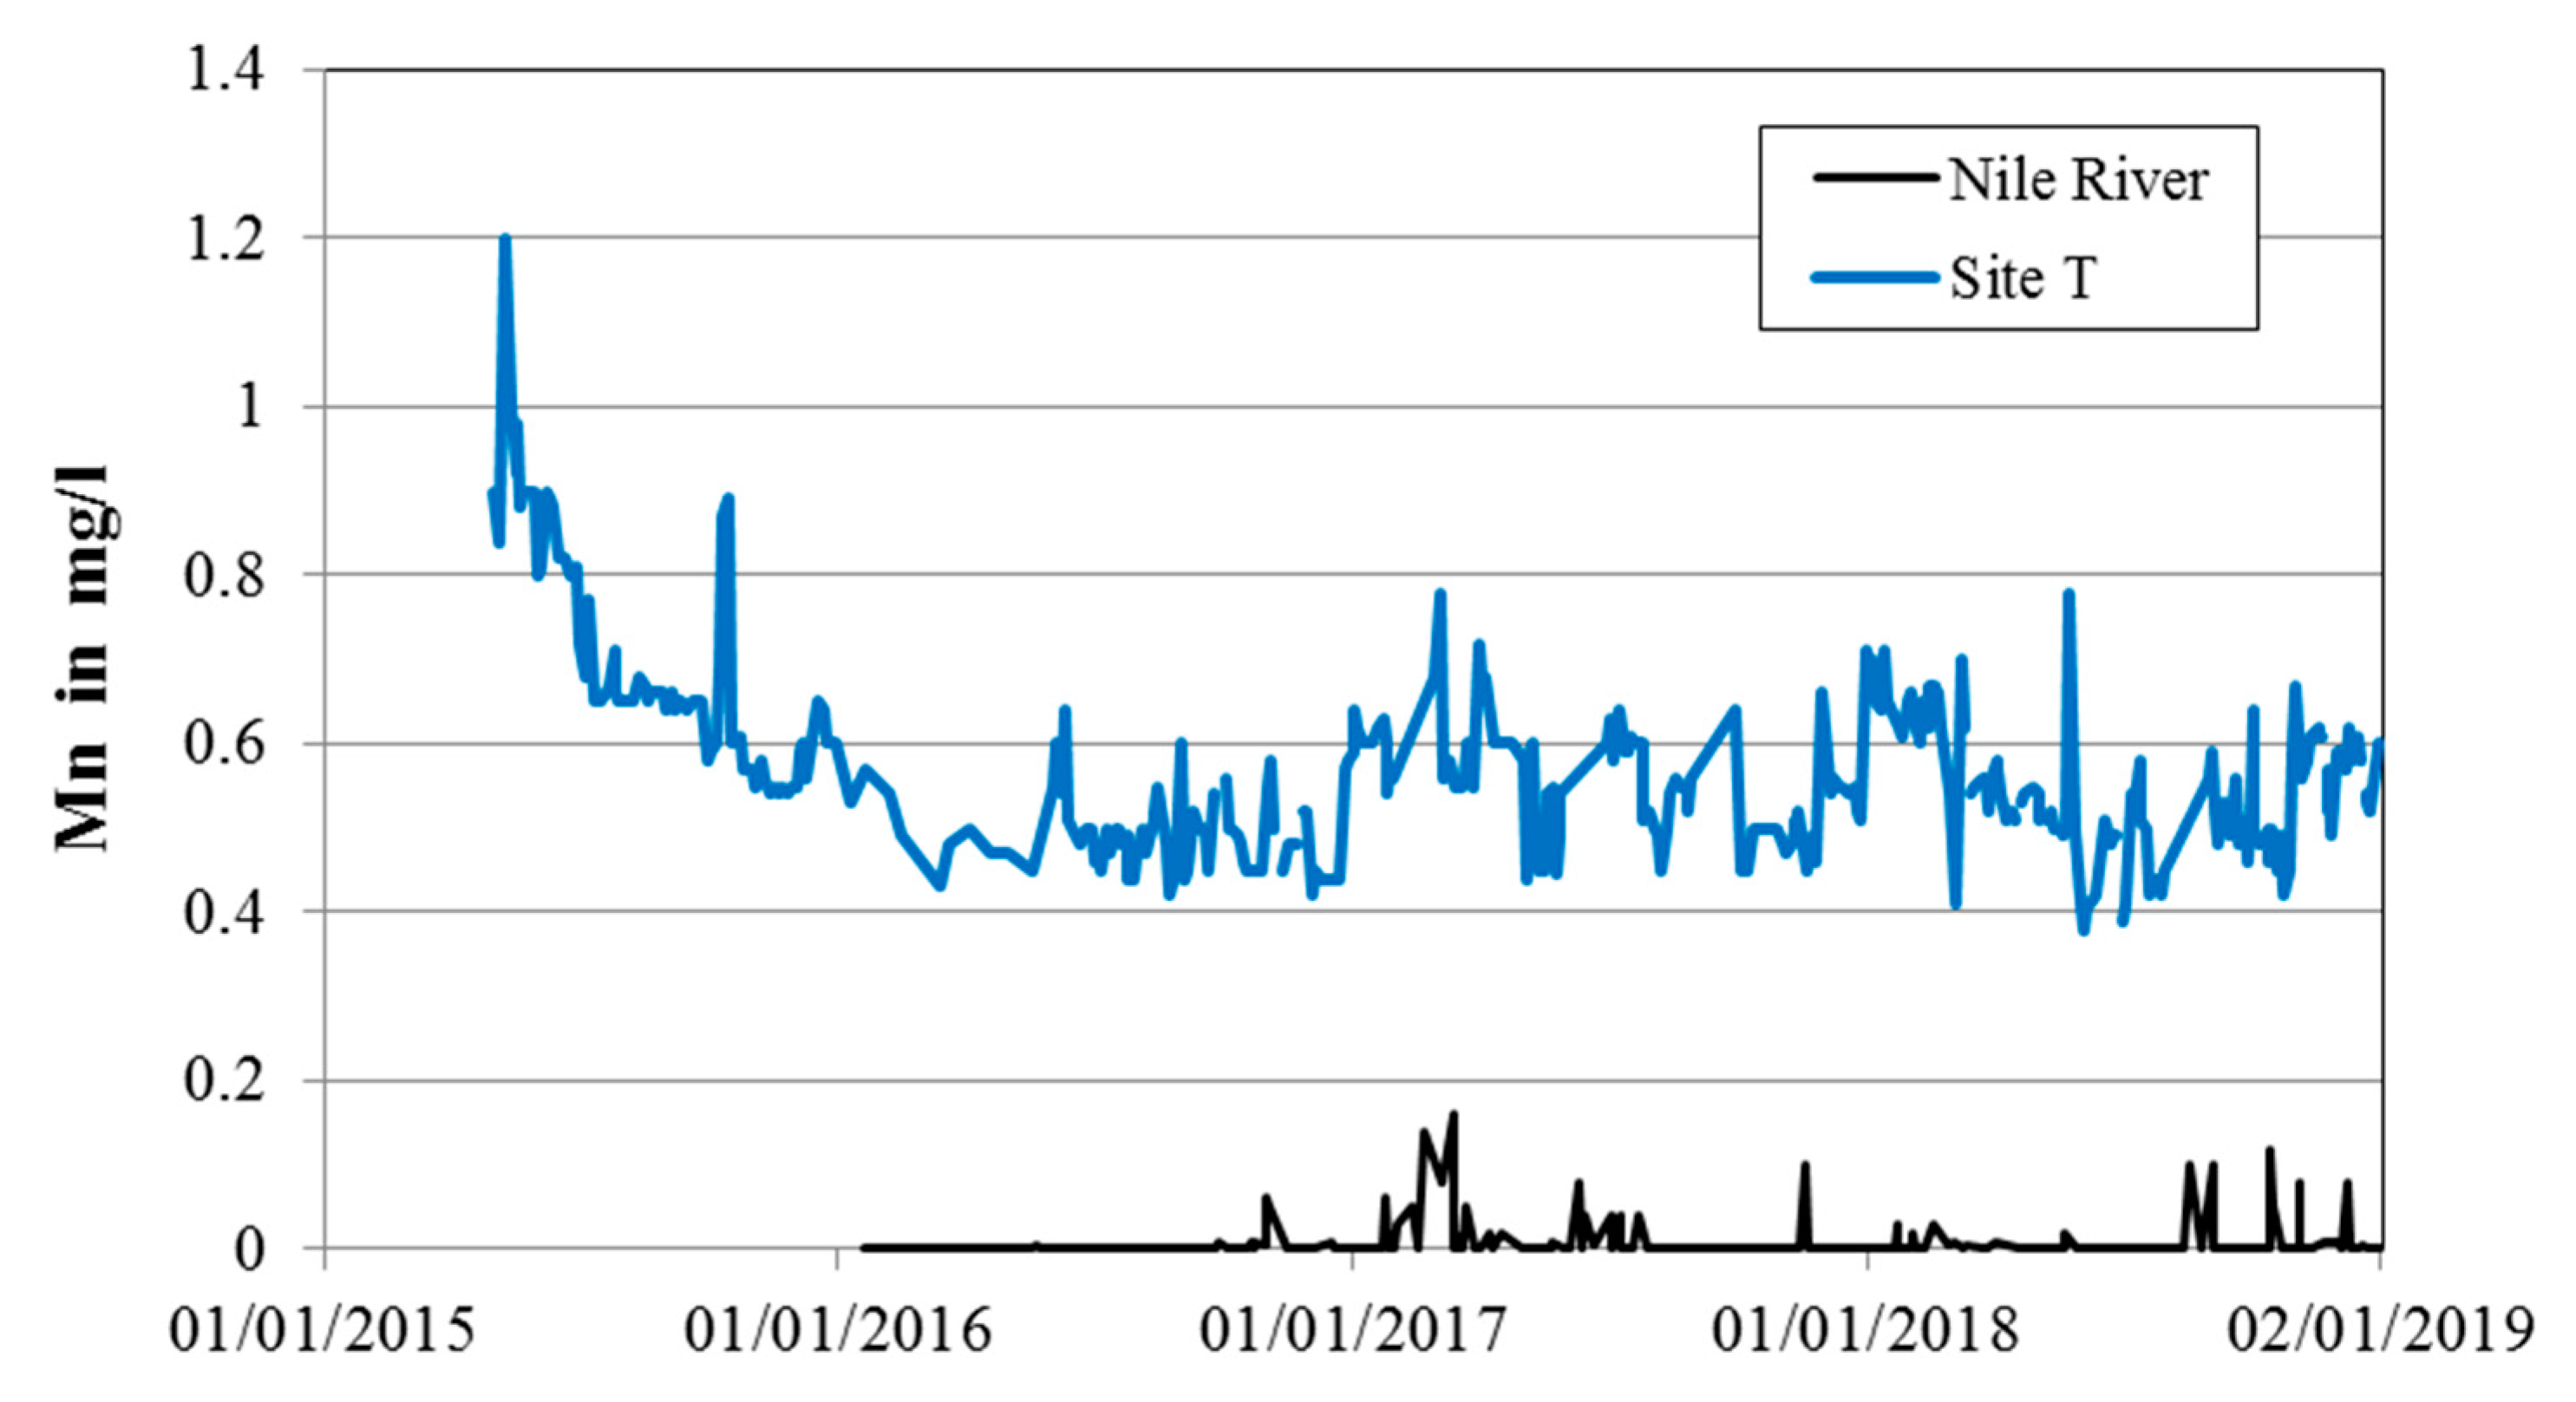
The final Fe and Mn concentration depended on the mixing ratio (portion of pumped groundwater commonly having high Fe and Mn concentration) and the redox-dependent Fe and Mn concentration of the bank filtrate. The latter is determined by the river water quality, the composition of the riverbed and the redox conditions within the aquifer [17,18,27,28]. After starting the operations of new RBF wells, the Fe and Mn concentration in the pumped water changed. An optimal case would be a low portion of land-side groundwater and oxic conditions in the aquifer between the river and the wells. The TOC concentration in River Nile water was not very high and would not result in strongly anaerobic conditions in the aquifer, if e.g., 50% of the TOC was oxidized, resulting in an equivalent oxygen demand. At many RBF sites, fine particles settling on the riverbed contributed to the degradable organic carbon and oxygen demand [29]. As there was very little nitrate in the river water (median 1.5 mg/L, Table 4), denitrification was of minor importance for the redox conditions at the RBF sites in Upper Egypt. Consequently, Mn concentrations in the bank filtrate might have increased. Mn concentrations at Sohag, site T (Figure 9) were slightly above the permissible limit of 0.4 mg/L, according to the Egyptian drinking water standard, but Fe concentrations were below the permissible limit of 0.3 mg/L. The WHO (2006) has no specific standards for iron concentration but has a guideline value of 0.4 mg/L for Mn.
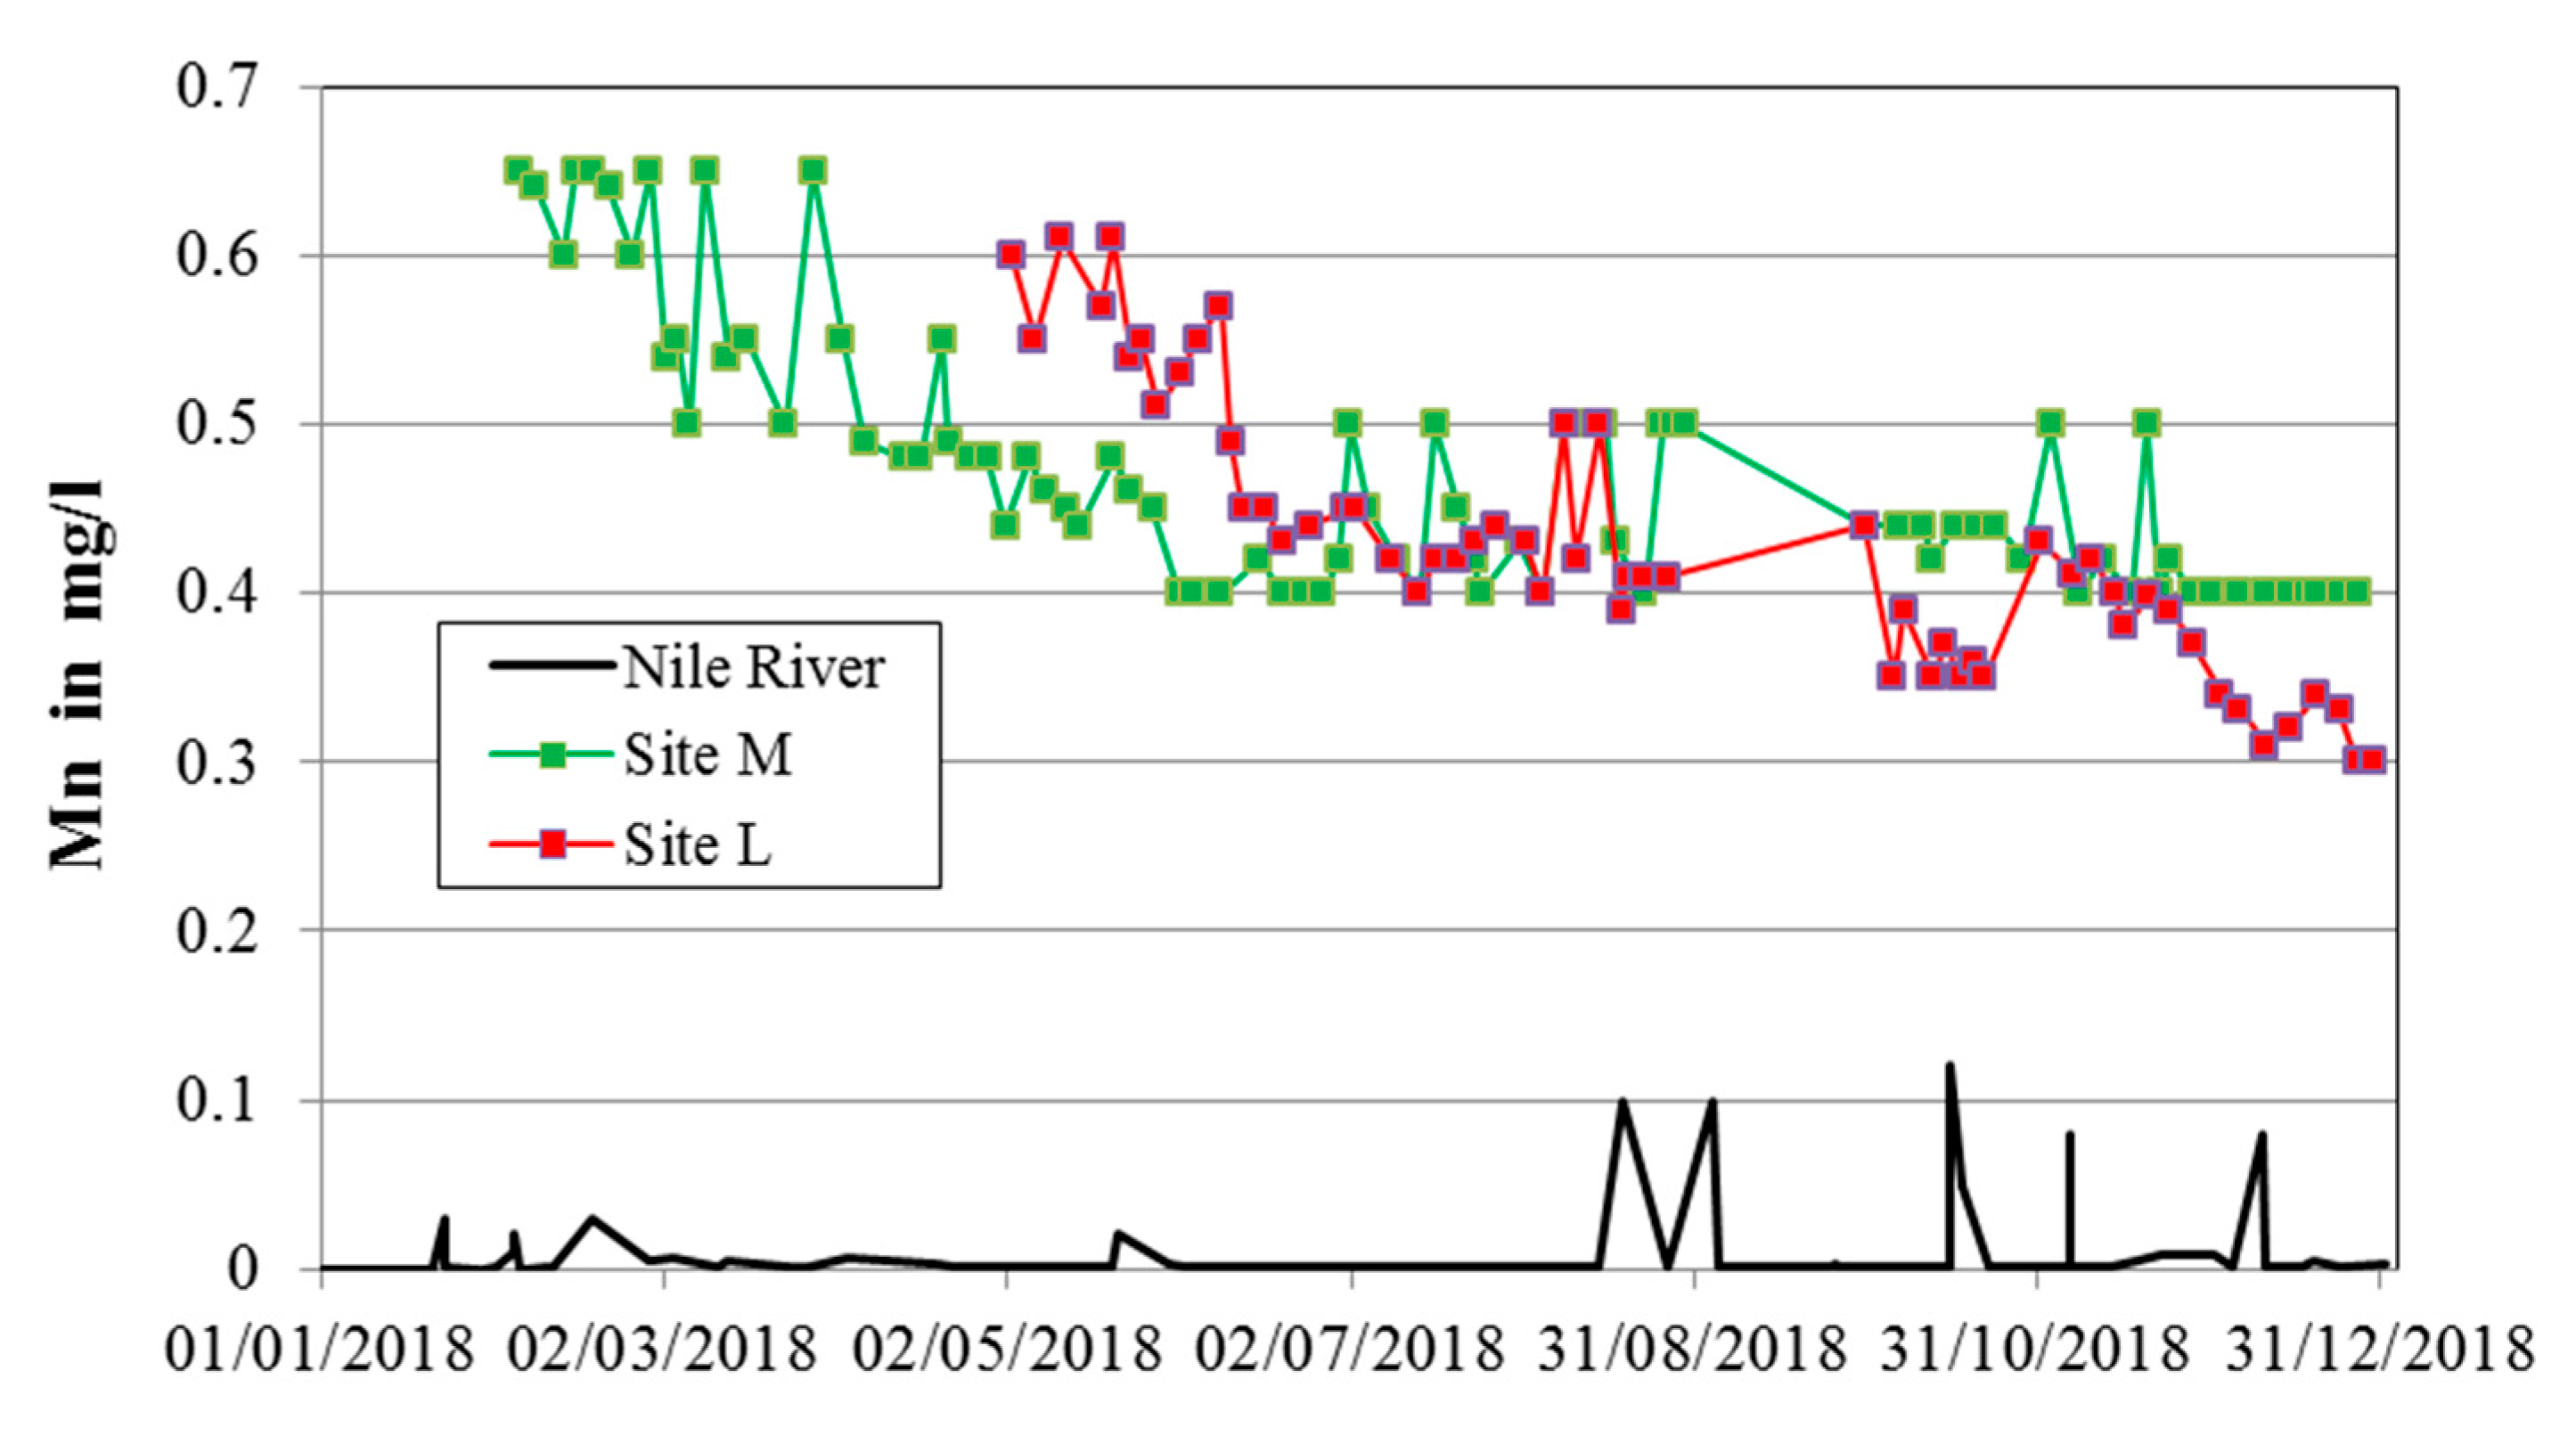
The lowest final Mn concentration was observed at site L near Luxor (Figure 10), where the portion of bank filtrate was the highest and nearly continuous operation was ensured. This indicated that continuous operations and a short residence time of bank filtrates in the riverbed and the aquifer prevented the release of Mn due to redox processes along the flow path.
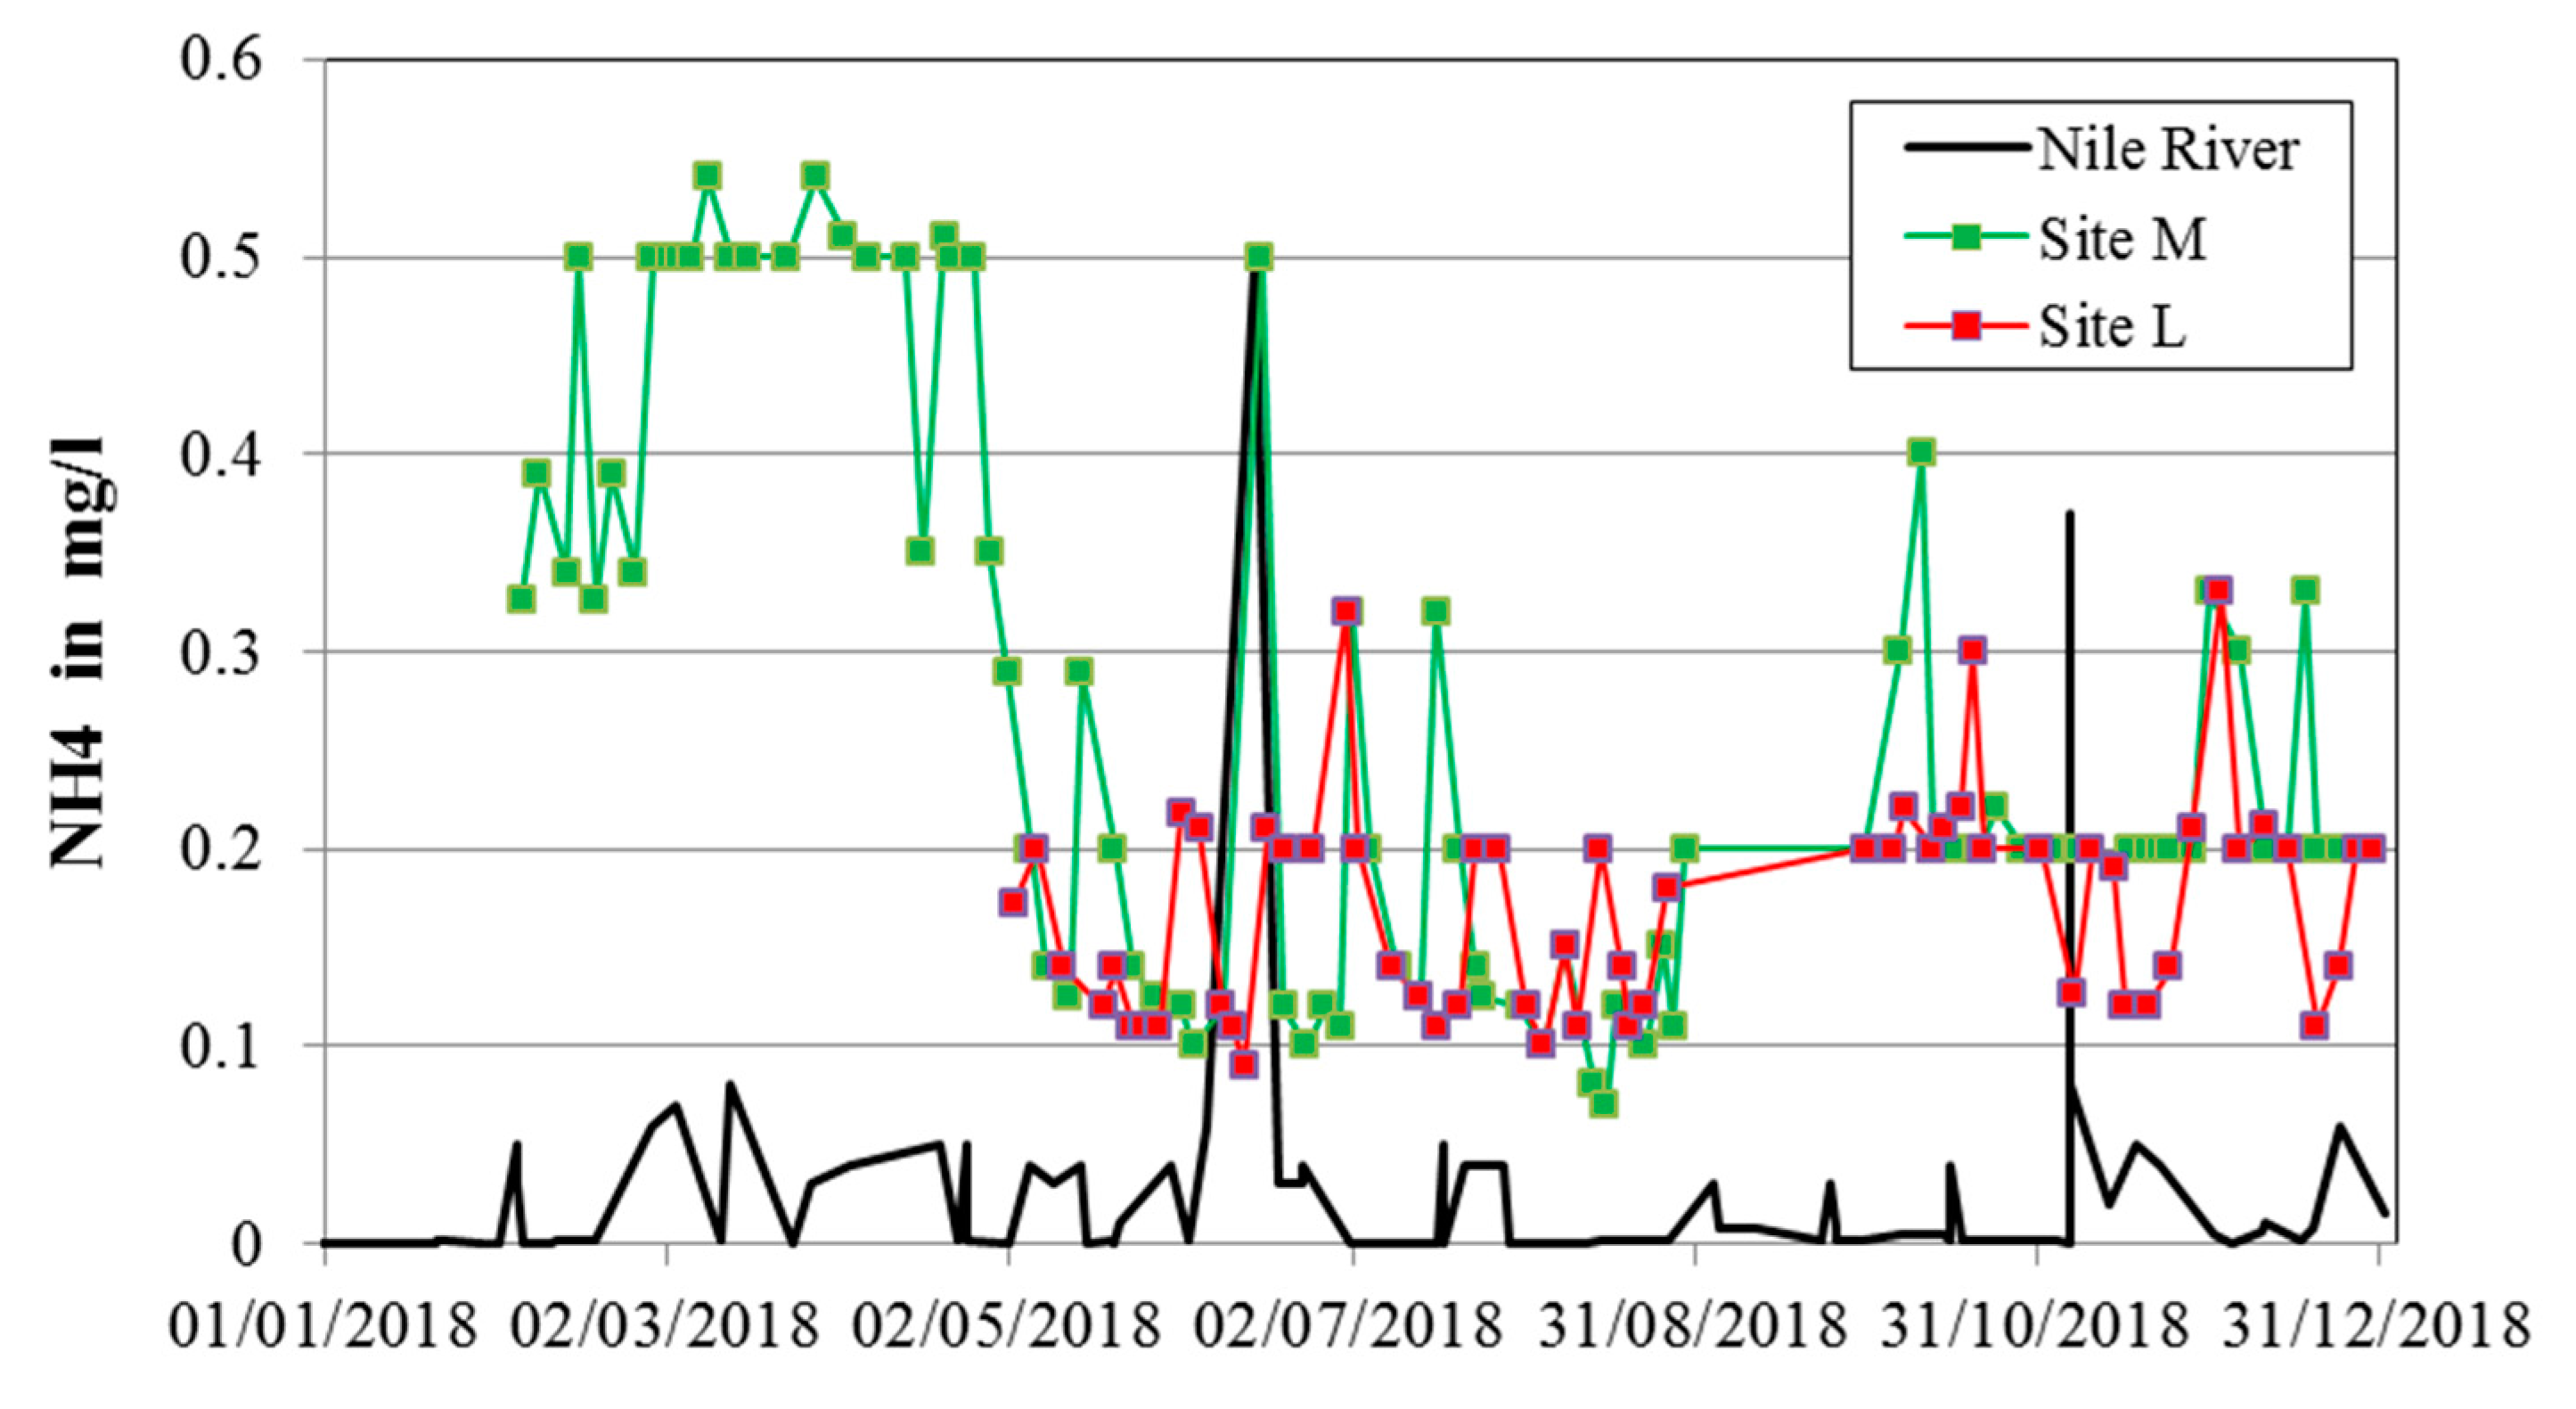
Figure 11 shows a decrease in ammonium concentration in the pumped well water at Sohag, site M. Here, RBF resulted in lower ammonium concentrations compared to the abstraction of groundwater. Ammonium concentration in groundwater at site L near Luxor was already lower. At Sohag, site T, the initial ammonium concentration was 0.5 mg/L, the same as at site M, decreasing to about 0.1 mg/L in 2017, and afterwards fluctuating between 0.05 and 0.4 mg/L, with a median of 0.12 mg/L in 2018. After the initial phase, all data were below the permissible limit of 0.5 mg/L for ammonium, according to the Egyptian Drinking Water Standard. The final ammonium concentrations of 0.1–0.2 mg/L did not cause problems during disinfection.
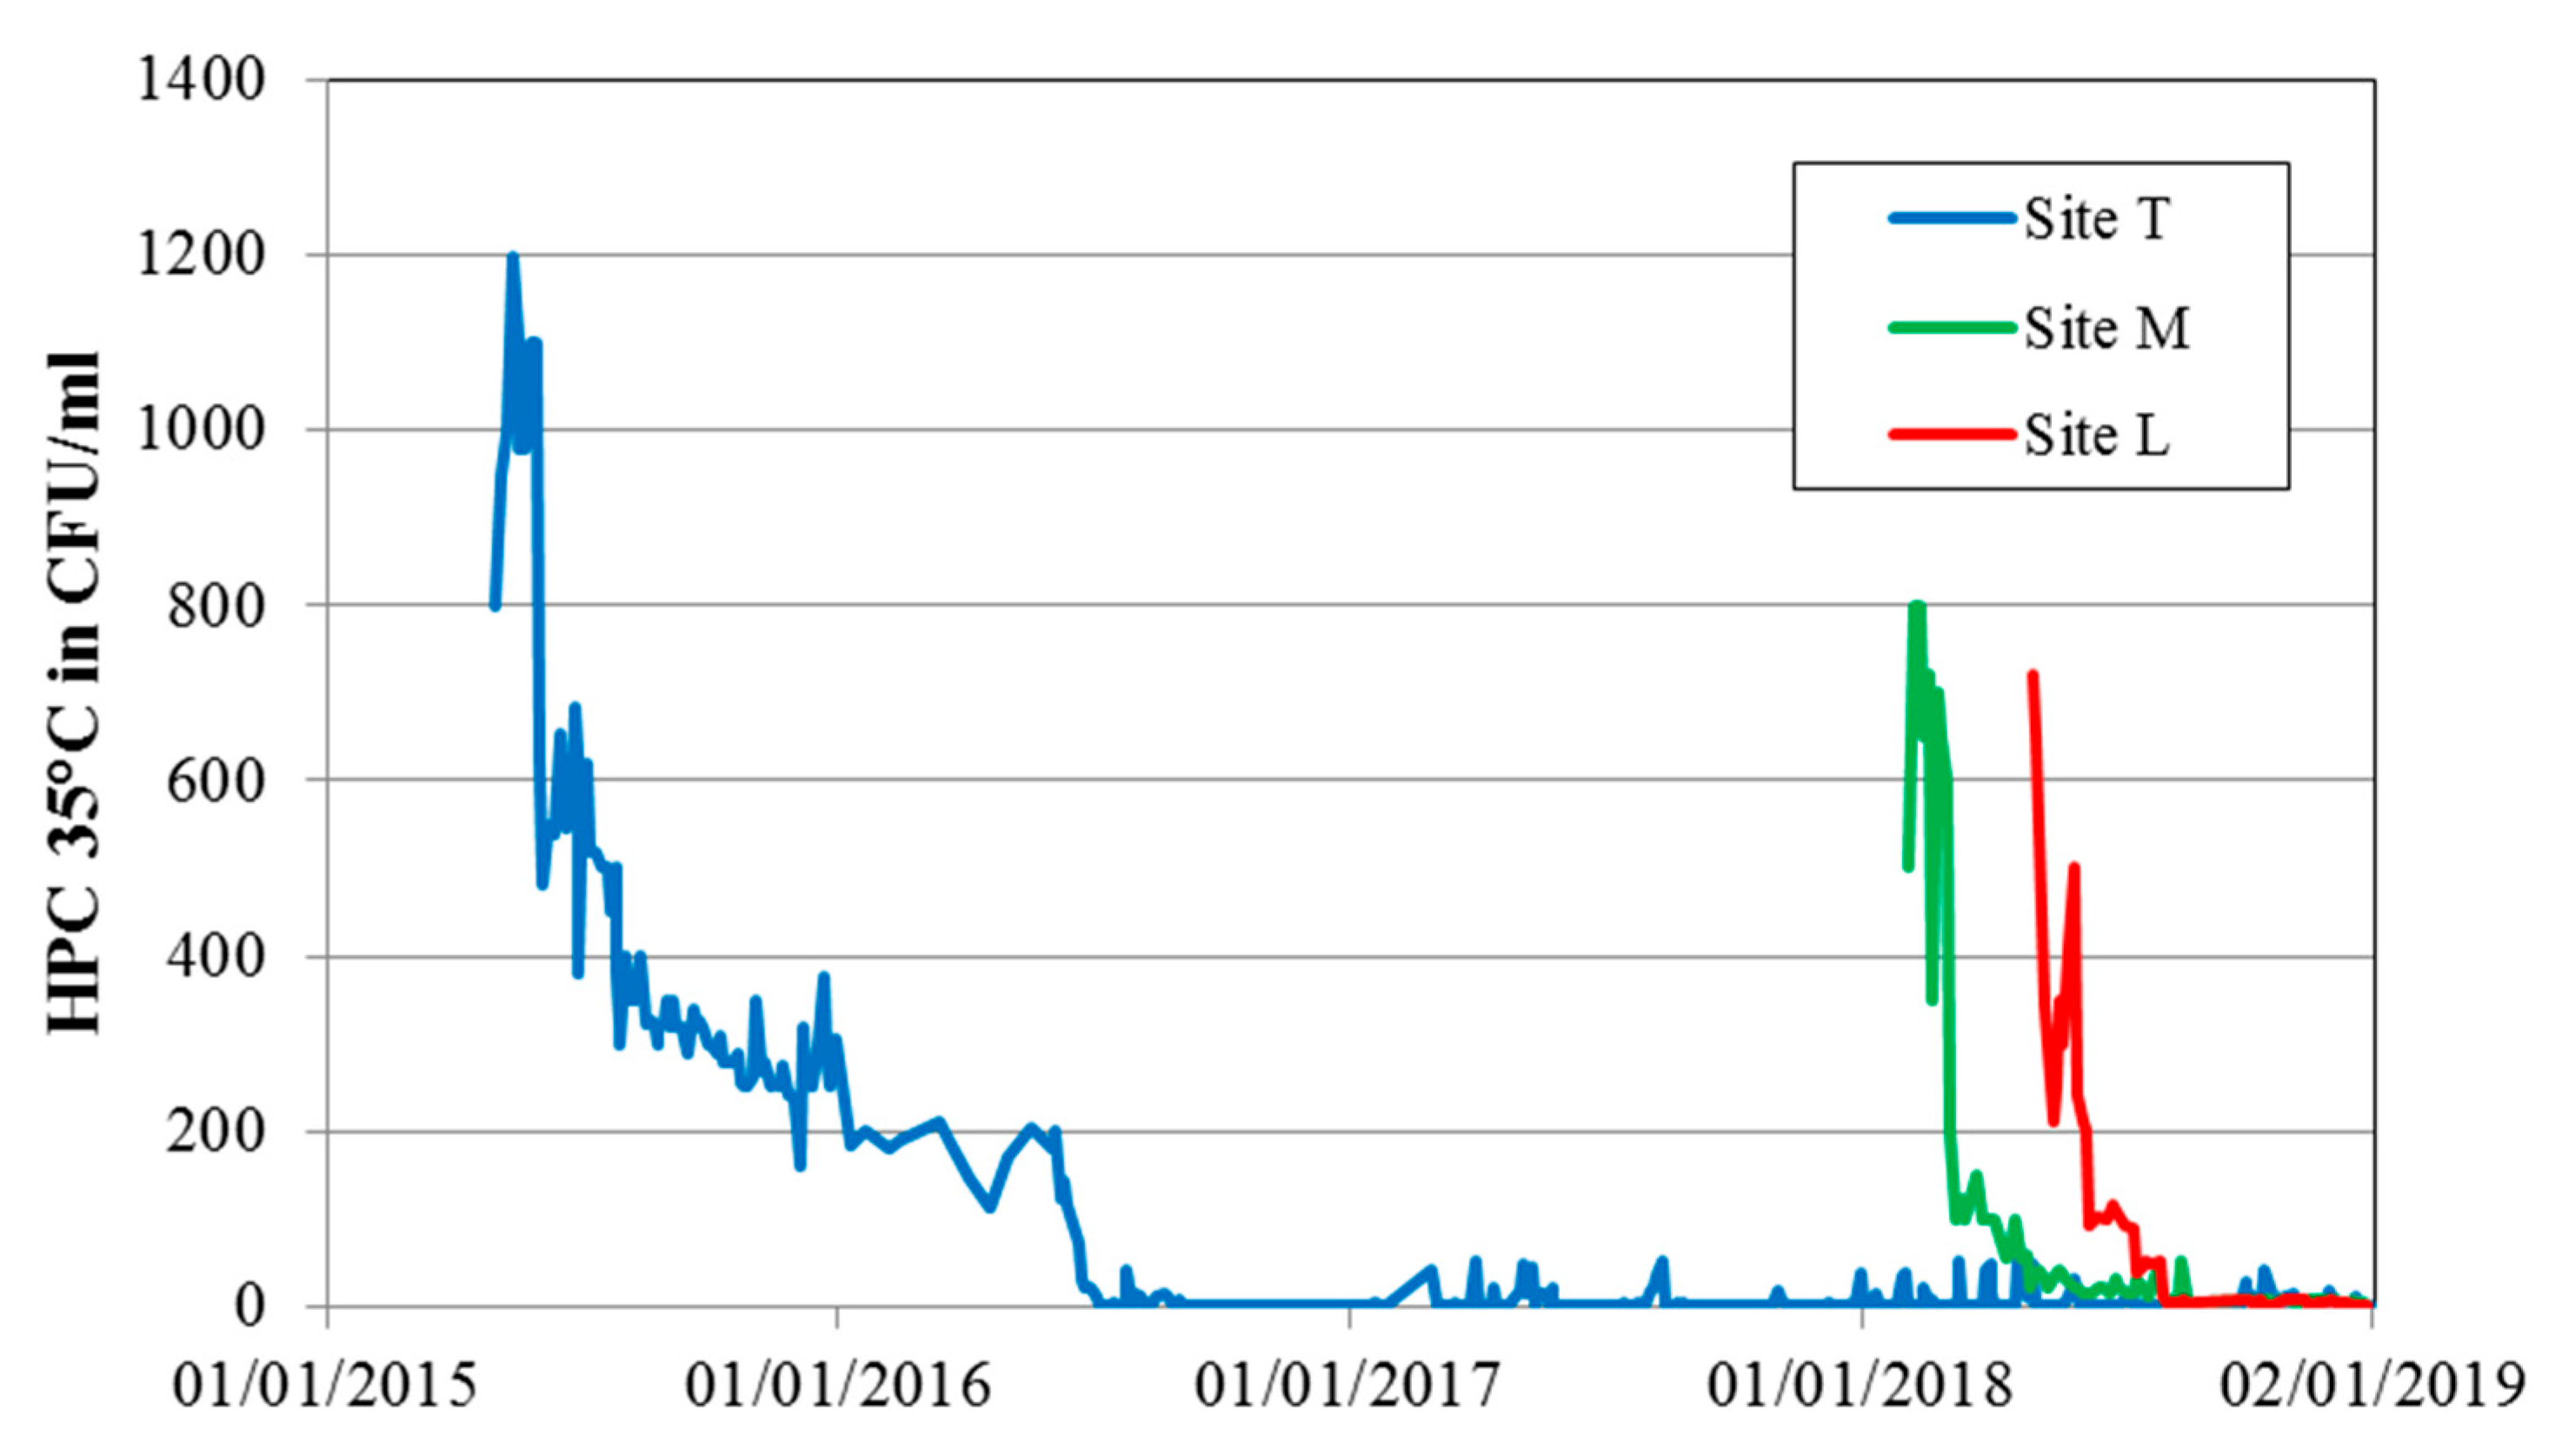
Figure 12 shows remarkable changes in the bacteria (heterotrophic plate counts (HPC)) found in the pumped RBF well water. The high levels at the start of the operation, at sites M and L, could be a result of disturbance of conditions in the subsurface, and contamination during drilling and well construction. If the upper soil enters the borehole or is even used as a filling material, (non-)fecal bacteria are released and can cause a higher HPC, until a microbiological equilibrium is achieved and biofilms are stabilized in the aquifer and the vicinity of the well. The results from site T were different in the beginning but did not indicate any contamination by sewage, as the coliform and fecal coliform counts were very low after one year of no fully continuous operation. After the initial phase, the HPC decreased to median values of 2–20 CFU/mL, compared to a median of 1900 CFU/mL in river water. The permissible limit of the HPC bacteria, according to the Egyptian Drinking Water Standards, is 50 CFU/mL.
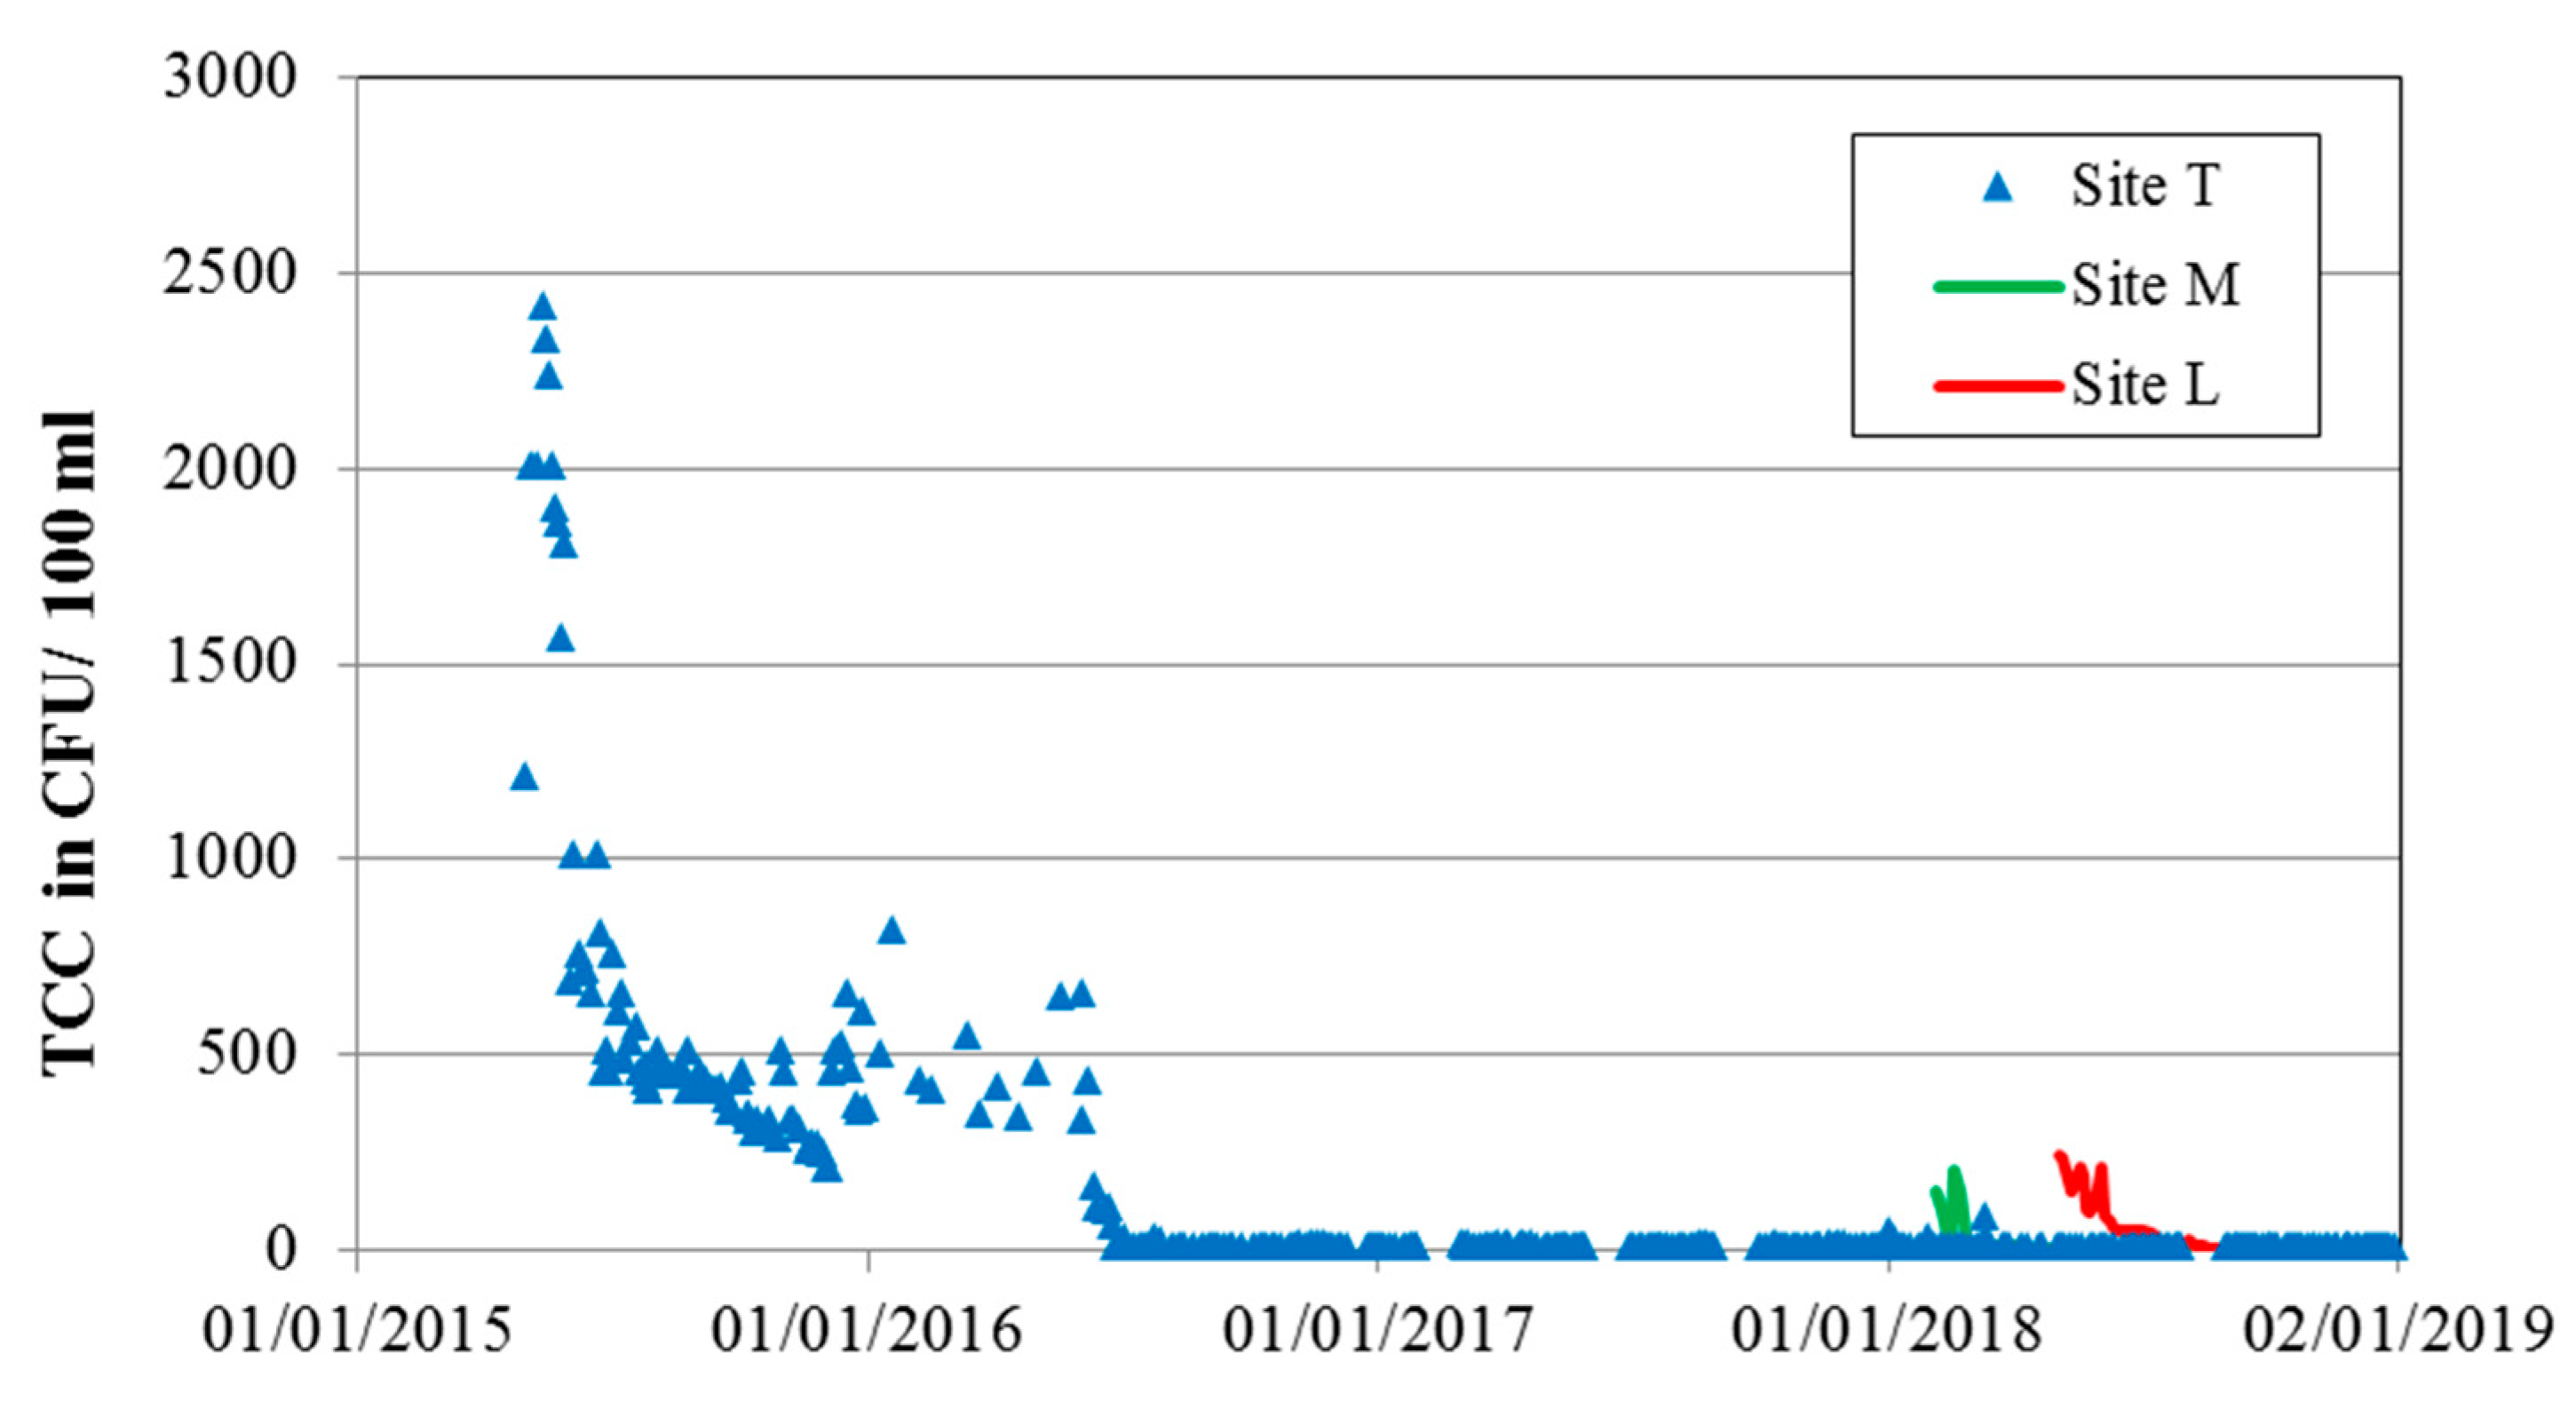
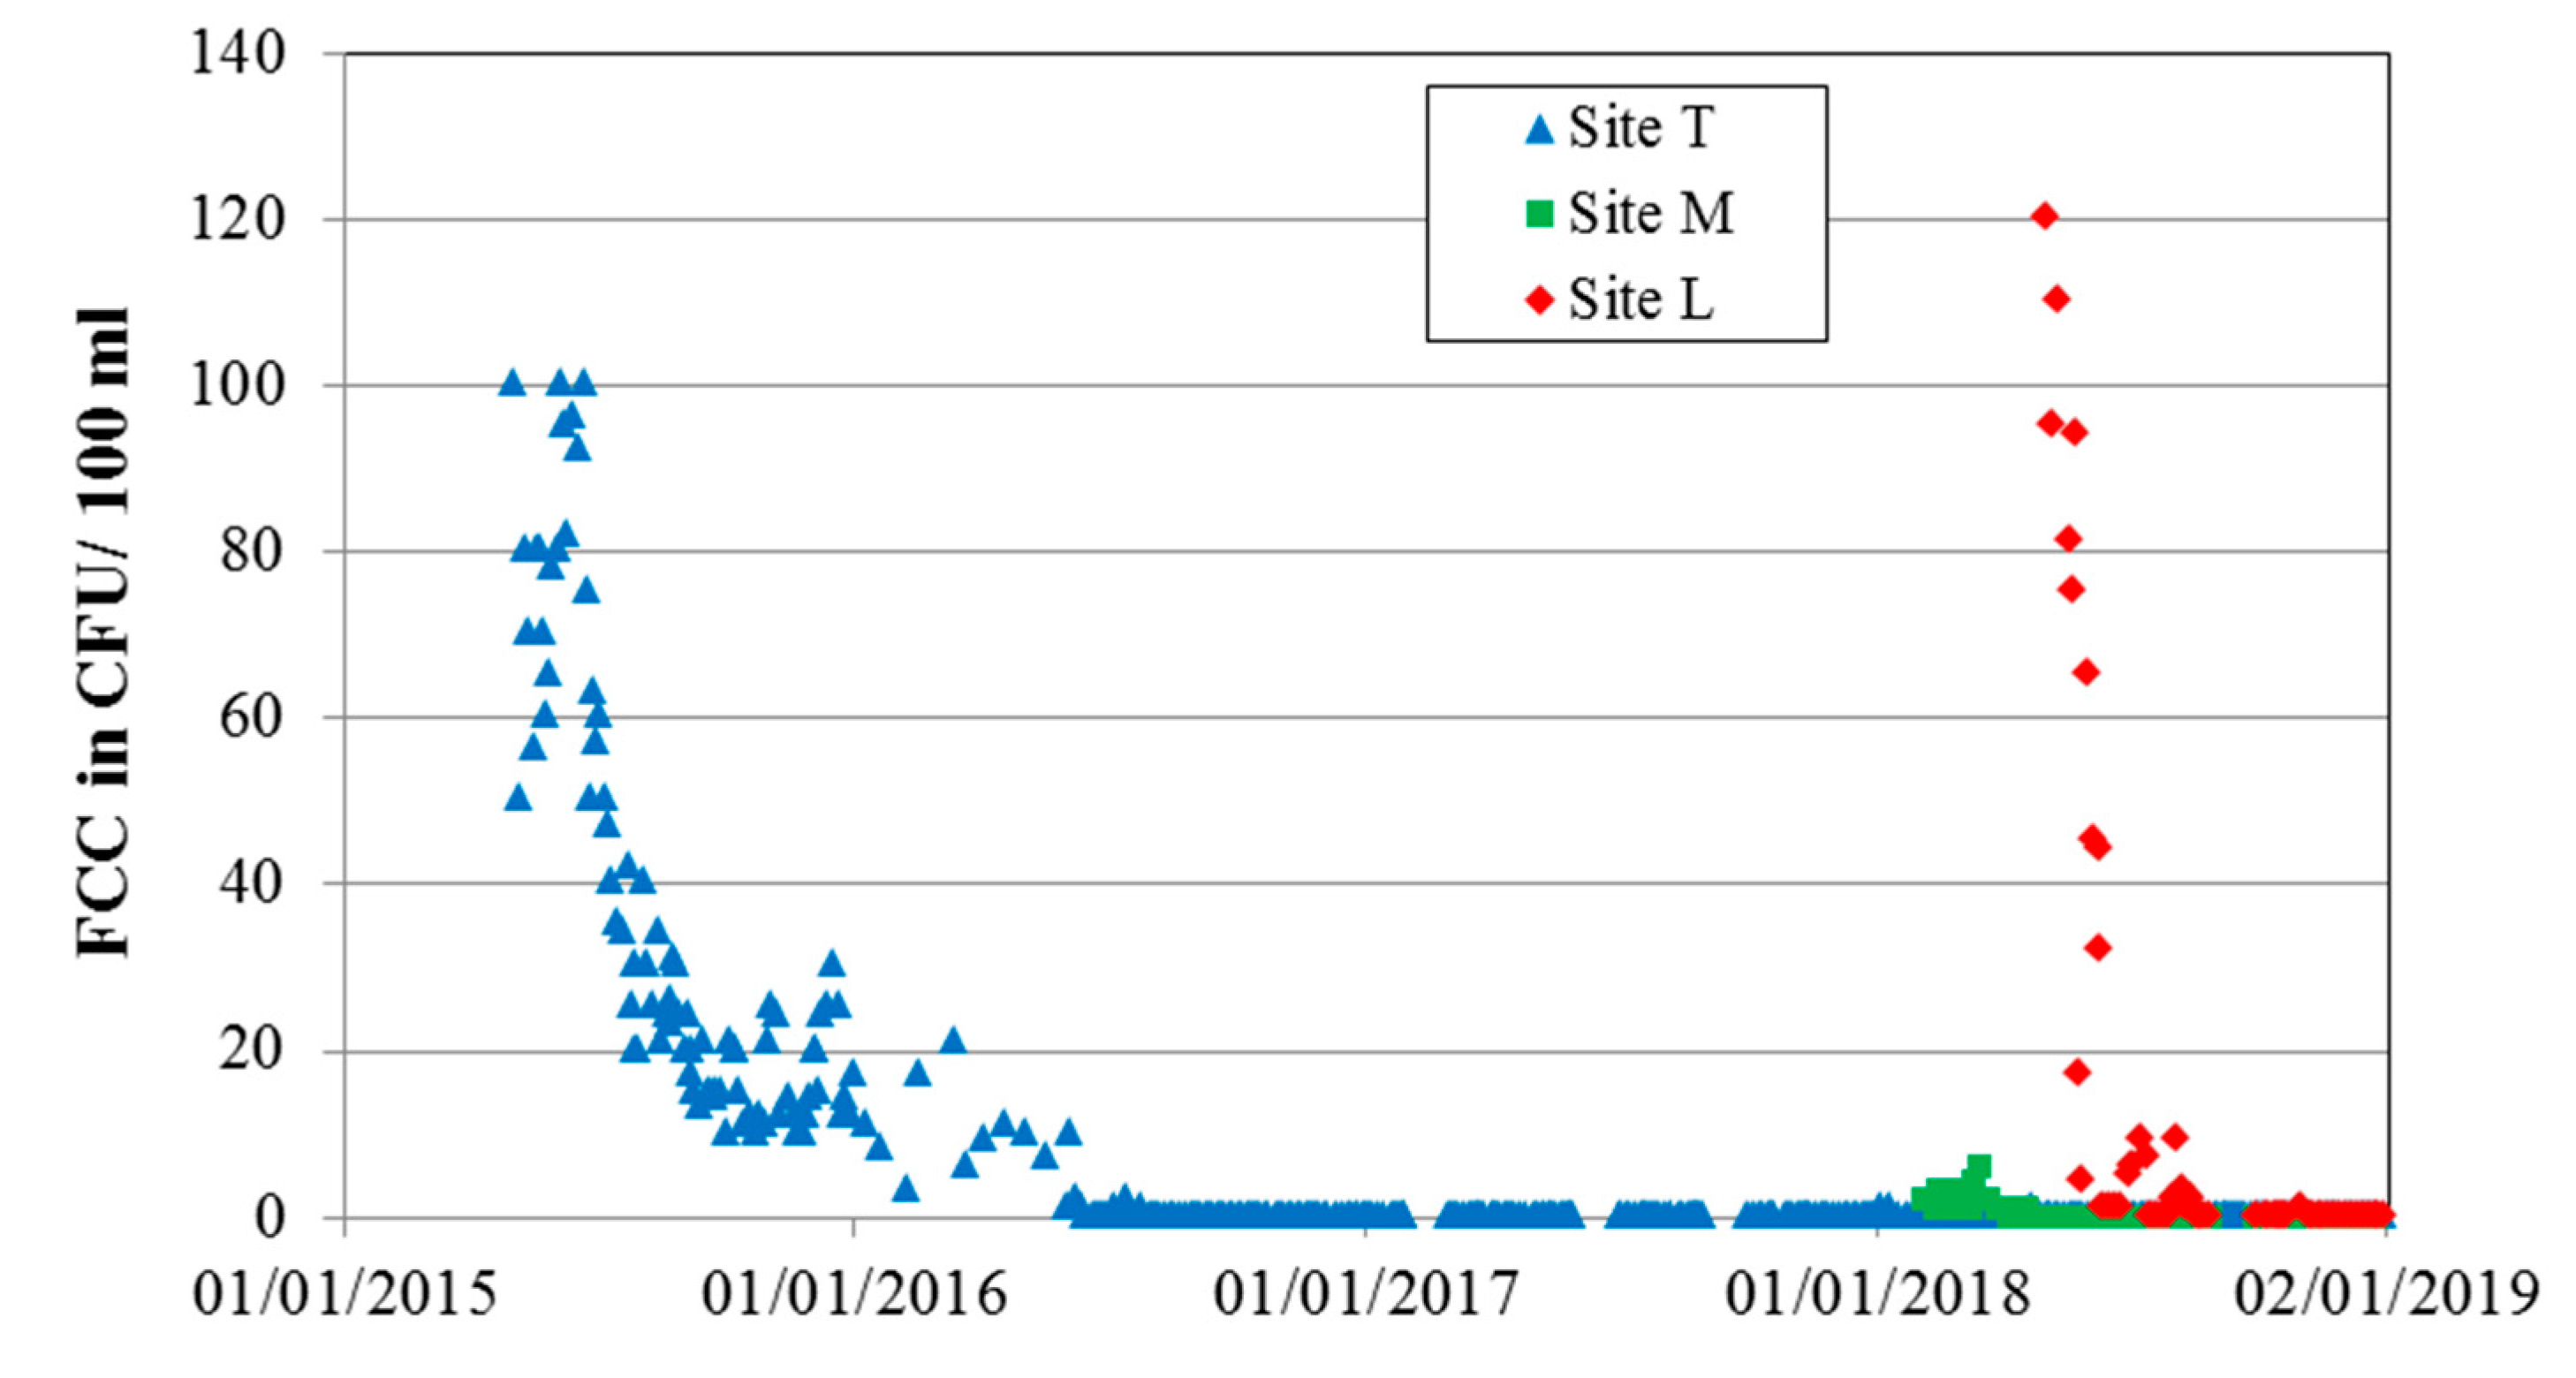
The contamination during the drilling and well installation was also obvious from the observed total and fecal coliforms, during the initial phase shown in Figure 13 and Figure 14. The long-lasting effect at site T was unacceptable whereas at site M (low contamination) and site L the pumping resulted in a clean-up of the disturbed aquifer within 2 to 3 months. After the initial phase, an effective removal of coliforms and fecal coliforms was proved, with a very low number of positive detections of coliforms (Table 4). Despite this, disinfection is a required post-treatment step. During the initial phase, the dosage of disinfectants (e.g., chlorine) should be higher to ensure safe drinking water supply. This might also be required during floods, when the riverbed is eroded and the travel time of bank filtrate is shorter, due to a higher gradient.
Table 5 shows the observed time until nearly constant values were observed, for relevant parameters at the three RBF sites. For most parameters, it took between 2 and 4 months until a stable water quality was achieved at sites L and M. At site T, it took much longer. Looking at the available data from drilling and well design, no obvious reason was found to explain the longer time for site T. One reason could be a stronger gradient of groundwater flow towards the river. This would also explain the stronger fluctuation in Fe concentration and chloride concentration (Figure 8)—if the pumps are switched off for only a short time, groundwater fills the cone of depression and dominates the quality of the pumped water, again. This again underlines the need for a continuous operation of the pumps, to keep Fe and Mn concentrations low.
4. Sustainability and Cost of RBF
RBF is a sustainable low-cost technology applicable in Egypt (Table 6) and could be integrated into the conventional WTPs allocated on the Nile River banks as an additional source to secure water supply during accidental oil spills and extreme climate events. The increased water demand, together with the limited available surface water resources, make RBF a potential alternative for drinking water supply, especially in Upper Egypt [11,21].
Many types of water treatment technology are used in Upper Egypt (Table 6), depending on criteria such as population number, water use (drinking or industries), and cost. To cover a large population, e.g. >1 million consumers, water companies tend to establish large water treatment plants with capacities >17,000 m3/day to 1 Mm3/day or more.
RBF units commonly consist of abstraction wells and a disinfection unit to provide safe drinking water. If Mn and/or Fe concentrations are above the threshold set by the drinking water standard, aeration and sand filtration have to be added as treatment steps.
Small conventional WTPs (rapid sand filters) are plants similar to the large ones, with same treatment steps and chemicals but with a capacity less than 17,000 m3/day. The small conventional WTPs are used for remote areas with limited population or for industrial water supply. This type has some disadvantages, such as high initial cost, high running cost, and a higher energy consumption.
Direct infiltration WTPs (slow sand filters) use large sand and gravel filters to treat water without any coagulant dosage. Chlorine gas is used for disinfection in most cases. These WTPs only produce small quantities of drinking water at a high operation cost.
Treatment of water from groundwater wells commonly requires Fe and Mn removal and disinfection, as in many parts of Egypt, people have to dispose-off sewage in the ground, resulting in groundwater quality deterioration. Fe and Mn removal is based on aeration or dosage of potassium permanganate and subsequent filtration, which affects the operation costs.
Compact units (built-in units) produce up to 2160 m3/day/unit. These mobile units can be moved to any place and are typically installed on small canal banks to provide drinking water for small communities. The basic process is sand filtration in small closed metal cylinders, each unit having three of them, and treatment processes are the same as in the conventional WTPs (coagulation/flocculation).
Table 6 indicates low capital costs for RBF units (without Fe/Mn removal) and small conventional WTPs. High capital costs for (deep) groundwater wells and subsequent treatment are affected by the deep drilling of the wells and commonly require manganese removal. Additionally, the operational costs are lowest for the RBF units, as compared to the groundwater wells, due to a lower drawdown and associated lower energy demand. If Fe/Mn removal is required, the operational costs would be more similar to those of groundwater wells.
5. Conclusions
RBF can serve as a pre-treatment for waterworks; at some sites only disinfection is required as a further treatment step for drinking water production. Results from water quality monitoring during the initial phase of the RBF operation in Upper Egypt have demonstrated a good surface and groundwater interaction, and favorable hydrogeological conditions. Data from all investigated sites showed an efficient removal of turbidity and bacteria during RBF. Special care should be taken to prevent well contamination during the drilling and installation process. TOC removal was calculated to about 60%, based on measurements at a site at Sohag. Fe and Mn concentration decreased at all sites, compared to the initial concentrations in groundwater. At some sites, removal of Mn is required to meet the drinking water quality standard.
After initiation of pumping from the RBF wells, it might take 2 to 12 months until stable water quality is gained for the pumped water. Decisions on adequate further treatment—especially if Fe/Mn removal is required—should be made only after a monitoring period of a few months, to allow an optimal design for post-treatment. The RBF units should be operated continuously to prevent fluctuations in water quality and to limit the pumped portion of land-side groundwater, which commonly has higher Fe and Mn concentrations.
RBF can provide large volumes of drinking water with a high quality at low cost. The capital and operating costs of the RBF units are lower, compared to conventional water treatment plants. The highlighted conditions and advantages of RBF in Upper Egypt underline that RBF should be considered as an option for water supply, without requiring any further treatment besides disinfection or as a pre-treatment step at some sites, especially if the capacity of the existing water treatment plants needs to be increased.
Author Contributions
R.A.W., A.S., and T.G. prepared the article draft. A.S. collected site data and was responsible for the monitoring program, including water analysis. All authors reviewed and edited the article.
Funding
All primary data was collected within the UN Human Settlements Programme of the UN-Habitat, HCWW, SCWW, and LCWW. Guidance on well design and interpretation of water quality data was supported within the framework of the AquaNES project, which has received funding from the European Union´s Horizon 2020 Research and Innovation Program under Grant No. 689450.
Acknowledgments
The authors would like to thank staff members of the Holding Company for Water and Wastewater, SCWW, and LCWW for their support in water sampling, analysis, and site management.
Conflicts of Interest
The authors declare no conflict of interest. The funding sponsors had no role in the design of the study; in the collection, analyses, or interpretation of data; in the writing of the manuscript, and in the decision to publish the results.
References
- Deutsches Wissenschaftszentrum (DWZ) Cairo. River Bank Filtration Expert Workshop under the Framework of the Egyptian German Water Cluster Report; Deutsches Wissenschaftszentrum (DWZ) Cairo: Cairo, Egypt, 26 September 2016. [Google Scholar]
- Central Agency for Public Mobilization and Statistics. Census Population. September 2017. Available online: https://censusinfo.capmas.gov.eg (accessed on 16 February 2019).
- Wahaab, R.A. One System Inventory: Environment Theme—Egypt Nile Basin Initiative; Eastern Technical Regional Office: Addis Ababa, Ethiopia, 2006. [Google Scholar]
- Yousry, M.; El-Sherbini, A.; Heikal, M.; Salem, T. Suitability of water quality status of Rosetta branch for west Delta water conservation and irrigation rehabilitation project. Water Sci. 2009, 46, 47–60. [Google Scholar]
- Yehia, A.G.; Fahmy, K.M.; Mehany, M.A.S.; Mohamed, G.G. Impact of extreme climate events on water supply sustainability in Egypt—Case studies in Alexandria region and Upper Egypt. J. Water Clim. Chang. 2017, 8, 484–494. [Google Scholar] [CrossRef]
- HCWW. RBF in Egypt—Strategy and Policy. In Holding Company for Water and Wastewater Report; HCWW: Cairo, Egypt, 2018. [Google Scholar]
- Grischek, T.; Bartak, R. Riverbed clogging and sustainability of riverbank filtration. J. Water 2016, 8, 604. [Google Scholar] [CrossRef]
- Ray, C.; Melin, G.; Linsky, R.B. Riverbank Filtration: Improving Source Water Quality; Springer: Dordrecht, The Netherlands, 2002. [Google Scholar]
- Grischek, T.; Schubert, J.; Jasperse, J.L.; Stowe, S.M.; Collins, M.R. What is the appropriate site for RBF. In Management of Aquifer Recharge for Sustainability, Proceedings of the ISMAR 6, Phoenix, AZ, USA, 28 October–2 November 2007; Fox, P., Ed.; Acacia: Phoenix, AZ, USA, 2007; pp. 466–474. [Google Scholar]
- Grischek, T.; Ray, C. Bank filtration as managed surface—groundwater interaction. J. Water 2009, 5, 125–139. [Google Scholar] [CrossRef]
- Ghodeif, K.; Grischek, T.; Bartak, R.; Wahaab, R.; Herlitzius, J. Potential of river bank filtration (RBF) in Egypt. Environ. Earth Sci. 2016, 75, 671. [Google Scholar] [CrossRef]
- Hiscock, K.; Grischek, T. Attenuation of groundwater pollution by bank filtration. J. Hydrol. 2002, 266, 139–144. [Google Scholar] [CrossRef] [Green Version]
- Sandhu, C. A Concept for the Investigation of Riverbank Filtration Sites for Potable Water Supply in India. Ph.D. Thesis, Faculty of Environmental Sciences, TU Dresden, Division of Water Sciences, HTW Dresden, Dresden, Germany, 2015. [Google Scholar]
- Henzler, A.F.; Greskowiak, J.; Massmann, G. Seasonality of temperatures and redox zonation during bank filtration—A modeling approach. J. Hydrol. 2016, 535, 282–292. [Google Scholar] [CrossRef]
- Stuyfzand, P.J. Fate of pollutants during artificial recharge and bank filtration in the Netherlands. In Artificial Recharge of Groundwater; Peters, J.H., Ed.; Balkema: Rotterdam, The Netherlands, 1998; pp. 119–125. [Google Scholar]
- Sandhu, C.; Grischek, T.; Börnick, H.; Feller, J.; Sharma, S.K. A water quality appraisal of some existing and potential riverbank filtration sites in India. J. Water 2019, 11, 215. [Google Scholar] [CrossRef]
- Grischek, T.; Paufler, S. Prediction of iron release during riverbank filtration. J. Water 2017, 9, 317. [Google Scholar] [CrossRef]
- Paufler, S.; Grischek, T.; Benso, M.; Seidel, N.; Fischer, T. The impact of river discharge and water temperature on manganese release from the riverbed during riverbank filtration—A case study from Dresden, Germany. J. Water 2018, 10, 1476. [Google Scholar] [CrossRef]
- Egyptian Standard Specifications for Potable Drinking Water; Decision of the Minister of Health and Population No. 458; Minister of Health and Population: Cairo, Egypt, 2007.
- American Water Works Association (AWWA); Water Environment Federation (WEF); American Public Health Association (APHA). Standard Methods for the Examination of Water and Wastewater (SMWW), 23rd ed. 2018. Available online: https://doi.org/10.2105/SMWW.2882.219 (accessed on 1 May 2019).
- Ghodeif, K.; Paufler, S.; Grischek, T.; Wahaab, R.; Souaya, E.; Bakr, M.; Abogabal, A. Riverbank filtration in Cairo, Egypt—Part I: Installation of a new riverbank filtration site and first monitoring results. Environ. Earth Sci. 2018, 77, 270. [Google Scholar] [CrossRef]
- Hoehn, E.; Cirpka, O.A. Assessing residence times of hyporheic ground water in two alluvial flood plains of the Southern Alps using water temperature and tracers. Hydrol. Earth Syst. Sci. 2006, 10, 553–563. [Google Scholar] [CrossRef] [Green Version]
- Grischek, T. Management of RBF along the Elbe River. Ph.D. Thesis, Department of Water Sciences, Dresden University of Technology, Dresden, Germany, 2003. (In German). [Google Scholar]
- Nagy-Kovács, Z.; Davidesz, J.; Czihat-Mártonné, K.; Grischek, T. Water quality changes during riverbank filtrationin Budapest, Hungary. J. Water 2019, 11, 302. [Google Scholar] [CrossRef]
- Trettin, R.; Grischek, T.; Strauch, G.; Mallen, G.; Nestler, W. The suitability and usage of 18O and chloride as natural tracers for bank filtrate at the Middle River Elbe. Isot. Environ. Health Stud. 1999, 35, 331–350. [Google Scholar] [CrossRef]
- Davis, S.N.; Whittemore, D.O.; Fabryka-Martin, J. Uses of chloride/bromide ratios in studies of potable water. Ground Water 1998, 36, 338–350. [Google Scholar] [CrossRef]
- Paufler, S.; Grischek, T.; Bartak, R.; Ghodeif, K.; Wahaab, R.; Boernick, H. Riverbank filtration in Cairo, Egypt—Part II: Detailed investigation of a new riverbank filtration site with a focus on manganese. Environ. Earth Sci. 2018, 77, 318. [Google Scholar] [CrossRef]
- Schoenheinz, D.; Grischek, T. Behavior of dissolved organic carbon during bank filtration under extreme climate conditions. In Riverbank Filtration for Water Security in Desert Countries; Ray, C., Shamrukh, M., Eds.; Springer Science + Business Media B.V.: Berlin, Germany, 2011; pp. 51–67. [Google Scholar]
- Grischek, T.; Hiscock, K.M.; Metschies, T.; Dennis, P.; Nestler, W. Factors affecting denitrification during infiltration of river water into a sand and gravel aquifer in Saxony, Germany. Water Res. 1998, 32, 450–460. [Google Scholar] [CrossRef]
- SCWW. Internal Report. In Sohag Company for Water and Wastewater; SCWW: Sohag, Egypt, 2016. [Google Scholar]
Figure 1.
A generalized riverbank filtration (RBF) cross-section with typical conditions for Upper Egypt ©Grischek, HTW Dresden.
Figure 1.
A generalized riverbank filtration (RBF) cross-section with typical conditions for Upper Egypt ©Grischek, HTW Dresden.

Figure 2.
Location of the RBF sites near Luxor and Sohag, Upper Egypt.

Figure 3.
Cross-section of the River Nile at the RBF site Alsaayda near Luxor, May 2018.

Figure 4.
Impact of precipitation in March 2014 on the turbidity of the River Nile measured at the intakes of eight water treatment plants around Sohag, in 2014.
Figure 4.
Impact of precipitation in March 2014 on the turbidity of the River Nile measured at the intakes of eight water treatment plants around Sohag, in 2014.

Figure 5.
EC readings during the initial phase of RBF at Sohag, site T, 2015–2018.

Figure 6.
EC readings during the initial phase of RBF near Luxor, site L, and Sohag, site M, 2018.

Figure 7.
Chloride and sulfate concentration during the initial phase of RBF at Sohag, site T, 2015–2018.
Figure 7.
Chloride and sulfate concentration during the initial phase of RBF at Sohag, site T, 2015–2018.

Figure 8.
Fe concentration in the pumped RBF well water, during the initial phase of RBF near Luxor, site L, and Sohag, site M, 2015–2018.
Figure 8.
Fe concentration in the pumped RBF well water, during the initial phase of RBF near Luxor, site L, and Sohag, site M, 2015–2018.

Figure 9.
Mn concentration in the pumped RBF well water during the initial phase of RBF at Sohag, site T, 2015–2018.
Figure 9.
Mn concentration in the pumped RBF well water during the initial phase of RBF at Sohag, site T, 2015–2018.

Figure 10.
Mn concentration in the pumped RBF well water during the initial phase of RBF near Luxor, site L, and Sohag, site M, 2018.
Figure 10.
Mn concentration in the pumped RBF well water during the initial phase of RBF near Luxor, site L, and Sohag, site M, 2018.

Figure 11.
Ammonium concentration in River Nile water and the pumped RBF well water during the initial phase of RBF near Luxor and Sohag, 2018.
Figure 11.
Ammonium concentration in River Nile water and the pumped RBF well water during the initial phase of RBF near Luxor and Sohag, 2018.

Figure 12.
Heterotrophic plate counts in the pumped RBF well water during the initial phase of RBF near Luxor and Sohag, 2015–2018.
Figure 12.
Heterotrophic plate counts in the pumped RBF well water during the initial phase of RBF near Luxor and Sohag, 2015–2018.

Figure 13.
Total coliform counts in pumped RBF well water during the initial phase of RBF near Luxor and Sohag, 2015–2018.
Figure 13.
Total coliform counts in pumped RBF well water during the initial phase of RBF near Luxor and Sohag, 2015–2018.

Figure 14.
Fecal coliforms in the pumped RBF well water during the initial phase of RBF near Luxor and Sohag, 2015–2018.
Figure 14.
Fecal coliforms in the pumped RBF well water during the initial phase of RBF near Luxor and Sohag, 2015–2018.


Table 1.
Design parameters of RBF wells near Luxor and Sohag.
| Site | Alsaayda, Luxor | Eltawael, Sohag | Al-Maragha, Sohag | |||||
|---|---|---|---|---|---|---|---|---|
| Well No. | L1 | L2 | L3 | T1 | T2 | T3 | M1 | M2 |
| Depth of well (mbgs) | 31 | 31 | 31 | 36 | 36 | 36 | 36 | 36 |
| Location of filter screen (mbgs) | 10–25 | 10–25 | 6–21 | 18–35 | 18–35 | 18–35 | 18–35 | 18–35 |
| Borehole diameter (inch) | 20 | 20 | 20 | 20 | 20 | 20 | 20 | 20 |
| Well diameter (inch) | 14 | 14 | 14 | 14 | 14 | 14 | 14 | 14 |
| Distance from river bank (m) | 13 | 10 | 5 | 6 | 6 | 6 | 5 | 5 |
| Distance from neighboring well (m) | 25 | 25/19 | 19 | 10 | 10/10 | 10 | 12 | 12 |
| Pumping rate (L/s) | 35 | 35 | 35 | 35 | 35 | 35 | 35 | 35 |
| Static groundwater level (mbgs) | 2.0 * | 1.8 * | 1.5 * | 2.2 ** | 2.4 ** | 2.4 ** | 2.5 *** | 2.5 *** |
| Drawdown (m) | 4.0 | 3.6 | 3.5 | 3.7 | 3.7 | 4.1 | 3.6 | 3.6 |
* May 2018, ** May 2015, *** February 2018.
Table 2.
Thickness of the sediment layers with depth (mbgs) at the RBF sites near Luxor and Sohag.
| Site | Alsaayda Near Luxor | Eltawael | Al-maragha | |||||
|---|---|---|---|---|---|---|---|---|
| Well No. | L1 | L2 | L3 | T1 | T2 | T3 | M1 | M2 |
| Clay top | 0–2 | 0–4 | 0–4 | - | - | - | 0–8 | 0–8 |
| Fine sand | 2–7 | 4–9 | 4–13 | 0–10 | 0–10 | 0–10 | - | - |
| Medium sand | - | 9–16 | 13–16 | - | - | - | 8–12 | 8–12 |
| Coarse sand | 7–18 | - | - | 10–22 | 10–22 | 10–22 | 12–17 | 12–17 |
| Coarse sand with gravel | 18–19 | 16–30 | 16–30 | 22–30 | 22–30 | 22–30 | 17–28 | 17–28 |
| Gravel | 19–25 | - | - | 30–35 | 30–35 | 30–35 | 28–35 | 28–35 |
| Shale | >25 | Not reached | Not reached | - | - | - | - | - |
Table 3.
Parameters and analytical methods, according to the Standard Methods for Examination of Water and Wastewater [20].
Table 3.
Parameters and analytical methods, according to the Standard Methods for Examination of Water and Wastewater [20].
| Parameter | Abbreviation | Unit | Method, Equipment, Method No. |
|---|---|---|---|
| Physical Parameters | |||
| Electric Conductivity | EC | µS/cm | Conductivity (2510)/Laboratory method/WTW Cond. Meter, 2–55 |
| Turbidity | Turb | NTU | Turbidity (2130)/Nephelometric method/Turbidimeter (Hach), 2–12 |
| Chemical Parameters | |||
| pH | pH | - | pH (4500-H+)/Electrometric method/ThermoScientific (Orion 3 STAR), 4–95 |
| Alkalinity | Alk | mg/L | Alkalinity (2320)/Titrimetric method, 2–36 |
| Total organic carbon | TOC | mg/L | TOC (5310)/C. Persulfate–Ultraviolet or Heated-Persulfate Oxidation Method, 5–29 |
| Total Hardness | CaCO3 | mg/L | EDTA titrimetric method, 3–69 |
| Ammonium | NH4+ | mg/L | Ammonium (4500-NH3)/Phenate method, 4–114 |
| Chloride | Cl− | mg/L | Chloride (4500-Cl−)/Argentometric method, 4–75 |
| Sulfate | SO42− | mg/L | Sulfate (4500-SO42−)/Turbidimetric method, 4–197 |
| Nitrate | NO3− | mg/L | Nitrate (4500-NO3)/Ultraviolet spectrophotometric method/Cecil 2041 UV/VIS, 4–126 |
| Iron | Fe | mg/L | Iron (3500-Fe)/Phenanthroline method/Cecil 2041 UV/VIS, 3–79 |
| Manganese | Mn | mg/L | Manganese (3500-Mn)/Persulfate method/Cecil 2041 UV/VIS, 3–87 |
| Microbiological Parameters | |||
| Heterotrophic Plate Count 35 °C | HPC 35 °C | count/mL | HPC (9215)/B-Pour Plate Method, 9–53 |
| Total coliform | TC | count/100 mL | MFT (9222)/B-D, endo agar method, 9–81 for drinking water, MTFT 9221 B-C-E for intake water |
| Fecal coliforms | FCC | count/100 mL | MFT (9222)/Membrane filter procedure for coliform group D, thermotolerant (fecal) coliforms |
| Biological Parameters | |||
| Total Algae Count | Algae | cells/mL | Plankton (10200)/C, E and F, 10–11, 10–15, 10–17 |
Table 4.
Standard water quality parameters, median (min–max) values, River Nile water, bank filtrate (BF), and groundwater (GW), GW: 2016–2018; Nile at Sohag and BF Sohag site T: 2015–2018; Sohag site M and Luxor site L: 2018 (n = number of samples).
Table 4.
Standard water quality parameters, median (min–max) values, River Nile water, bank filtrate (BF), and groundwater (GW), GW: 2016–2018; Nile at Sohag and BF Sohag site T: 2015–2018; Sohag site M and Luxor site L: 2018 (n = number of samples).
| Parameter | Unit | Standard Egypt | Ambient GW | Nile Water, Sohag | BF Luxor L * (2018) | BF Sohag T ** | BF Sohag M *** |
|---|---|---|---|---|---|---|---|
| EC | µS/cm | - | 634 341–1039 (n = 333) | 322 273–461 (n = 290) | 350 322–594 (n = 57) | 507 388–1213 (n = 402) | 547 452–734 (n = 82) |
| pH | - | 6.5–8.5 | 7.5 6.9–7.9 (n = 329) | 8.1 7.5–8.6 (n = 592) | 7.5 7.4–7.7 (n = 57) | 7.5 7.3–7.8 (n = 386) | 7.7 7.5–8.02 (n = 82) |
| Turbidity | NTU | 1 | 0.7 0.1–3.5 (n = 333) | 3.3 0.3–300 (n = 517) | 0.24 0.1–0.65 (n = 57) | 0.38 0.1–0.99 (n = 385) | 0.36 0.2–1.5 (n = 82) |
| Alkalinity | mg/L | 500 | 297 139–477 (n = 327) | 134 110–213 (n = 544) | n.d. | 238 135–350 (n = 265) | n.d. |
| TDS | mg/L | - | 406 218–665 (n = 333) | 206 175–295 (n = 290) | 224 206–380 (n = 57) | 324 248–776 (n = 402) | 350 289–470 (n = 82) |
| Total HardnessCaCO3 | mg/L | - | 230 103–823 (n = 326) | 115 88–192 (n = 552) | n.d. | 209 150–443 (n = 383) | n.d. |
| Fe | mg/L | 0.3 | 0.23 0.012–0.76 (n = 257) | <0.001 <0.001–0.19 (n = 205) | 0.11 0.09–0.20 (n = 57) | 0.25 0.1–0.51 (n = 393) | 0.14 0.06–0.46 (n = 82) |
| Mn | mg/L | 0.4 | 0.34 0.07–1.0 (n = 260) | <0.001 <0.001–0.16 (n = 199) | 0.42 0.3–0.61 (n = 57) | 0.55 0.38–1.2 (n = 388) | 0.45 0.4–0.65 (n = 82) |
| NH4+ | mg/L | 0.5 | 0.68 0.002–1.38 (n = 239) | 0.018 <0.002–0.5 (n = 188) | 0.19 0.09–0.33 (n = 57) | 0.12 0.01–0.52 (n = 367) | 0.2 0.07–0.54 (n = 81) |
| Cl− | mg/L | 250 | 30 16–75 (n = 327) | 15 11–27 (n = 289) | n.d. | 25 16–64 (n = 381) | n.d. |
| SO42− | mg/L | 250 | 31 17–76 (n = 318) | 22 14–37 (n = 289) | n.d. | 27 17–81 (n = 375) | n.d. |
| NO3− | mg/L | 45 | 1.0 <1–5.7 (n = 247) | 1.5 <1–4.6 (n = 181) | n.d. | 1.2 <1–4.6 (n = 263) | n.d. |
| TOC | mg/L | - | n.d. | 2.7 2.1–3.2 (n = 11) | n.d. | 1.2 1.1–1.4 (n = 17) | n.d. |
| HPC | CFU/mL | 50 | 34 1–6500 (n = 300) | 1900 220–9550 (n = 245) | 8 0–720 (n=57) | 2 0–1200 (n=378) | 20 2–800 (n=82) |
| Total coliform | CFU/100 mL | <1 | 0 0–355 (n = 302) | 2700 45–54,000 (n = 257) | 10 0–240 (n = 57) | 0 0–2410 (n = 369) | 0 0–200 (n = 82) |
| Fecal coliform | CFU/100 mL | <1 | 0 0–16 (n = 302) | 180 20–790 (n = 221) | 0 0–120 (n = 57) | 0 0–100 (n = 399) | 0 0–6 (n = 82) |
n.d.—not determined, * L—Alsaayda, Luxor, ** T—Eltawael, Sohag, *** M—Al-maragha, Sohag.
Table 5.
Time (in months) of RBF unit operation until stable water quality was achieved for the pumped water.
Table 5.
Time (in months) of RBF unit operation until stable water quality was achieved for the pumped water.
| Parameter | Site L | Site T | Site M |
|---|---|---|---|
| EC | 2 | 7 | 3 |
| Cl- | n.d. | 7 | n.d. |
| Fe | 3 | n.a. | 3 |
| Mn | >7* | 8 | 4 |
| NH4+ | n.a. | 6 | 3–4 |
| HPC | 3.5 | 14 | 4 |
| TCC | 3.5 | 13 | 2 |
| FC | 2.5 | 13 | 2 |
n.d.—not determined, n.a.—not applicable, * still decreasing.
Table 6.
Cost estimates for different abstraction and treatment schemes in Sohag, Egypt [30].
Table 6.
Cost estimates for different abstraction and treatment schemes in Sohag, Egypt [30].
| Capacity and Cost | RBF Unit | Small Conventional WTP | Direct Infiltration WTP | Groundwater Well | Compact Unit |
|---|---|---|---|---|---|
| Capacity (m3/day) | 3024 | 8640 | 3465 | 2160 | 2160 |
| Capital cost (Million EGP/Unit) | 0.6 * | 30–40 | 60 | 0.75 *–10 | 15 |
| Operational cost (Million EGP/Unit) | ≈0.05 * | ≈0.5 | ≈1.5 | ≈0.1 * | ≈0.7 |
* without Fe/Mn removal, only disinfection with chlorine.
© 2019 by the authors. Licensee MDPI, Basel, Switzerland. This article is an open access article distributed under the terms and conditions of the Creative Commons Attribution (CC BY) license (http://creativecommons.org/licenses/by/4.0/).
Share and Cite
MDPI and ACS Style
Wahaab, R.A.; Salah, A.; Grischek, T. Water Quality Changes during the Initial Operating Phase of Riverbank Filtration Sites in Upper Egypt. Water 2019, 11, 1258. https://doi.org/10.3390/w11061258
AMA Style
Wahaab RA, Salah A, Grischek T. Water Quality Changes during the Initial Operating Phase of Riverbank Filtration Sites in Upper Egypt. Water. 2019; 11(6):1258. https://doi.org/10.3390/w11061258
Chicago/Turabian StyleWahaab, Rifaat Abdel, Ahmed Salah, and Thomas Grischek. 2019. "Water Quality Changes during the Initial Operating Phase of Riverbank Filtration Sites in Upper Egypt" Water 11, no. 6: 1258. https://doi.org/10.3390/w11061258
Note that from the first issue of 2016, this journal uses article numbers instead of page numbers. See further details here.