Stable Isotopes of Precipitation in China: A Consideration of Moisture Sources


1
Key Laboratory of Shale Gas and Geoengineering, Institute of Geology and Geophysics, Chinese Academy of Sciences, Beijing 100029, China
2
Institutions of Earth Science, Chinese Academy of Sciences, Beijing 100029, China
3
University of Chinese Academy of Sciences, Beijing 100049, China
4
College of Water Sciences, Beijing Normal University, Beijing 100875, China
*
Authors to whom correspondence should be addressed.
Water 2019, 11(6), 1239; https://doi.org/10.3390/w11061239
Submission received: 17 April 2019
/
Revised: 2 June 2019
/
Accepted: 5 June 2019
/
Published: 13 June 2019
(This article belongs to the Special Issue Use of Water Stable Isotopes in Hydrological Process)
Abstract
:An accurate representation of the spatial distribution of stable isotopes in modern precipitation is vital for interpreting hydrological and climatic processes. Considering the dominant impact of moisture sources in controlling water isotopes and deuterium excess, we conducted a meta-analysis of precipitation isotopes using instrumental data from 68 stations around China. The entire country is divided into five regions according to the major moisture sources: Region I (the westerlies domain), Region II (the arctic domain), Region III (the northeast domain), Region IV (the Pacific domain), and Region V (the Tibetan Plateau). Each region has unique features of spatial distribution and seasonal variation for stable precipitation isotopes and deuterium excess. In particular, seasonal variation in Region IV tracks the onset of Asian summer monsoons well. The regional meteoric water lines are presented for each region. A significant temperature effect is found in Regions I and III, with δ18O-temperature gradients of 0.13–0.68‰/°C and 0.13–0.4‰/°C, respectively. However, the reasons for the temperature effects are quite different. In Region I, this effect is caused by the seasonal shift of the westerlies, whereas in Region III, it is caused by the seasonal difference in moisture sources. The precipitation amount effect is most significant in the region along the southeast coast in China, where the δ18O-precipitation amount the gradient is −0.24 to −0.13‰/mm. The findings in our paper could serve as a reference for isotopic application in hydrological and paleo-climatic research.

1. Introduction
The stable oxygen and hydrogen isotope compositions of precipitation are powerful tools for studying hydrological and climatic processes. Spatial variations in stable precipitation isotopes are related to various isotope effects, including the continental effect, the precipitation amount effect, and the altitude effect [1]. Generally, atmospheric moisture is derived primarily from low-latitude oceanic regions, where the initial composition is fixed by evaporation and boundary layer diffusion between the ocean and atmosphere. High δ2H or δ18O values occur near to source regions where vapor is sourced to the atmosphere, and low values occur far from source regions as a result of a progressive rainout history.
Access to data on spatial precipitation isotopes serves as a basis for the widespread application of water isotopes. Since 1961, the International Atomic Energy Agency (IAEA), in cooperation with the World Meteorological Organization (WMO), has been conducting a worldwide survey of the isotopic composition of monthly precipitation [2]. Based on the IAEA and WMO observations, several analyses have been conducted in Southeast Asia, Amazon catchments, Australia, and South Africa [3,4,5,6,7,8]. In China, systemic work has yielded the following findings (including but not limited to): (1) The moisture source is very important to the spatial variations in precipitation isotopes; (2) the temperature effect is significant in North China; and (3) the precipitation amount effect is significant in South China [6,9,10,11].
Despite large-scale precipitation isotope monitoring throughout the country, in West China, observations on precipitation isotopes are quite scarce relative to the huge area and its various terrains. Given the vital role of the Tibetan Plateau and Tianshan Mountains in affecting water resources and the economic issues of the billions of people in Asia, it is necessary to conduct long-term observations of water isotopes in West China. Fortunately, considerably more work has been done recently, and increasingly more isotopic data have been obtained in this region [12,13,14,15,16,17,18]. The addition of new data from West China lays the foundation for a more precise spatial isotopic pattern for China as a whole.
The most common applications of water isotope data are related to the global meteoric water line (GMWL) for hydrological research and the temperature effect for climatic research [1,19]. The use of the GMWL is based on the assumption that precipitation in the studied region has a meteorological pattern similar to the global average. However, this assumption is not valid on a local scale or even on a regional scale, owing to differences in moisture sources and geographical features. The temperature effect may be significantly altered as a result of the addition of another moisture source, especially recycled continental moisture. Therefore, it is necessary to obtain the regional meteoric water line (RMWL) within a region with similar meteorological conditions.
The derivative parameter “deuterium excess” (which was defined as d excess = δ2H–8*δ18O by Dansgaard [1]) is evidently inherited from the initial isotopic composition of an air mass and determined by the air–sea interaction regime [1]; it remains relatively invariant during Rayleigh rainout [20]. D excess in precipitation might help to address the moisture sources and reveal processes, including the condensation of atmospheric vapor, evaporation of water, sublimation of ice, and recycling of continental moisture. At least to the authors’ best knowledge, there has been no spatial analysis of d excess at the regional scale in China, and such an analysis would be undeniably helpful for improving our understanding of precipitation isotopes and hydro-meteorological processes.
In this paper, we divide China into 5 regions based primarily on the moisture sources. Then, based on the new regionalization, we provide spatial and seasonal distributions of water isotopes and d excess. Explanations of the isotopic patterns are related to moisture sources. The RMWLs are presented for each region, which can be used in comparing with the isotopic composition of surface water and groundwater. The relationship between isotopes and temperature (the temperature effect) and that between isotopes and precipitation amount (the precipitation amount effect) are discussed to shed light on their roles in interpreting paleoclimate proxies.
2. Materials and Methods
2.1. Isotopic Data and Analysis
The precipitation isotopic data available for stations in China from the IAEA-WMO Global Network for Isotopes in Precipitation (GNIP) are taken into account in our analysis. To eliminate the edge effect of interpolation data, isotopic data from the GNIP stations around China are adopted. Although this database contains the most comprehensive observation set for water isotopes in precipitation, data in West China are quite scarce relative to the huge area of this region. Recently, new data have been independently generated and published by Tian et al. [12] and Pang et al. [13] in West China, which improved the spatial integrity of precipitation isotopes in China. Although the data are obtained in different years, they are still comparable in analyzing the impact of moisture sources on it and the isotope–meteorological relationship [21,22]. In total, data from a total of 68 stations are used to characterize the isotopic distribution in China (see Table 1). All the δ18O and δ2H values of the precipitation samples are measured by traditional isotope-ratio mass spectrometry or by laser absorption spectroscopy. It should be noted that the data above are from different labs, but all the data were calibrated with respect to Vienna Standard Mean Ocean Water (VSMOW) standards using the same normalization method. Both Tian et al. [12] and Pang et al. [13] tested the same sample in different labs to ensure that the measurement results from different labs were consistent. In total, all the data have a precision within 0.2‰ for δ18O and 1‰ for δ2H.
The multi-year annual average isotopic data (δ18Oave) is calculated using precipitation amount as a weighting factor. Taking δ18O at a station for example,
where δ18Oi, j and Pi, j are the isotopic value and the precipitation amount at month i, year j, respectively.
δ18Oave = sum(δ18Oi, j*Pi, j)/sum(Pi, j)
The regional meteoric water lines (RMWLs) are determined by the least squares regression based on the monthly isotopic data.
2.2. Interpolation
The spatial distribution of precipitation δ18O, δ2H, and d excess is obtained by adopting the Kriging interpolation method. It takes both the distance and degree of variation among known points into consideration and then estimate the unknown points [23]. Among all the Kriging interpolating methods, the ordinary Kriging is selected due to its merits in providing the best linear unbiased predictions and the best sense of minimum variance [24], which helps us to get a regional overview of isotopes. The spherical model, which is one of the most commonly used models in characterizing precipitation isotopes distribution [25], was chosen to describe the experimental semi-variance in this work. Because we are interested in the impact of moisture sources on the precipitation isotopes (large scale atmospheric circulation, i.e., > 100 km), we chose to do the interpolation without the use of ancillary variables, such as elevation [26], which would introduce high amplitude variability into the interpolated surface over short scale lengths.
In order to make the interpolation more reasonable, all the data at the 68 stations were used to generate a spatial distribution of isotopes to the extent of covering all the stations. Then, we added the extent of China to it. All the interpolation and mapping processes were carried out using the ARCGIS software.
2.3. Correlation
The coefficient of determination (r2) between isotopic values, temperature, and precipitation amount is calculated as
where n is the number of monthly samples, x is the isotopic value, and y is the temperature or precipitation. Linear regression analysis is employed to compute the gradient between isotopic values, temperature, and precipitation. The t test is employed to test the significance of the correlation. Among all the stations in China, more than 90% stations have at least 19 samples (n = 19). According to the t test (α = 0.05), the correlation is significant r2 > 0.3 (n = 19).
3. Results and Discussion
3.1. Regionalization of China
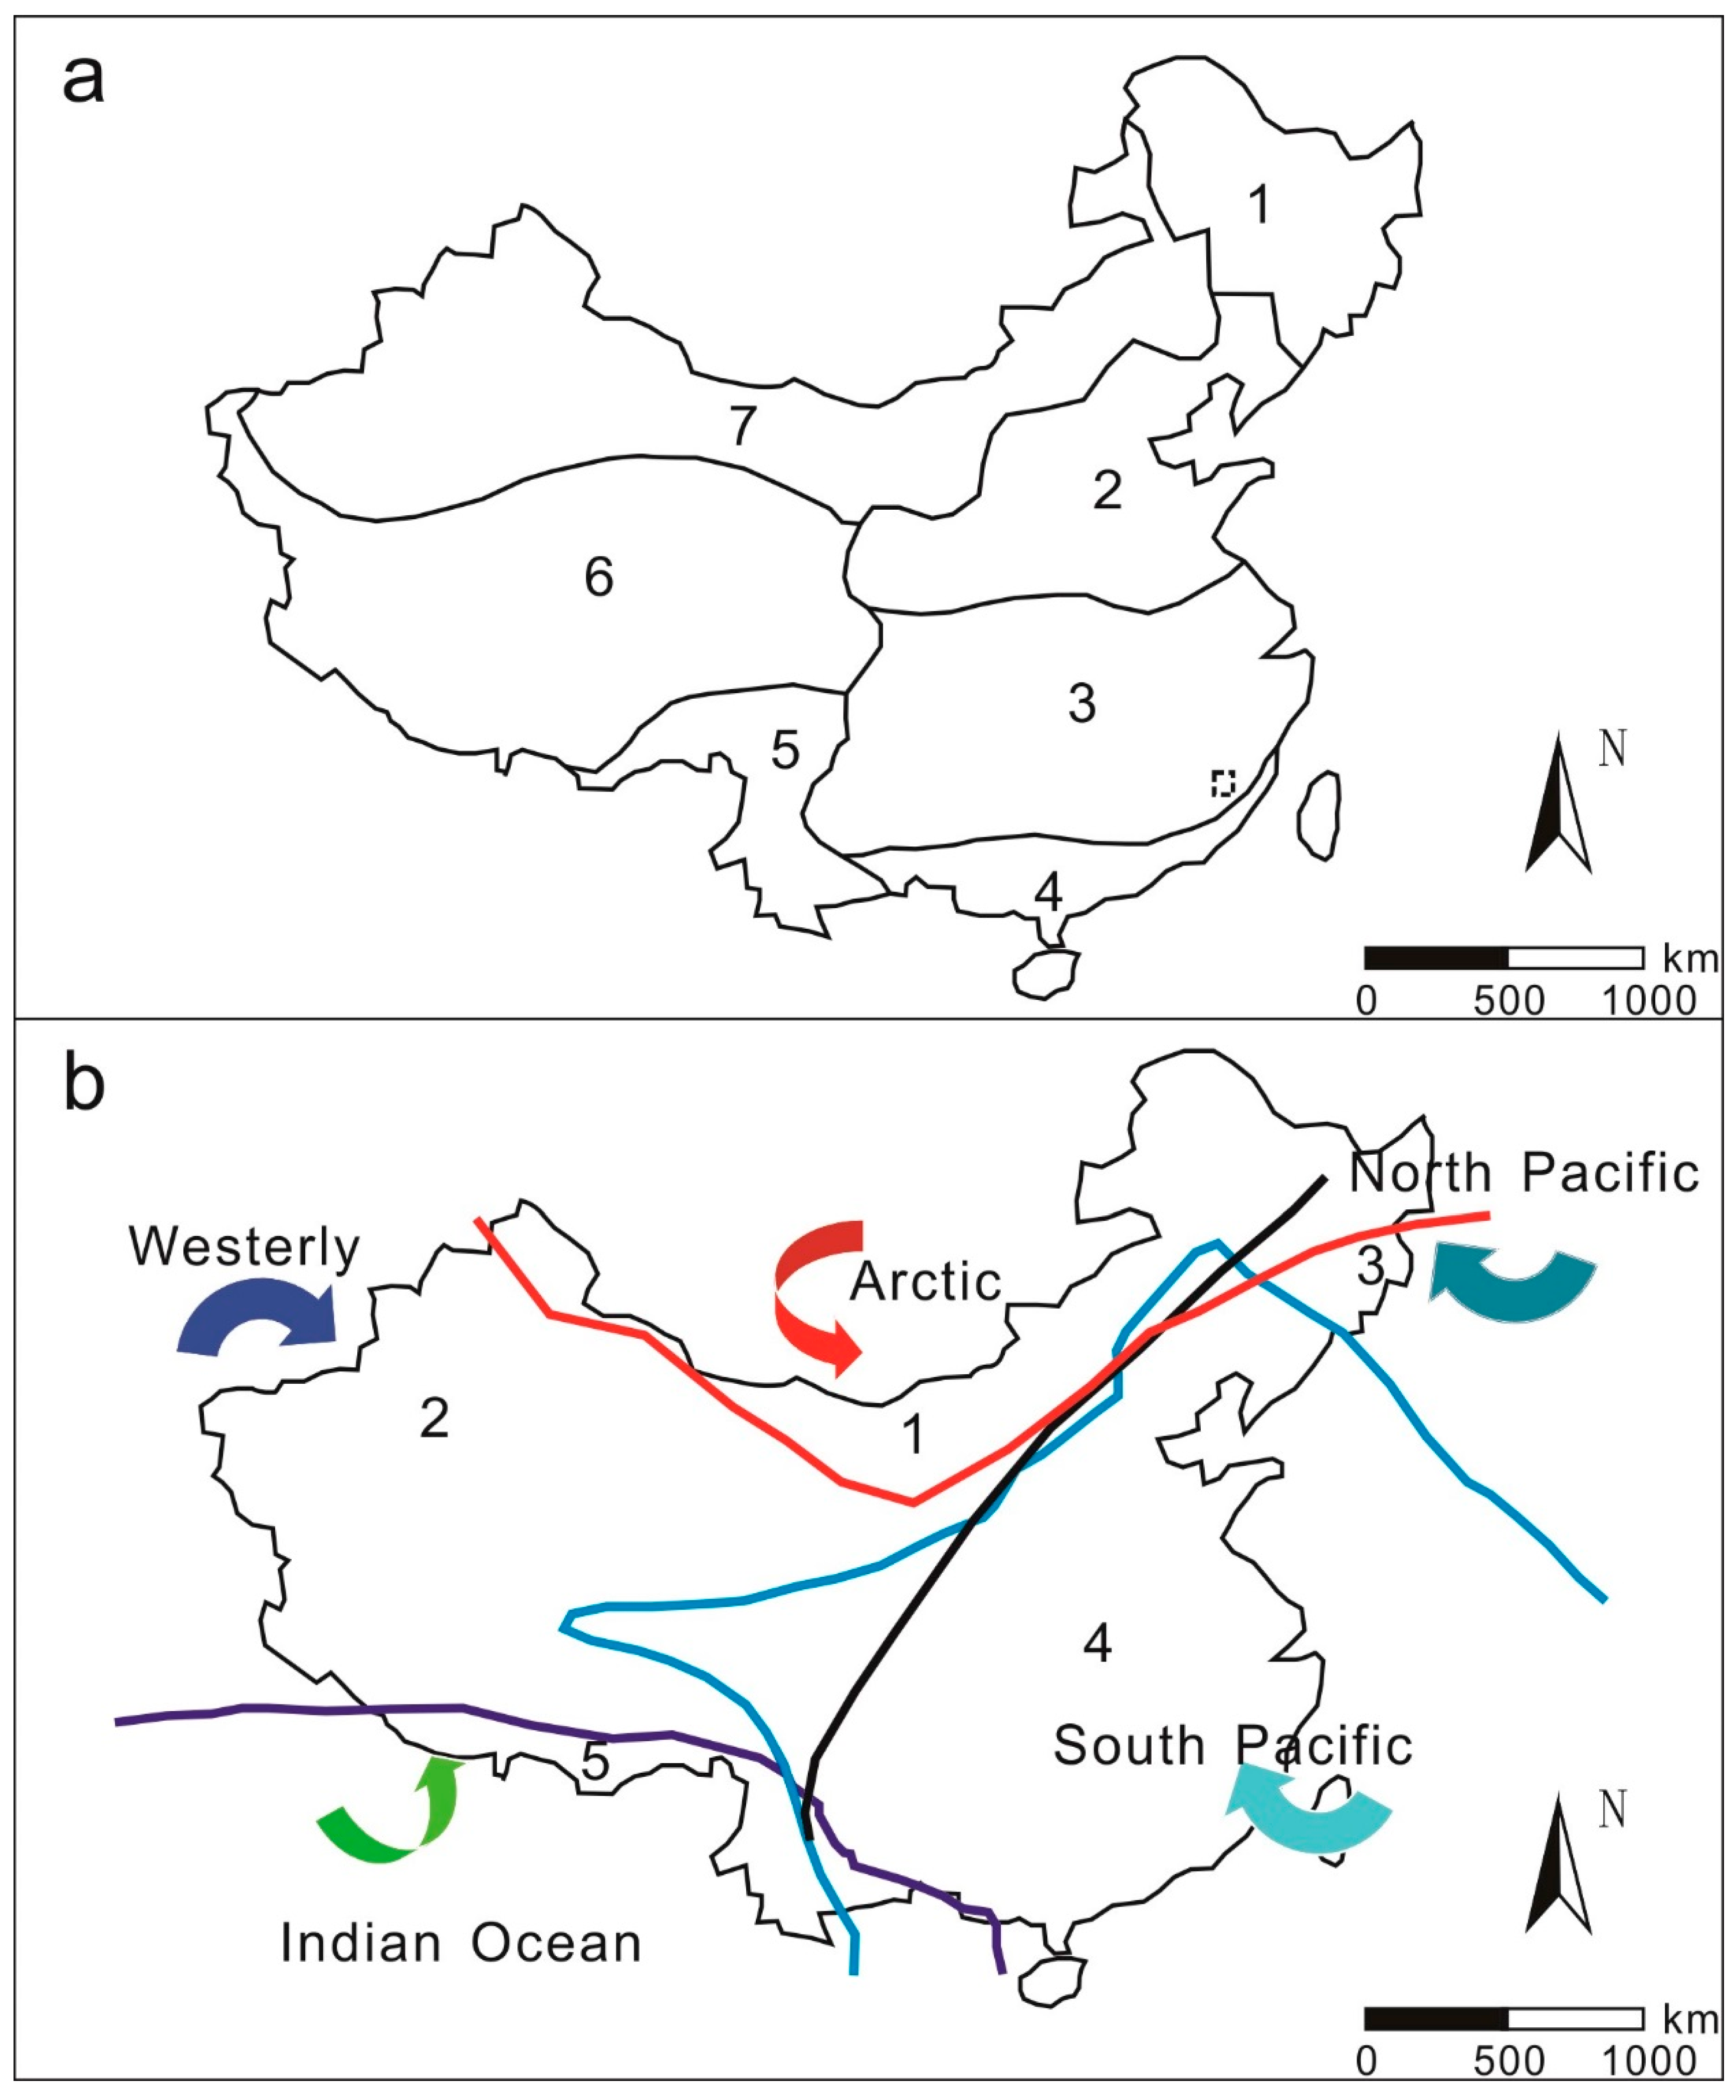
Based on the climate, vegetation, and topography, Luo [27] divided China into 7 regions (Figure 1a). Following this work, Huang [28] re-divided China into 3 regions by merging Regions 1, 2, 3, 4, and part of 5 as the monsoon-affected region, leaving the rest as the Tibetan Plateau (Region 6 and part of 5) and the arid region (Region 7). Generally, these two regionalization schemes are used for the discussion of climatic and geographic features in China. Araguas-Araguas et al. [7] developed a new regionalization scheme based on the moisture sources dominating the precipitation in China (Figure 1b). There are five major air masses that dominate the pluviometric regime of China [7,9]: (1) the polar air mass originating in the Arctic; (2) the westerlies with recycled continental air mass over central Asia; (3) the tropical-maritime air mass originating in the northern Pacific; (4) the equatorial-marine air mass originating in the western equatorial Pacific; and (5) the equatorial-marine air mass originating in the Indian Ocean. Terzer et al. [29] developed a new model, named the regionalized cluster-based water isotope prediction approach (RCWIP), to predict point and large scale spatial-temporal patterns of the stable precipitation isotopes. In their work, they defined 36 climatic clusters, with 4 of them being related to China, whose representative stations are Chiang Rai, Erenhot, Lhasa, and Shanghai, respectively. Their criterion for the clusters were the differences of the climatic variables of temperature, precipitation amount, and vapor pressure between different stations.
The regionalization by Luo [27] incorporates geographical features in China, but it disregards the factor of moisture sources. As a result, one area that has a similar moisture source throughout is divided into two regions. For example, Regions 3 and 4 have the same moisture source from the South Pacific. However, in some cases, regions that have different moisture sources are treated as a single region. For instance, Region 7 is affected by both the westerlies and the arctic air masses. The regionalization by Huang [28] merges all the regions affected by monsoons but overlooks the different geographic features. Although the regionalization by Araguas-Araguas et al. [7] is based on moisture sources, some regions overlap (Figure 1). Furthermore, the extent of some moisture sources is still controversial. Tian et al. [12] found that the northern limit of summer monsoons from the Indian Ocean is in the middle of the Tibetan Plateau, at approximately 34°–35° N, which is farther north than the extent adopted by Araguas-Araguas et al. [7] and Johnson and Ingram [10]. Li et al. [30], Zhou et al. [31], and Xu et al. [32] found that the East Asian summer monsoons (EASM) can reach the Qaidam Basin (farther west than 100° E), whereas previous studies indicated that the direct influence of EASMs reach as far west as 100° E in China [7,33]. Pang [34] summarized the moisture sources over Northwest China on the basis of a meta-analysis of water isotopes in the region, demonstrating that the Arctic polar air mass could reach as far as the Junggar Basin and that summer monsoons from both the Indian and Pacific Oceans has little impact.
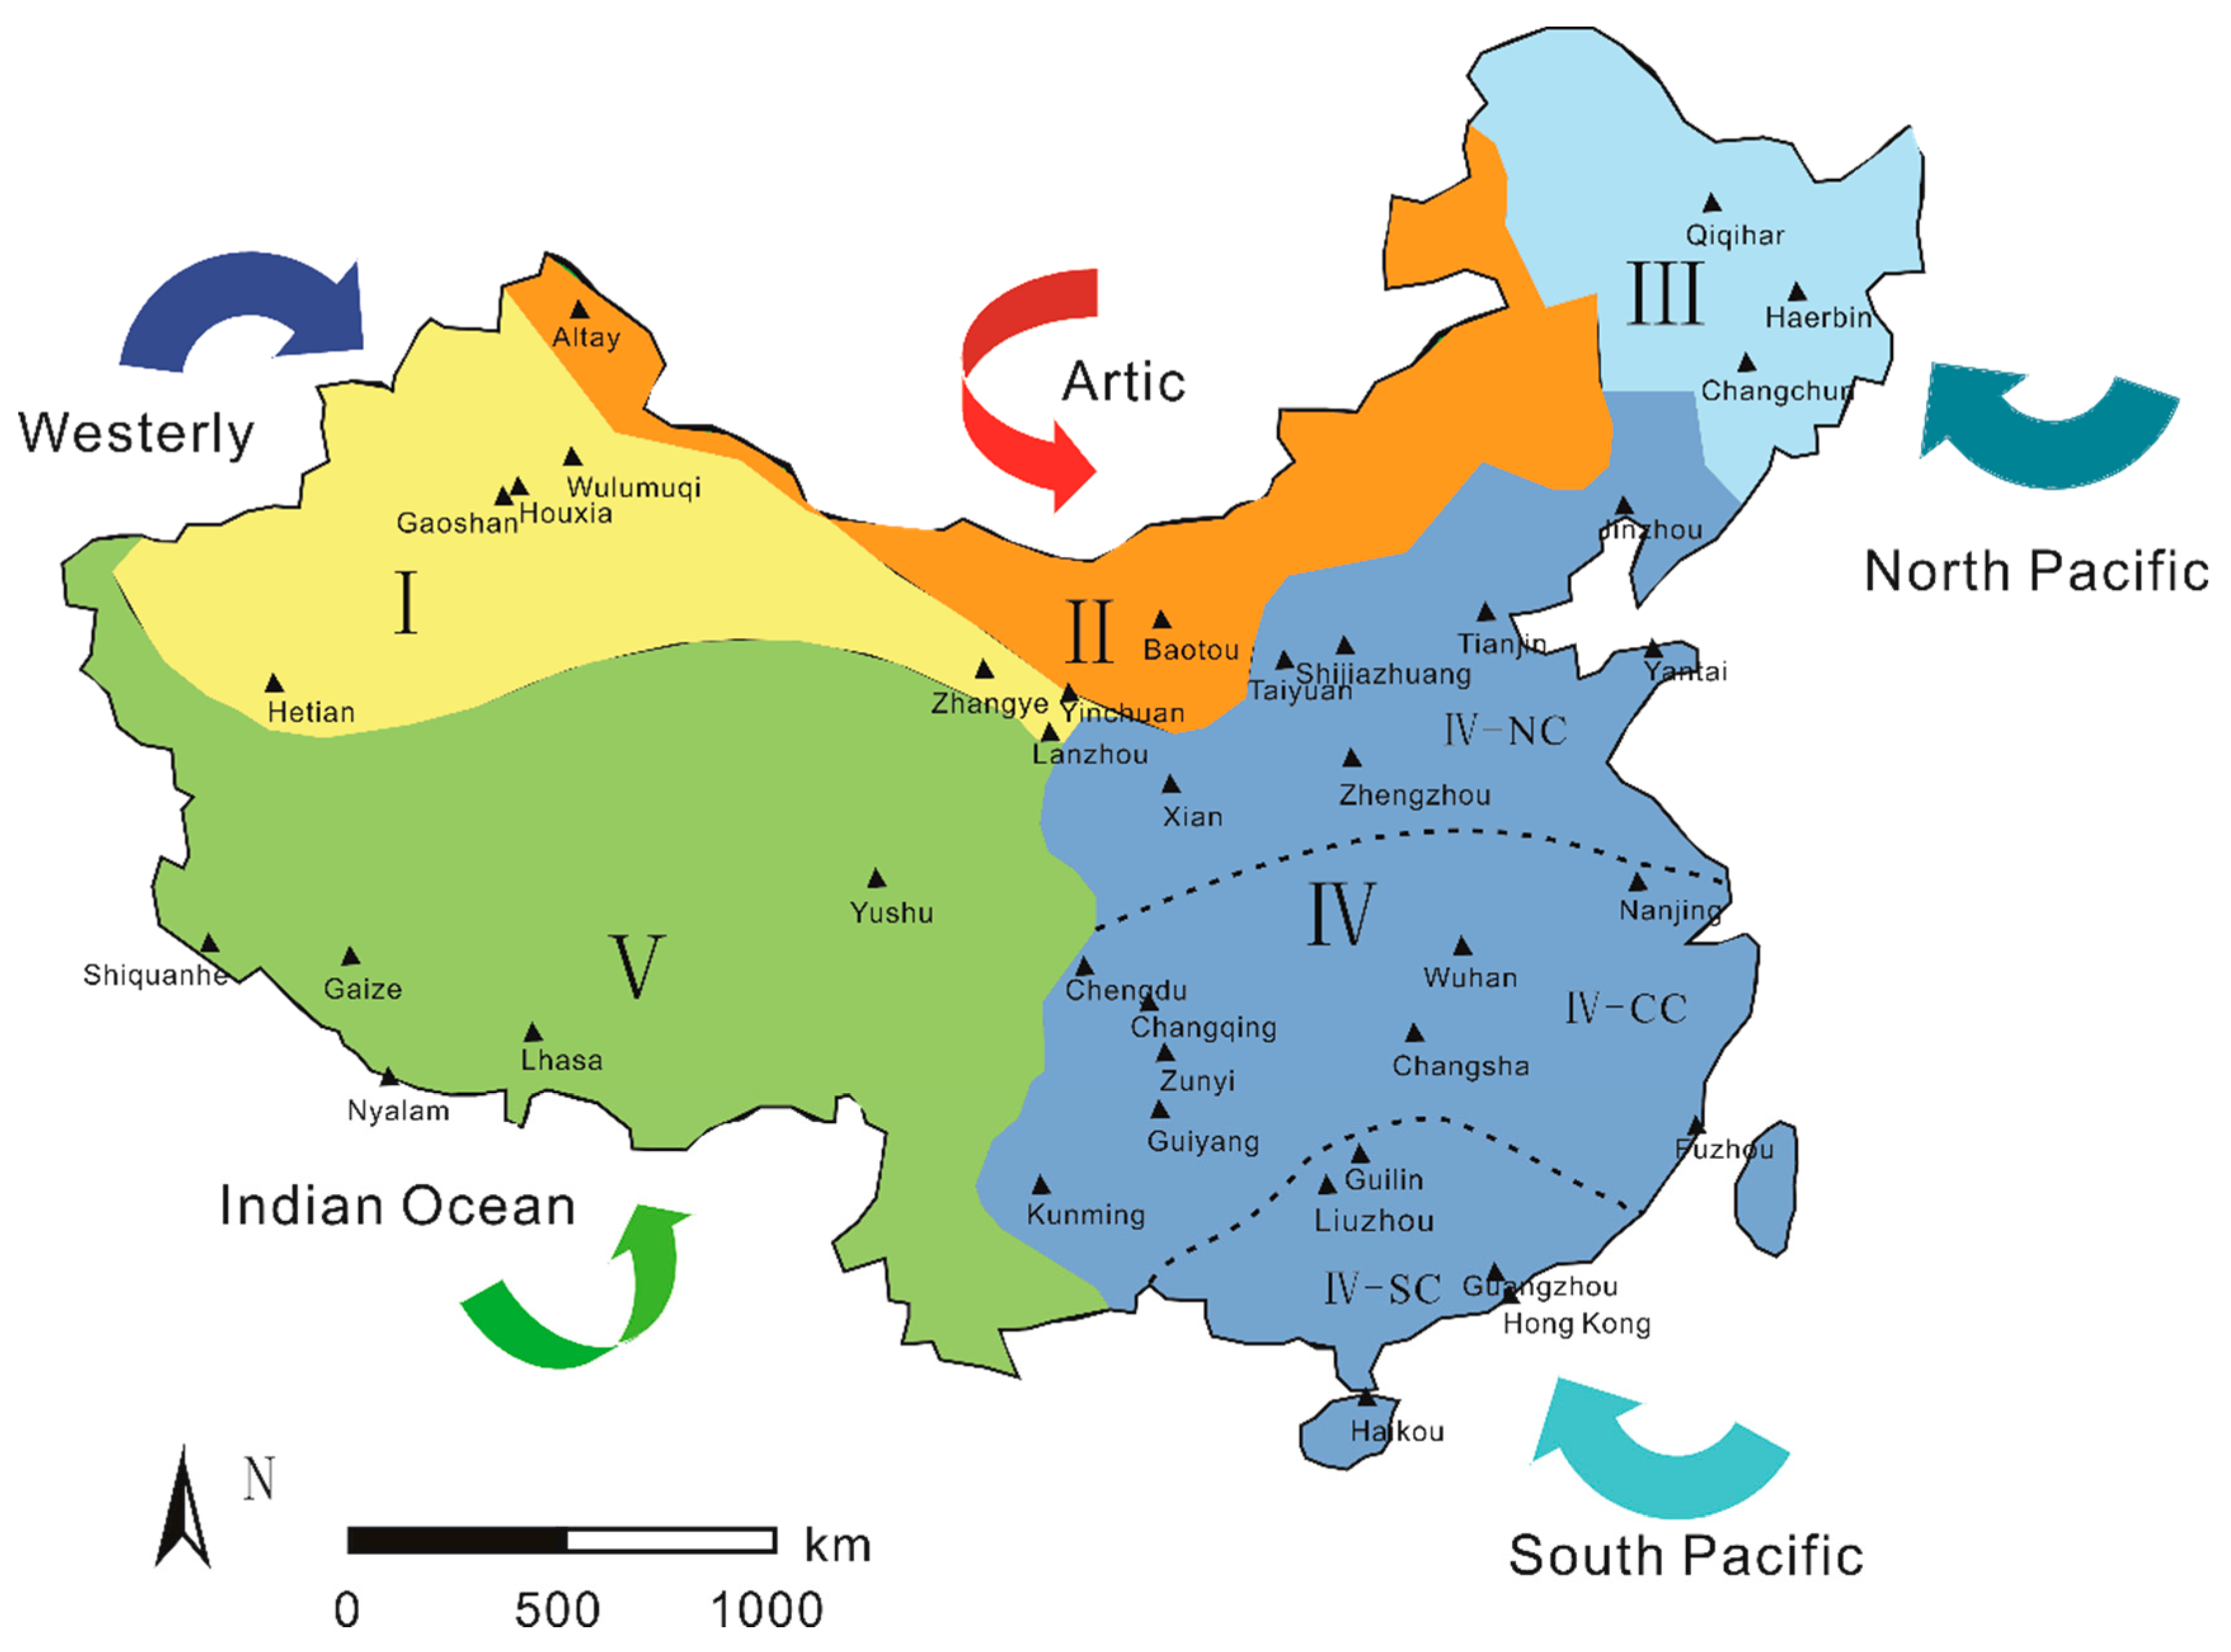
When comparing and summarizing from the regionalization schemes of Luo [27], Huang [28], and Araguas-Araguas et al. [7], we find that each region could have its own isotopic patterns affected by moisture sources and other factors. This has also been verified by the recent isotopic studies in China that showed the dominating factor affecting isotopes should be moisture sources and then the local geographical meteorological factors [11,35,36]. To understand the temporal and spatial variation of precipitation isotopes, we devise a new regionalization scheme in this work. The primary factor we consider for this scheme is the moisture source. Thus, we divide the northern continental portion of China into Northwest China (Region I: the westerlies domain) and North China (Region II: the arctic domain). Because the South and North Pacific-dominated regions partially overlap owing to their similar moisture sources, we treat Northeast China as a single region (Region III: the northeast domain) due to its climatological and geographical differences from the rest of the region (Region IV: the Pacific domain). As in the previous regionalization, the Tibetan Plateau is treated as a single region (Region V) because the climatology and tectonic features of the Tibetan Plateau are quite different from those of other regions in China. The Tibetan Plateau plays an important role in affecting regional climatology [7,12,37]. This region impacts both the westerlies and the summer monsoons. The high mountains block the westerlies and split the jet stream, which moves to the south and north of the plateau [7]. The elevated heating by the Tibetan Plateau of the atmosphere plays a fundamental role in the formation and maintenance of the summer circulation, at least over Asia. The onset of the Bay of Bengal monsoon (BOBM) and the EASM can be linked to the thermal and mechanical forces of the Tibetan Plateau [37].
Compared with the regionalization by Araguas-Araguas et al. [7], our regionalization keeps the primary criterion as the moisture sources. However, the improvements can be found in our regionalization by taking into account the geographical and climatic factors. The overlapping regions do not exist as a result of combining the regionalization schemes of Luo [27], Huang [28], and Terzer et al. [29]. The extent of Regions IV and V is ascertained by considering the recent findings of the Indian Ocean and Pacific monsoons mentioned above. The region of the Tibetan Plateau is highlighted in light of its effect on the regional climate.
Collectively, China is divided into 5 regions (Figure 2). All of the results and discussion regarding precipitation isotopes in China will be based on this regionalization.
3.2. Spatial Distribution of Stable Isotopes and D Excess
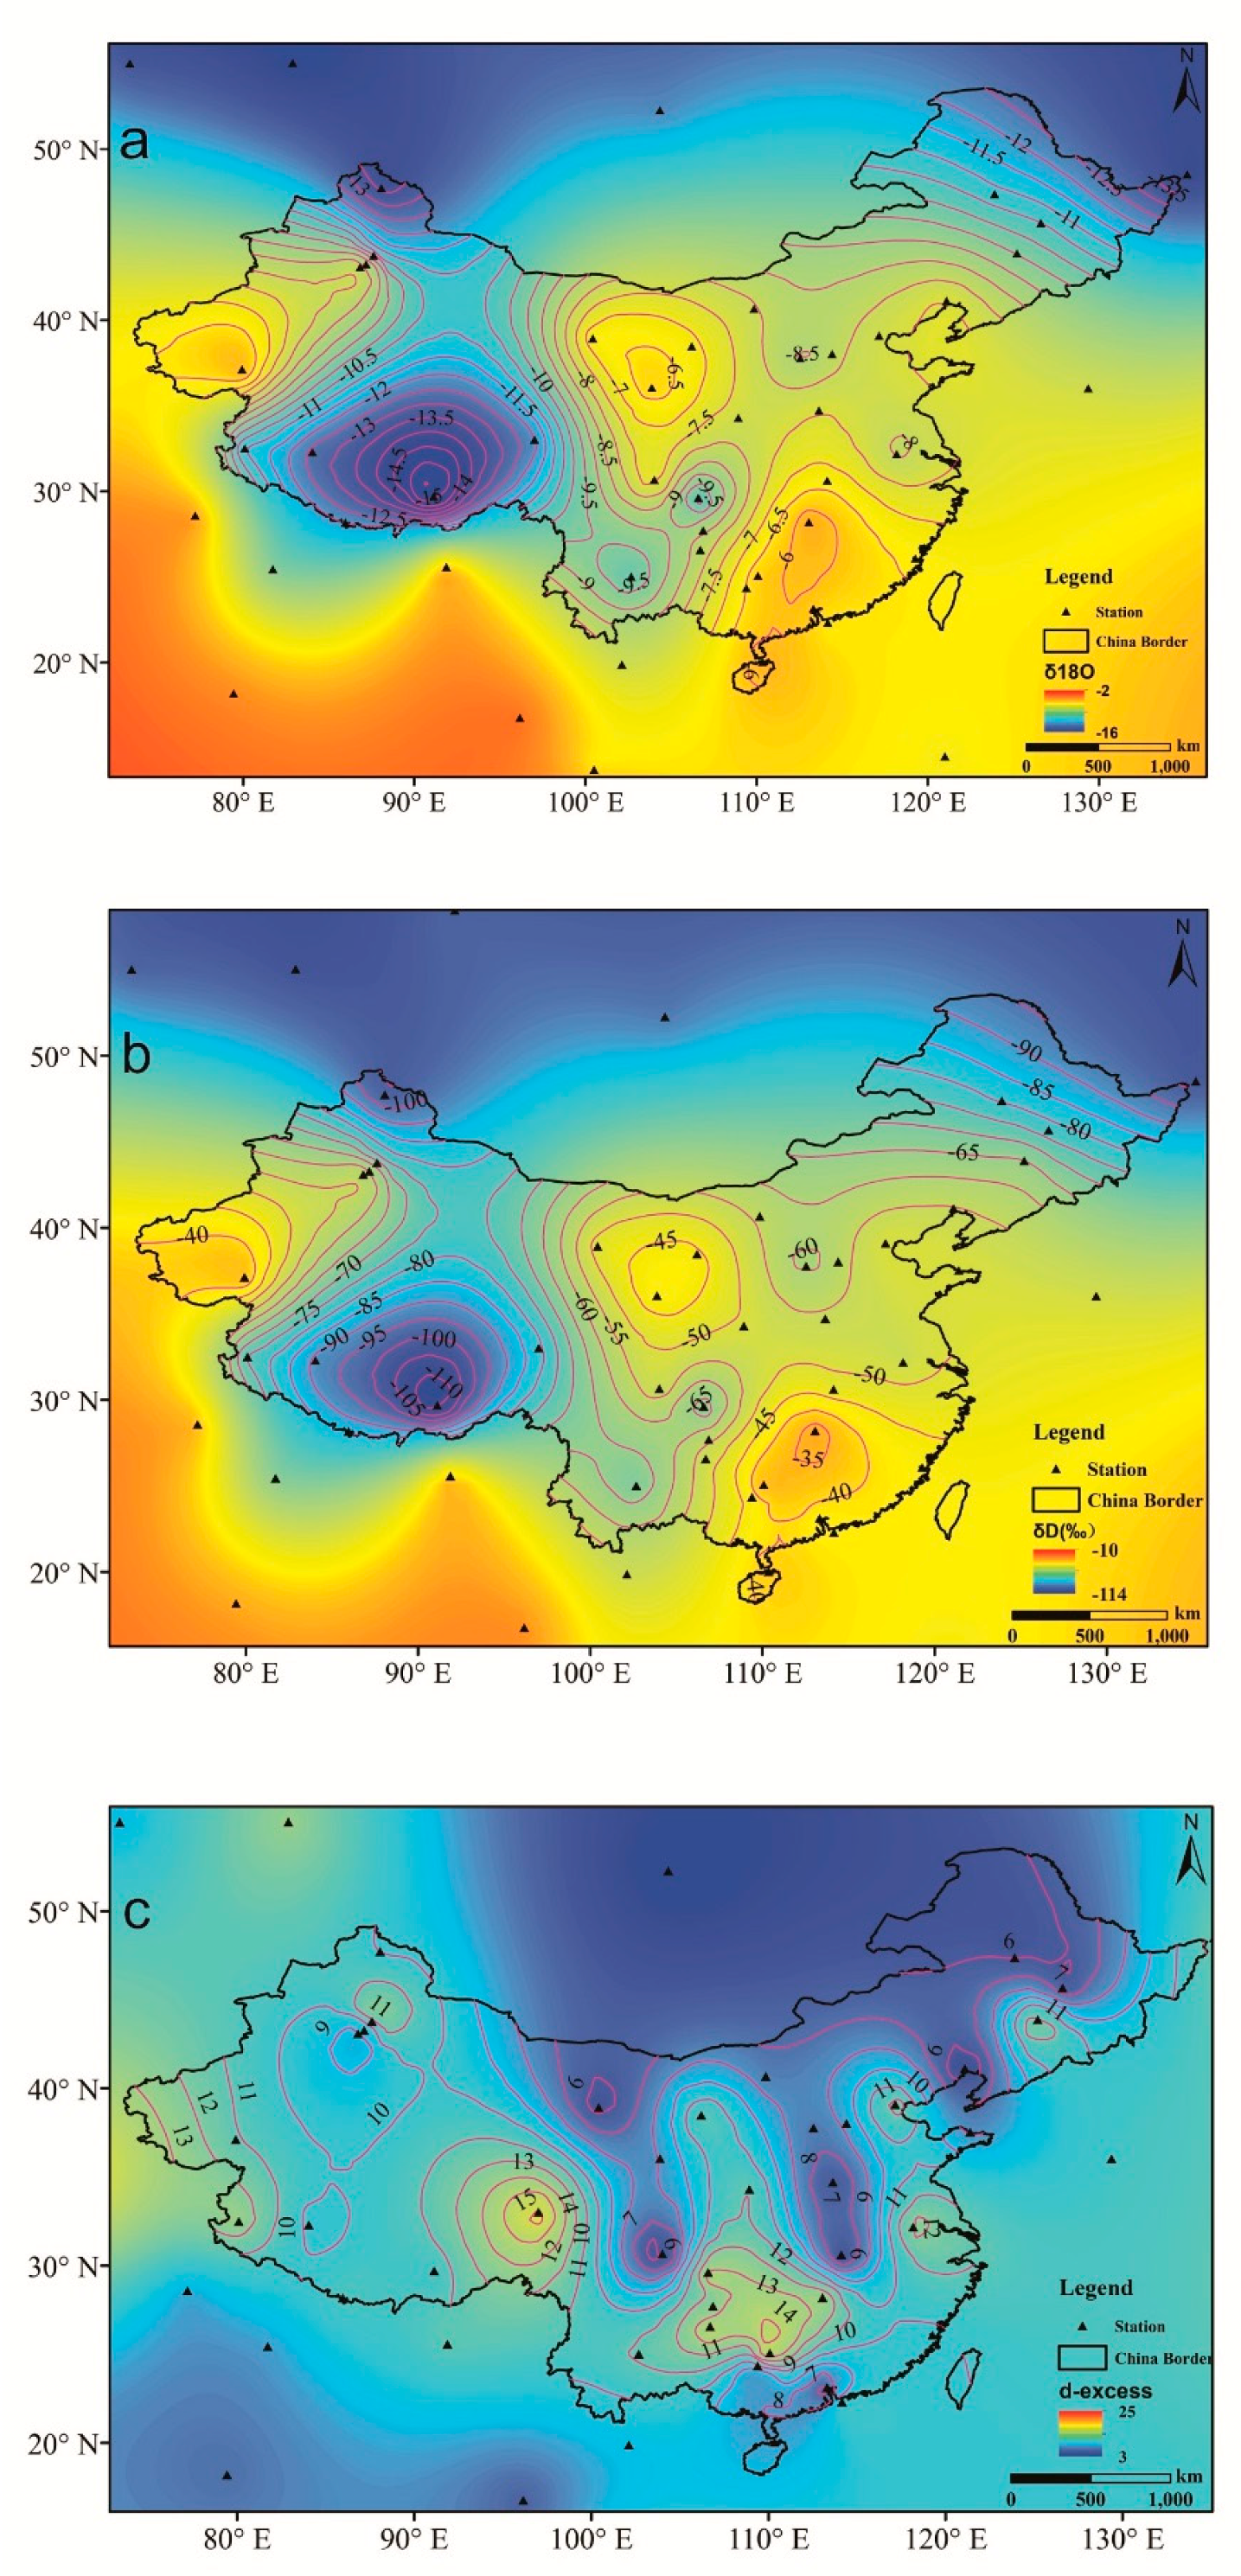
A clear pattern of the annual average isotopic distribution can be seen in Figure 3a,b. The minimum δ18O with a value of −15.9‰ is at Lhasa station, and the maximum value of −5.7‰ is at Haikou station. The minimum δ2H is −117.2‰ at Lhasa station, and the maximum is −34.7‰ at Guilin station. Isotopes become depleted from south to north overall, which is consistent with the latitude effect reported globally [1]. Though a similar depleted trend can be found from east to west, we could not attribute this trend to the continental or altitude effect because precipitation is formed by different moisture sources from East to West China.
The d excess ranges from 4.7‰ at Chengdu station to 14.8‰ at Guilin station (Figure 3c). Most of the values are close to the global average of 10‰ [1]. Comparing the spatial distribution of d excess with that of δ18O (Figure 2 and Figure 3), we find that in Regions I, III, and V, the contours of δ18O are intensive, whereas the contours of d excess are scarce; in contrast, in Region IV, the δ18O values change slightly, whereas the d excess varies as a complex feature. This pattern occurs because in Regions I, III, and V, δ18O declines gradually along the track of the air masses from the westerlies, the North Pacific, and the Indian Ocean, respectively, whereas in Region IV (the monsoon region), precipitation mainly occurs in summer caused by the monsoons, maintaining consistent δ18O values [38,39]. This pattern fits well with the dominant role of moisture sources in controlling precipitation isotopes.
3.3. Seasonal Variations of Precipitation Isotopes and D Excess
Stations with a full-year record of stable isotopes are selected to show the seasonal variations and their relationship with moisture sources in each region.
(1) Region I
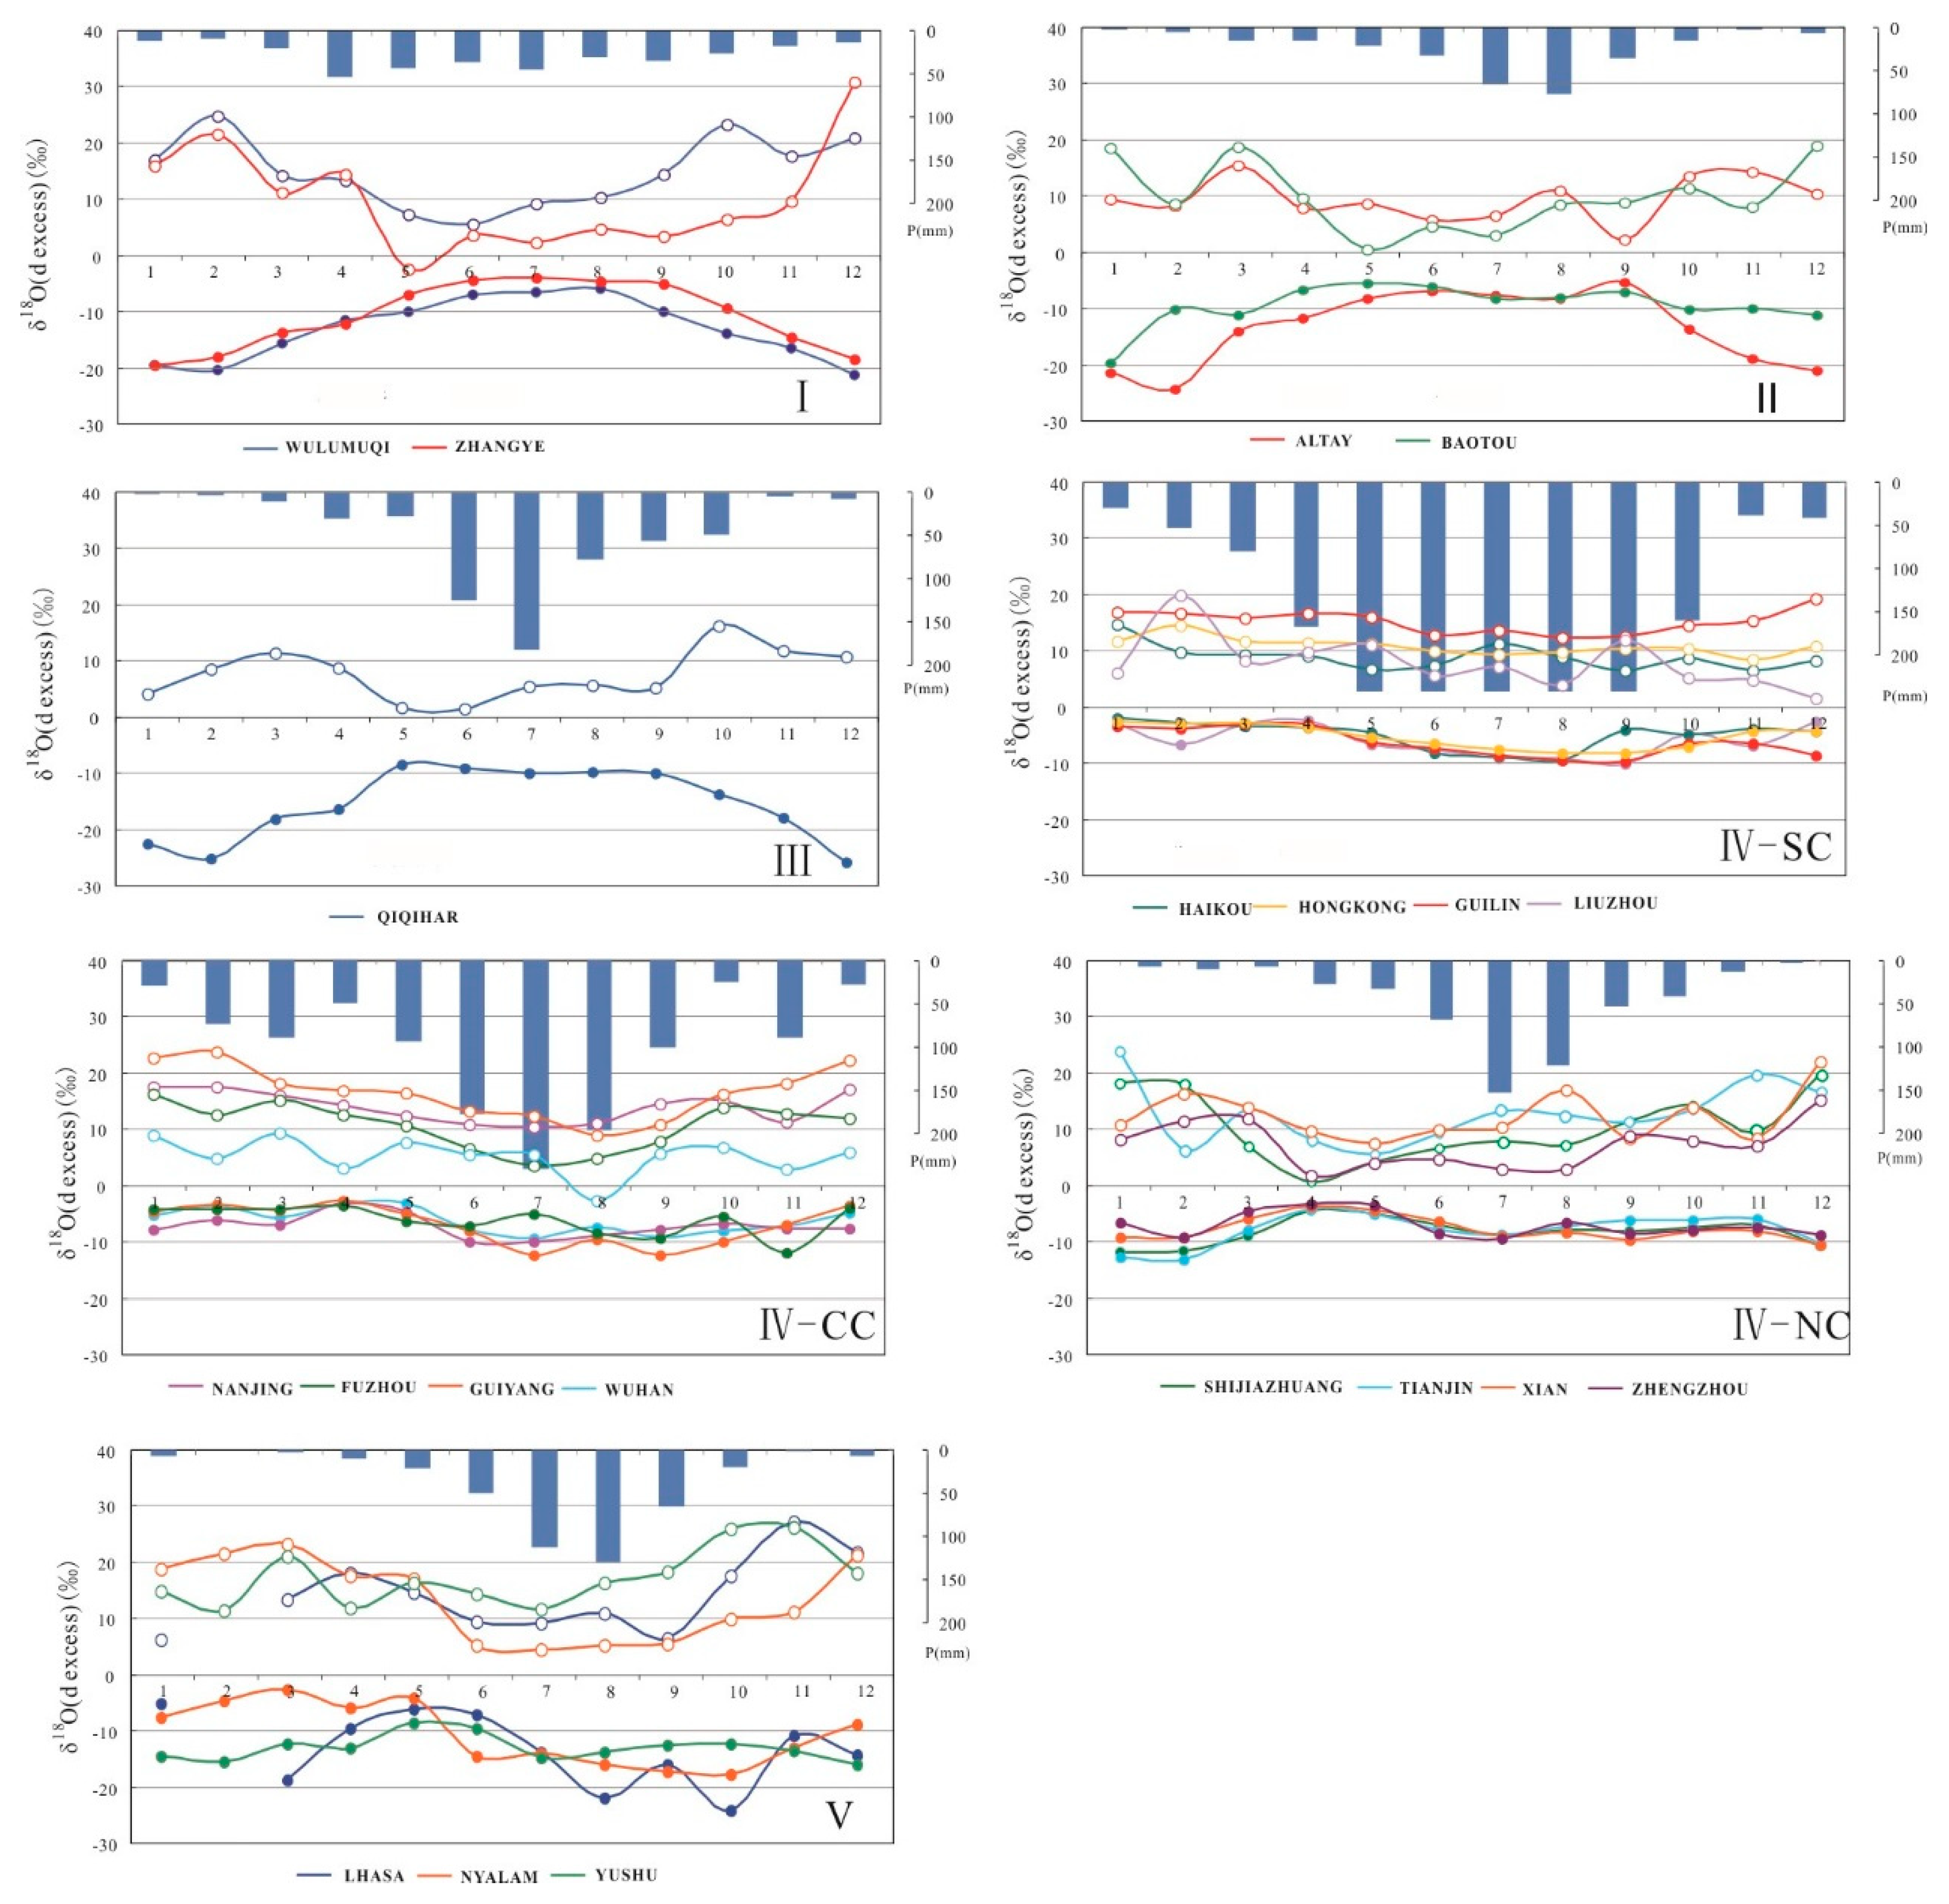
The Wulumuqi and Zhangye stations are used to show the seasonal variations in precipitation isotopes (Figure 4). The δ18O values range from −21.0‰ to −3.7‰, increase gradually from January to July, and then decrease from August to December. The d excess in this region has the largest amplitude (32.0‰) among all the regions. In summer, the d excess is lower than the global average of 10, whereas in winter, it is greater than 10. As noted above, precipitation in this region is mainly formed by moisture from the westerlies. Measuring the isotopic composition of ice core samples taken from a high-altitude glacier in the Tianshan Mountains and the isotopic composition of snow and firn taken from a high mountain of the Siberian Altay, Kreutz et al. [40] and Aizen et al. [41] suggested that seasonal changes in moisture sources and recycling in the Caspian Sea region during transport from the Atlantic to the sampling site in the Tianshan Mountains are responsible for the variability in d excess. Pang et al. [13] and Kong et al. [15] further noted that moisture recycling during summer and autumn amplified the seasonal change in d excess in this region.
(2) Region II
The Altay and Baotou stations are selected to show the seasonal variations in precipitation isotopes (Figure 4). The isotopic change in Region II is very similar to that in Region I. Nevertheless, the d excess is very different—the d excess has a clear seasonal pattern in Region I, which does not exist in Region II. Comparing the d excess at Wulumuqi and Altay stations, we find they are similar in summer (8.4‰ at Wulumuqi and 7.8‰ at Altay) and different in winter (20.3‰ at Wulumuqi and 9.8‰ at Altay). However, the d excess at Baotou station is closer to that of Wulumuqi in winter, which are both larger than 14.0‰. This finding may show that in winter the only moisture source for Altay is the Arctic Ocean, whereas Baotou has an additional moisture source from the westerlies.
(3) Region III
The Qiqihar station is selected to show the seasonal variations in precipitation isotopes (Figure 4). The δ18O values in this region are lower than in other regions. The δ18O values (−9.6‰) are higher in summer and lower (−25.1‰) in winter. In contrast, the d excess values are lower (3.9) in summer and higher (9.3) in winter. The temporal variations of δ18O and d excess values in this region are similar to that in Region I. However, Figure 2 shows that moisture sources in Region III are quite different from those in Region I. In Region III, the moisture source in summer is the Pacific Ocean, which has lower d excess and high δ18O values; however, the source in winter is the Arctic Ocean, which has higher d excess and lower δ18O values [35,39]. This difference in moisture sources leads to the temporal variation of precipitation isotopes and d excess.
(4) Region IV
To track the onset of the monsoon season, Region IV is further divided into the sub-regions of South China (SC), Central China (CC), and North China (NC) (Figure 4).
The Haikou, Hong Kong, Guilin, and Liuzhou stations are selected to show the seasonal variations in precipitation isotopes in Region SC. Figure 4 shows that the δ18O values begin to decrease in April, which is the onset of the monsoons [36,42]. The observed decreasing δ18O values could be explained by the precipitation amount effect. The d excess values change very little throughout the year, exhibiting features of a marine moisture source.
The Nanjing, Fuzhou, Guiyang, and Wuhan stations are selected to show the seasonal variations in precipitation isotopes in Region CC. The δ18O values in CC begin to decrease in May, which is a month later than in Region SC. The d excess in winter (15.0‰) is higher than in summer (8.0‰), which is different from Region SC. This finding implies that precipitation isotopes in winter have been affected by moisture from the north.
The Shijiazhuang, Tianjin, Xian, and Zhengzhou stations are selected to show the seasonal variations in precipitation isotopes in Region NC. Both the δ18O and d excess values in this region vary more significantly than in Regions SC and CC. Obviously, the values are affected by moisture from the north and northwest. However, in summer, the moisture is mainly derived from the Pacific Ocean [38]. The δ18O values begin to decrease in May. Compared with the δ18O values in Regions SC and CC, the decreasing δ18O values reveal the onset of the monsoon season from April to June in different parts of Region IV.
(5) Region V
The Lhasa, Nyalam, and Yushu stations are selected to show the seasonal variations in precipitation isotopes (Figure 4). The seasonal variation in δ18O values in this region is similar to that in Region SC. However, the δ18O values are lower than in Region SC because of the higher altitude in Region V. The d excess values in this region are high in winter and low in summer. It should be noted that the d excess values at Yushu station are different from those at Lhasa and Nyalam stations. In summer, the d excess at Yushu station (14‰) is much larger than that at Lhasa and Nyalam stations (10‰ and 5‰) because the moisture is mainly from the Indian Ocean at Lhasa and Nyalam stations in summer, whereas Yushu station is less influenced by Indian Ocean moisture [12].
In summary, it is found that in each region, the moisture source plays a primary role in controlling the precipitation isotopes. What’s more, with the long-term observation at the GNIP stations (i.e. Hongkong, Wulumuqi), the seasonality remains robust. Compared with the existing regionalization scheme, such a new regionalization scheme helps to identify the factors affecting isotopic variability. However, when using the regionalization scheme, it should be noted that the similarity of isotopic seasonality at each station is incorporated as a factor for the regionalization scheme, but is not the only factor. For instance, the δ18O values are higher in summer and lower in winter at both Wulumuqi and Qiqihar stations, but we divide them into different regions due to different moisture sources and geographical factors. Even in one region, the same moisture source might play different roles at different stations, especially for the stations located at the boundary of two regions, such as Baotou in Region II, Shijiazhuang in Region IV, and Yushu in Region V. For example, both stations of Altay and Baotou are located in Region II of the Artic Region, but in winter the Artic moisture source affects the precipitation isotopes at Altay station more significantly than that at the Baotou station, while in summer the effects at both stations are similar. Therefore, the factors influencing the precipitation isotopes are complex. The regionalization scheme helps to illustrate the impact of moisture sources on the precipitation isotopes, but one has to keep in mind that other factors, including local metrological and geographical conditions, could also modify them.
3.4. Regional Meteoric Water Line (RMWL)
The regional δ2H-δ18O relationship, which is well known as the RMWL, provides a reference for interpreting the provenance of surface water and groundwater. The East Asia meteoric water line (EAMWL) of δ2H = 7.92δ18O + 9.2 was obtained by Araguas-Araguas et al. [7]. This line is indistinguishable from the GMWL of δ2H = 8δ18O + 10. For regions where isotopic data are unavailable, the EAMWL is very useful as a reference for groundwater studies; however, it cannot represent the features of local precipitation for a given region because precipitation isotopes at each region could be modified by local climatic factors, including the origin of the vapor mass, sub-cloud evaporation during rainfall, and the seasonality of precipitation [43]. Thus, in this case, the EAMWL cannot define the groundwater input. Taking these local factors into consideration, we present the meteoric water lines based on the monthly isotopic data for each region (Figure 2) with a dominant single moisture source and similar climatological characteristics (Table 2).
The slopes of RMWLs for Regions I–IV, which have an average of 7.19 with a deviation of 0.52, are slightly less than the slope (7.92) of EAMWL and the slope (8) of GMWL, while the slope of RMWL for Region V (the Tibetan Plateau) is 8.41, which is larger than all the other slopes (Table 2). It is known that the sub-cloud evaporation decreases the slope of the meteoric water line, whereas moisture recycling increases it [13,15,43,44]. Although the seasonality of precipitation could also modify the slope of RMWL, there are no significant differences of precipitation patterns between Region V and the other regions. Thus, we deduce that the Tibetan Plateau region (Region V) is affected by moisture recycling, whereas other regions are affected by sub-cloud evaporation. This conclusion maintains consistency with previous studies in the Tibetan Plateau, Northwest, North, South, and Eastern China [15,25,45,46,47].
3.5. Spatial Extent of the Isotope–Climate Relationship
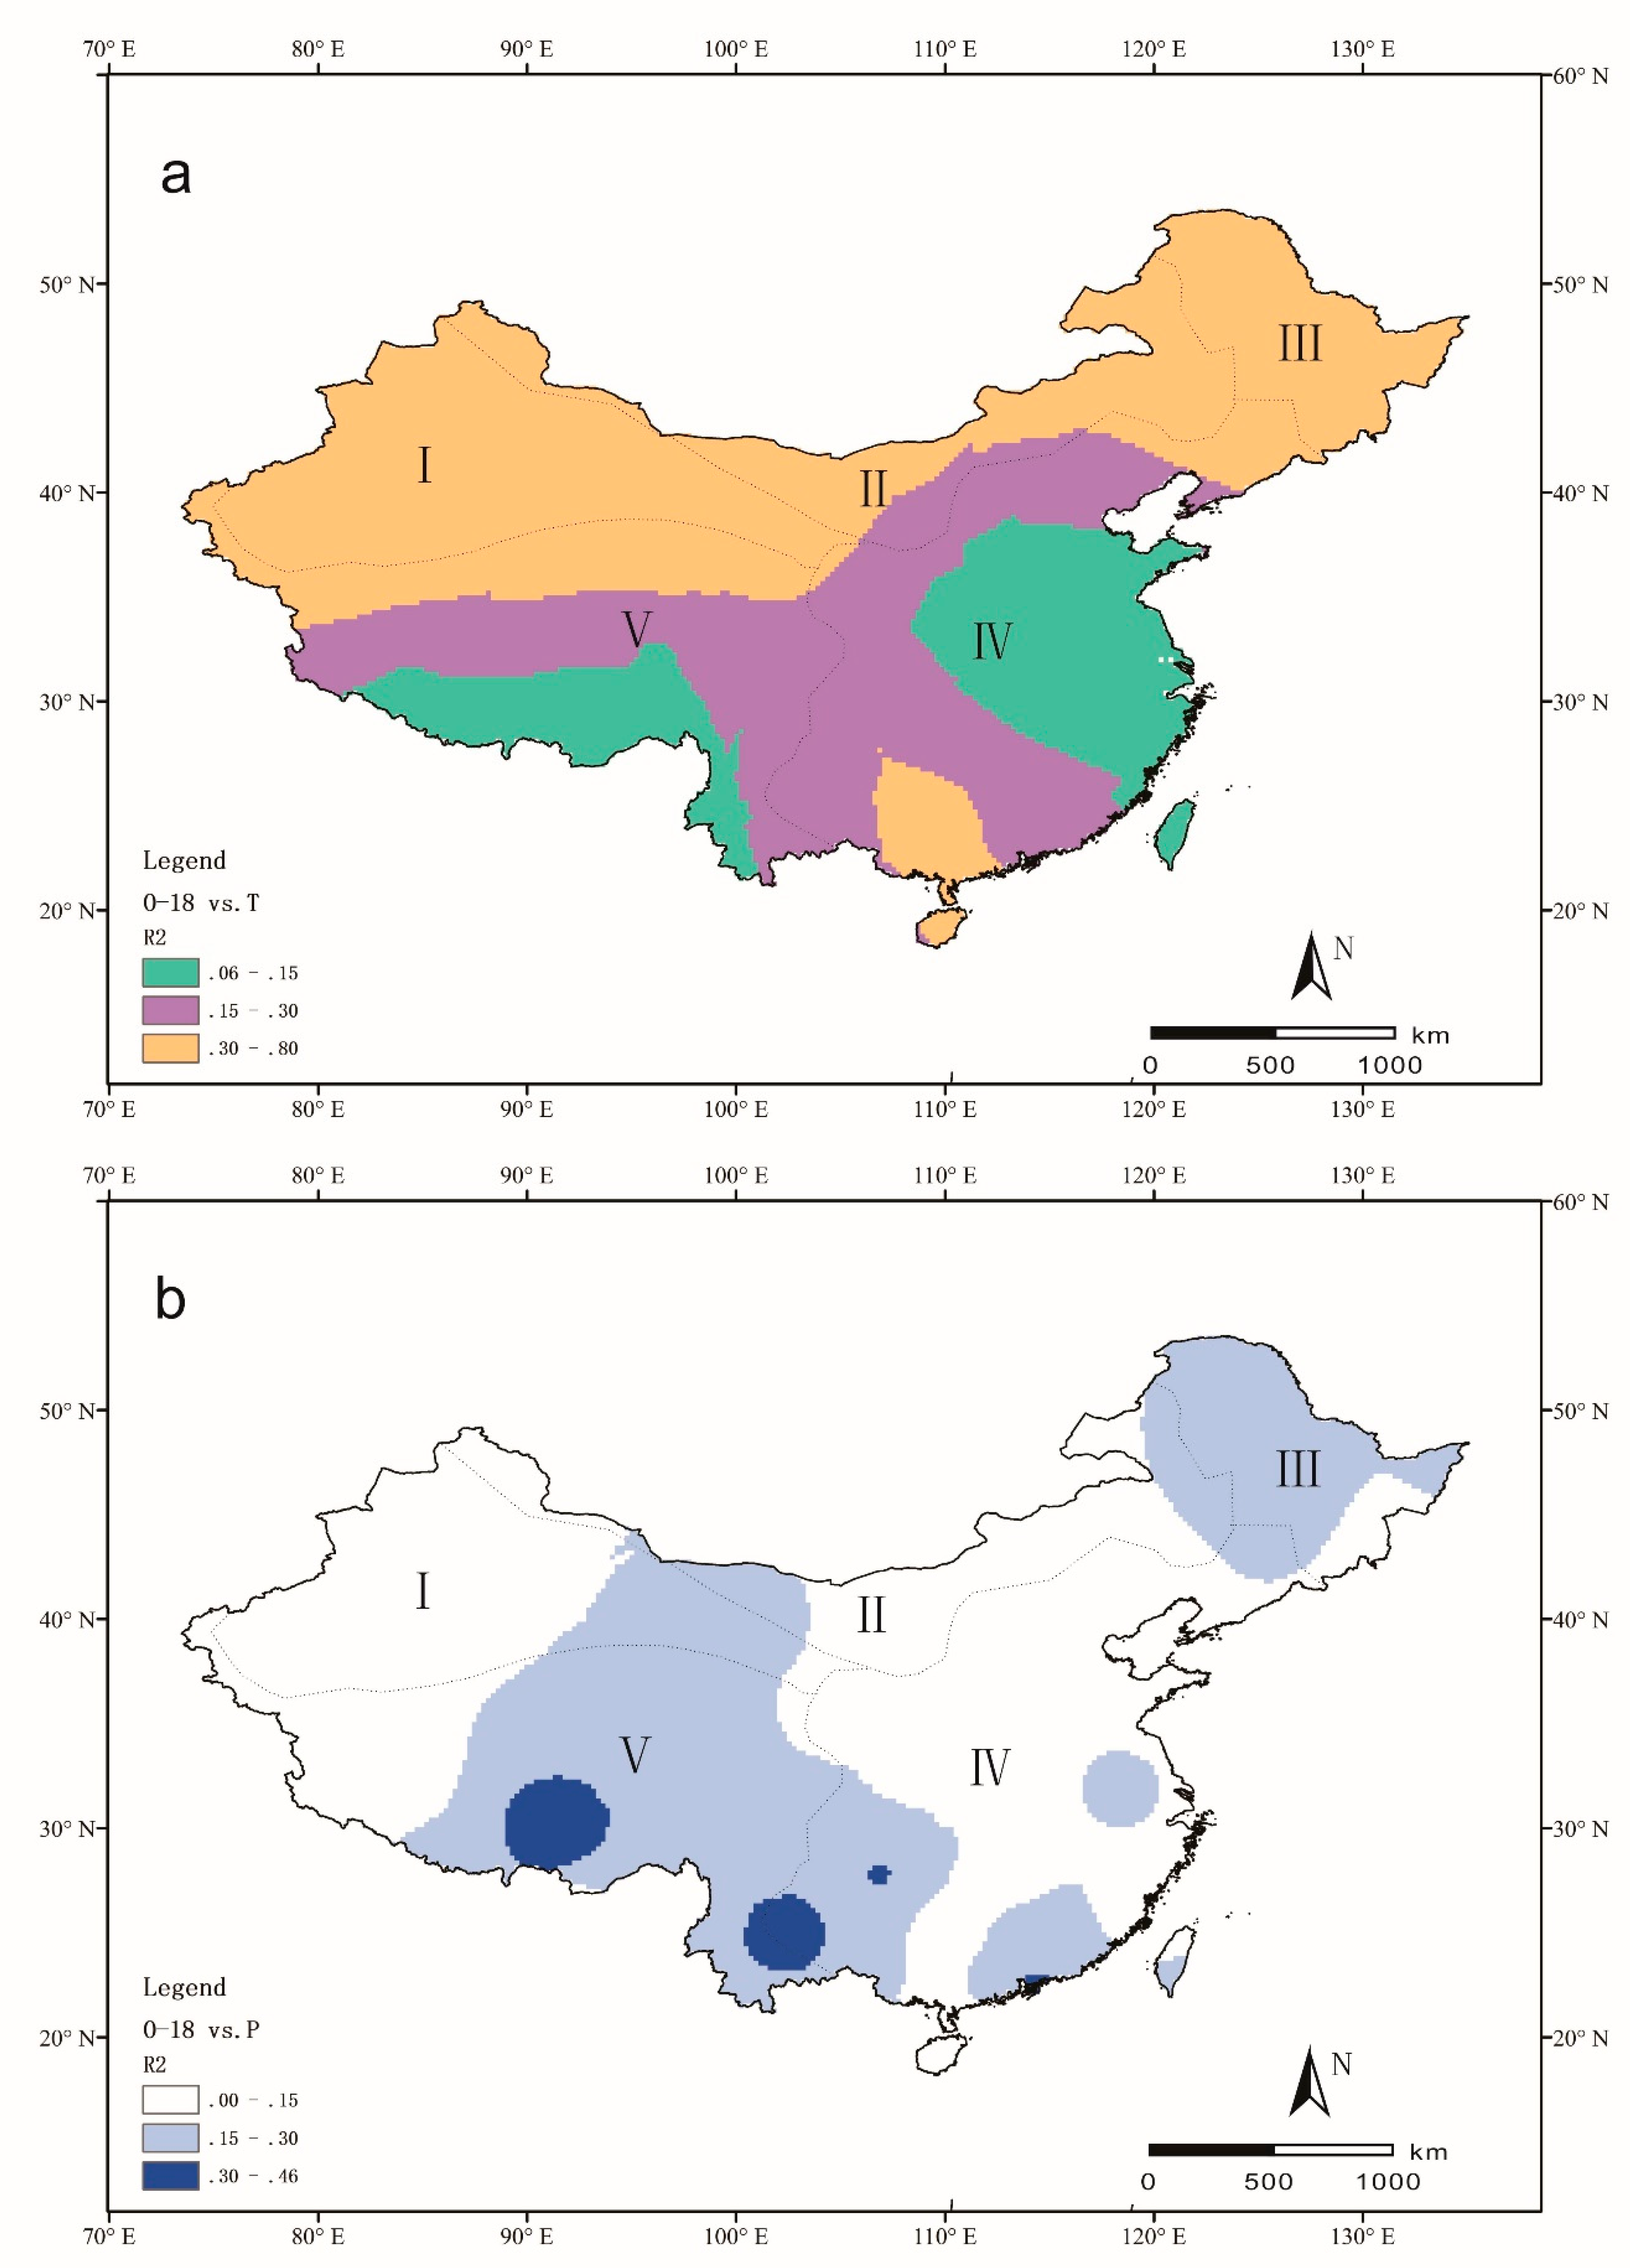
Given the parallel behavior of δ18O and δ2H, we use the δ18O–temperature and δ18O–precipitation amount relationships to reveal the effect of climate on precipitation isotopes. Figure 5 shows the regional variation in correlation coefficients between δ18O, temperature, and precipitation amount. According to the available data, the correlation is significant when the correlation coefficient is larger than 0.3 (pale yellow region in Figure 5a and dark blue region in Figure 5b); otherwise, it is not significant.
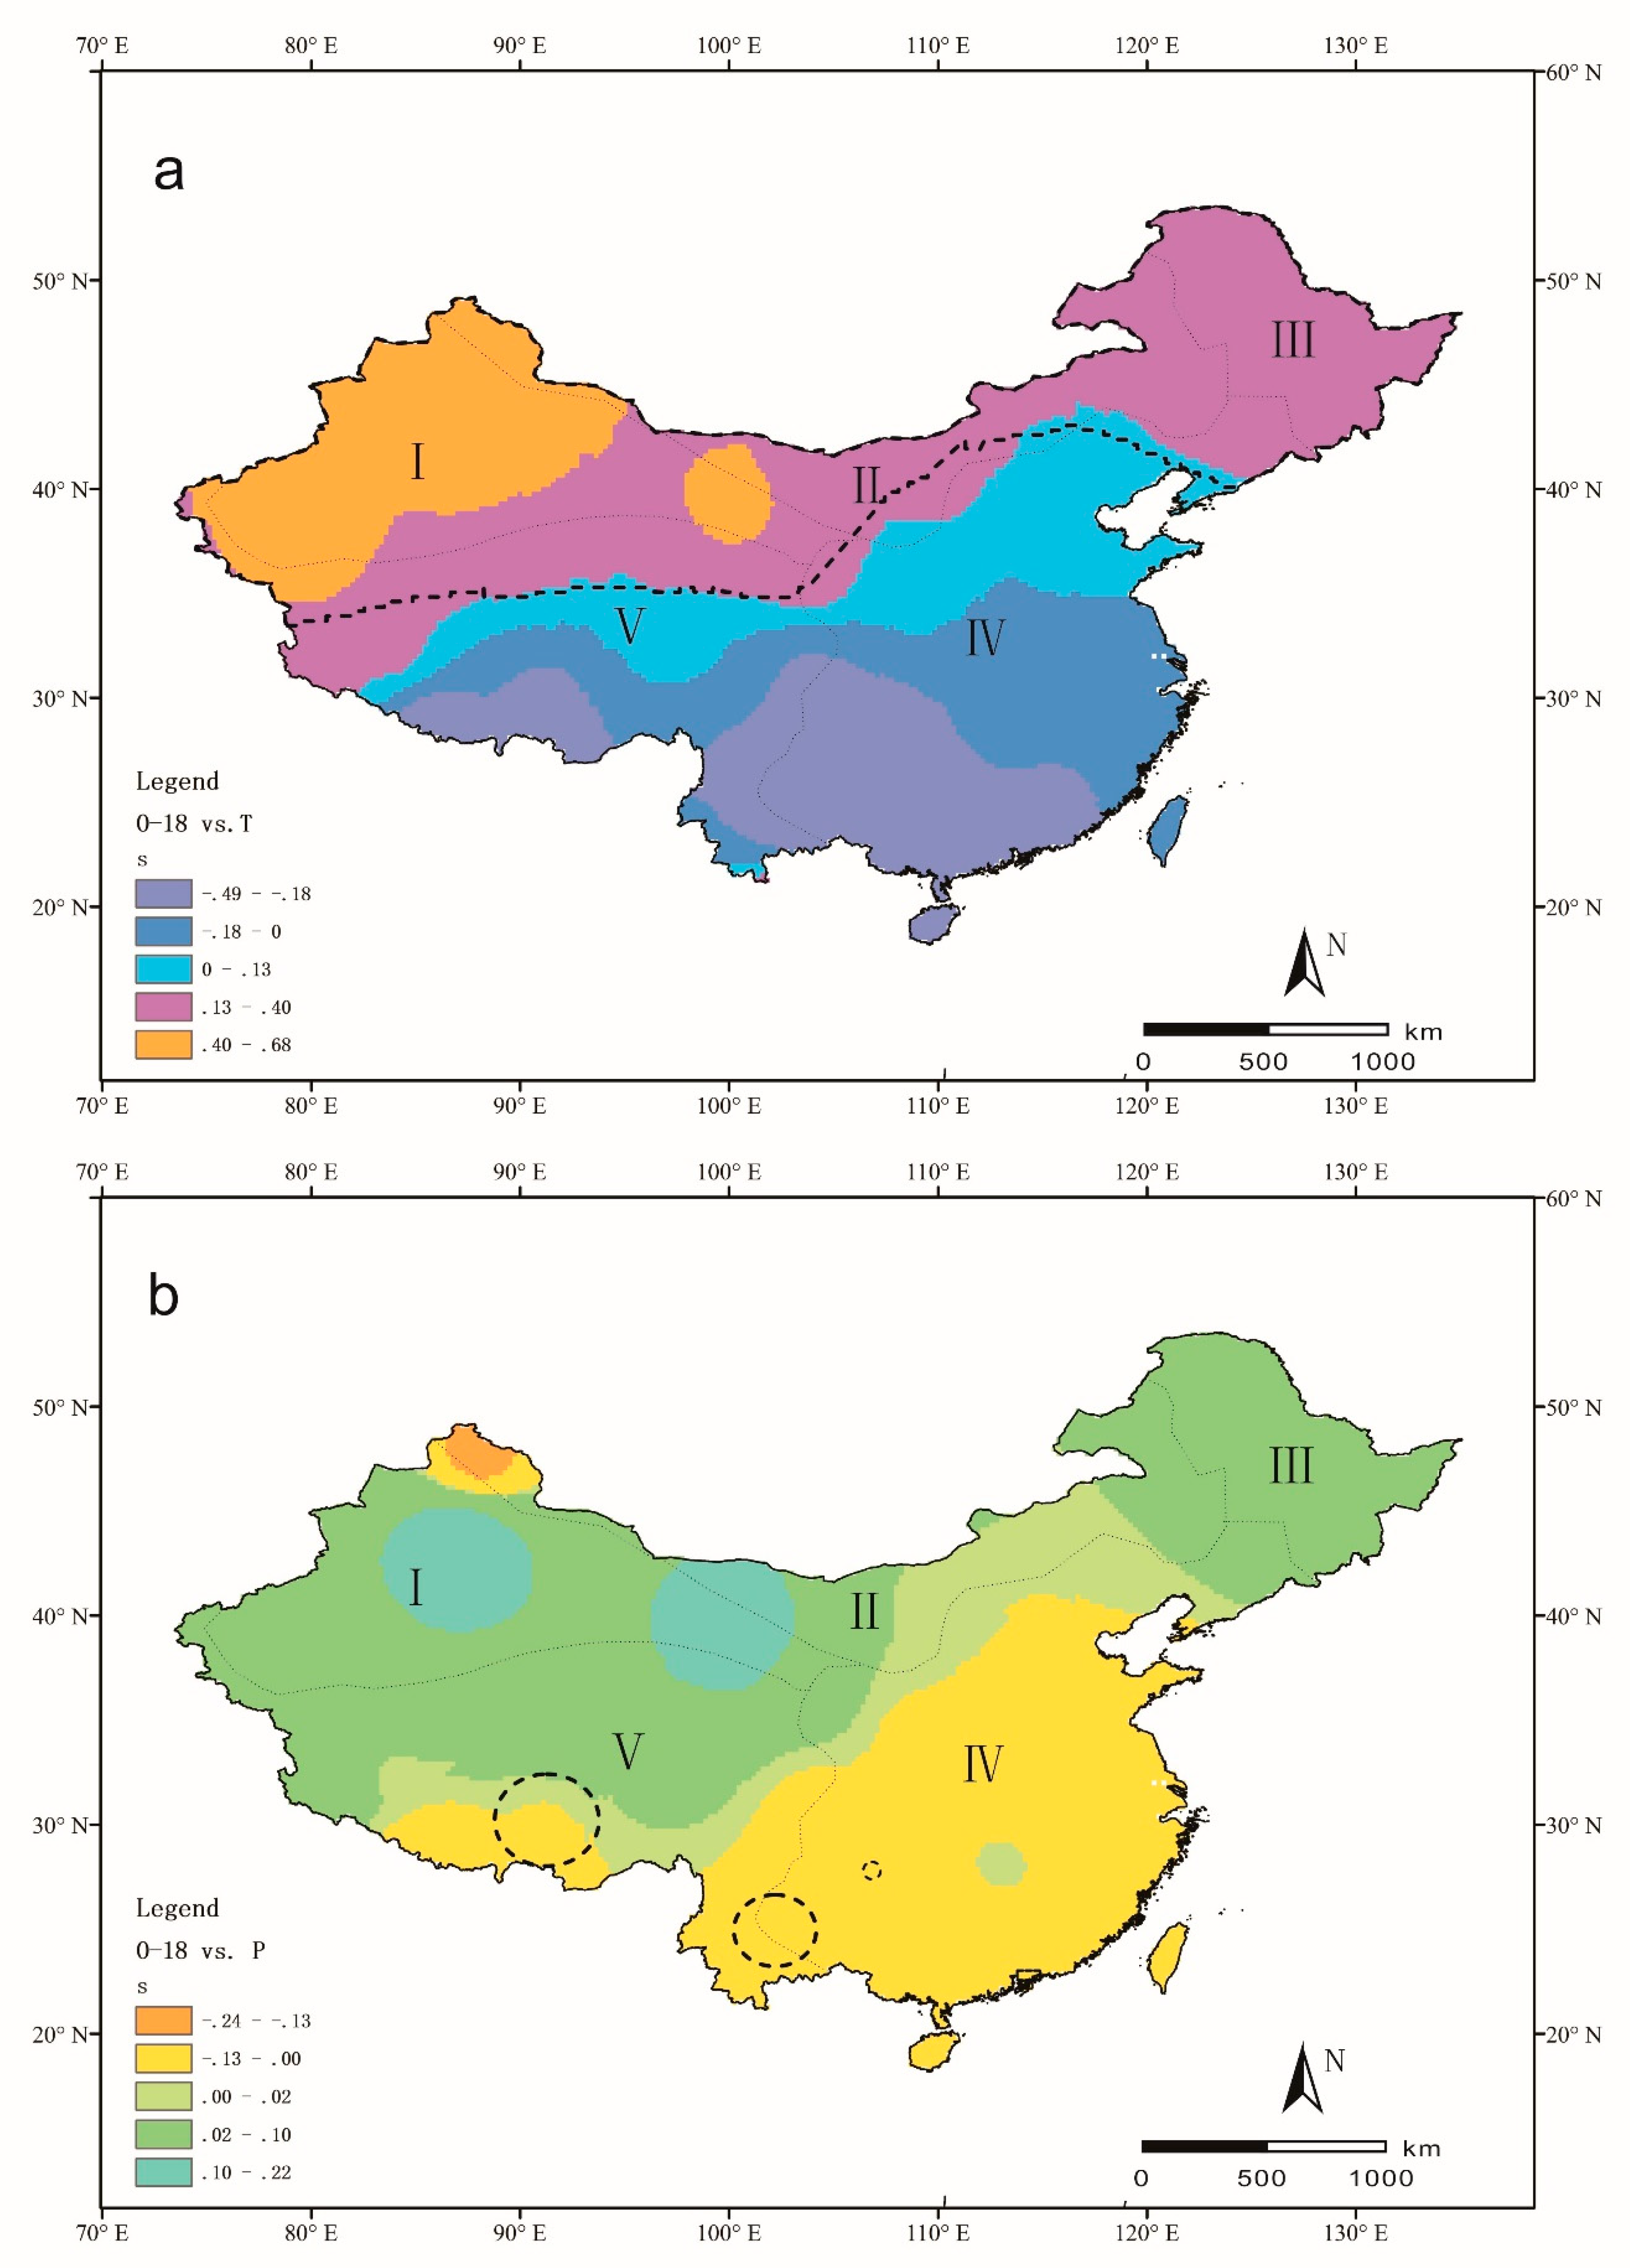
Figure 5a demonstrates that the temperature effect is significant in Regions I, II, and III, whereas in the other regions, it is not significant. Rozanski et al. [21] claimed that the temperature effect was mainly observed in regions of middle and high latitudes, which is consistent with our findings. The gradient of the temperature effect in Region I is identified as 0.13–0.68‰/°C (Figure 6a). The westerlies are the dominant moisture source in Region I [13,15]. In the context of an individual moisture source in the region, a shift in moisture source to the North Atlantic Ocean and the alternation of trajectory in summer and winter are considered as the factors leading to enriched isotopes in summer and depleted isotopes in winter [12,13,40,47]. The temperature effect in Region III is reported as increasing in significance from south to north [39,48]. The moisture in Region III is controlled by the westerlies and polar air masses in winter and by the westerlies and the Pacific Ocean in summer (Figure 1 and Figure 2). In winter, when temperatures are low, isotopes incorporated in both westerly and polar air masses are depleted; in contrast, in summer, when temperatures are high, precipitation isotopes from the westerlies and Pacific Ocean are enriched. Therefore, the temperature effect in Region III is significant. From south to north in Region III, the difference in moisture sources becomes increasingly prominent, which leads to a more significant temperature effect. Thus, we can draw the conclusion that the temperature effect in Region I is caused by the seasonal shift of the westerlies, whereas in Region III, the temperature effect is mainly attributed to the seasonal differences in moisture sources.
The correlation coefficients between stable isotopes and precipitation amount demonstrate the precipitation amount effect (Figure 5b). In total, the correlation between isotopes and precipitation amount is not as significant as that between isotopes and temperature. The most significant parts are located in Southwest and Northeast China, but Figure 6b illustrates that in Southwest China, the slope is negative (anti-correlation), whereas in Northeast China, it is positive. Precipitation events in Northeast China occur mainly in summer, when temperatures are high, whereas in winter, both precipitation and temperature are low. Given the significant temperature effect in Northeast China, it is reasonable to consider that precipitation amount has little impact on precipitation isotopes in this region. A significant precipitation amount effect was observed only in Southwest China and in some regions along the southeast coast. This finding implies that precipitation amount has a stronger effect in monsoon-controlled South China. Johnson and Ingram [10] noted that in the monsoon-affected regions, multi-regression analysis may be particularly useful for capturing the effect of precipitation amount on isotopes. Considering the temporal and spatial variation of monsoon intensity, moisture source analysis is indispensable in addressing monsoon isotopic data.
4. Conclusions
The dominant effect of moisture sources on precipitation isotopes is revealed based on long-term observations at 68 stations in and around China. At a regional scale, China is divided into five moisture source regions: Region I (the westerlies domain), Region II (the arctic domain), Region III (the northeast domain), Region IV (the Pacific domain), and Region V (the Tibetan Plateau domain). In Regions I, III, and V, precipitation isotopes exhibit a clear variation trend and d excess almost remains constant; however, in Region IV, both isotopes and d excess show no clear spatial patterns. The seasonal δ18O and d excess changes in Region IV could be used to track the onset of the EASM.
Regional meteoric water lines (RMWLs) are more useful in comparing with the isotopes of surface water and groundwater. According to the region regionalization above, the RMWLs are δ2H = 7.24δ18O + 1.96, δ2H = 7.55δ18O + 3.91, δ2H = 6.32δ18O − 4.07, δ2H = 7.63δ18O + 8.03, and δ2H = 8.41δ18O + 16.72 in the westerlies domain, the arctic domain, the northeast domain, the Pacific domain, and the Tibetan Plateau domain, respectively.
The temperature effect in Regions I and III is significant for different reasons: in Region I, the δ18O-temperature gradient ranges from 0.13–0.68‰/°C and is larger in Xinjiang, with a value of 0.40-0.68‰/°C, which is caused by the seasonal shift of the westerlies. In Region III, the temperature effect is mainly attributed to the seasonal differences in moisture sources. The precipitation amount effect is most significant in the region along the southeast coast, where the δ18O-precipitation amount gradient is −0.24 to −0.13‰/mm and is affected by the intensity and extent of the East Asia Summer Monsoons (EASM). Each region has its own features of seasonal variation in δ18O and d excess. Our study highlights the importance of moisture sources in affecting the spatial and temporal distribution of precipitation isotopes in China. The results show that an analysis with the new regionalization scheme could capture the features of precipitation isotopes, and thus could help in interpreting the hydrological and climatic processes.
Author Contributions
Y.K. and Z.P. designed the framework. Y.K. wrote the paper. Y.K., K.W., and J.L. plotted the figures. All authors revised and approved the manuscript.
Funding
This study is supported by the National Natural Science Foundation of China (Grant 91647101 and U1703122).
Acknowledgments
This paper is dedicated to the memory of our colleague Prof. Klaus Froehlich from the IAEA, who was involved in many discussions and provided several suggestions for improving this manuscript. The authors would like to acknowledge Prof. Gabriel J. Bowen from the University of Utah, Dr. Tao Pu from the Cold and Arid Regions Environmental and Engineering Research Institute, Chinese Academy of Sciences, the academic editor and four anonymous reviewers for their comments, which greatly helped to increase the quality of the paper.
Conflicts of Interest
The authors declare no conflict of interest.
References
- Dansgaard, W. Stable isotopes in precipitation. Tellus 1964, 16, 436–468. [Google Scholar] [CrossRef]
- IAEA. Isotope Hydrology Information System, the ISOHIS Database. 2006. Available online: http://www.iaea.org/water (accessed on 1 March 2013).
- Salati, E.; Dall’Olio, A.; Matsui, E.; Gat, J.R. Recycling of water in the Amazon Basin: An isotopic study. Water Resour. Res. 1979, 15, 1250–1258. [Google Scholar] [CrossRef]
- Gonfiantini, R. On the isotopic composition of precipitation in tropical stations. Acta Amaz. 1985, 5, 121–139. [Google Scholar] [CrossRef]
- Joseph, A.; Frangi, J.P.; Aranyossy, J.F. Isotope characteristics of meteoric water and groundwater in the Sahelo-Sudanese Zone. J. Geophys. Res. 1992, 97, 7543–7551. [Google Scholar] [CrossRef]
- Rozanski, K.; Araguas-Araguas, L. Spatial and temporal variability of stable isotope composition of precipitation over the South American continent. Bulletin De L’Institut Français D’Études Andines 1995, 24, 379–390. [Google Scholar]
- Araguas-Araguas, L.; Froehlich, K.; Rozanski, K. Stable isotope composition of precipitation over Southeast Asia. J. Geophys. Res. 1998, 103, 721–742. [Google Scholar] [CrossRef]
- Bowen, G.J.; Revenaugh, J. Interpolating the isotopic composition of modern meteoric precipitation. Water Resour. Res. 2003, 39, 1299. [Google Scholar] [CrossRef]
- Wang, D.; Wang, K. Isotopes in precipitation in China (1986–1999). Sci. China Ser. E 2001, 44, 48–51. [Google Scholar] [CrossRef]
- Johnson, K.; Ingram, B.L. Spatial and temporal variability in the stable isotope systematics of modern precipitation in China: Implications for paleoclimate reconstructions. Earth Planet. Sci. Lett. 2004, 220, 365–377. [Google Scholar] [CrossRef]
- Liu, J.; Song, X.; Yuan, G.; Sun, X.; Yang, L. Stable isotopic compositions of precipitation in China. Tellus 2014, 66, 22567. [Google Scholar] [CrossRef]
- Tian, L.; Yao, T.; MacClune, K.; White, J.W.C.; Schilla, A.; Vaughn, B.; Vachon, R.; Ichiyanagi, K. Stable isotopic variations in west China: A consideration of moisture sources. J. Geophys. Res. 2007, 112, D10112. [Google Scholar] [CrossRef]
- Pang, Z.; Kong, Y.; Froehlich, K.; Huang, T.; Yuan, L.; Li, Z.; Wang, F. Processes affecting isotopes in precipitation of an arid region. Tellus 2011, 63, 352–359. [Google Scholar] [CrossRef] [Green Version]
- Kong, Y.; Pang, Z. Evaluating the Sensitivity of Glacier Rivers to Climate Change based on Hydrograph Separation of Discharge. J. Hydrol. 2012, 434–435, 121–129. [Google Scholar] [CrossRef]
- Kong, Y.; Pang, Z.; Froehlich, K. Quantifying recycled moisture fraction in precipitation of an arid region using deuterium excess. Tellus 2013, 65, 19251. [Google Scholar] [CrossRef]
- Kong, Y.; Pang, Z. Statistical analysis of stream discharge in response to climate change for Urumqi river catchment, Tianshan Mountains, Central Asia. Quat. Int. 2014, 336, 44–51. [Google Scholar] [CrossRef]
- Wang, S.; Zhang, M.; Hughes, C.; Zhu, X.; Dong, L.; Ren, Z.; Chen, F. Factors controlling stable isotope composition of precipitation in arid conditions: An observation network in the Tianshan Mountains, central Asia. Tellus B 2016, 68, 26206. [Google Scholar] [CrossRef]
- Li, Z.X.; Feng, Q.; Li, Z. Climate Background, Facts, and Hydrological Effects of Multiphase Water Transformation in Cold Regions OF the Western China: A review. Earth-Sci. Rev. 2018. [Google Scholar] [CrossRef]
- Craig, H. Isotopic variations in meteoric waters. Science 1961, 133, 1702–1703. [Google Scholar] [CrossRef]
- Gat, J. Oxygen and hydrogen isotopes in the hydrological cycle. Annu. Rev. Earth Planet. Sci. 1996, 24, 225–262. [Google Scholar] [CrossRef]
- Rozanski, K.; Araguas-Araguas, L.; Gonfiantini, R. Relation between long-term trends of oxygen-18 isotope composition of precipitation and climate. Science 1992, 258, 981–985. [Google Scholar] [CrossRef]
- Stumpp, C.; Klaus, J.; Stichler, W. Analysis of long-term stable isotopic composition in German precipitation. J. Hydrol. 2014, 517, 351–361. [Google Scholar] [CrossRef]
- Hatvani, I.G.; Leuenberger, M.; Kohan, B.; Kern, Z. Geostatistical analysis and isoscape of ice core derived water stable isotope records in an Antarctic macro region. Polar Sci. 2017, 13, 23–32. [Google Scholar] [CrossRef]
- Oliver, M.A.; Webster, R. A tutorial guide to geostatistics: Computing and modelling variograms and kriging. Catena 2014, 113, 56–69. [Google Scholar] [CrossRef]
- Liu, J.R.; Song, X.F.; Yuan, G.F.; Sun, X.; Liu, X.; Wang, S. Characteristics of δ18O in precipitation over Eastern Monsoon China and the water vapor sources. Chin. Sci. Bull. 2010, 55, 200–211. [Google Scholar] [CrossRef]
- Bowen, G.J.; Wilkinson, B. Spatial distribution of δ18O in meteoric precipitation. Geology 2002, 30, 315–318. [Google Scholar] [CrossRef]
- Luo, K. Draft of natural geography regionalization of China. Acta Geogr. Sin. 1954, 20, 379–394. [Google Scholar]
- Huang, B. Draft of the complex physical geographical division of China. Chin. Sci. Bull. 1959, 18, 594–602. [Google Scholar]
- Terzer, S.; Wassenaar, L.I.; Araguás-Araguás, L.J.; Aggarwal, P.K. Global isoscapes for δ18O and δ2H in precipitation: Improved prediction using regionalized climatic regression models. Hydrol. Earth Syst. Sci. 2013, 17, 4713–4728. [Google Scholar] [CrossRef]
- Li, Z.X.; Yao, T.; Tian, L. Variation of δ18O in precipitation in annual timescale with moisture transport in Delingha region. Earth Sci. Front. 2006, 13, 330–334. [Google Scholar]
- Zhou, S.Q.; Nakawo, M.; Sakai, A.; Matsuda, Y.; Duan, K.Q.; Pu, J.C. Water isotope variations in the snow pack and summer precipitation at July 1 Glacier, Qilian Mountains in northwest China. Chin. Sci. Bull. 2007, 52, 2963–2972. [Google Scholar] [CrossRef]
- Xu, G.; Chen, T.; Liu, X.; An, W.; Wang, W.; Yun, H. Potential linkages between the moisture variability in the northeastern Qaidam Basin, China, since 1800 and the East Asian summer monsoon as reflected by tree ring δ18O. J. Geophys. Res. 2011, 116, D09111. [Google Scholar] [CrossRef]
- Winkler, M.G.; Wang, P.K. The Late-Quaternary vegetation climate of China. In Global Climates since the Last Glacial Maximum; University of Minnesota Press: St. Paul, MN, USA, 1993; pp. 221–261. [Google Scholar]
- Pang, Z. Mechanism of water cycle changes and implications on water resources regulation in Xinjiang Uygur Autonomous Region. Quat. Sci. 2014, 34, 907–917. [Google Scholar]
- Li, J.; Pang, Z.; Kong, Y.; Zhou, M.; Huang, T. Spatial distributions of stable isotopic composition and deuterium excess in precipitation during the summer and winter seasons in China, Fresenius Environmental Bulletin. Fresenius Environ. Bull. 2014, 23, 2074–2085. [Google Scholar]
- Kong, Y.; Pang, Z. A positive altitude gradient of isotopes in the precipitation over the Tianshan Mountains: Effects of moisture recycling and sub-cloud evaporation. J. Hydrol. 2016, 542, 222–230. [Google Scholar] [CrossRef]
- Wu, G.; Zhang, Y. Tibetan Plateau Forcing and the Timing of the Monsoon Onset over South Asia and the South China Sea. Mon. Weather Rev. 1998, 126, 913–927. [Google Scholar] [CrossRef]
- Yamanaka, T.; Shimada, J.; Hamada, Y.; Tanaka, T.; Yang, Y.; Zhang, W.; Hu, C. Hydrogen and oxygen isotopes in precipitation in the northern part of the North China Plain: Climatology and inter-storm variability. Hydrol. Process. 2004, 18, 2211–2222. [Google Scholar] [CrossRef]
- Liu, Z.; Bowen, G.J.; Welker, J.M. Atmospheric circulation is reflected in precipitation isotope gradients over the conterminous United States. J. Geophys. Res. 2010, 115, D22120. [Google Scholar] [CrossRef]
- Kreutz, K.J.; Wake, C.P.; Aizen, V.B.; Cecil, L.D.; Synal, H.A. Seasonal deuterium excess in a Tien Shan ice core: Influence of moisture transport and recycling in Central Asia. Geophys. Res. Lett. 2003, 30, 1922. [Google Scholar] [CrossRef]
- Aizen, V.; Aizen, E.; Fujita, K.; Nikitin, S.; Kreutz, K. Stable-Isotope Time Series and Precipitation Origin from Firn-Core and Snow Samples, Altai Glaciers, Siberia. J. Glaciol. 2005, 51, 637–654. [Google Scholar] [CrossRef]
- Ding, Y.; Chan, J. The East Asian summer monsoon: An overview. Meteorol. Atmos. Phys. 2005, 89, 117–142. [Google Scholar]
- Clark, I.; Fritz, P. Environmental Isotopes in Hydrogeology; Clark, I., Fritz, P., Eds.; Lewis Publishers: New York, NY, USA, 1997. [Google Scholar]
- Froehlich, K.; Kralik, M.; Papesch, W.; Rank, D.; Scheifinger, H.; Stichler, W. Deuterium excess in precipitation of Alpine regions-moisture recycling. Isot. Environ. Health Stud. 2008, 44, 61–70. [Google Scholar] [CrossRef] [PubMed]
- Chen, Z.; Nie, Z.; Zhang, G.; Wan, L.; Shen, J. Environmental isotopic study on the recharge and residence time of groundwater in the Heihe River Basin, Northwestern China. Hydrogeol. J. 2006, 14, 1635–1651. [Google Scholar] [CrossRef]
- Tian, L.; Yao, T.; Schuster, P.F.; White, J.W.C.; Ichiyanagi, K.; Pendall, E.; Pu, J.; Yu, W. Oxygen-18 concentrations in recent precipitation and ice cores on the Tibetan Plateau. J. Geophys. Res. 2003, 108, 4293. [Google Scholar] [CrossRef]
- Kong, Y.; Pang, Z.; Li, J.; Huang, T. Seasonal variations of water isotopes in the Kumalak River catchments, Western Tianshan Mountains. Central Asia. Fresenius Environ. Bull. 2014, 23, 169–174. [Google Scholar]
- Li, X.; Zhang, M.; Ma, Q.; Li, Y.; Wang, S.; Wang, B. Characteristics of Stable Isotopes in Precipitation over Northeast China and Its Water Vapor Sources. Chin. J. Environ. Sci. 2012, 33, 2924–2931. [Google Scholar]
Figure 1.
Regionalization of China by Luo [27]. (a) Numbers 1, 2, 3, 4, 5, 6, and 7 indicate the Northeast region, the North region, the Central region, the South region, the Sichuan-Yunnan region, the Tibetan region, and the Mongolia-Xinjiang region, as defined by Araguas-Araguas et al. [7]. (b) Numbers 1, 2, 3, 4, and 5 indicate the Arctic region, the Westerly region, the North Pacific region, the South Pacific region, and the Indian Ocean region.

Figure 2.
Regionalization of China based on moisture sources and meteorological conditions. The dashed line shows the extent of the sub-regions in Region IV.
Figure 2.
Regionalization of China based on moisture sources and meteorological conditions. The dashed line shows the extent of the sub-regions in Region IV.

Figure 3.
Contours of stable isotopes of precipitation in China: (a) long-term annual average δ18O values; (b) long term annual average δ2H values; (c) d excess calculated based on δ18O and δ2H values.
Figure 3.
Contours of stable isotopes of precipitation in China: (a) long-term annual average δ18O values; (b) long term annual average δ2H values; (c) d excess calculated based on δ18O and δ2H values.

Figure 4.
Seasonal variations in precipitation (pillars), δ18O (solid circles), and d excess (hollow circles) in each region of China.
Figure 4.
Seasonal variations in precipitation (pillars), δ18O (solid circles), and d excess (hollow circles) in each region of China.

Figure 5.
Correlation coefficients between δ18O and temperature (a) and between δ18O and precipitation amount (b). The dotted lines indicate the range of each region.
Figure 5.
Correlation coefficients between δ18O and temperature (a) and between δ18O and precipitation amount (b). The dotted lines indicate the range of each region.

Figure 6.
The gradients between (a) δ18O and temperature (unit: ‰/°C) and (b) between δ18O and precipitation amount (unit: ‰/mm). The dashed lines circle the region where the correlations between δ18O and temperature (a) and between δ18O and precipitation amount (b) are significant (larger than 0.3). The dotted lines indicate the range of each region.


Table 1.
Summary of precipitation amount of weighted annual isotopes (δ18O and δ2H) and d excess with their standard deviations std1, std2, and std3, multi-year average annual precipitation (P), multi-year average annual temperature (T) at the selected stations, the number of months at the GNIP stations, and daily number of samples at stations from Tian et al. [12] and Pang et al. [13] (n).
| Sample Site | Longitude (E) | Latitude (N) | Altitude (m) | δ2H (‰) | Std1 (‰) | δ18O (‰) | Std2 (‰) | d excess (‰) | Std3 (‰) | P (mm) | T (°C) | n | Observation Period | Source |
|---|---|---|---|---|---|---|---|---|---|---|---|---|---|---|
| Omsk | 73.38 | 55.01 | 94 | −98.8 | / | −13.5 | / | 8.9 | / | 361.0 | 2.7 | 8 | 1990 | GNIP |
| Enisejsk | 92.15 | 58.45 | 98 | −98.4 | / | −13.3 | / | 7.9 | / | 609.0 | 0.5 | 12 | 1990 | GNIP |
| Novosibirsk | 82.90 | 55.03 | 162 | −104.3 | / | −14.6 | / | 12.8 | / | 479.0 | 2.5 | 12 | 1990 | GNIP |
| Irkutsk | 104.35 | 52.27 | 485 | −94.5 | 13.1 | −12.2 | 0.9 | 3.2 | 5.7 | 482.0 | 2.4 | 14 | 1990 | GNIP |
| Habarovsk | 135.17 | 48.52 | 72 | −102.9 | / | −14.3 | / | 11.4 | / | 911.0 | 2.2 | 11 | 1971 | GNIP |
| Tashkent | 69.27 | 41.27 | 428 | −42.9 | / | −7.0 | / | 13.1 | / | 316.0 | 8.6 | 7 | 1971 | GNIP |
| Kabul | 69.21 | 34.57 | 1860 | −34.8 | 25.6 | −6.6 | 3.5 | 18.3 | 6.1 | 348.9 | 11.8 | 86 | 1967–1970, 1973–1974, 1982–1989 | GNIP |
| Karachi | 67.13 | 24.90 | 23 | −24.3 | 15.0 | −4.1 | 2.0 | 8.7 | 4.4 | 438.8 | 24.2 | 39 | 1961–1968, 1970, 1973 | GNIP |
| New Delihi | 77.20 | 28.58 | 212 | −34.6 | 18.2 | −5.4 | 2.4 | 8.3 | 4.0 | 899.1 | 24.8 | 304 | 1961–1969, 1973–1996, 2000–2008 | GNIP |
| Allahabad | 81.73 | 25.45 | 98 | −67.8 | / | −9.5 | / | 8.1 | / | 1531.0 | 17.8 | 5 | 1980 | GNIP |
| Shillong | 91.88 | 25.57 | 1598 | −34.4 | 30.2 | −5.7 | 3.8 | 11.1 | 2.8 | 1950.0 | 17.0 | 30 | 1969–1970, 1973–1976, 1978 | GNIP |
| Salagiri | 79.44 | 18.19 | 259 | −33.4 | / | −5.0 | / | 7.0 | / | 640.0 | / | 5 | 1977 | GNIP |
| Colombo | 79.87 | 6.91 | 7 | −23.5 | 1.0 | −4.1 | 0.2 | 8.9 | 0.5 | 2179.3 | 25.4 | 54 | 1983−1987, 1992−1994 | GNIP |
| Hongkong | 114.16 | 22.31 | 66 | −42.1 | 9.8 | −6.6 | 1.2 | 10.3 | 1.9 | 2342.8 | 23.0 | 408 | 1961−1965, 1973−2007 | GNIP |
| Pohang | 129.38 | 36.03 | 6 | −51.8 | 17.4 | −7.8 | 2.5 | 10.3 | 4.5 | 1141.0 | 13.3 | 110 | 1961−1966, 1973−1976 | GNIP |
| Ryori | 141.81 | 39.03 | 260 | −55.9 | 8.1 | −8.5 | 1.2 | 12.0 | 4.0 | 1400.6 | 10.2 | 189 | 1979−1986, 1998−2006 | GNIP |
| Tokyo | 139.77 | 35.68 | 4 | −46.5 | 7.0 | −7.2 | 0.8 | 11.4 | 2.8 | 1400.2 | 15.6 | 183 | 1961−1969, 1973−1979 | GNIP |
| Yangoon | 96.17 | 16.77 | 20 | −29.4 | 7.8 | −4.5 | 0.5 | 6.3 | 3.5 | 2434.7 | 27.3 | 18 | 1961−1963 | GNIP |
| Bangkok | 100.50 | 13.73 | 2 | −42.9 | 7.7 | −6.6 | 3.9 | 9.5 | 6.6 | 1638.8 | 28.5 | 347 | 1968−1970, 1973−2008 | GNIP |
| Ko Sichang | 100.80 | 13.17 | 26 | −38.2 | 4.9 | −6.1 | 0.6 | 10.2 | 1.7 | 1273.3 | 28.3 | 40 | 1985, 1987−1991 | GNIP |
| Ko Samui | 100.05 | 9.47 | 7 | −28.3 | 10.4 | −4.9 | 1.3 | 10.7 | 0.1 | 1444.2 | 27.7 | 27 | 1979−1980, 1982−1983 | GNIP |
| Singapore | 103.90 | 1.35 | 32 | −46.5 | 2.5 | −7.5 | 0.2 | 13.1 | 1.4 | 2345.9 | 26.2 | 52 | 1968−1969, 1973−1975 | GNIP |
| Luang-Prabang | 102.13 | 19.88 | 305 | −53.2 | 10.5 | −7.8 | 1.3 | 8.9 | 2.2 | 1407.9 | 26.2 | 26 | 1961−1964 | GNIP |
| Qiqihar | 123.91 | 47.38 | 147 | −80.9 | 6.2 | −10.8 | 0.6 | 5.8 | 1.8 | 570.2 | 3.9 | 50 | 1988−1992 | GNIP |
| Haerbin | 126.62 | 45.68 | 172 | −78.0 | 4.3 | −10.5 | 0.9 | 5.8 | 4.7 | 623.7 | 9.1 | 32 | 1986−1990, 1996−1997 | GNIP |
| Hetian | 79.93 | 37.13 | 1375 | −34.9 | 4.8 | −5.7 | 0.6 | 11.1 | 1.9 | 217.8 | 9.2 | 46 | 1988−1992 | GNIP |
| Wulumuqi | 87.62 | 43.78 | 918 | −74.0 | 15.7 | −10.9 | 2.1 | 12.9 | 2.9 | 336.3 | 7.3 | 123 | 1986−1992, 1996−1998, 2001−2003 | GNIP |
| Zhangye | 100.43 | 38.93 | 1483 | −47.6 | 8.5 | −6.6 | 1.3 | 5.4 | 7.7 | 150.3 | 7.8 | 79 | 1986−1992, 1995−1996, 2001−2003 | GNIP |
| Lanzhou | 103.88 | 36.05 | 1517 | −41.6 | 12.0 | −6.2 | 1.5 | 7.9 | 6.9 | 345.8 | 10.9 | 39 | 1985−1987, 1996−1990 | GNIP |
| Yinchuan | 106.21 | 38.48 | 1112 | −43.5 | 12.3 | −6.8 | 2.2 | 11.2 | 6.6 | 308.4 | 9.2 | 30 | 1988−1992 | GNIP |
| Shijiazhuang | 114.41 | 38.03 | 80 | −56.8 | 7.7 | −8.1 | 0.8 | 8.3 | 3.6 | 572.4 | 13.7 | 129 | 1985−2003 | GNIP |
| Yantai | 121.40 | 37.53 | 47 | −50.6 | 4.8 | −7.3 | 0.9 | 7.7 | 8.8 | 575.7 | 14.1 | 44 | 1986−1991 | GNIP |
| Taiyuan | 112.55 | 37.78 | 778 | −62.1 | 15.1 | −8.7 | 1.8 | 7.2 | 1.3 | 444.2 | 14.8 | 20 | 1986−1988 | GNIP |
| Changchun | 125.21 | 43.90 | 237 | −63.8 | 9.8 | −9.5 | 0.8 | 12.5 | 11.8 | 448.3 | 7.4 | 22 | 1999−2001 | GNIP |
| Jinzhou | 121.10 | 41.13 | 66 | −54.6 | 5.2 | −7.4 | 1.1 | 4.8 | 4.6 | 541.0 | 17.0 | 12 | 1986−1989 | GNIP |
| Tianjin | 117.16 | 39.10 | 3 | −50.0 | 3.6 | −7.7 | 0.5 | 11.7 | 1.4 | 536.5 | 13.8 | 64 | 1988−1992, 2000−2001 | GNIP |
| Baotou | 109.85 | 40.67 | 1067 | −55.9 | 24.7 | −7.9 | 1.0 | 7.4 | 3.4 | 300.6 | 7.0 | 52 | 1986−1993 | GNIP |
| Lhasa | 91.13 | 29.70 | 3649 | −117.2 | 35.7 | −15.9 | 4.6 | 10.3 | 1.8 | 427.0 | 8.4 | 41 | 1986−1992 | GNIP |
| Chengdu | 104.02 | 30.67 | 506 | -51.2 | 11.1 | -7.0 | 1.7 | 4.7 | 4.0 | 854.2 | 16.3 | 65 | 1986−1992, 1996−1999 | GNIP |
| Kunming | 102.68 | 25.01 | 1892 | -69.2 | 12.1 | −10.1 | 1.7 | 11.2 | 5.5 | 1005.5 | 15.5 | 148 | 1986−1991, 2000−2003 | GNIP |
| Xian | 108.93 | 34.30 | 397 | −50.7 | 18.9 | −7.7 | 2.7 | 11.2 | 3.4 | 585.5 | 13.4 | 48 | 1985−1993 | GNIP |
| Zhengzhou | 113.65 | 34.72 | 110 | −54.0 | 15.4 | −7.5 | 2.2 | 5.8 | 4.0 | 642.6 | 14.1 | 55 | 1985−1992 | GNIP |
| Wuhan | 114.13 | 30.62 | 23 | −48.0 | 19.2 | −6.7 | 2.3 | 5.4 | 5.0 | 1248.7 | 17.9 | 49 | 1986−1998 | GNIP |
| Changqing | 106.60 | 29.62 | 192 | −69.6 | −10.4 | 13.7 | 493.0 | / | 5 | 1992−1993 | GNIP | |||
| Changsha | 113.06 | 28.20 | 37 | −32.2 | 0.1 | −5.7 | 0.0 | 13.0 | 0.1 | 1280.7 | 17.1 | 57 | 1988−1992 | GNIP |
| Zunyi | 106.88 | 27.70 | 844 | −55.6 | 7.0 | −8.4 | 1.0 | 11.7 | 1.9 | 988.1 | 15.4 | 70 | 1986−1992 | GNIP |
| Guiyang | 106.71 | 26.58 | 1071 | −52.0 | 10.5 | −8.3 | 1.4 | 14.5 | 1.5 | 970.0 | 15.3 | 58 | 1988−1992 | GNIP |
| Guilin | 110.08 | 25.07 | 170 | −34.7 | 6.1 | −6.2 | 0.9 | 14.8 | 1.2 | 1523.6 | 19.0 | 91 | 1983−1990 | GNIP |
| Nanjing | 118.18 | 32.18 | 26 | −53.0 | 6.7 | −8.2 | 0.8 | 12.6 | 1.0 | 1212.0 | 14.4 | 58 | 1987−1992 | GNIP |
| Fuzhou | 119.28 | 26.08 | 16 | −43.0 | 14.0 | −6.6 | 1.5 | 9.8 | 3.3 | 1471.8 | 20.4 | 71 | 1985−1992 | GNIP |
| Liuzhou | 109.40 | 24.35 | 97 | −43.9 | 10.8 | −6.5 | 1.0 | 7.9 | 3.0 | 1082.5 | 20.9 | 45 | 1988−1992 | GNIP |
| Guangzhou | 113.32 | 23.13 | 7 | −42.8 | 8.8 | −6.1 | 1.1 | 6.0 | 2.4 | 1830.8 | 23.0 | 30 | 1986−1989 | GNIP |
| Haikou | 110.35 | 20.03 | 15 | −37.6 | 12.9 | −5.7 | 1.6 | 8.3 | 4.7 | 1923.3 | 24.9 | 58 | 1988−1991, 1996−2000 | GNIP |
| Weathership V | 164.00 | 31.00 | / | −24.0 | 4.0 | −6.1 | 0.6 | 24.8 | 3.4 | 943.4 | 19.1 | 81 | 1962−1969 | GNIP |
| Taguac Guam IS. | 144.83 | 13.55 | 110 | −29.9 | 12.3 | −5.1 | 1.5 | 10.7 | 2.9 | 2686.1 | 26.0 | 103 | 1962−1966, 1973−1977 | GNIP |
| Wake Island | 166.65 | 19.28 | 3 | −9.8 | 8.7 | −2.2 | 1.2 | 7.6 | 2.6 | 904.9 | 26.6 | 122 | 1962−1969, 1973−1976 | GNIP |
| Truk | 151.85 | 7.47 | 2 | −32.5 | 10.8 | −5.4 | 1.4 | 10.3 | 1.9 | 3606.2 | 27.4 | 72 | 1968−1969, 1972−1977 | GNIP |
| Yap | 138.09 | 9.49 | 23 | −34.5 | 16.2 | −5.5 | 2.5 | 9.6 | 4.5 | 2913.3 | 27.0 | 65 | 1968−1969, 1972−1976 | GNIP |
| Tarawa | 172.92 | 1.35 | 4 | −37.5 | / | −6.1 | / | 11.3 | / | 3187.0 | 25.9 | 17 | 1991 | GNIP |
| Manila | 121.00 | 14.52 | 14 | −44.2 | 12.7 | −6.8 | 1.5 | 9.8 | 3.8 | 1975.3 | 27.0 | 46 | 1961−1965 | GNIP |
| Gaoshan | 86.83 | 43.1 | 3545 | −53.6 | / | −7.7 | / | 8.4 | / | 390 | -4.3 | 59 | 2003−2004 | Pang et al. [13] |
| Houxia | 87.18 | 43.28 | 2100 | −55.4 | / | −7.9 | / | 7.7 | / | 424 | 1.5 | 88 | 2003−2004 | Pang et al. [13] |
| Nyalam | 85.97 | 28.18 | 3811 | −85.9 | / | −12.1 | / | 10.6 | / | 650 | / | 295 | 1998−2001 | Tian et al [12] |
| Lhasa | 91.03 | 29.72 | 3650 | −129.7 | / | −17.0 | / | 5.8 | / | 411 | / | 152 | 1998−2001 | Tian et al. [12] |
| Gaize | 84.05 | 32.3 | 4416 | −92.0 | / | −12.7 | / | 9.6 | / | 170 | / | 140 | 1998−2001 | Tian et al. [12] |
| Shiquanhe | 80.1 | 32.5 | 4279 | −76.3 | / | −11.2 | / | 12.9 | / | 71 | / | 62 | 1998−2001 | Tian et al. [12] |
| Yushu | 97.02 | 33.02 | 3682 | −82.0 | / | −12.2 | / | 15.8 | / | 482 | 3 | 339 | 1998−2001 | Tian et al. [12] |
| Altay | 88.08 | 47.73 | 737 | −100.4 | / | −13.8 | / | 9.9 | / | 194 | / | 226 | 1998−2001 | Tian et al. [12] |
Table 2.
Regional meteoric water lines for different regions of the westerlies domain (I), the Artic domain (II), the Northeast China domain (III), the Pacific domain (IV), and the Tibetan Plateau domain (V), respectively.
Table 2.
Regional meteoric water lines for different regions of the westerlies domain (I), the Artic domain (II), the Northeast China domain (III), the Pacific domain (IV), and the Tibetan Plateau domain (V), respectively.
| Regions | RMWL | R2 (n) | Level of Significance |
|---|---|---|---|
| I | δ2H = (7.24 ± 0.11)δ18O + 1.96 ± 1.38 | 0.95 (264) | 0.01 |
| II | δ2H = ( 7.55 ± 0.10) δ18O + 3.91 ± 1.22 | 0.97 (182) | 0.01 |
| III | δ2H = (6.32 ± 0.12) δ18O − 4.07 ± 0.97 | 0.87 (460) | 0.01 |
| IV | δ2H = (7.63 ± 0.06) δ18O + 8.03 ± 0.41 | 0.93 (1246) | 0.01 |
| V | δ2H = (8.41 ± 0.20)δ18O + 16.72 ± 2.98 | 0.97 (108) | 0.01 |
© 2019 by the authors. Licensee MDPI, Basel, Switzerland. This article is an open access article distributed under the terms and conditions of the Creative Commons Attribution (CC BY) license (http://creativecommons.org/licenses/by/4.0/).
Share and Cite
MDPI and ACS Style
Kong, Y.; Wang, K.; Li, J.; Pang, Z. Stable Isotopes of Precipitation in China: A Consideration of Moisture Sources. Water 2019, 11, 1239. https://doi.org/10.3390/w11061239
AMA Style
Kong Y, Wang K, Li J, Pang Z. Stable Isotopes of Precipitation in China: A Consideration of Moisture Sources. Water. 2019; 11(6):1239. https://doi.org/10.3390/w11061239
Chicago/Turabian StyleKong, Yanlong, Ke Wang, Jie Li, and Zhonghe Pang. 2019. "Stable Isotopes of Precipitation in China: A Consideration of Moisture Sources" Water 11, no. 6: 1239. https://doi.org/10.3390/w11061239
Note that from the first issue of 2016, this journal uses article numbers instead of page numbers. See further details here.