Rooting Depth and Extreme Precipitation Regulate Groundwater Recharge in the Thick Unsaturated Zone: A Case Study


1
Key Laboratory of Agricultural Soil and Water Engineering in Arid and Semiarid Areas, Ministry of Education, Northwest A&F University, Yangling 712100, China
2
Department of Soil Science, University of Saskatchewan, Saskatoon, SK S7N 5A8, Canada
3
Department of Watershed Sciences, Utah State University, Logan, UT 84322, USA
*
Authors to whom correspondence should be addressed.
Water 2019, 11(6), 1232; https://doi.org/10.3390/w11061232
Submission received: 21 May 2019
/
Revised: 9 June 2019
/
Accepted: 11 June 2019
/
Published: 13 June 2019
(This article belongs to the Special Issue Advances in Hydrogeology: Trend, Model, Methodology and Concepts)
Abstract
:Many modeling efforts have been made for shallow soil, but little has been done in deep-rooted ecosystems, especially on the long-term impact of deep-rooted vegetation to understand the impact of vegetation type on hydrological processes. In this study, we used the Community Land Model (CLM) version 4.0 to simulate the soil water dynamics and groundwater recharge with shallow-rooted and deep-rooted vegetation cover in the critical soil zone of 100 m thickness. We selected winter wheat and summer maize to represent shallow-rooted vegetation and apple trees as deep-rooted vegetation growing in the semi-humid Loess Plateau of China over the period of 1901–2015. Our results show that the rooting depth and precipitation dictate the occurrence of disconnected recharge. This occurred in soil depths that were below 75 m in wet years with annual precipitation of over 650, 730, and 1000 mm for the winter wheat field, summer maize field, and apple orchard, respectively. Connected recharge was the major component of groundwater recharge for all three crop fields. The transit time of precipitation ranged from several to hundreds of years via the disconnected recharge that is caused by extreme precipitation and the connected recharge that is generated by other precipitation. Therefore, both rooting depth and growth period of vegetation affect the groundwater recharge and transit time, as well as precipitation.

1. Introduction
Deep-rooted plants are widely distributed in arid and semiarid regions [1,2,3]. These plants play a significant role in the partitioning of soil water into evapotranspiration (ET) and groundwater recharge, which in turn affects the sustainability of regional ecosystems. However, very few attempts have been made to incorporate deep-rooted systems into land surface models, due to the significant difficulties in making direct and detailed measurements [4,5].
Rooting depth is closely associated with soil characteristics and climate [1,4,6,7]. Woody species in water-limited environments often root into the deep soil to take advantage of the water reserves located there due to insufficient water in shallower soil [8]. For example, roots can be as deep as 25 m in apple orchards over 20 years old [5,9], and the cloned root fronts of eucalyptus can reach a depth of 11.5 m [10]. These deep roots can substantially alter ecohydrological processes. Rooting depth primarily determines the active soil zone that can potentially return water back to the atmosphere via evaporation from the soil surface and plant transpiration in terrestrial ecosystems [4]. Meanwhile, these processes alter the exchanges of energy and carbon between the land surface and the atmosphere due to the coupling of the terrestrial water, energy, and carbon cycles. Rooting depth also affects the transit time of precipitation to groundwater, as more transpiration that is induced by greater rooting depth can substantially reduce the soil moisture and increase the transit time.
How rooting depth changes the zone below the active soil zone, where water leaving the zone forms groundwater recharge is equally important. Though affected by many biophysical parameters, groundwater recharge is often related to vegetation type through leaf area index [11]. The interception parameterization in this model is only dependent on the leaf area index and it is independent of the vegetation type [12,13]. This kind of model settings enabled us to fully focus on investigating how the different vegetation roots affected the ground water recharge. Rainfall lost through evaporation that is caused by forest canopy interception is small and highly dependent on rainfall intensity [14,15]. The lost amount is about 10–40% of total rainfall [14] and, under extreme precipitation conditions, the interception rates were less and more closely related to climatic parameters than to forest structure parameters [16]. When compared with plants in natural grasslands and farmland, woody species usually have a larger leaf area index, deeper roots, and longer growing season, and their root water uptake is typically more intense [17]. As a result, rooting depth may be a better index for representing the impact of vegetation on groundwater recharge [5,18].
Water input to the soil strongly affects groundwater recharge (including precipitation and irrigation) [19,20]. Global synthesis has indicated that precipitation is the primary control of groundwater recharge at the global scale, followed by vegetation [20]. Precipitation characteristics, such as extreme precipitation events/years, dominate groundwater recharge [21,22]. This is because extreme precipitation, which is defined as precipitation of >650 mm annually by Shao et al. [21], usually results in deep water infiltration and enhances groundwater recharge. This recharge is episodic, has a fast transit time, and is referred to as disconnected recharge, being different from connected recharge, which is defined as the slow flow of the soil matrix [23]. Therefore, the combined effects of rooting depth and extreme precipitation on groundwater recharge are still not clear and they need to be further investigated.
Although the importance of deep roots in forest ecosystems has been studied for several years [24,25], only limited research has been conducted regarding the effects of rooting depth on soil hydrologic processes, such as groundwater recharge and transit time in deep unsaturated soil zones that are below 5 m [8,10]. A large body of work has investigated the flow mechanism of groundwater recharge (piston vs. preferential; connected vs. disconnected). However, little is known regarding how the combined effects of rooting depth and precipitation alter the mechanisms and magnitude of groundwater recharge in the deep unsaturated soil zone. Therefore, the objectives of this study are to evaluate (1) the mechanisms by which vegetation type (rooting depth and growth period) impacts groundwater recharge; (2) the role of rooting depth in the relationship between precipitation and groundwater recharge over a long period; and, (3) the effects of rooting depth on the recharge amount and transit time of precipitation to groundwater.
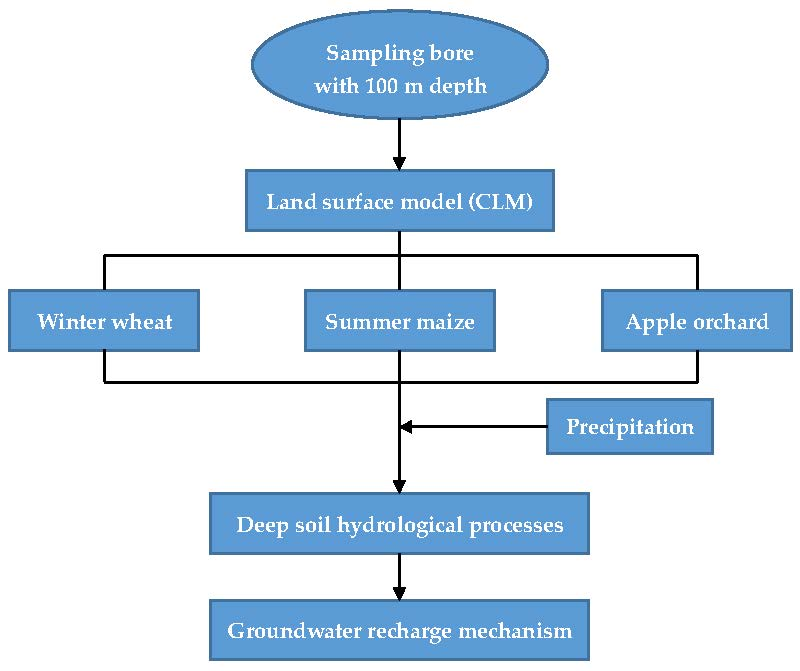
2. Data and Methodology
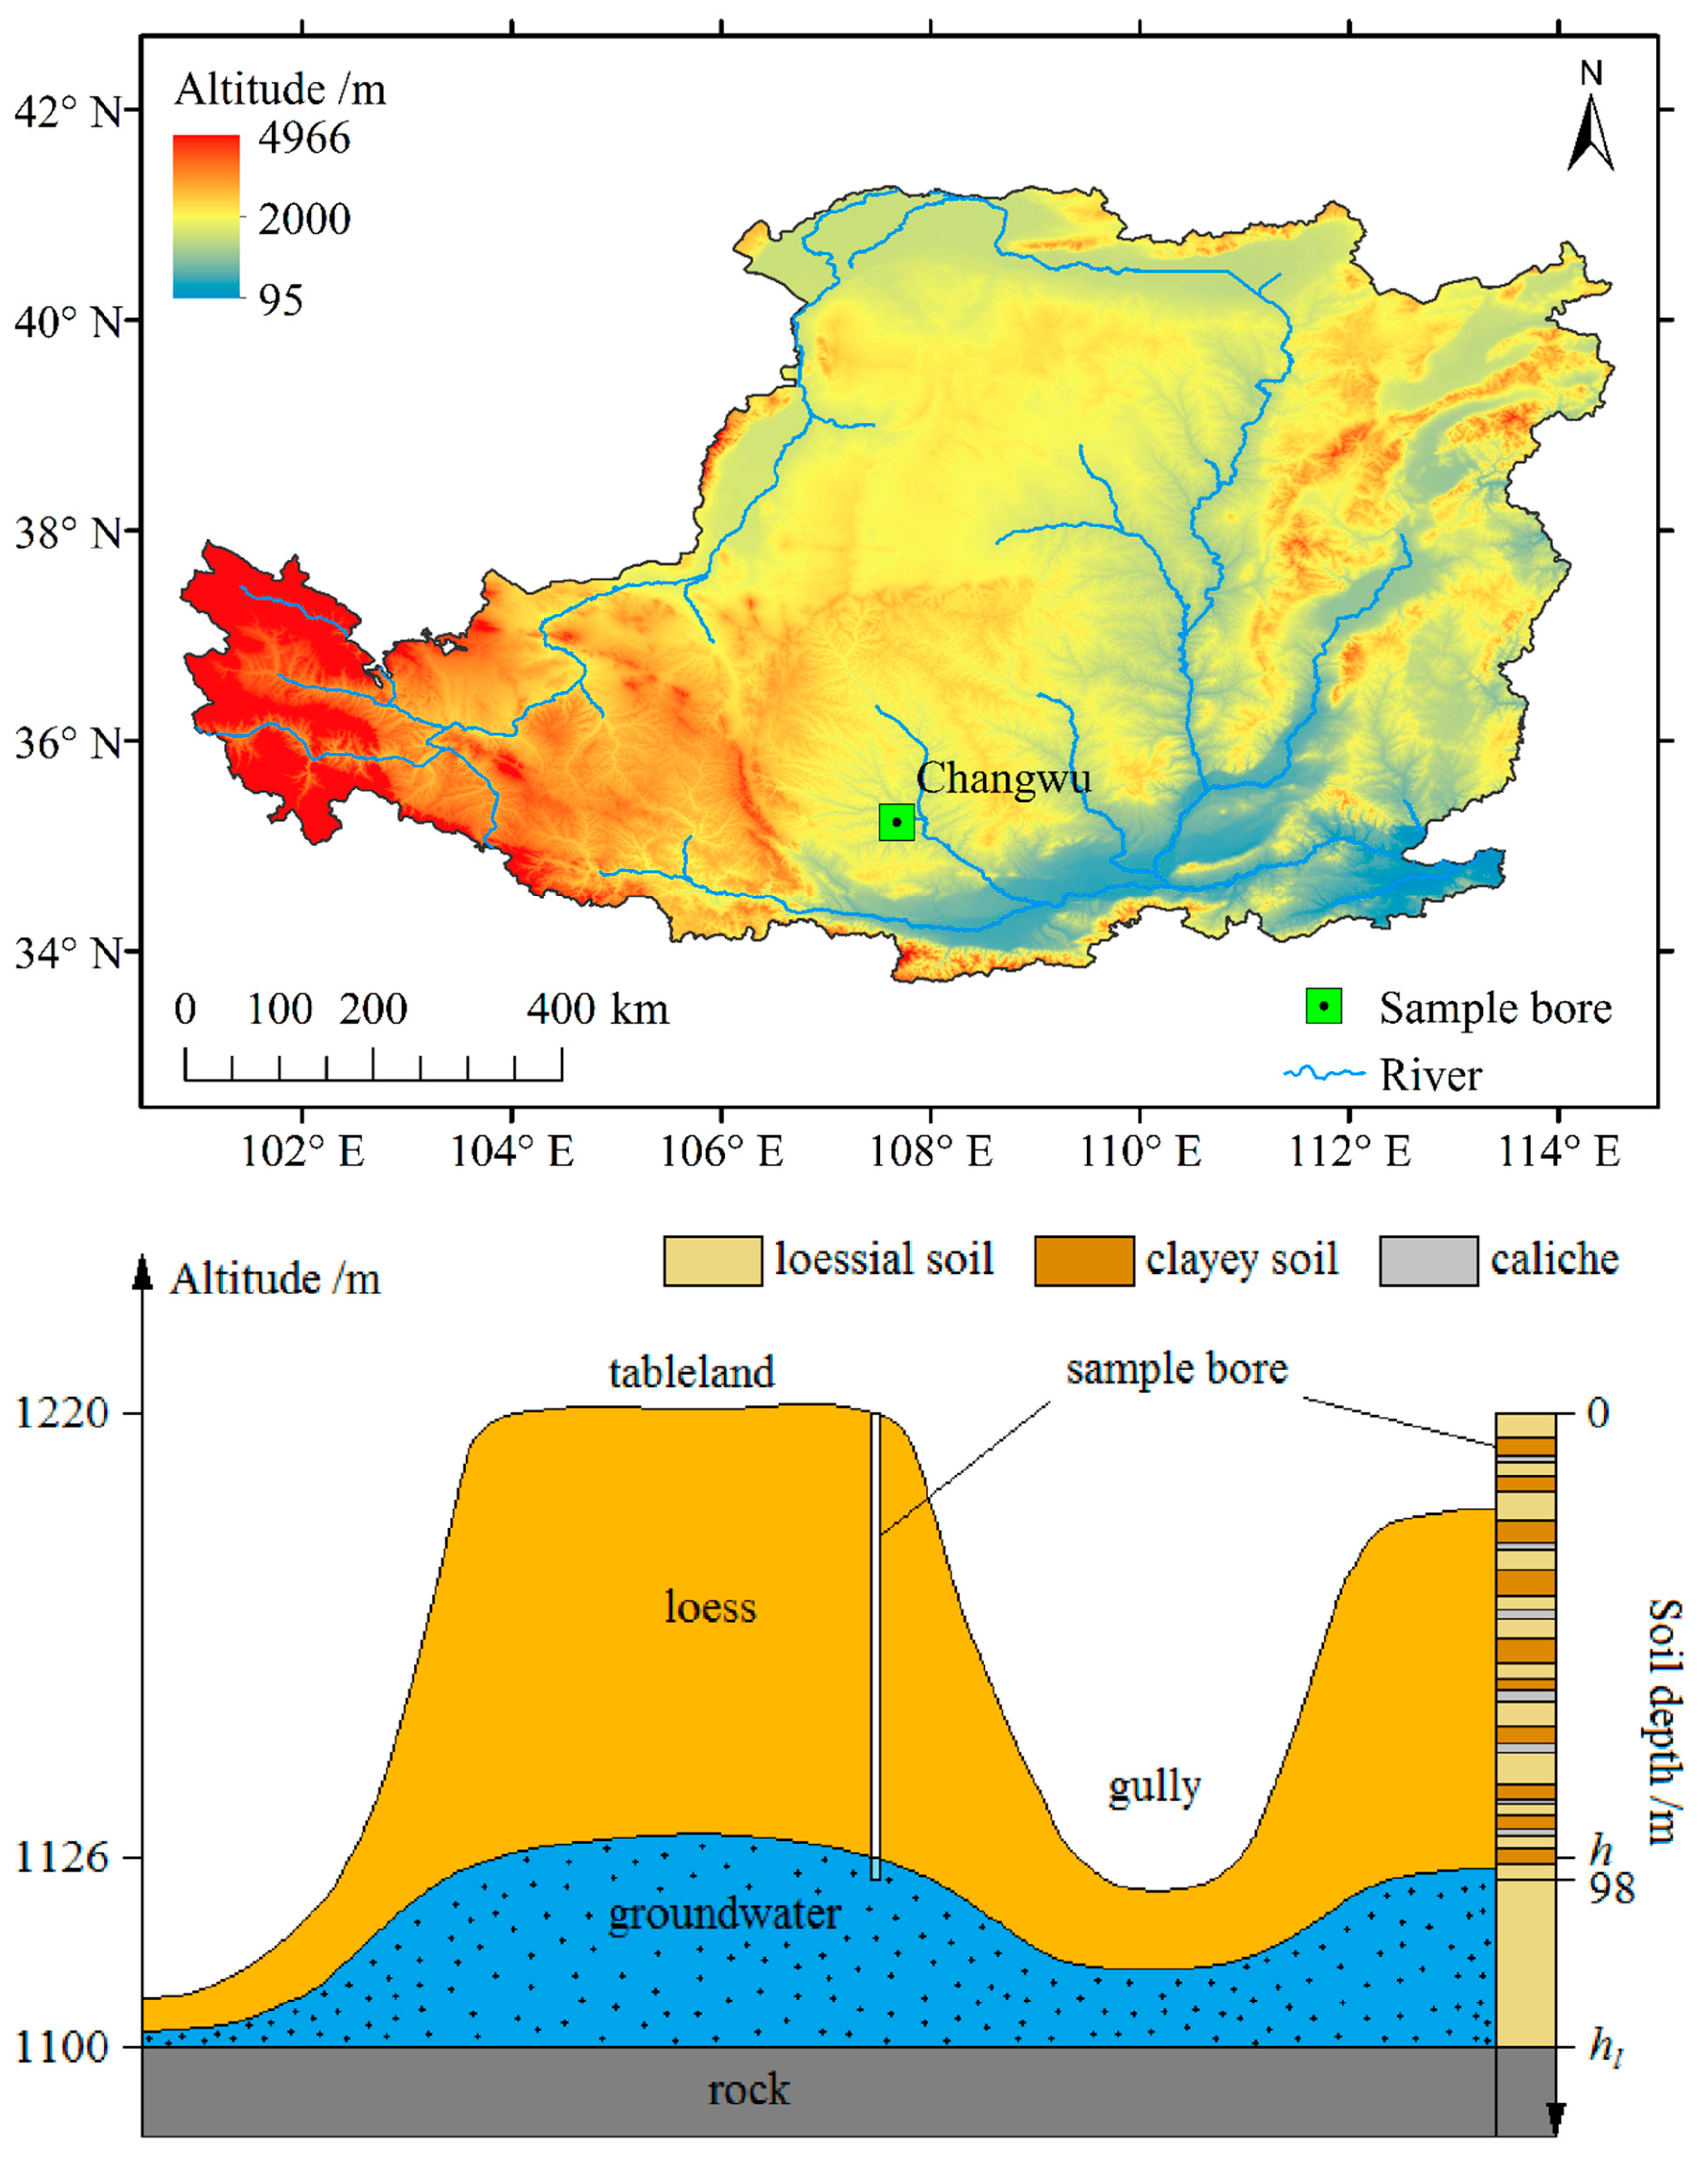
Our study site (Figure 1), which is located in the Wangdonggou watershed of Changwu in southern Loess Plateau of China (35°14′N, 107°41′E), is characterized by a thick soil layer with a silty loam texture and vertical stratified structure that developed on windblown dust deposits over millions of years [21,26,27]. The soil layer has relatively large porosity and it usually decreases with soil depth [28]. The soil water content is low and the groundwater table is large in the area [21]. Precipitation is easy to infiltrate into the loose and dry soil layer, especially in the loess tableland area, but it is difficult to recharge groundwater [21]. Runoff is difficult to generate and mainly yields under excess infiltration in the region. Although the topography is broken and diverse, winter wheat, summer maize, and apple tree are the main crops in Changwu. The previous two are both of shallow-rooted vegetation and the last one is of deep-rooted vegetation. The region has a continental monsoon climate, with a mean annual precipitation of 579 mm (averaged over 1960 through 2016), of which approximately 55% falls between July and September. The annual mean temperature is 9.2 °C, with 170 frost-free days. The main crops are summer maize and winter wheat. Summer maize grows from May to September, covering the rainy season, while winter wheat grows from October to the following June, which is just outside the rainy season. In 1985, apple orchards were introduced into the region, and by 2015 they had replaced about 50% of the farmland [29,30].
In 2015, a deep bore of 98 m was drilled in a wheat field where the groundwater table was found at a depth of about 94 m (Figure 1). The samples of undisturbed soil were collected every 20 cm from the bore, and soil texture, bulk density, volumetric soil water content, and saturated hydraulic conductivities were measured. These basic soil properties, along with measured root distribution, leaf area index, stem area index, and canopy height (top and bottom) of typical winter wheat were input into the CLM for hydrological simulations [21]. Based on the bore measurements, Shao et al. [21] modified the drainage, soil layers, and root distribution schemes in the Community Land Model (CLM) version 4.0 and simulated the soil water content and groundwater recharge. The model was validated with the measured vertical distribution of soil water content in the 98 m bore and the nearby groundwater table observations [21].
2.1. Dynamic Root Distribution
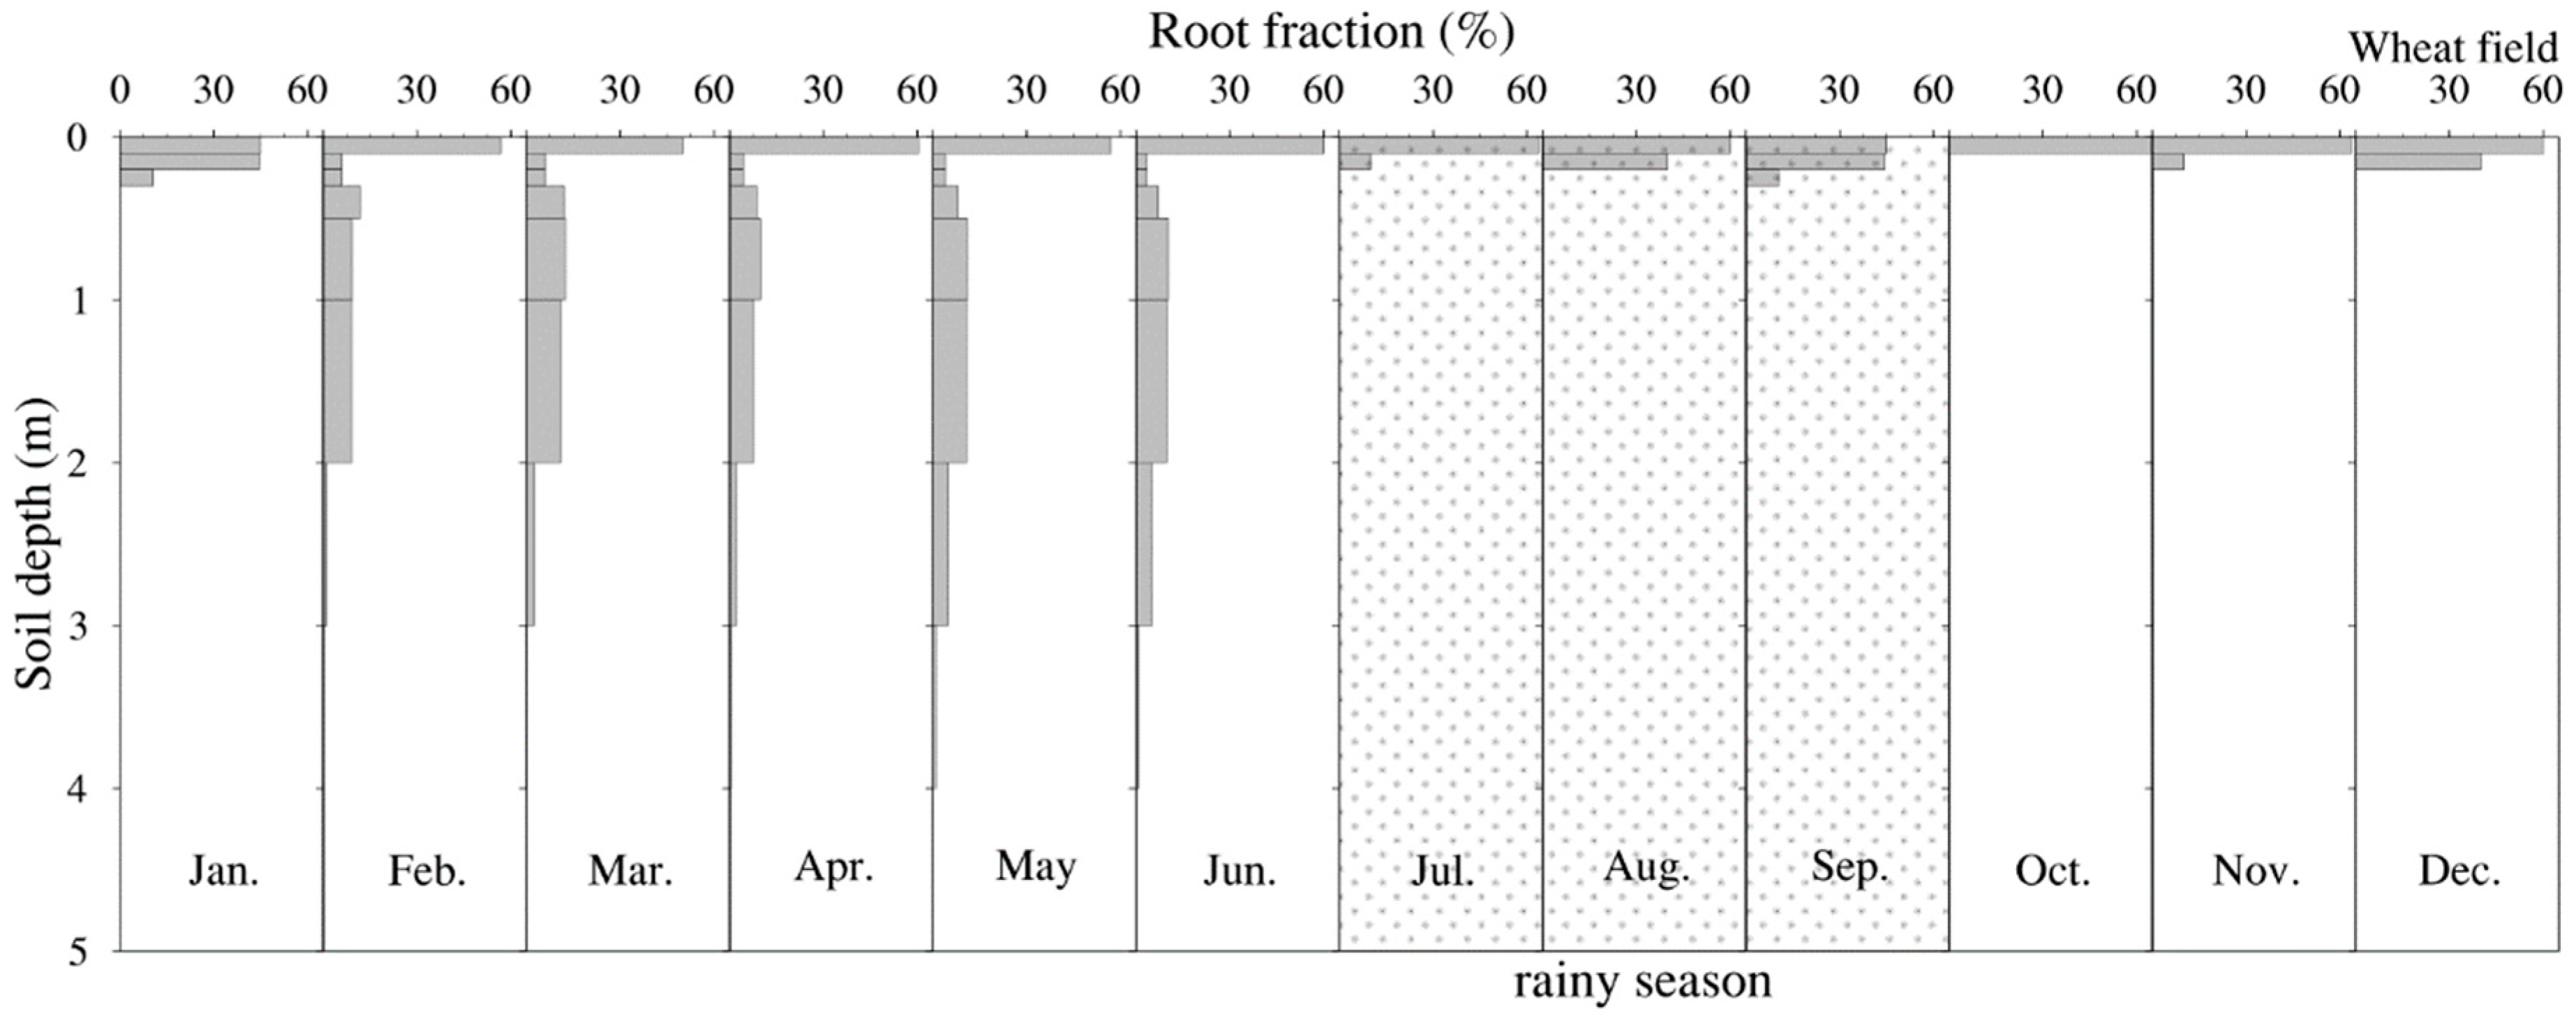
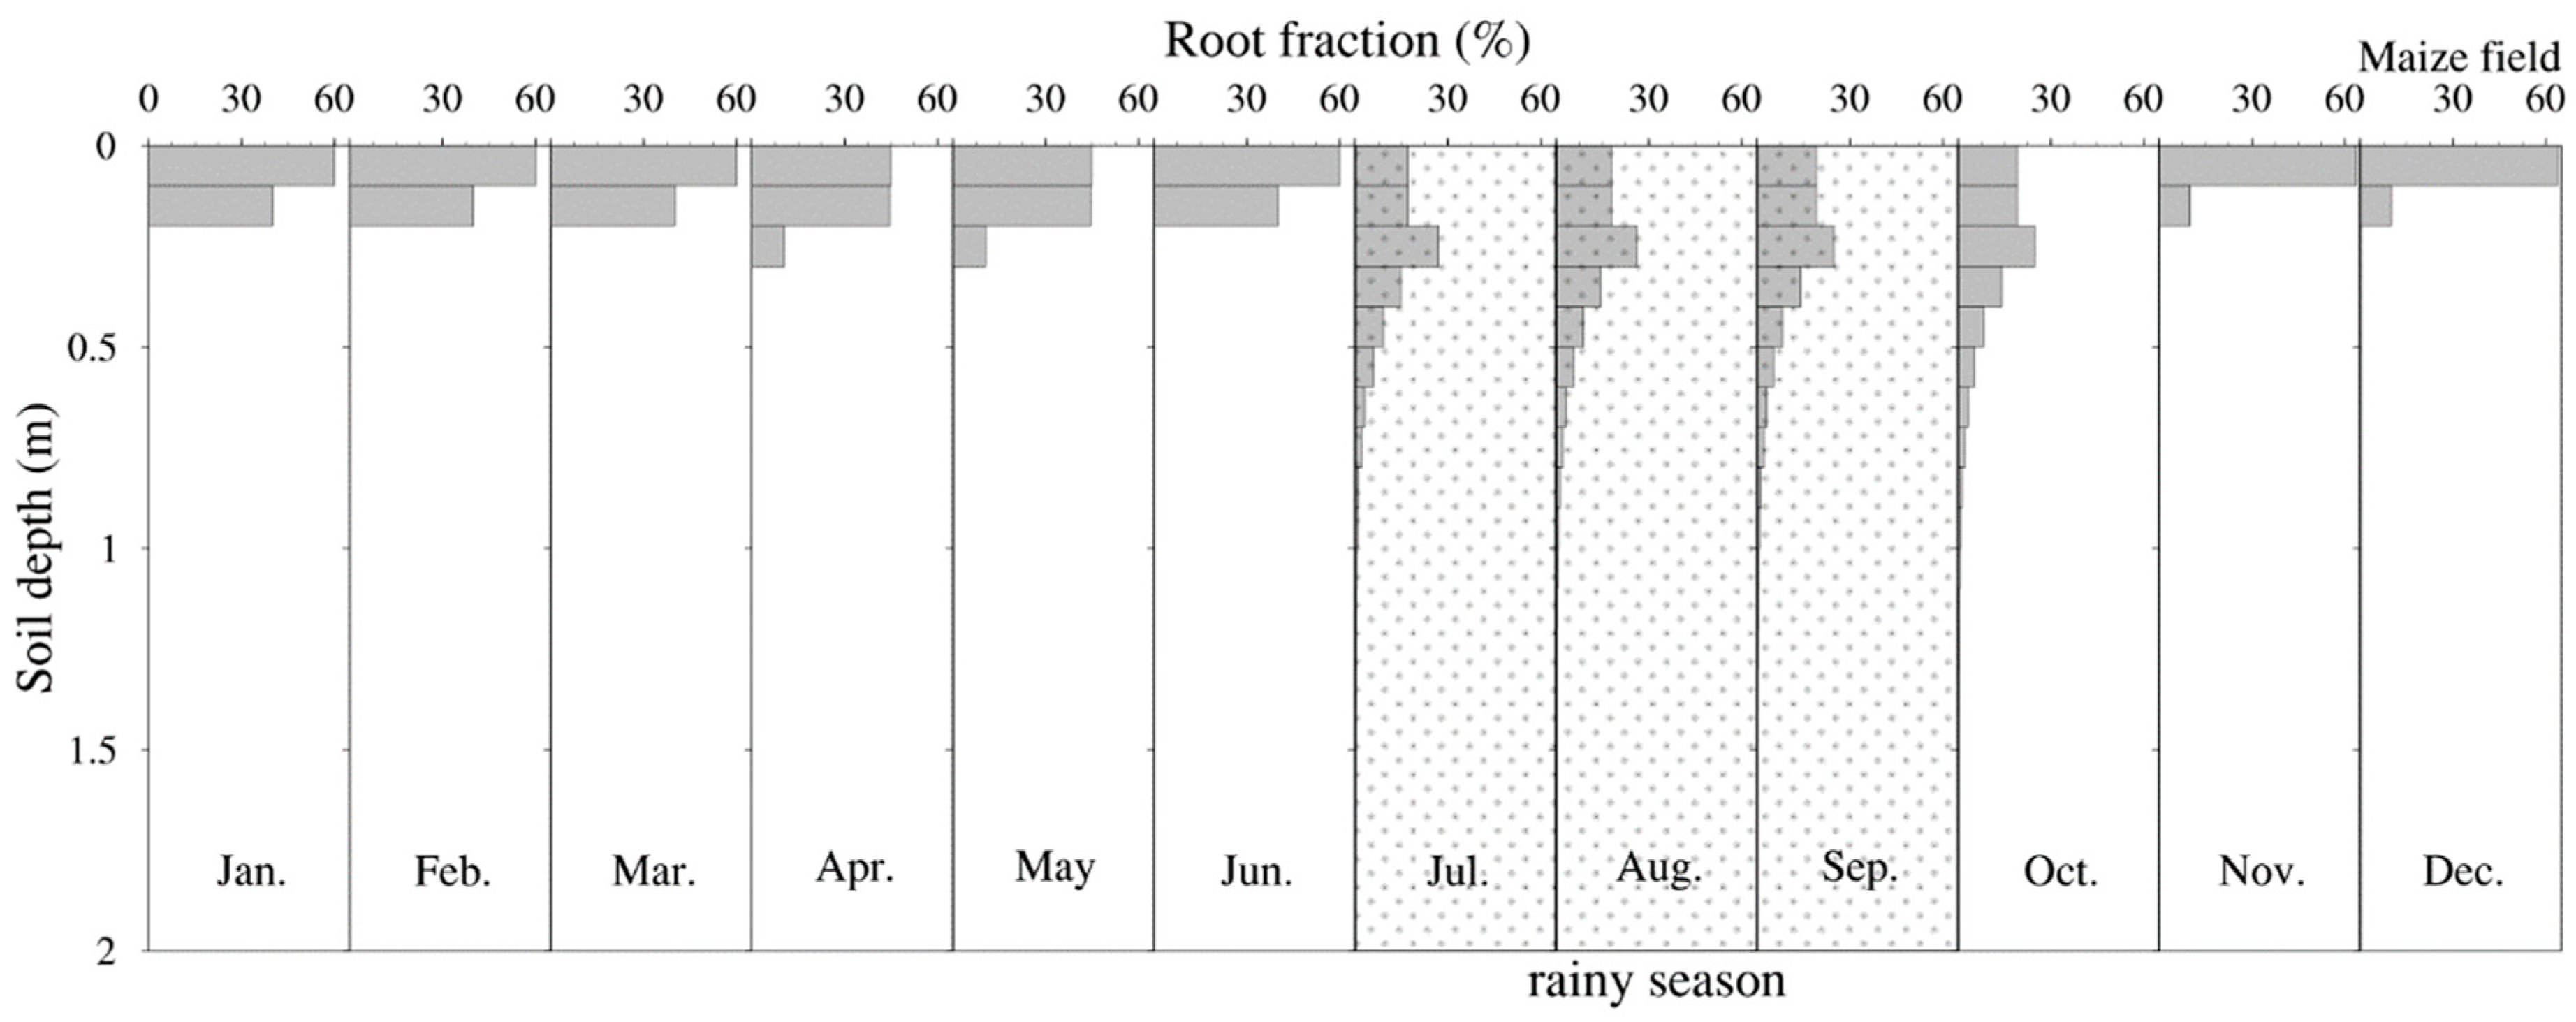
In the original version of CLM, the root system is described as the percentage of roots (biomass or root length density) distributed in each soil layer that does not change over the growing season. It is calculated with the two-parameter exponential function of soil depth (d) for 15 vegetation types [12,13,31]. Although the two parameters vary with the vegetation types, their root systems are mainly distributed in the soil zone <1.5 m depth. Monthly root distribution was used for shallow-rooted winter wheat and summer maize to explore the impact of rooting depth and associated growth on groundwater recharge. Based on our on-site observations (Figure 2 and Figure 3), the maximum rooting depths of winter wheat and summer maize are, respectively, 5 and 2 m, which are both deeper than that (1.5 m) implemented in CLM. Moreover, the root system is mainly distributed above 2 m in these two crop fields for most of the year, accounting for >95% of the total (Figure 2 and Figure 3). Therefore, the difference in rooting depth is neglected between the winter wheat and summer maize fields.
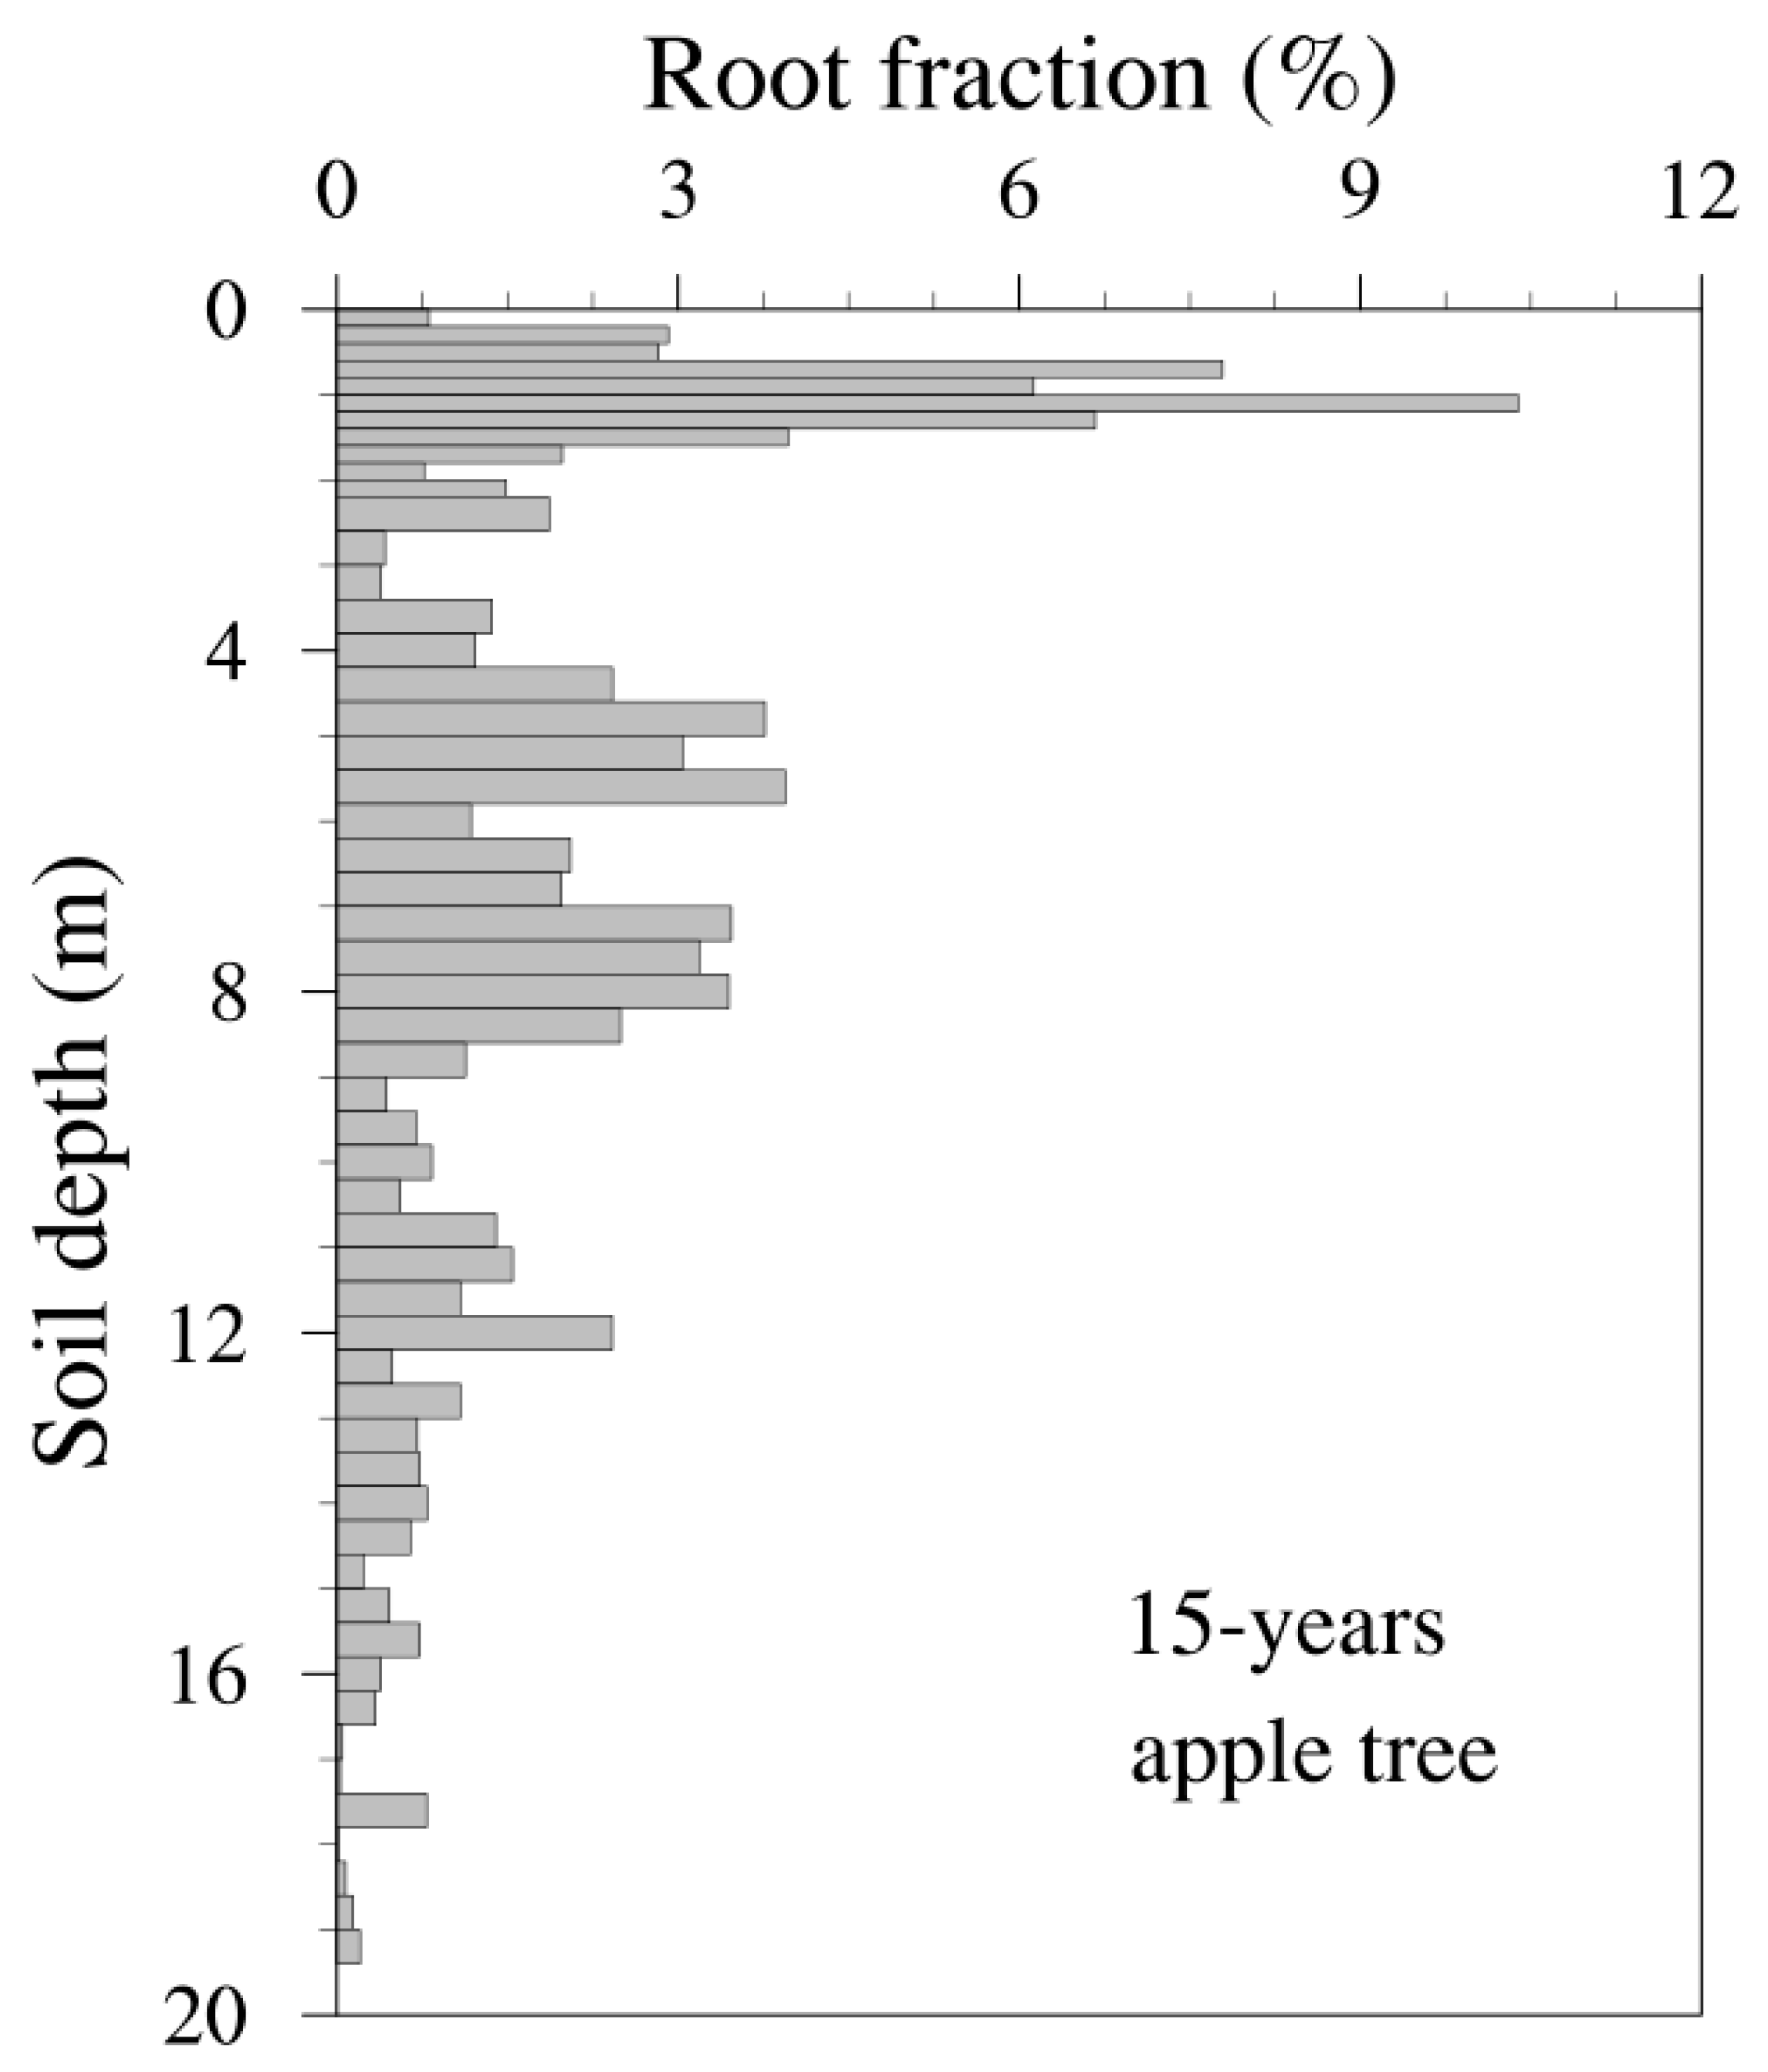
Apple trees have a much deeper root system than the winter wheat and summer maize and exhibit perennial growth in a semi-humid climate. The root distribution patterns of apple trees are largely affected by stand age and soil water content. Rather than adopt the exponential root distribution in CLM [12,13,31], we used measured root distributions of 15-year-old apple trees for our simulations with CLM (Figure 4).
In the revised model, the percentage of roots in each layer on any day during two adjacent months is calculated by linear interpolation to reflect the growth process. When assuming that R1(d) and R2(d) are the root distributions as a function of depth (d) on the dates t1 and t2 in the middle of the respective months, then the root distribution R(d) on date t between them can be calculated, as follows:
2.2. Connected and Disconnected Groundwater Recharge
Darcy’s law is used to calculate the infiltration flux of soil water in CLM with no preferential pathway. Under the piston flow conditions, the deep soil water flux at the depth of 75 m is estimated as the groundwater recharge D (mm) in the study, and it can be calculated as:
where k is the unsaturated hydraulic conductivity (mm/s), is the hydraulic potential gradient, ∆t is the time step (s), ks is the saturated hydraulic conductivity (mm/s), θ is the volumetric soil water content (cm3 cm−3), θs is the saturated soil water content (cm3 cm−3), and B is an exponent that is related to the soil particle composition and organic matter content.
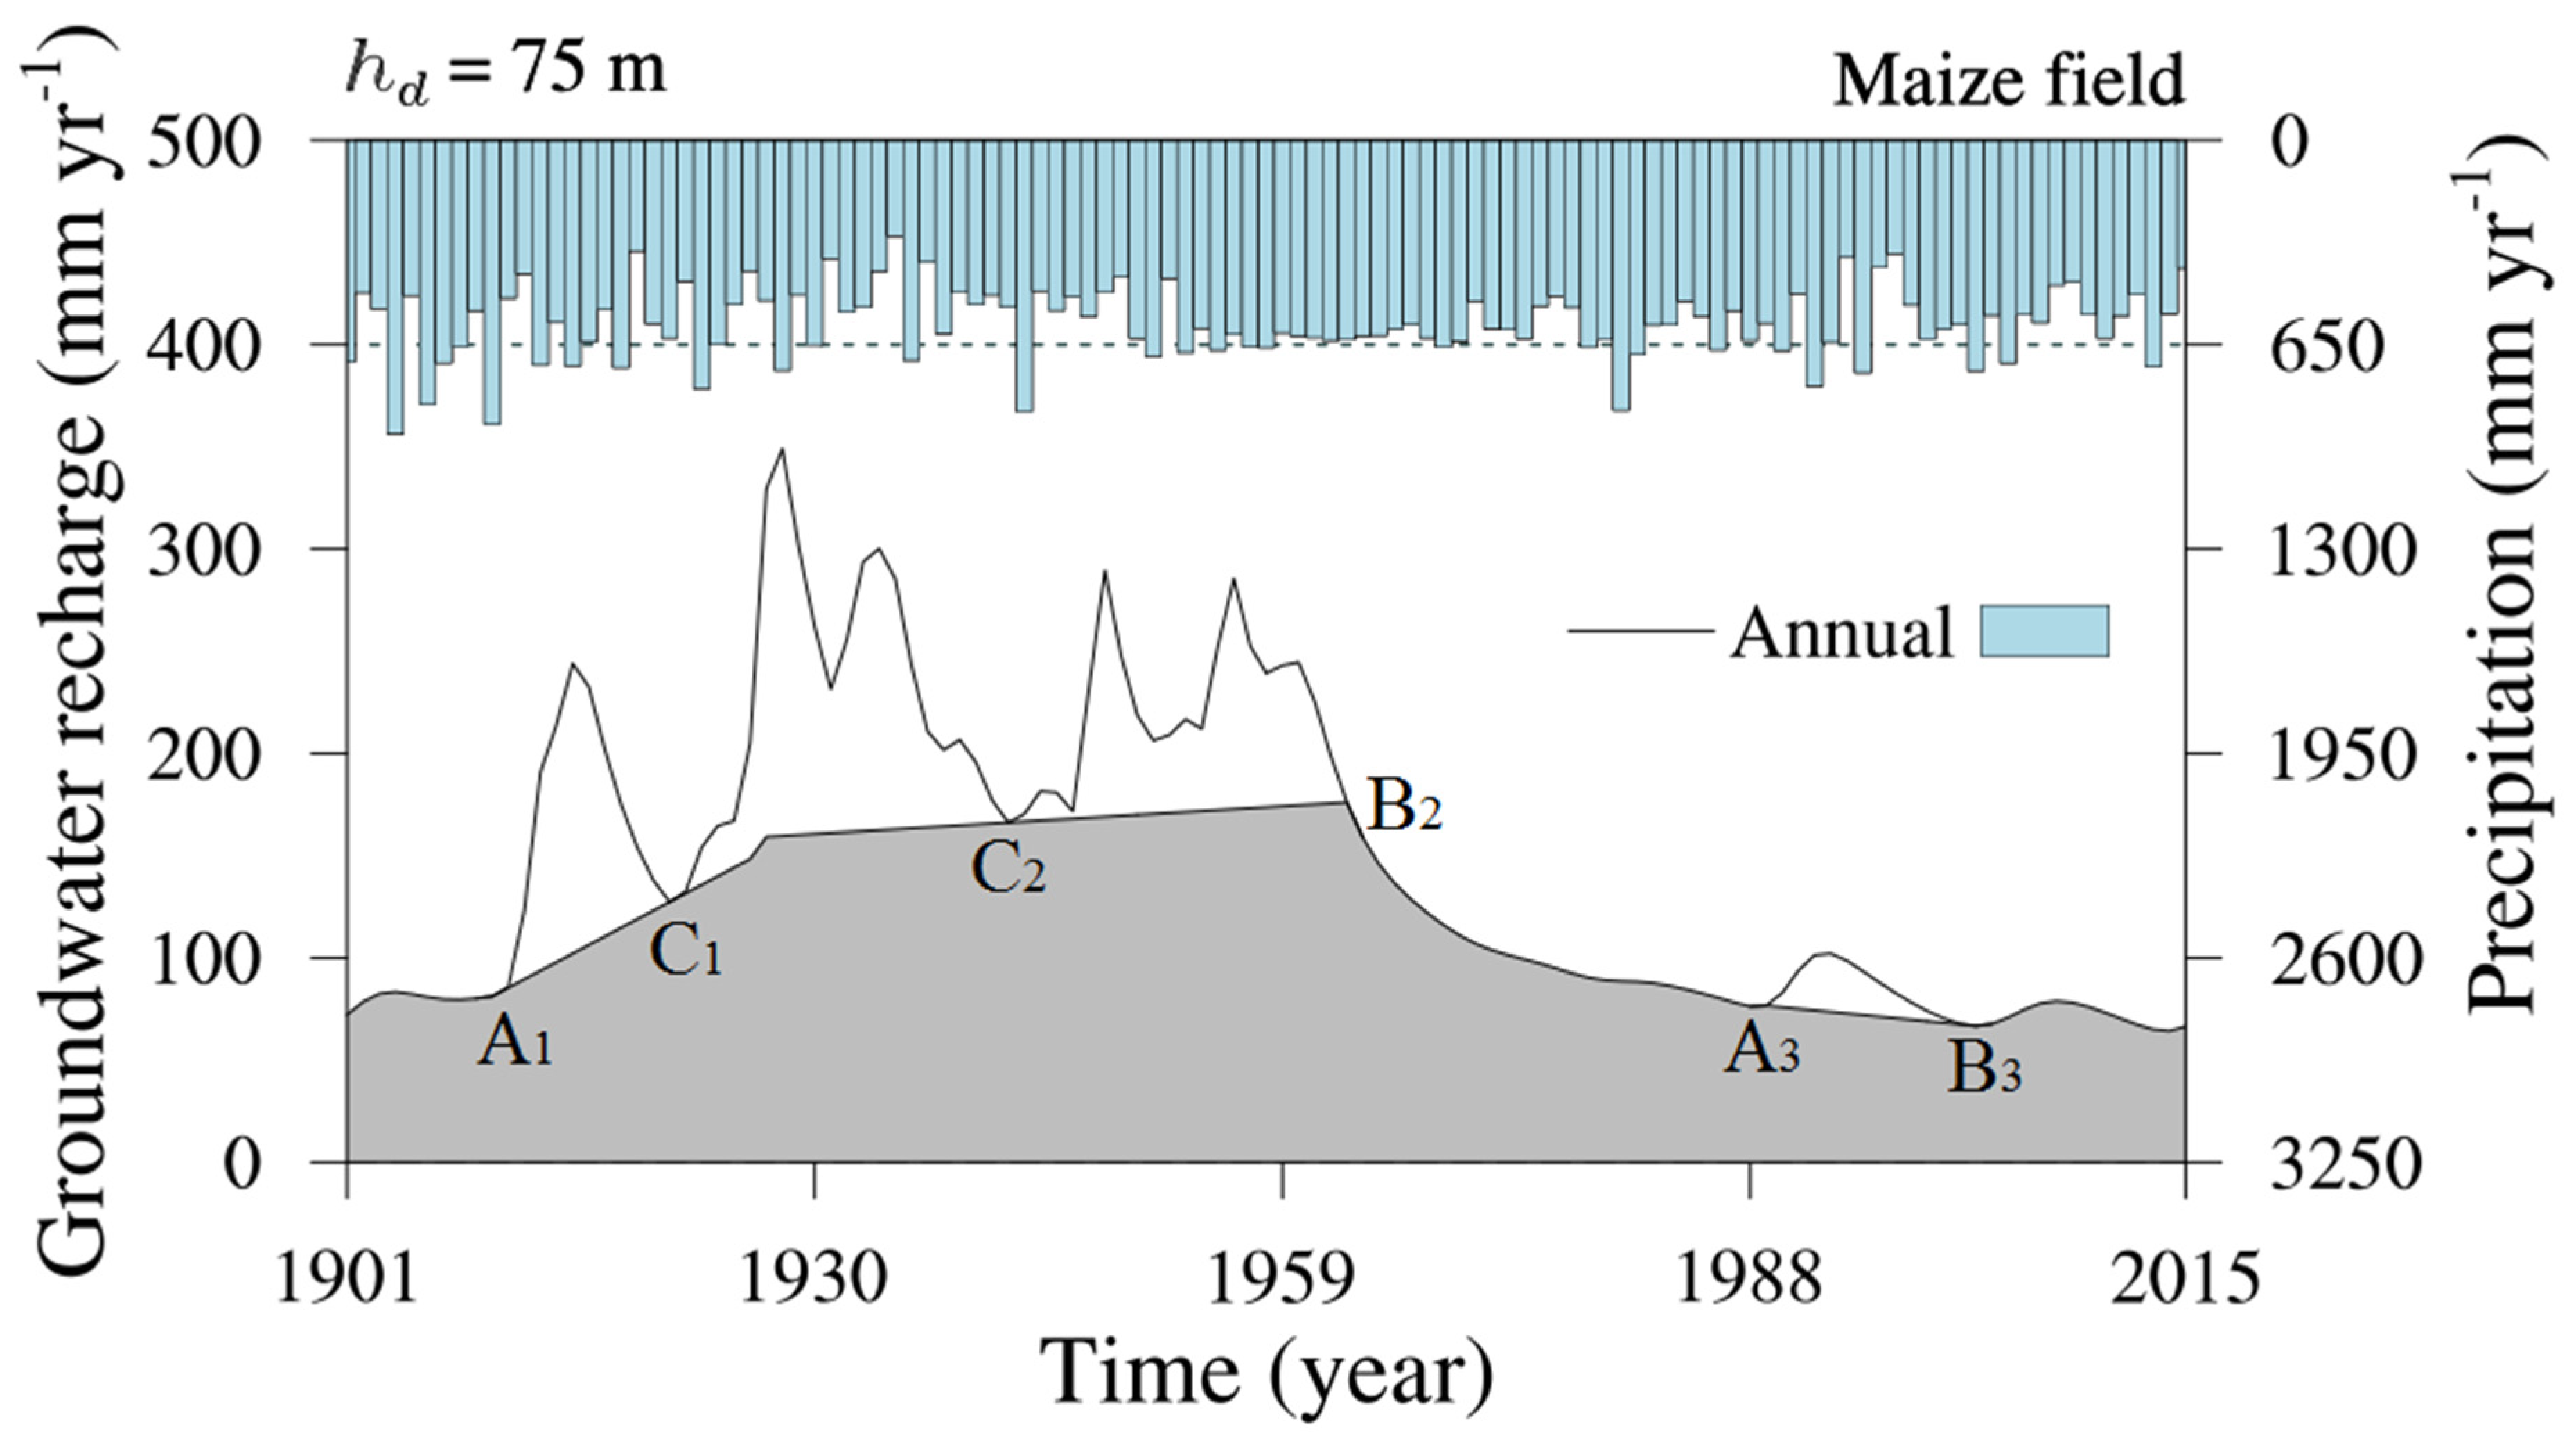
Groundwater recharge can be separated into connected and disconnected recharge [21,23]. In regions with subdued topography and few human activities, surface runoff is largely neglected. Therefore, extreme precipitation may cause a dramatic increase in groundwater recharge. This portion of groundwater recharge is associated with extreme precipitation events and it is referred to as disconnected recharge. In contrast, the portion of groundwater recharge that is caused by frequent but light precipitation is slow and it slightly varies = within a year; this is referred to as connected recharge. The total groundwater recharge is the sum of the connected and disconnected recharge (Figure 5), which is separated by the following method:
Recharge that is caused by individual precipitation events exhibits a time delay in deep soil, and this is called the response time. If an extreme precipitation event occurs at time tp and its corresponding groundwater recharge peak occurs at a certain soil depth at time td, then the transit time or response time ∆tr can be computed, as follows:
The displacement velocity v (m s−1) of the vertical downward soil water flux can be calculated, as follows:
where θ is the volumetric soil water content (cm3 cm−3) and q is the downward soil water flux (m s−1). Therefore, the required time ∆ts (s) for soil water infiltration through vertical displacement s (m) can be estimated, as follows:
We selected typical crops (winter wheat, summer maize, and 15-year-old apple trees) with different rooting depths and growth periods in the study area. The spatial and temporal distributions of soil water content were first analyzed, and the disconnected and connected groundwater recharge was calculated. The transit times of precipitation to groundwater (e.g., at a depth of 75 m) through disconnected and connected water infiltration were also analyzed.
3. Results
3.1. Effects of Precipitation and Rooting Depth on the Spatial and Temporal Distributions of Soil Water Content
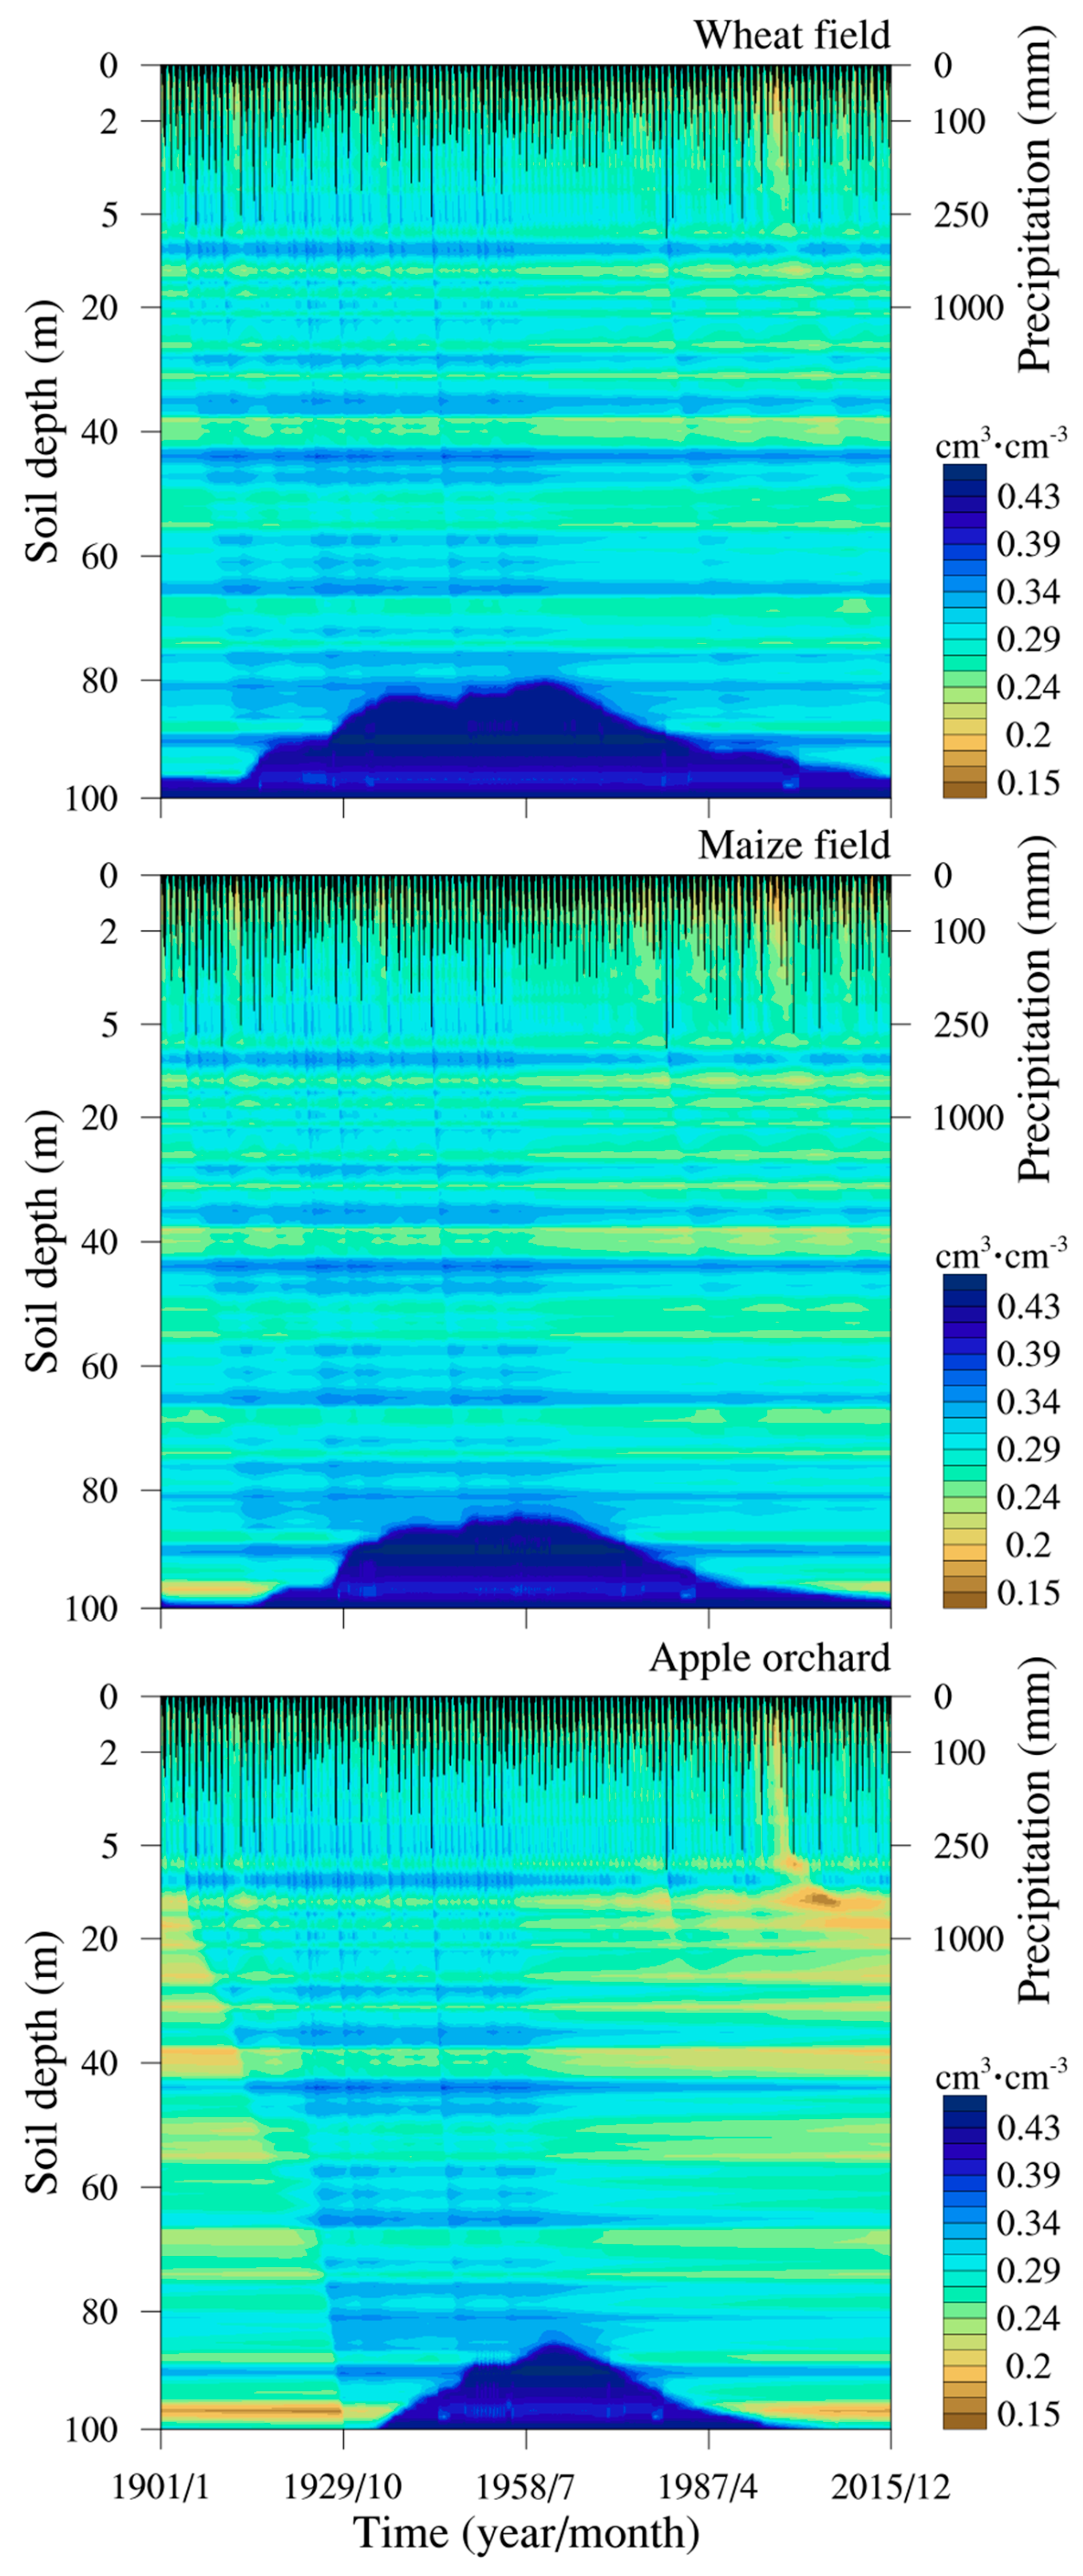
Figure 6 shows the vertical profiles of soil water content for the winter wheat field, summer maize field, and apple orchard from 1901 to 2015. The soil water content profile shows distinct horizontal bands, which are due to the stratified soil texture within the loess. Indeed, higher soil water content (horizontal blue bands) is associated with finer-textured inter-glacial paleosols, while lower soil water content (horizontal yellowish bands) occurs within the coarser-textured glacial loess layers (Figure 6).
Moreover, there are also vertical blue bands in the simulated soil water content profile that represent high soil water content (Figure 6), which suggests a strong temporal variability of soil water content. This is especially true in the top 6 m of soil. However, as the soil depth increases, the temporal variability dampens and only sporadic blue bands remain (Figure 6). These phenomena suggest that the infiltration depth was only 6 m for most precipitation events in the study region with a semi-humid climate. With an increasing soil depth, higher soil water content follows extreme precipitation events, as illustrated by the vertical blue bands (Figure 6). The occurrence of this higher soil water content shows, as a response to extreme precipitation events, a progressive delay with increasing depth for all three vegetation types.
Vegetation type also affects the soil water content profiles, and their effects are different over different periods (Figure 6). Three distinct periods can be identified from 1901 to 2015 based on the patterns of precipitation and groundwater recharge: 1901–1926, 1927–1963, and 1964–2015 (Table 1). Between 1927 and 1963, soil water content within the of 20–75 m layer was very similar for the three vegetation types, but significantly lower in the apple orchard than in the wheat and maize fields before 1927 and after 1963 (Figure 6). Furthermore, in the deep-rooted apple orchard, soil water content below 6 m was remarkably reduced when compared to that in the wheat and maize fields, especially after 1963. The lack of vertical blue bands in the deep soil layer of the apple orchard (Figure 6) suggests the little response of deep soil water to extreme precipitation events under deep-rooted vegetation.
3.2. Characteristics of Connected and Disconnected Recharge as Affected by Precipitation and Rooting Depth
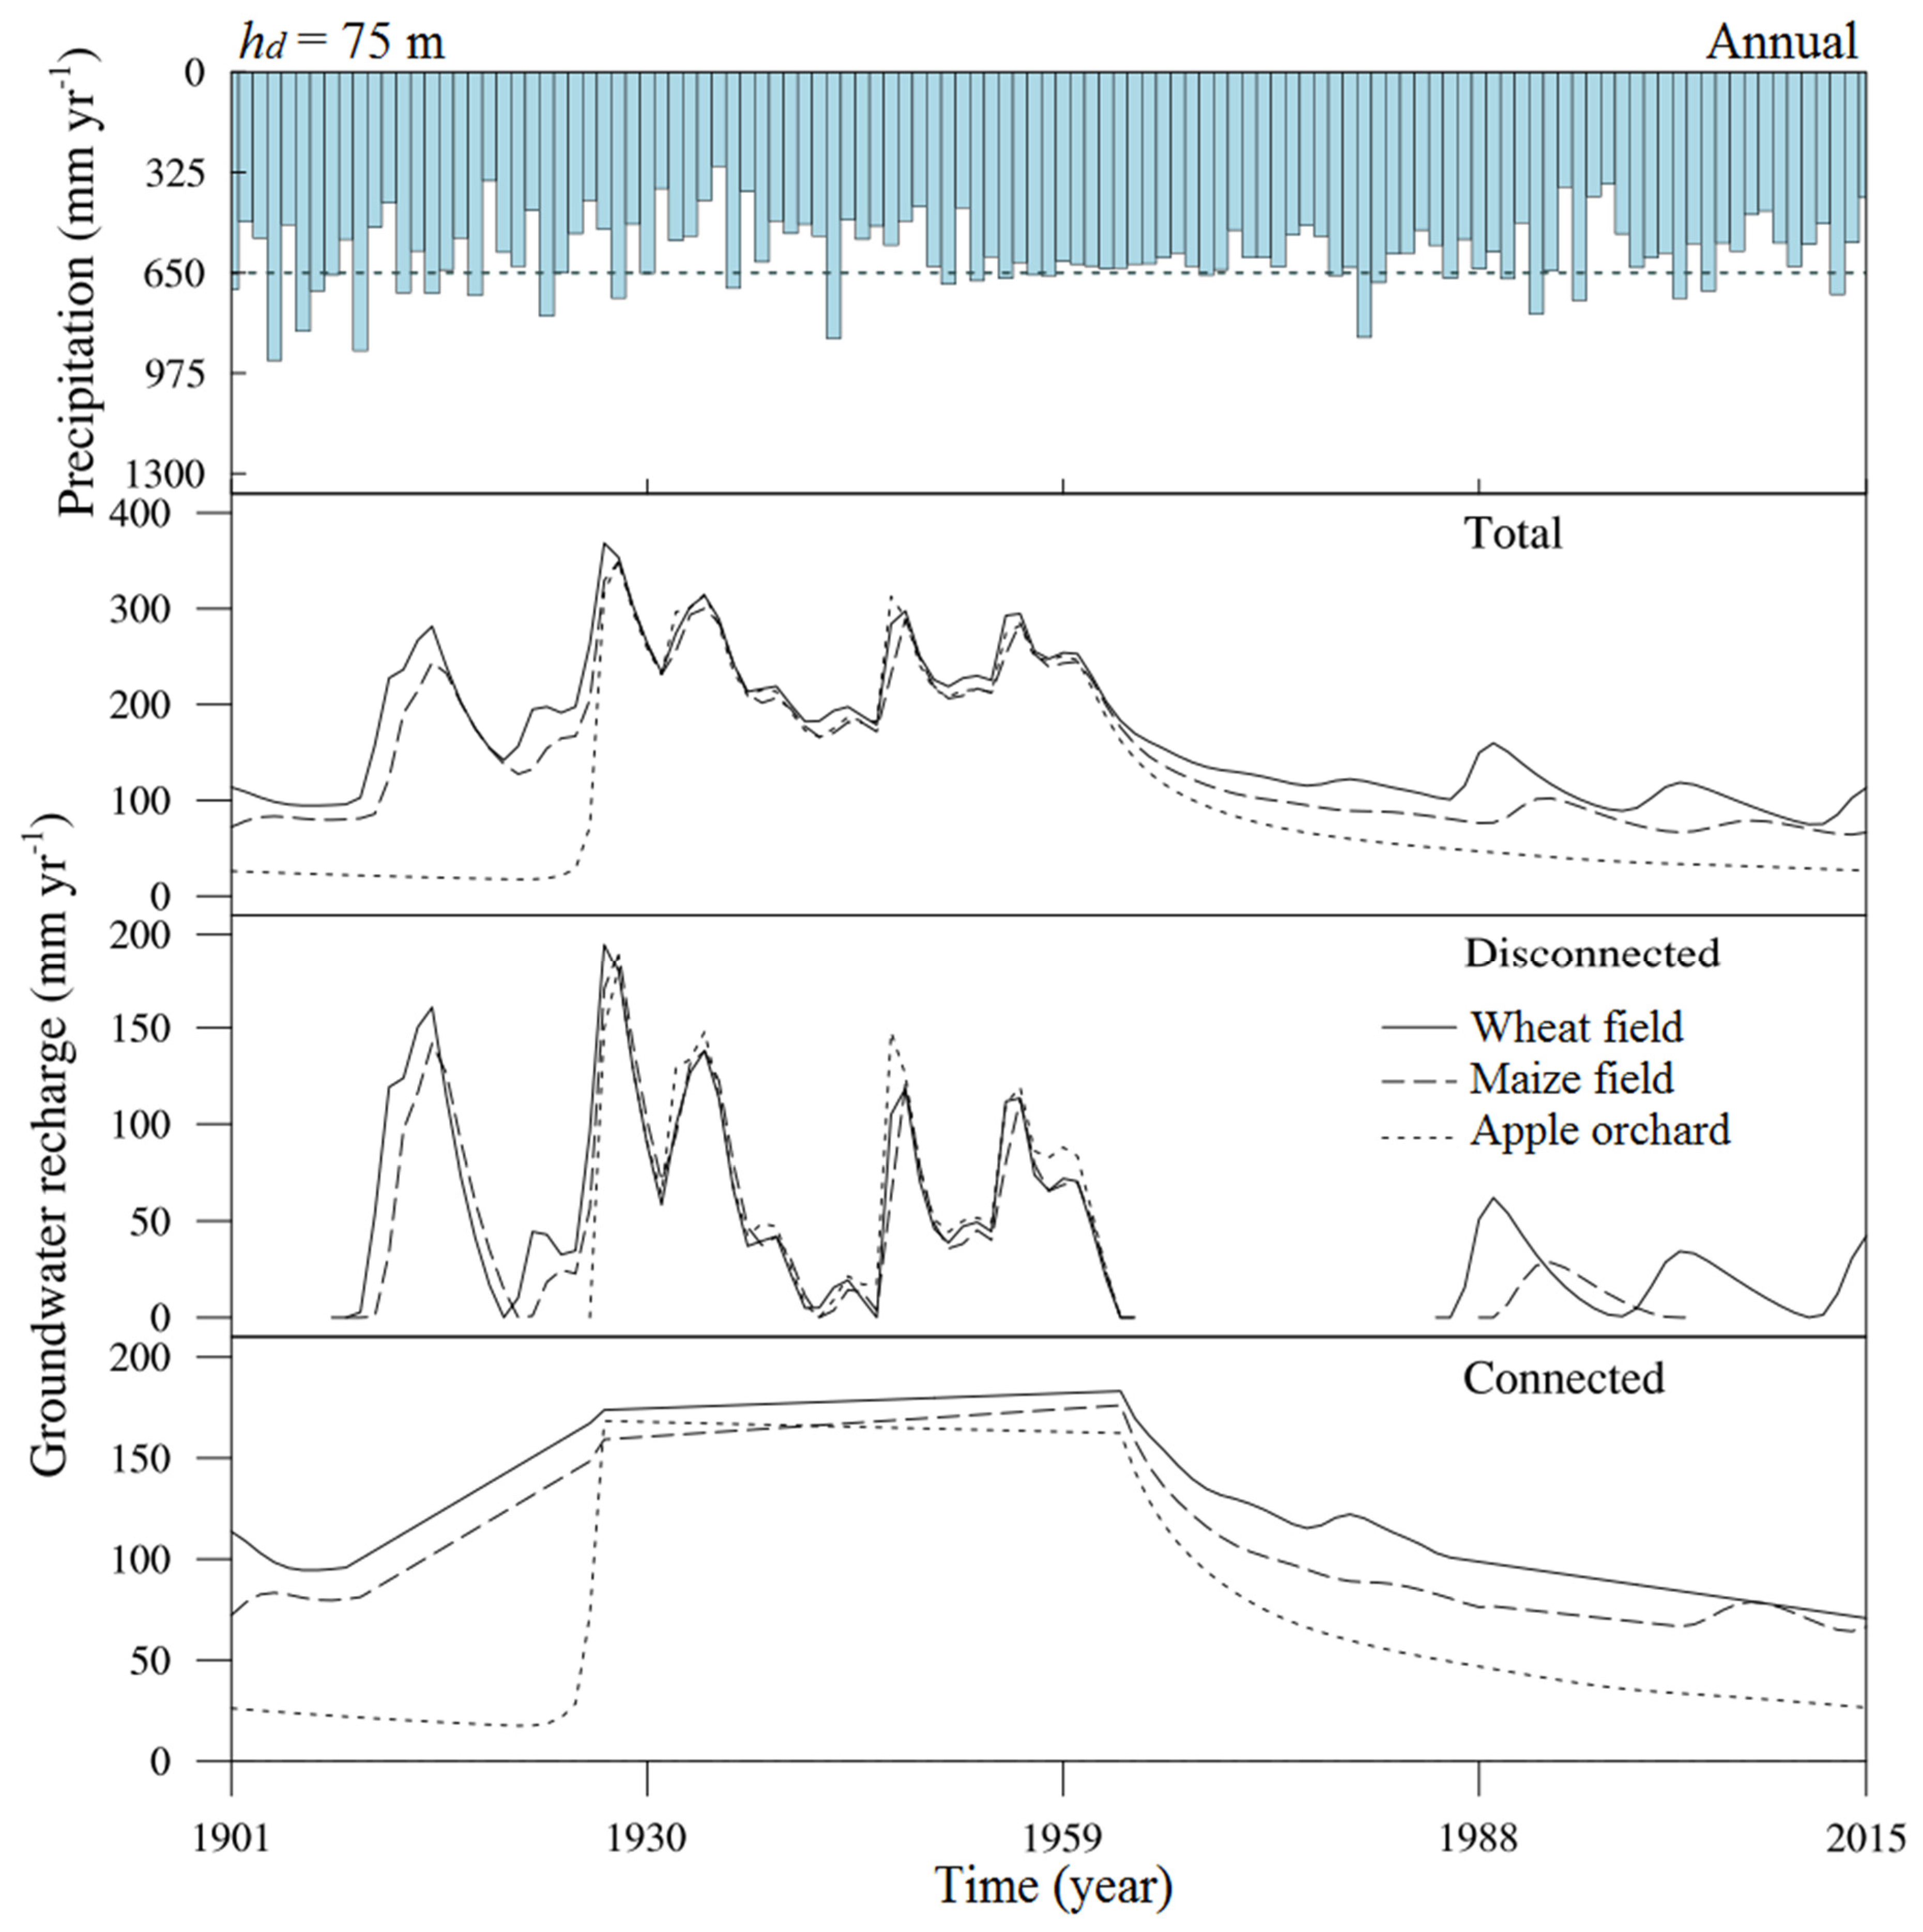
The annual groundwater recharge in the summer maize field was slightly lower than that in the winter wheat field, but both of them were much higher than that in the apple orchard (Figure 7). The averages of annual groundwater recharge were 168, 146, and 106 mm in the winter wheat field, summer maize field, and apple orchard, respectively (Table 1). The temporal variability of the deep groundwater recharge resembled that of precipitation to a large extent in the winter wheat and summer maize fields (Figure 6 and Figure 7), suggesting that precipitation controlled deep groundwater recharge in the shallow-rooted crop fields.
The number of disconnected recharge episodes differed with the vegetation type over the different periods. Table 2 presents the occurrence years of the disconnected recharge peaks and their corresponding extreme precipitation events. There were 12 years with extreme precipitation events that created disconnected recharges in the winter wheat field, only nine years in the summer maize field and six years in the apple orchard. These numbers imply the effects of vegetation type and rooting depth on the frequency of disconnected recharge. Relative to the other two periods, the period of 1927–1963 produced a greater number of disconnected recharges for all three land use types (Table 2). This is the result of a higher percentage of extreme precipitation events producing the disconnected recharge in this period (Figure 6). Furthermore, to produce the disconnected recharge, the amount of annual precipitation that is required for the shallow-rooted vegetation (wheat and maize) is smaller than that for the deep-rooted vegetation (apple trees) (Figure 7; Table 2). More specifically, the annual precipitation that generated the disconnected recharge at the 75 m depth was over 650 mm for the winter wheat field and 730 mm for the summer maize field (Figure 6 and Figure 7). None of the precipitation events produced disconnected recharge in the apple orchard, except for the period of 1919–1955 with low evapotranspiration (Table 3) (Figure 6 and Figure 7; Table 2), which suggested that it is difficult for precipitation to produce disconnected recharge under deep-rooted vegetation.
Connected recharge was the main source of total recharge for all three vegetation types, accounting for approximately 79% of the total amount (Table 1). Between 1901 and 1926, connected recharge slowly increased and it accounted for approximately 74 and 76% of the total recharge for the winter wheat and summer maize fields, respectively (Table 1). However, the apple orchard had only connected recharge and maintained a nearly steady level over the same period (Figure 7). During the period of 1964–2015, groundwater recharge slowly declined in the apple orchard (Figure 7). Even though the groundwater recharge showed a general declining trend in the winter wheat field, disconnected recharge peaks were still generated in 1989, 2002, and 2015 (Figure 7; Table 2), and the disconnected recharge accounts for approximately 10% of the total recharge in this period (Table 1). However, the summer maize field had only one obvious disconnected recharge, which accounted for less than 4% of the total groundwater recharge (Table 1). Therefore, connected recharge was the major component of groundwater recharge for all three crop fields, while disconnected recharge played a significant role in groundwater recharge under the shallow-rooted vegetation.
3.3. Response of Connected and Disconnected Recharge to Precipitation
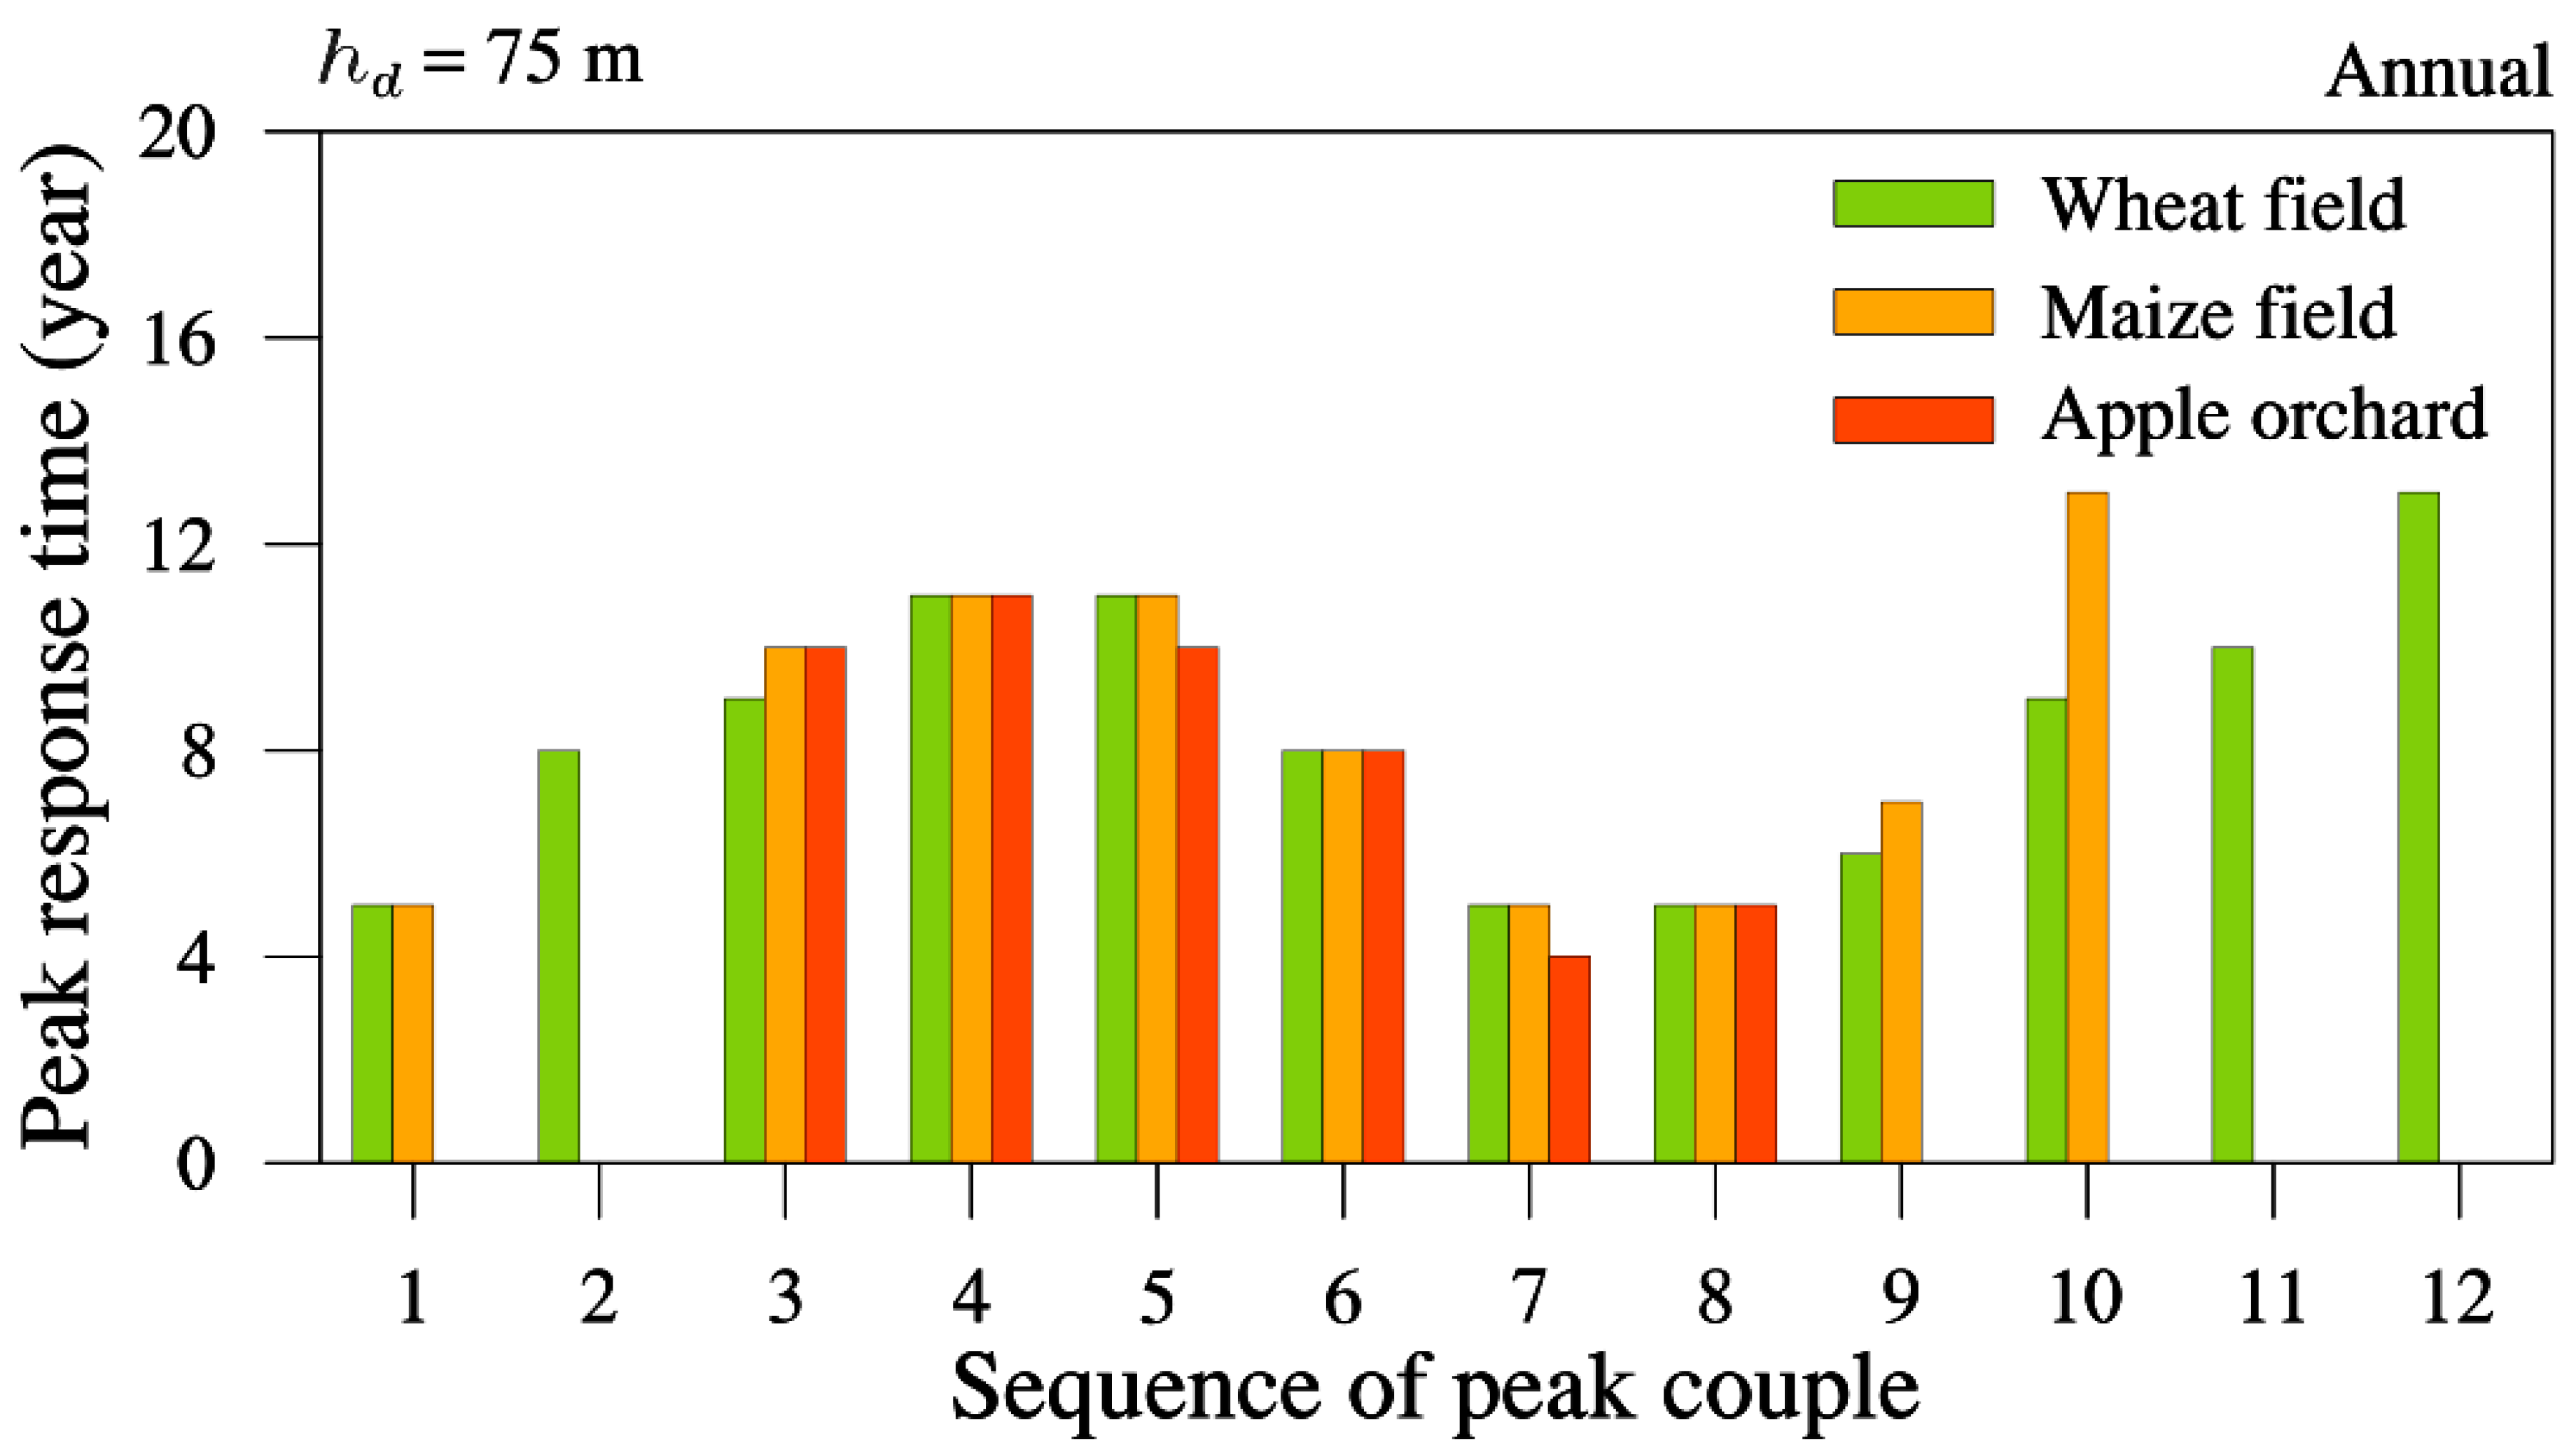
The response time of groundwater recharge to a precipitation event (Equation (4)) can be estimated as the time that it takes for precipitation to move from the soil surface down to a depth of 75 m in this study (Figure 6). The response time for disconnected recharge varied from four to 13 years (Figure 8; Table 4). The average response time seemed shorter for 1927–1963 than for 1901–1926 and 1964–2014 (Figure 8). After 1963, a few disconnected recharge events occurred in the winter wheat and summer maize fields, and the averages of their response times at the 75 m depth were 10.7 and 13 years, respectively (Table 4). However, there was no discernible disconnected recharge in the apple orchard after 1963.
Meanwhile, the transit time of precipitation to deep groundwater (Equation (6)) also depended on rooting depth and the magnitude of evapotranspiration (ET). Over the period of 1927–1963, the transit time for the connected recharge was 91.2 years for the winter wheat field, 95.3 years for the summer maize field, and 94 years for the apple orchard, which showed small differences among the three vegetation types (Table 4). However, over the period of 1901–1926, the transit time varied from 134 years for the winter wheat field, to 162.1 years for the summer maize field, and 876.2 years for the apple orchard. After 1963, the mean transit times for the connected recharge from the land surface to 75 m depth were 185.6, 235.2, and 370.0 years for the winter wheat field, summer maize field, and apple orchard, respectively (Table 4). Therefore, the mean transit time for the connected recharge in the summer maize field was nearly 50 years longer than that in the winter wheat field, and, in the apple orchard, it was approximately 100 and 57% longer than that in the winter wheat field and summer maize field, respectively (Table 4).
4. Discussion
Precipitation controls groundwater recharge, as shown by Shao et al. [21]. Previous studies have also shown that rooting depth is also inversely related to groundwater recharge [5,18]. However, little is known regarding how the interactions between rooting depth and precipitation affect groundwater recharge.
4.1. Rooting Depth Alters Long-Term Average Recharge
The 115-year average annual groundwater recharge in the summer maize field was slightly lower than that in the winter wheat field, but it was still much higher than that in the 15-year-old apple orchard (Figure 7). This is because the apple orchard had a deep root system and a longer active growing season (from March to November), both resulting in increased ET. While the longer growing season also increases the potential ET, the deep roots of apple trees can intercept downward-moving soil water that would otherwise recharge groundwater in shallow-rooted systems, effectively increasing the root zone thickness and the water storage that is available to plants for ET. Consequently, the average annual ET value was 509 mm for the apple orchard, which was much higher than 447 mm for the winter wheat field, and 469 mm for the summer maize field (Table 3). Therefore, groundwater recharge from the root zone in the apple orchard was lower than that in the winter wheat and summer maize fields with the same precipitation but larger ET. This is consistent with the result that rooting depth controls the potential groundwater recharge from an environmental tracer study in the same region [32].
Over the period of 1964–2015, the average groundwater recharge rates were 115, 89, and 54 mm/yr in the winter wheat field, summer maize field, and apple orchard, respectively (Table 1). These values reflect the potential groundwater recharge rates under these three vegetation types at the study site. Li et al. [32] calculated an average groundwater recharge rate of 107 ± 55 mm/yr with the environmental tracer in the same region. Although this differs somewhat from our results, it reflects the average recharge rate of the entire Wangdonggou watershed after 1965 and it does not address the disconnected recharge caused by extreme precipitation. Therefore, the average recharge rates of soil water that were reported in the present study are acceptable for both shallow-rooted and deep-rooted vegetation.
4.2. Interaction between Climate and Rooting Depth on Long-Term Average Recharge
The effect of rooting depth on groundwater recharge depends on whether the climate is relatively wet or dry. In a relatively wet period, such as 1919–1955 (Table 3), the groundwater recharge (1927–1963) that is generated by precipitation did not differ much among the three vegetation types (Figure 6 and Figure 7). This may be attributed to the low ET, which allowed for more precipitation to infiltrate the deep soil layer (Figure 6; Table 3). When compared with the earlier and later periods, the average annual ET rates over the period of 1919–1955 were reduced by approximately 9.7 and 26% in the winter wheat field, 10.3 and 26.5% in the summer maize field, and 16.4 and 34.1% in the apple orchard (Table 3). The relatively low ETs caused less soil water deficit and allowed for more precipitation to infiltrate the deep soil, forming groundwater recharge, even in the deep-rooted apple orchard (Figure 6 and Figure 7).
Furthermore, soil water storage within the shallow soil (<6 m) of the apple orchard may have been sufficient for plants to meet the ET demand because of the low ET. Therefore, the water infiltrating the soil below 6 m became groundwater recharge, resulting in little difference among the three vegetation types. For the opposite reasons (high ET and high soil water deficits), the effect of rooting depth on groundwater recharge was more pronounced in the other two periods.
4.3. Rooting Depth Effects on Recharge Mechanisms
Rooting depth alters the amount of precipitation that is required to produce disconnected recharge and its ratio to total groundwater recharge. For disconnected recharge to occur, besides extreme precipitation, the antecedent soil must be wet enough. In the periods of 1901–1927 and 1964–2015, the annual precipitation that generated the disconnected recharge at 75 m depth was over 650 mm for the winter wheat field, 730 mm for the summer maize field, but none for the apple orchard (Figure 6 and Figure 7).
The deep-rooted apple orchard almost eliminated the possibility of disconnected recharge. For example, extreme precipitation with an annual amount of 902 mm happened in 1910, and 859 mm occurred in 1980, and their recharge depths were both less than 25 m (Figure 6 and Figure 7). This shows that the water deficit is more than 1000 mm in soil depths of 6–30 m in the apple orchard. This result is consistent with Zhang et al. [18] and Li et al. [5], who showed a water deficit of >1000 mm in deep soil. Therefore, a greater amount of precipitation is needed to overcome the deficit and to raise the soil water content to a level that can produce disconnected recharge. The soil water deficit would need to be balanced with a net amount of 1000 mm of water (precipitation—ET), which is virtually non-existent over a short-term (e.g., ≤1 year) in this region. The higher ET means higher soil water consumption in the root zone, which usually causes lower soil water content and even a soil water deficit in the deep soil (>6 m) (Figure 6). Therefore, the water interception of the root zone and the soil water deficit resulting from soil water uptake in deep soil are the two main reasons for the reduction in groundwater recharge and the low frequency of disconnected recharge over the periods of 1901–1927 and 1964–2015.
Although groundwater recharge with disconnected recharge was significantly faster than that with connected recharge, the contribution of the disconnected recharge to total recharge was low for all three vegetation types (Figure 7). During the entire 115-year period, groundwater recharge due to disconnected recharge accounted for only 21% of the total for these three vegetation types (Table 1). Precipitation had to be greater than 650, 730, and 1000 mm for the winter wheat field, summer maize field, and apple orchard, respectively, to generate disconnected flow, representing a respective frequency of 27, 8.7, and 0% (Figure 6 and Figure 7). Therefore, the disconnected recharge in any year not only contributed a small amount to the groundwater recharge, but it also rarely occurred.
The transit time of precipitation to groundwater ranges from less than 10 years to hundreds of years in our study region (Figure 8; Table 4). As discussed above, a greater rooting depth could significantly reduce the frequency of disconnected recharge and generate a longer response time for deep groundwater recharge. This is because deep-rooted vegetation depletes soil water storage more easily than shallow-rooted vegetation. Precipitation events must be large enough to fill the deficit for precipitation to move through the deficit zone of soil water. This is why the apple orchard did not have any disconnected recharge after 1963 and it had a very long transit time.
The differences in response time within the three periods were closely related to the soil water content of the unsaturated zone. Due to the more extreme precipitation and lower ET over the period of 1919–1955 (Table 3), there was little soil water deficit in the root zone of the three crop fields in the following years (Figure 6), and the transit time of precipitation to deep groundwater was very similar in the period of 1927–1963 (Table 4). In wet periods, such as 1919–1955 (Table 3), the lower ET resulted in higher soil water content, and thus less precipitation was needed to fill the soil water deficit. Consequently, relative to the other two drier periods (Table 3), more precipitation events (1919–1955) generated the disconnected recharge (1927–1963) at the 75 m depth (Figure 6 and Figure 7), and the transit time of precipitation to groundwater (1927–1963) was shorter (Table 4). This further proves that the magnitude of the soil water deficit dictates the occurrence of disconnected recharge and the transit time of precipitation to groundwater. The larger the soil water deficit, the longer the transit time.
5. Conclusions
We conducted a series of long-term modeling of groundwater recharge with different rooting depths and growth periods, as well as with actual soil and climate data. When compared to shallow-rooted vegetation, deep-rooted vegetation usually draws more soil water to feed transpiration, thus generating less recharge to the deep soil water and groundwater.
Connected recharge is the major source of recharge for deep groundwater, and it is controlled by climate and it accounts for over 78% of the total recharge for both shallow-rooted and deep-rooted vegetation. The frequency of extreme precipitation events that can generate disconnected recharge at the 75 m depth is relatively low. Furthermore, only annual precipitation amounts over 650, 730, and 1000 mm result in disconnected recharge for the winter wheat field, summer maize field, and 15-year-old apple orchard, respectively.
The transit time of precipitation to groundwater varies from several to hundreds of years in our study region. In the relatively wet years of our entire study period, the rooting depth and the growth period of vegetation have no significant effect on groundwater recharge. However, the transit time is much longer with deep-rooted vegetation than with shallow-rooted vegetation in most situations.
Author Contributions
Conceptualization, J.S., B.S. and J.J.; Methodology, J.S.; Software, J.S.; Validation, J.S.; Formal analysis, J.S.; Data correction, J.S., B.S. and J.J.; Writing—Original Draft Preparation, J.S.; Writing—Review & Editing, J.S., B.S. and J.J.; Supervision, B.S. and J.J.
Funding
This research was funded by the National Natural Science Foundation of China [Award Numbers 41630860 and 41571030].
Acknowledgments
The authors would like to acknowledge the sampling group for their hard work and the help from model group members.
Conflicts of Interest
The authors declare no conflict of interest.
References
- Fan, Y.; Miguez-Macho, G.; Jobbágy, E.G.; Jackson, R.B.; Otero-Casal, C. Hydrologic regulation of plant rooting depth. Proc. Natl. Acad. Sci. USA 2017, 114, 10572–10577. [Google Scholar] [CrossRef] [PubMed] [Green Version]
- Schulze, E.D.; Caldwell, M.M.; Mooney, H.A.; Jackson, R.B.; Parson, D.; Scholes, R.; Sala, O.E.; Trimborn, P. Downward flux of water through roots (i.e., inverse hydraulic lift) in dry Kalahari sands. Oecologia 1998, 115, 460–462. [Google Scholar] [CrossRef] [PubMed]
- Wang, X.; Zhu, D.; Wang, Y.; Wei, X.; Ma, L. Soil water and root distribution under jujube plantations in the semiarid Loess Plateau region, China. Plant Growth Regul. 2015, 77, 21–31. [Google Scholar] [CrossRef]
- Yang, Y.; Donohue, R.J.; McVicar, T.R. Global estimation of effective plant rooting depth: Implications for hydrological modeling. Water Resour. Manag. 2016, 52, 8260–8276. [Google Scholar] [CrossRef] [Green Version]
- Li, H.; Si, B.C.; Li, M. Rooting depth controls potential groundwater recharge on hillslopes. J. Hydrol. 2018, 564, 164–174. [Google Scholar] [CrossRef]
- Schulze, E.D.; Mooney, H.A.; Sala, O.E.; Jobbagy, E.; Buchmann, N.; Bauer, G.; Canadell, J.; Jackson, R.B.; Loreti, J.; Oesterheld, M.; et al. Rooting depth, water availability, and vegetation cover along an aridity gradient in Patagonia. Oecologia 1996, 108, 503–511. [Google Scholar] [CrossRef] [PubMed]
- Guswa, A.J. The influence of climate on root depth: A carbon cost-benefit analysis. Water Resour. Res. 2008, 44, 1–11. [Google Scholar] [CrossRef]
- Freycon, V.; Christelle, W.; Fayolle, A.; Laclau, J.; Lucot, E.; Jourdan, C.; Cornu, G.; Gourlet-Fleury, S. Tree roots can penetrate deeply in African semi-deciduous rain forests: Evidence from two common soil types. J. Tropi. Ecol. 2015, 31, 13–23. [Google Scholar] [CrossRef]
- Wang, Y.; Shao, M.; Zhang, C.; Liu, Z.; Zou, J.; Xiao, J. Soil organic carbon in deep profiles under Chinese continental monsoon climate and its relations with land uses. Ecol. Eng. 2015, 82, 361–367. [Google Scholar] [CrossRef]
- Pinheiro, R.C.; Costa, R.; de Deus, J.C., Jr.; Nouvellon, Y.; Campoe, O.C.; Stape, J.L.; Aló, L.L.; Guerrini, I.A.; Jourdan, C.; Laclau, J. A fast exploration of very deep soil layers by eucalyptus seedlings and clones in Brazil. For. Ecol. Manag. 2016, 366, 143–152. [Google Scholar] [CrossRef]
- Chen, L.; Huang, Z.; Gong, J.; Fu, B.; Huang, Y. The effect of land cover/vegetation on soil water dynamic in the hilly area of the Loess Plateau, China. Catena 2007, 70, 200–208. [Google Scholar] [CrossRef]
- Bonan, G.B.; Drewniak, B.; Huang, M.; Koven, C.D.; Levis, S.; Li, F.; Riley, W.J.; Subin, Z.M.; Swenson, S.C.; Thornton, P.E. Technical Description of Version 4.5 of the COMMUNITY Land Model (CLM); NCAR Technical Note NCAR/TN-503+STR; National Center for Atmospheric Research: Boulder, CO, USA, 2013; pp. 175–176. [Google Scholar]
- Oleson, K.W.; Lawrence, D.M.; Bonan, G.B.; Flanner, M.G.; Kluzek, E.; Lawrence, P.J.; Levis, S.; Swenson, S.C.; Thornton, P.E. Technical Description of Version 4.0 of the Community Land model (CLM); NCAR Technical Note NCAR/TN-478+STR; National Center for Atmospheric Research: Boulder, CO, USA, 2010; pp. 141–142. [Google Scholar]
- Hörmann, G.; Branding, A.; Clemen, T.; Herbst, M.; Hinrichs, A.; Thamm, F. Calculation and simulation of wind controlled canopy interception of a beech forest in northern Germany. Agric. For. Meteorol. 1996, 79, 131–148. [Google Scholar] [CrossRef]
- Murakami, S. A proposal for a new forest canopy interception mechanism: Splash droplet evaporation. J. Hydrol. 2006, 319, 72–82. [Google Scholar] [CrossRef]
- Loustau, D.; Berbigier, P.; Granier, A. Interception loss, throughfall and stemflow in a maritime pine stand. II. An application of Gash analytical model of interception. J. Hydrol. 1992, 138, 469–485. [Google Scholar] [CrossRef]
- Jian, S.; Zhao, C.; Fang, S.; Yu, K. Effects of different vegetation restoration on soil water storage and water balance in the Chinese Loess Plateau. Agric. For. Meteorol. 2015, 206, 85–96. [Google Scholar] [CrossRef]
- Zhang, Z.; Li, M.; Si, B.; Feng, H. Deep rooted apple trees decrease groundwater recharge in the highland region of the Loess Plateau, China. Sci. Total Environ. 2018, 622–623, 584–593. [Google Scholar] [CrossRef] [PubMed]
- Scanlon, B.R.; Keese, K.E.; Flint, A.L.; Flint, L.E.; Gaye, C.B.; Edmunds, W.M.; Simmers, I. Global synthesis of groundwater recharge in semiarid and arid regions. Hydrol. Process. 2006, 20, 3335–3370. [Google Scholar] [CrossRef]
- Kim, J.H.; Jackson, R.B. A global analysis of groundwater recharge for vegetation, climate, and soils. Vadose Zone J. 2012, 11, 1–35. [Google Scholar] [CrossRef]
- Shao, J.; Si, B.; Jin, J. Extreme precipitation years and their occurrence frequency regulate long-term groundwater recharge and transit time. Vadose Zone J. 2018, 17, 180093. [Google Scholar] [CrossRef]
- Taylor, R.G.; Scanlon, B.; Döll, P.; Rodell, M.; van Beek, R.; Wada, Y.; Longuevergne, L.; Leblanc, M.; Famiglietti, J.S.; Edmunds, M.; et al. Ground water and climate change. Nat. Clim. Chang. 2012, 3, 322–329. [Google Scholar] [CrossRef] [Green Version]
- Good, S.P.; Noone, D.; Bowen, G. Hydrologic connectivity constrains partitioning of global terrestrial water fluxes. Science 2015, 349, 175–177. [Google Scholar] [CrossRef] [PubMed] [Green Version]
- Iversen, C.M. Digging deeper: Fine-root responses to rising atmospheric CO2 concentration in forested ecosystems. New Phytol. 2010, 186, 346–357. [Google Scholar] [CrossRef] [PubMed]
- Schenk, H.J.; Jackson, R.B. Rooting depths, lateral root spreads and below-ground/above-ground allometries of plants in water-limited ecosystems. J. Ecol. 2002, 90, 480–494. [Google Scholar] [CrossRef]
- Ding, Z.L.; Rutter, N.W.; Sun, J.M.; Yang, S.L.; Liu, T.S. Re-arrangement of atmospheric circulation at about 2.6 Ma over northern China: Evidence from grain size records of loess-palaeosol and red clay sequences. Quat. Sci. Rev. 2000, 19, 547–558. [Google Scholar] [CrossRef]
- Torrent, J.; Liu, Q.; Bloemendal, J.; Barrón, V. Magnetic enhancement and iron oxides in the upper Luochuan loess–paleosol sequence, Chinese Loess Plateau. Soil Sci. Soc. Am. J. 2007, 71, 1570–1578. [Google Scholar] [CrossRef]
- Messing, I.; Chen, L.; Hessel, R. Soil conditions in a small catchment on the Loess Plateau in China. Catena 2003, 54, 45–58. [Google Scholar] [CrossRef]
- Cheng, L.; Liu, W.; Li, Z.; Han, X. Land use change affects groundwater recharge in the Changwu Loess Tableland of China. Adv. Water Sci. 2016, 27, 670–678. (In Chinese) [Google Scholar] [CrossRef]
- Huang, Y.; Chang, Q.; Li, Z. Land use change impacts on the amount and quality of recharge water in the loess tablelands of China. Sci. Total Environ. 2018, 628–629, 443–452. [Google Scholar] [CrossRef]
- Zeng, X.B. Global vegetation root distribution for land modeling. J. Hydrometeorol. 2001, 2, 525–530. [Google Scholar] [CrossRef]
- Li, Z.; Chen, X.; Liu, W.; Si, B. Determination of groundwater recharge mechanism in the deep loessial unsaturated zone by environmental tracers. Sci. Total Environ. 2017, 586, 827–835. [Google Scholar] [CrossRef] [Green Version]
Figure 1.
Sketch of sample points in the Loess Plateau of China. h and hl are the depth of the groundwater table (m) and the lower boundary of the virtual soil layer (m) that is set as the bottom of the phreatic aquifer, respectively.
Figure 1.
Sketch of sample points in the Loess Plateau of China. h and hl are the depth of the groundwater table (m) and the lower boundary of the virtual soil layer (m) that is set as the bottom of the phreatic aquifer, respectively.

Figure 2.
Monthly observed roots (biomass) of winter wheat in each soil layer (%) at different depths (m) (without roots under the 5 m depth).
Figure 2.
Monthly observed roots (biomass) of winter wheat in each soil layer (%) at different depths (m) (without roots under the 5 m depth).

Figure 3.
Monthly observed roots (biomass) of summer maize in each soil layer (%) at different depths (m) (without roots under the 2 m depth).
Figure 3.
Monthly observed roots (biomass) of summer maize in each soil layer (%) at different depths (m) (without roots under the 2 m depth).

Figure 4.
Root length density of 15-year-old apple trees in each soil layer (%) at different depths, as expressed by its bottom (m) (without roots under the 20 m depth).
Figure 4.
Root length density of 15-year-old apple trees in each soil layer (%) at different depths, as expressed by its bottom (m) (without roots under the 20 m depth).

Figure 5.
Divisions of groundwater recharge into the connected and disconnected parts in the summer maize field at an annual scale. Soil depth hd is chosen to calculate the groundwater recharge. The gray and white areas surrounded by each line indicate the connected and disconnected parts of groundwater recharge, respectively. A, B, and C are the point types in each period for dividing groundwater recharge, and their subscript numbers (1, 2, and 3) denote the order of each divided period.

Figure 6.
Distribution of soil water content at 0–100 m depths from 1901 to 2015 in the winter wheat field, summer maize field, and apple orchard on a monthly scale.
Figure 6.
Distribution of soil water content at 0–100 m depths from 1901 to 2015 in the winter wheat field, summer maize field, and apple orchard on a monthly scale.

Figure 7.
Annual precipitation, total recharge, disconnected recharge, and connected recharge for the winter wheat field, summer maize field, and apple orchard between 1901 and 2015.
Figure 7.
Annual precipitation, total recharge, disconnected recharge, and connected recharge for the winter wheat field, summer maize field, and apple orchard between 1901 and 2015.

Figure 8.
Response time of groundwater recharge peak at a soil depth (hd) of 75 m to extreme precipitation (with an annual amount >650 mm) for the wheat field, maize field, and apple orchard. Combined precipitation and recharge peaks with the same sequence number (Table 2) are referred to as peak couples, and the time interval between these two peaks is the response time.


Table 1.
Annual means of connected recharge and total recharge in the winter wheat field, summer maize field, and apple orchard in each period (mm).
Table 1.
Annual means of connected recharge and total recharge in the winter wheat field, summer maize field, and apple orchard in each period (mm).
| Type | 1901–1926 | 1927–1963 | 1964–2015 | 1901–2015 | ||||
|---|---|---|---|---|---|---|---|---|
| Connected | Total | Connected | Total | Connected | Total | Connected | Total | |
| Winter wheat | 122 | 165 | 178 | 246 | 103 | 115 | 132 | 168 |
| Summer maize | 103 | 135 | 168 | 234 | 86 | 89 | 116 | 146 |
| Apple orchard | 23 | 23 | 165 | 238 | 54 | 54 | 83 | 106 |
Table 2.
Relationship between the occurrence years of extreme precipitation and groundwater recharge peaks at the 75 m depth in the winter wheat field, summer maize field, and apple orchard.
Table 2.
Relationship between the occurrence years of extreme precipitation and groundwater recharge peaks at the 75 m depth in the winter wheat field, summer maize field, and apple orchard.
| Sequence | 1 | 2 | 3 | 4 | 5 | 6 | 7 | 8 | 9 | 10 | 11 | 12 |
|---|---|---|---|---|---|---|---|---|---|---|---|---|
| Precipitation | 1910 | 1915 | 1918 | 1923 | 1928 | 1936 | 1943 | 1951 | 1953 | 1980 | 1992 | 2002 |
| Winter wheat | 1915 | 1923 | 1927 | 1934 | 1939 | 1944 | 1948 | 1956 | 1959 | 1989 | 2002 | 2015 |
| Summer maize | 1915 | - | 1928 | 1934 | 1939 | 1944 | 1948 | 1956 | 1960 | 1993 | - | - |
| Apple orchard | - | - | 1928 | 1934 | 1938 | 1944 | 1947 | 1956 | - | - | - | - |
Table 3.
Means of annual evapotranspiration (ET) in the winter wheat field, summer maize field, and apple orchard in each period (mm).
Table 3.
Means of annual evapotranspiration (ET) in the winter wheat field, summer maize field, and apple orchard in each period (mm).
| Type | 1901–1918 | 1919–1955 | 1956–2015 | 1901–2015 |
|---|---|---|---|---|
| Winter wheat | 419 | 378 | 510 | 447 |
| Summer maize | 440 | 395 | 537 | 469 |
| Apple orchard | 476 | 398 | 604 | 509 |
Table 4.
Mean transit times (years) for the disconnected recharge and total recharge at the 75m depth in the winter wheat field, summer maize field, and apple orchard in each period.
Table 4.
Mean transit times (years) for the disconnected recharge and total recharge at the 75m depth in the winter wheat field, summer maize field, and apple orchard in each period.
| Type | 1901–1926 | 1927–1963 | 1964–2015 | |||
|---|---|---|---|---|---|---|
| Disconnected | Total | Disconnected | Total | Disconnected | Total | |
| Winter wheat | 6.5 | 134 | 8 | 91.2 | 10.7 | 185.6 |
| Summer maize | 5 | 162.1 | 8.3 | 95.3 | 13 | 235.2 |
| Apple orchard | - | 876.2 | 8.2 | 94 | - | 370 |
© 2019 by the authors. Licensee MDPI, Basel, Switzerland. This article is an open access article distributed under the terms and conditions of the Creative Commons Attribution (CC BY) license (http://creativecommons.org/licenses/by/4.0/).
Share and Cite
MDPI and ACS Style
Shao, J.; Si, B.; Jin, J. Rooting Depth and Extreme Precipitation Regulate Groundwater Recharge in the Thick Unsaturated Zone: A Case Study. Water 2019, 11, 1232. https://doi.org/10.3390/w11061232
AMA Style
Shao J, Si B, Jin J. Rooting Depth and Extreme Precipitation Regulate Groundwater Recharge in the Thick Unsaturated Zone: A Case Study. Water. 2019; 11(6):1232. https://doi.org/10.3390/w11061232
Chicago/Turabian StyleShao, Jin, Bingcheng Si, and Jiming Jin. 2019. "Rooting Depth and Extreme Precipitation Regulate Groundwater Recharge in the Thick Unsaturated Zone: A Case Study" Water 11, no. 6: 1232. https://doi.org/10.3390/w11061232
Note that from the first issue of 2016, this journal uses article numbers instead of page numbers. See further details here.