Intense Chemical Weathering at Glacial Meltwater-Dominated Hailuogou Basin in the Southeastern Tibetan Plateau

 ,
,
Abstract
:1. Introduction
2. Materials and Methods
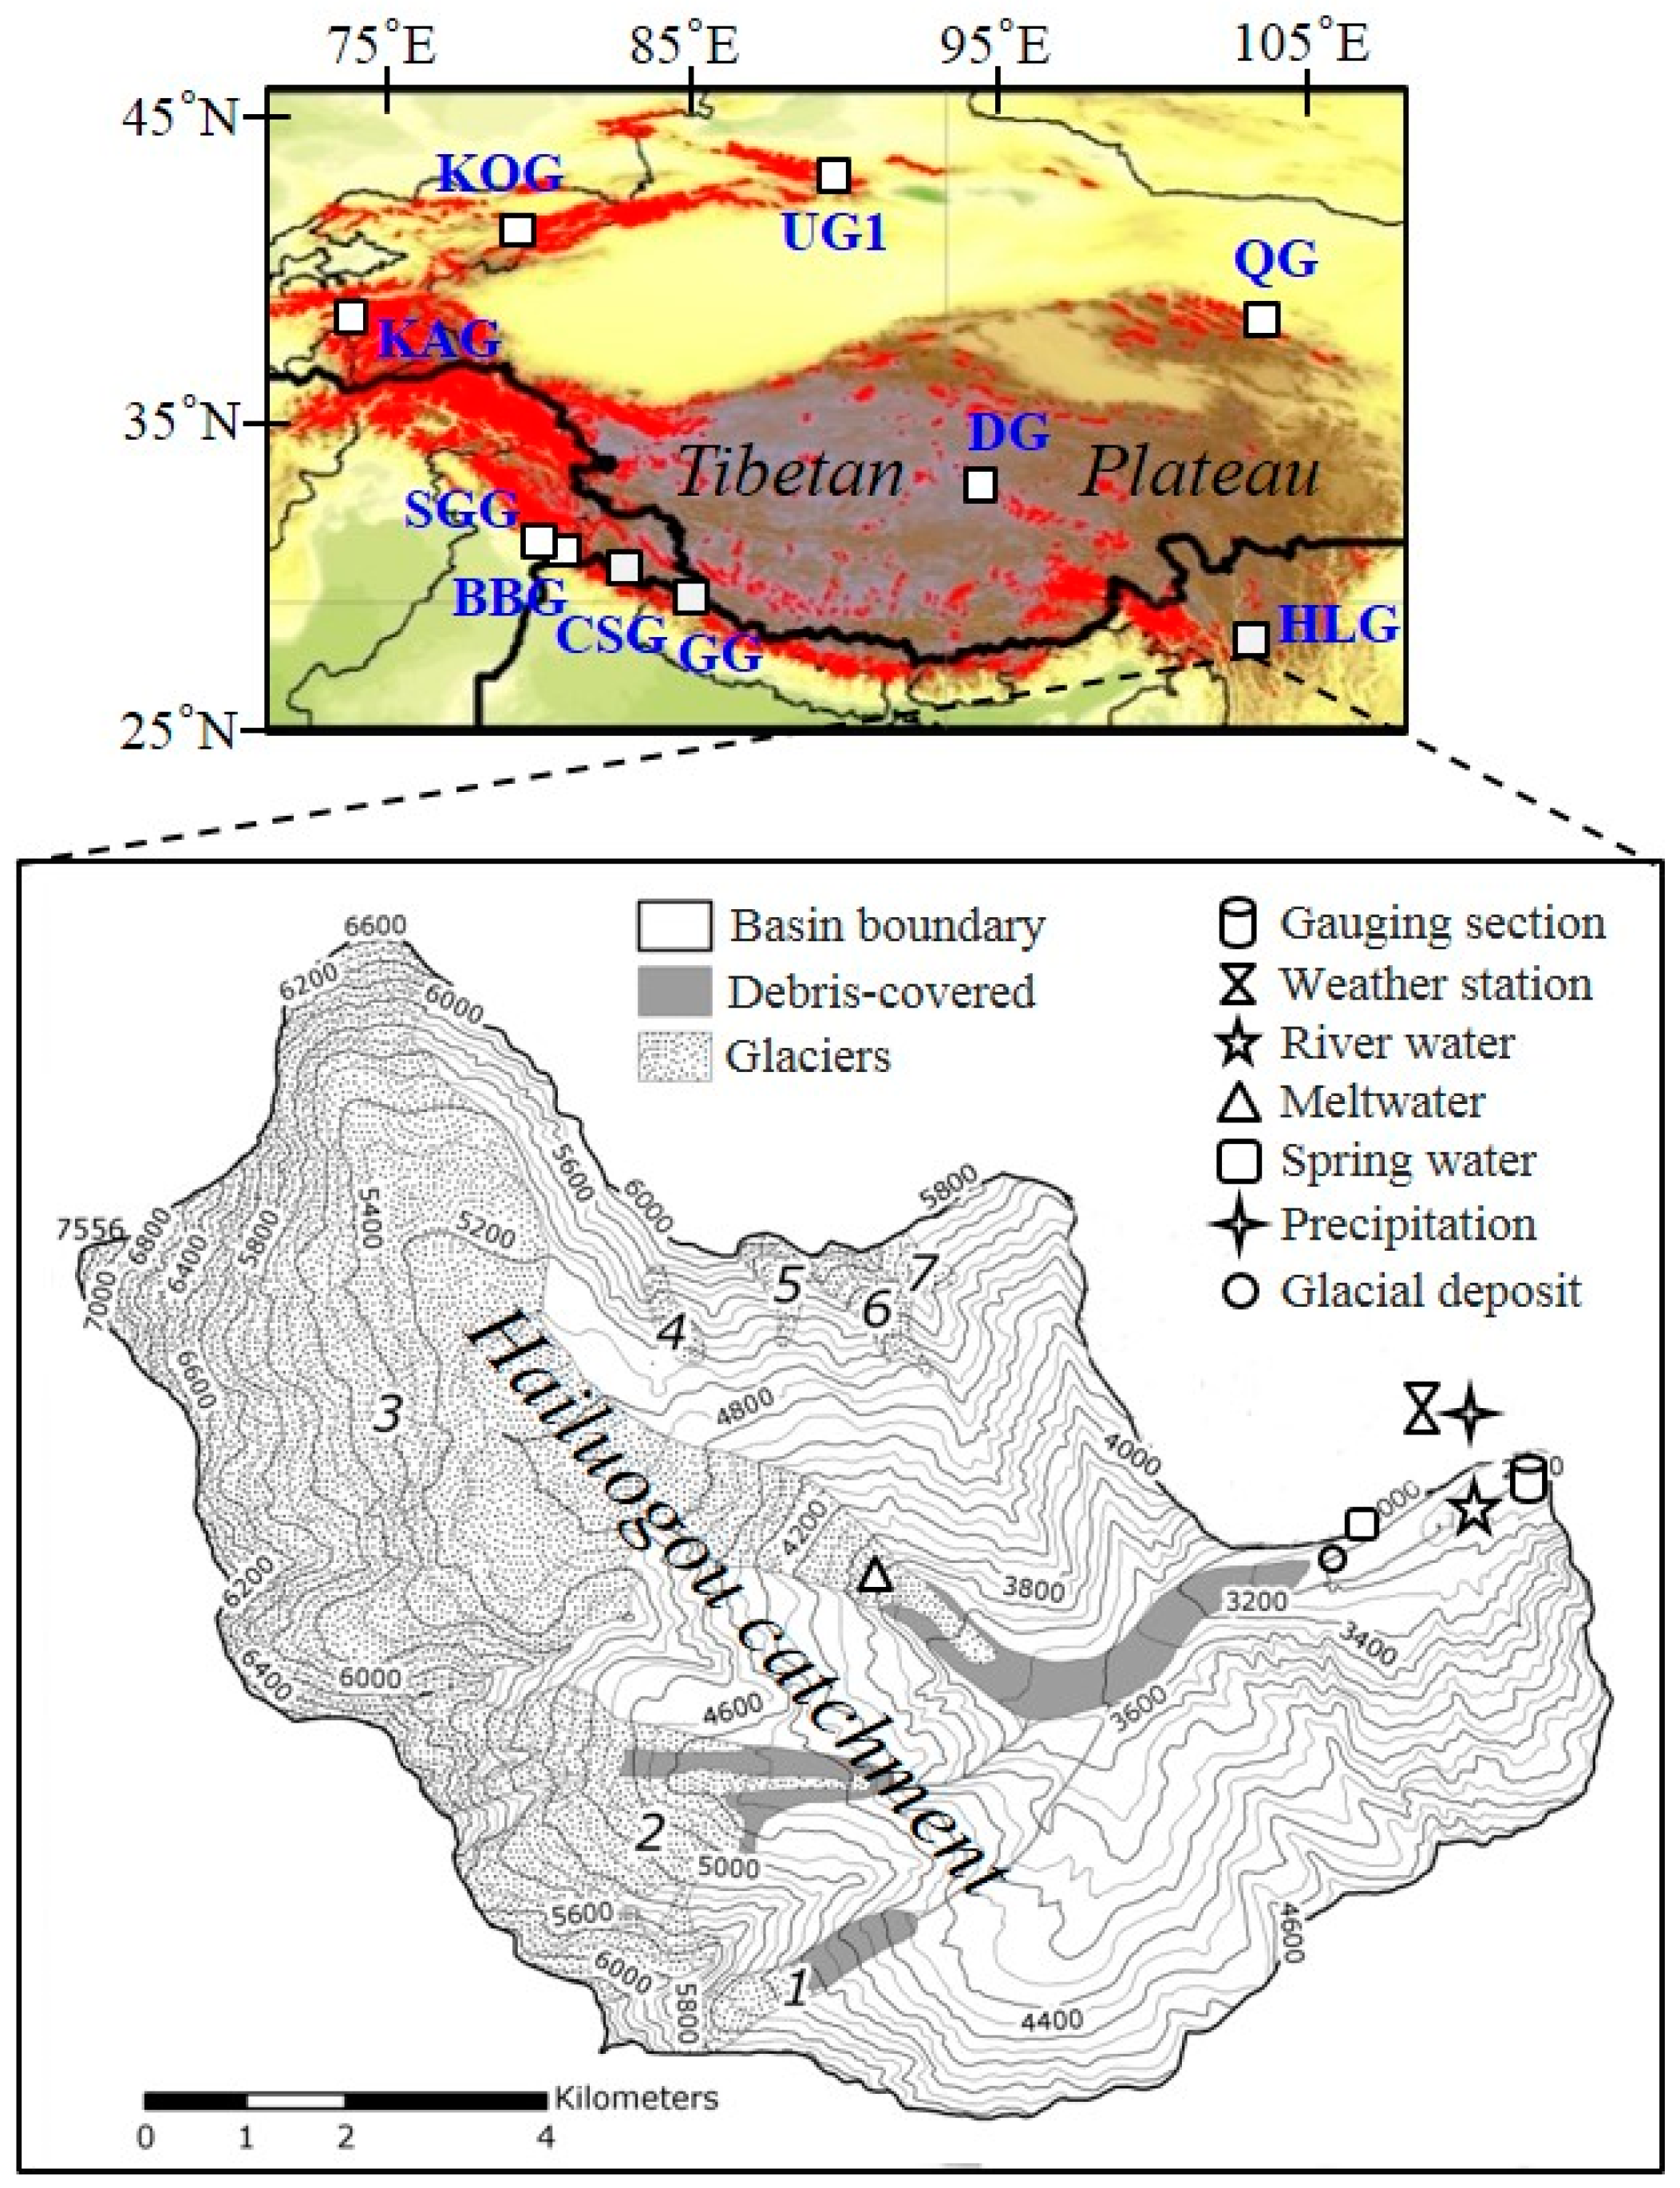
2.1. Study Area
2.2. Sample Collection
2.3. Laboratory Analysis
2.4. Water and Solute Flux Estimates
3. Results
4. Discussion
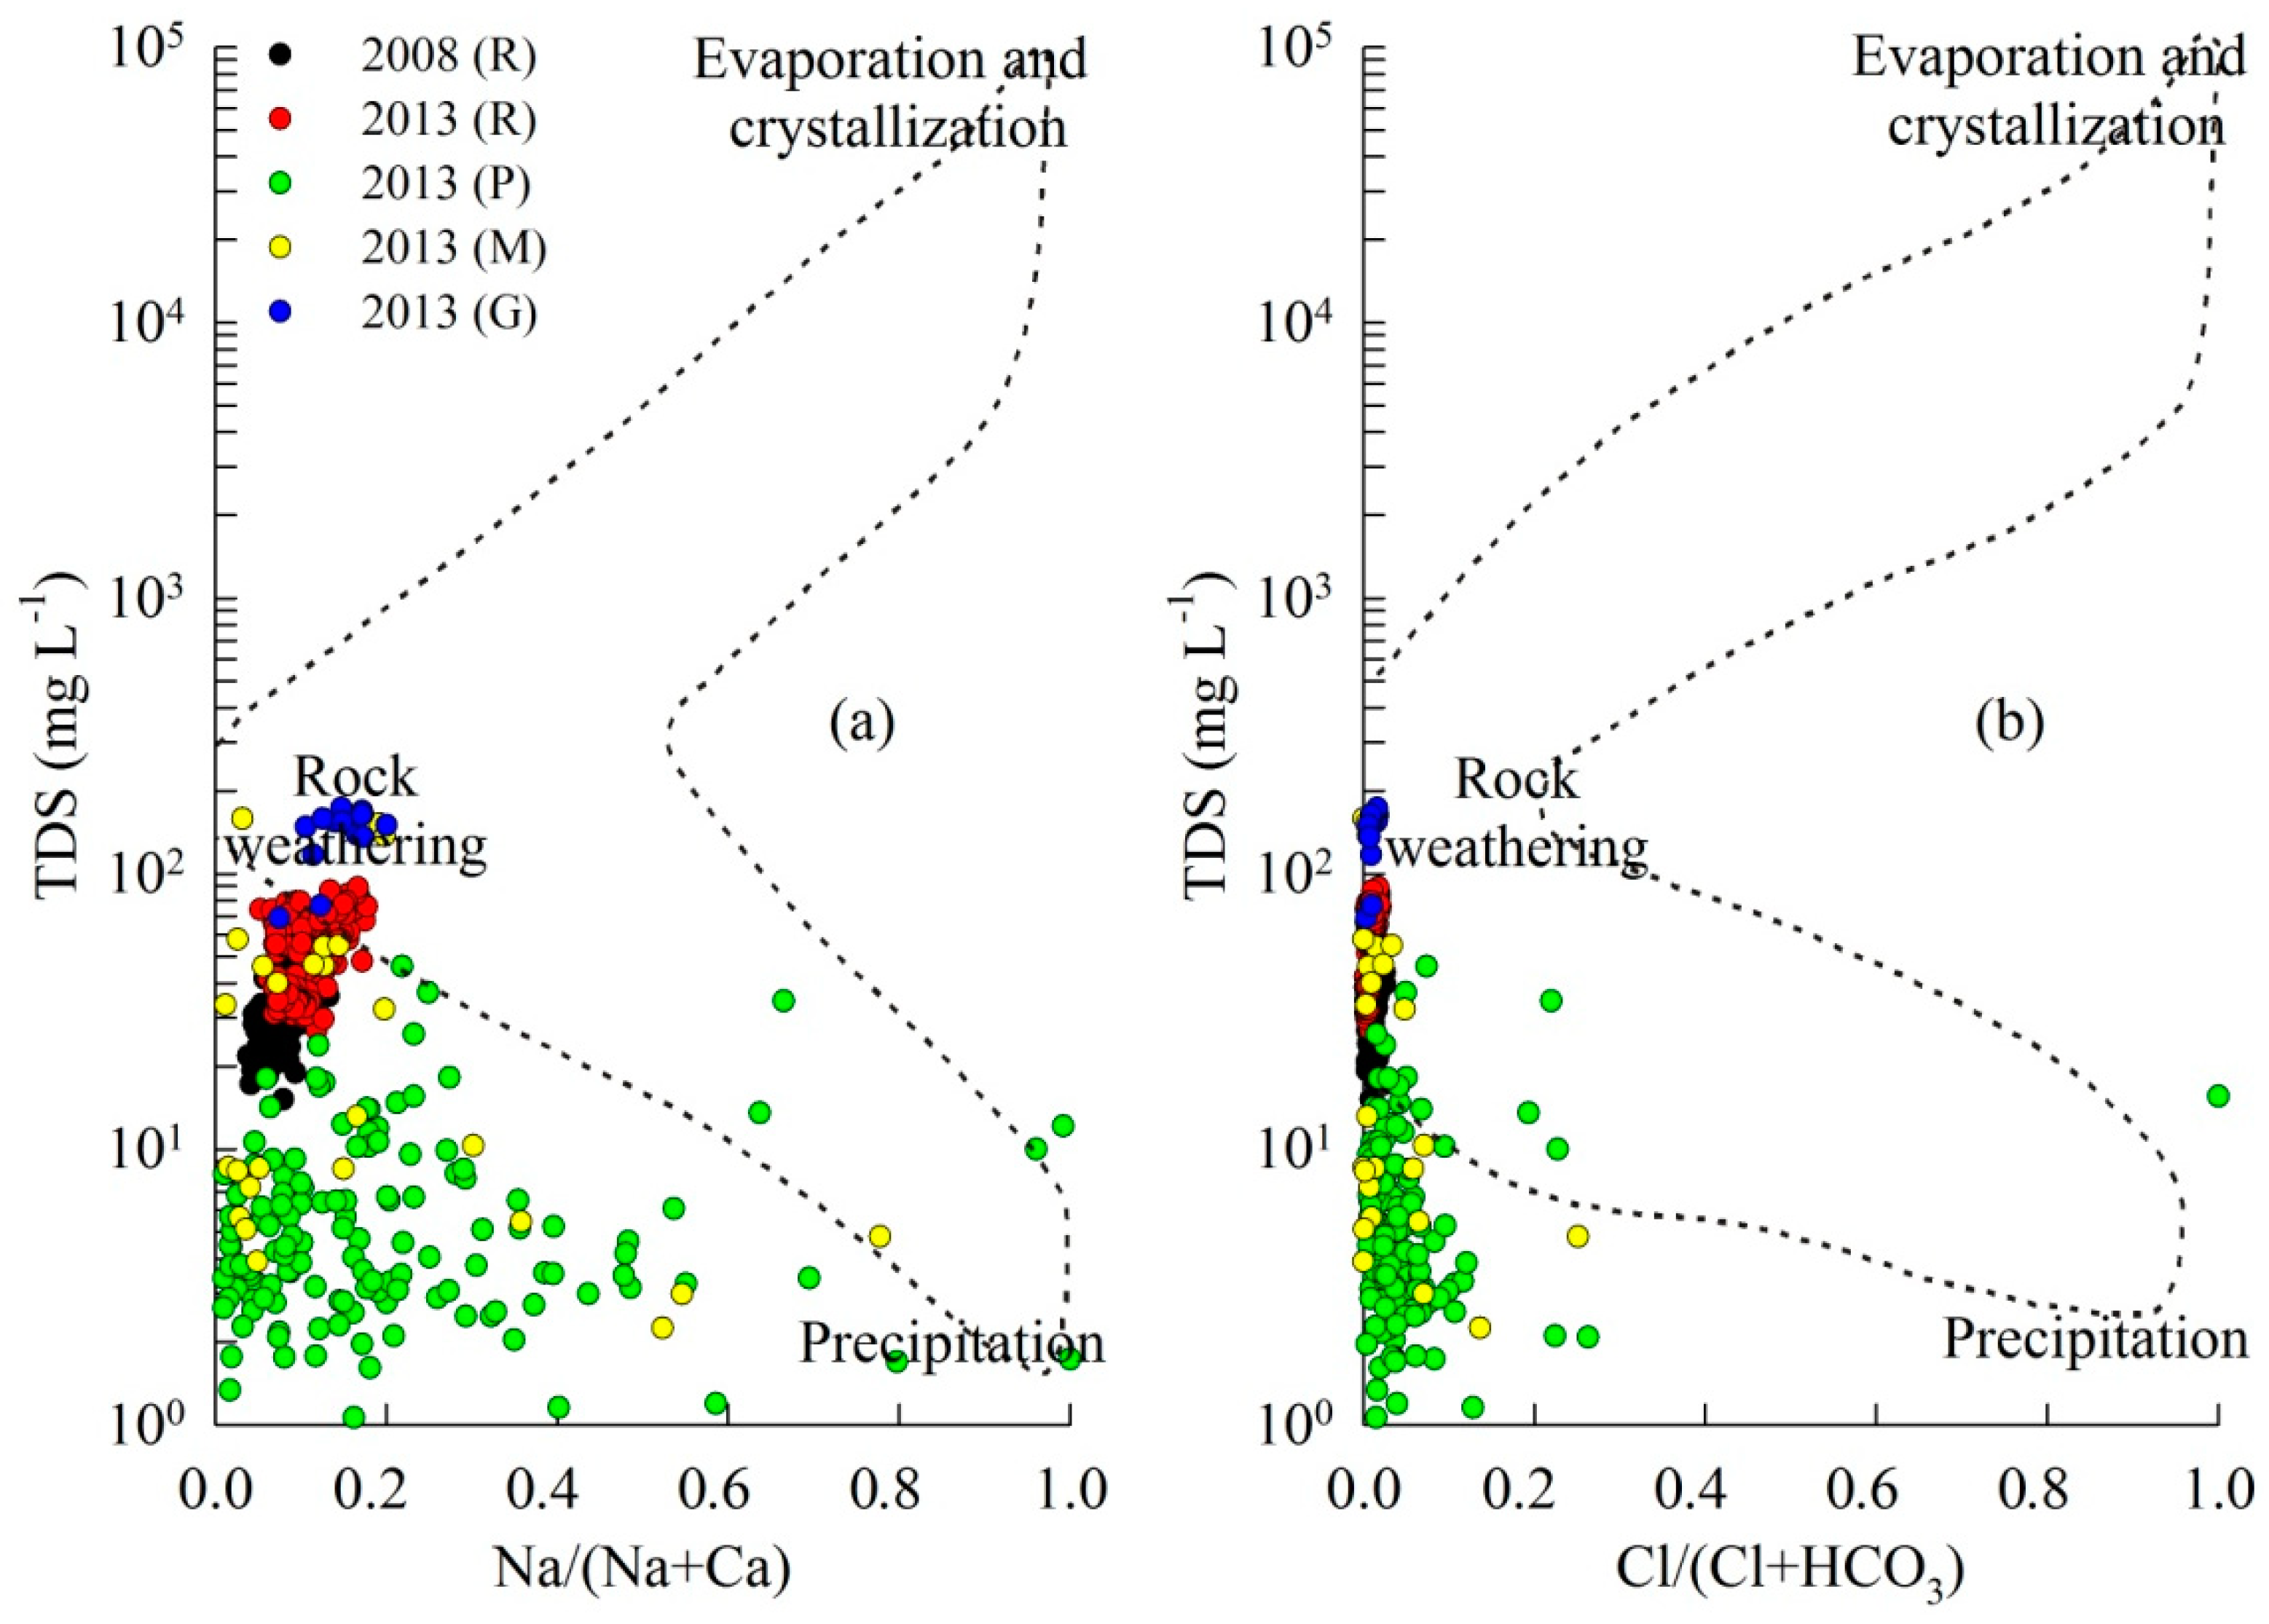
4.1. Controls on Runoff Chemistry
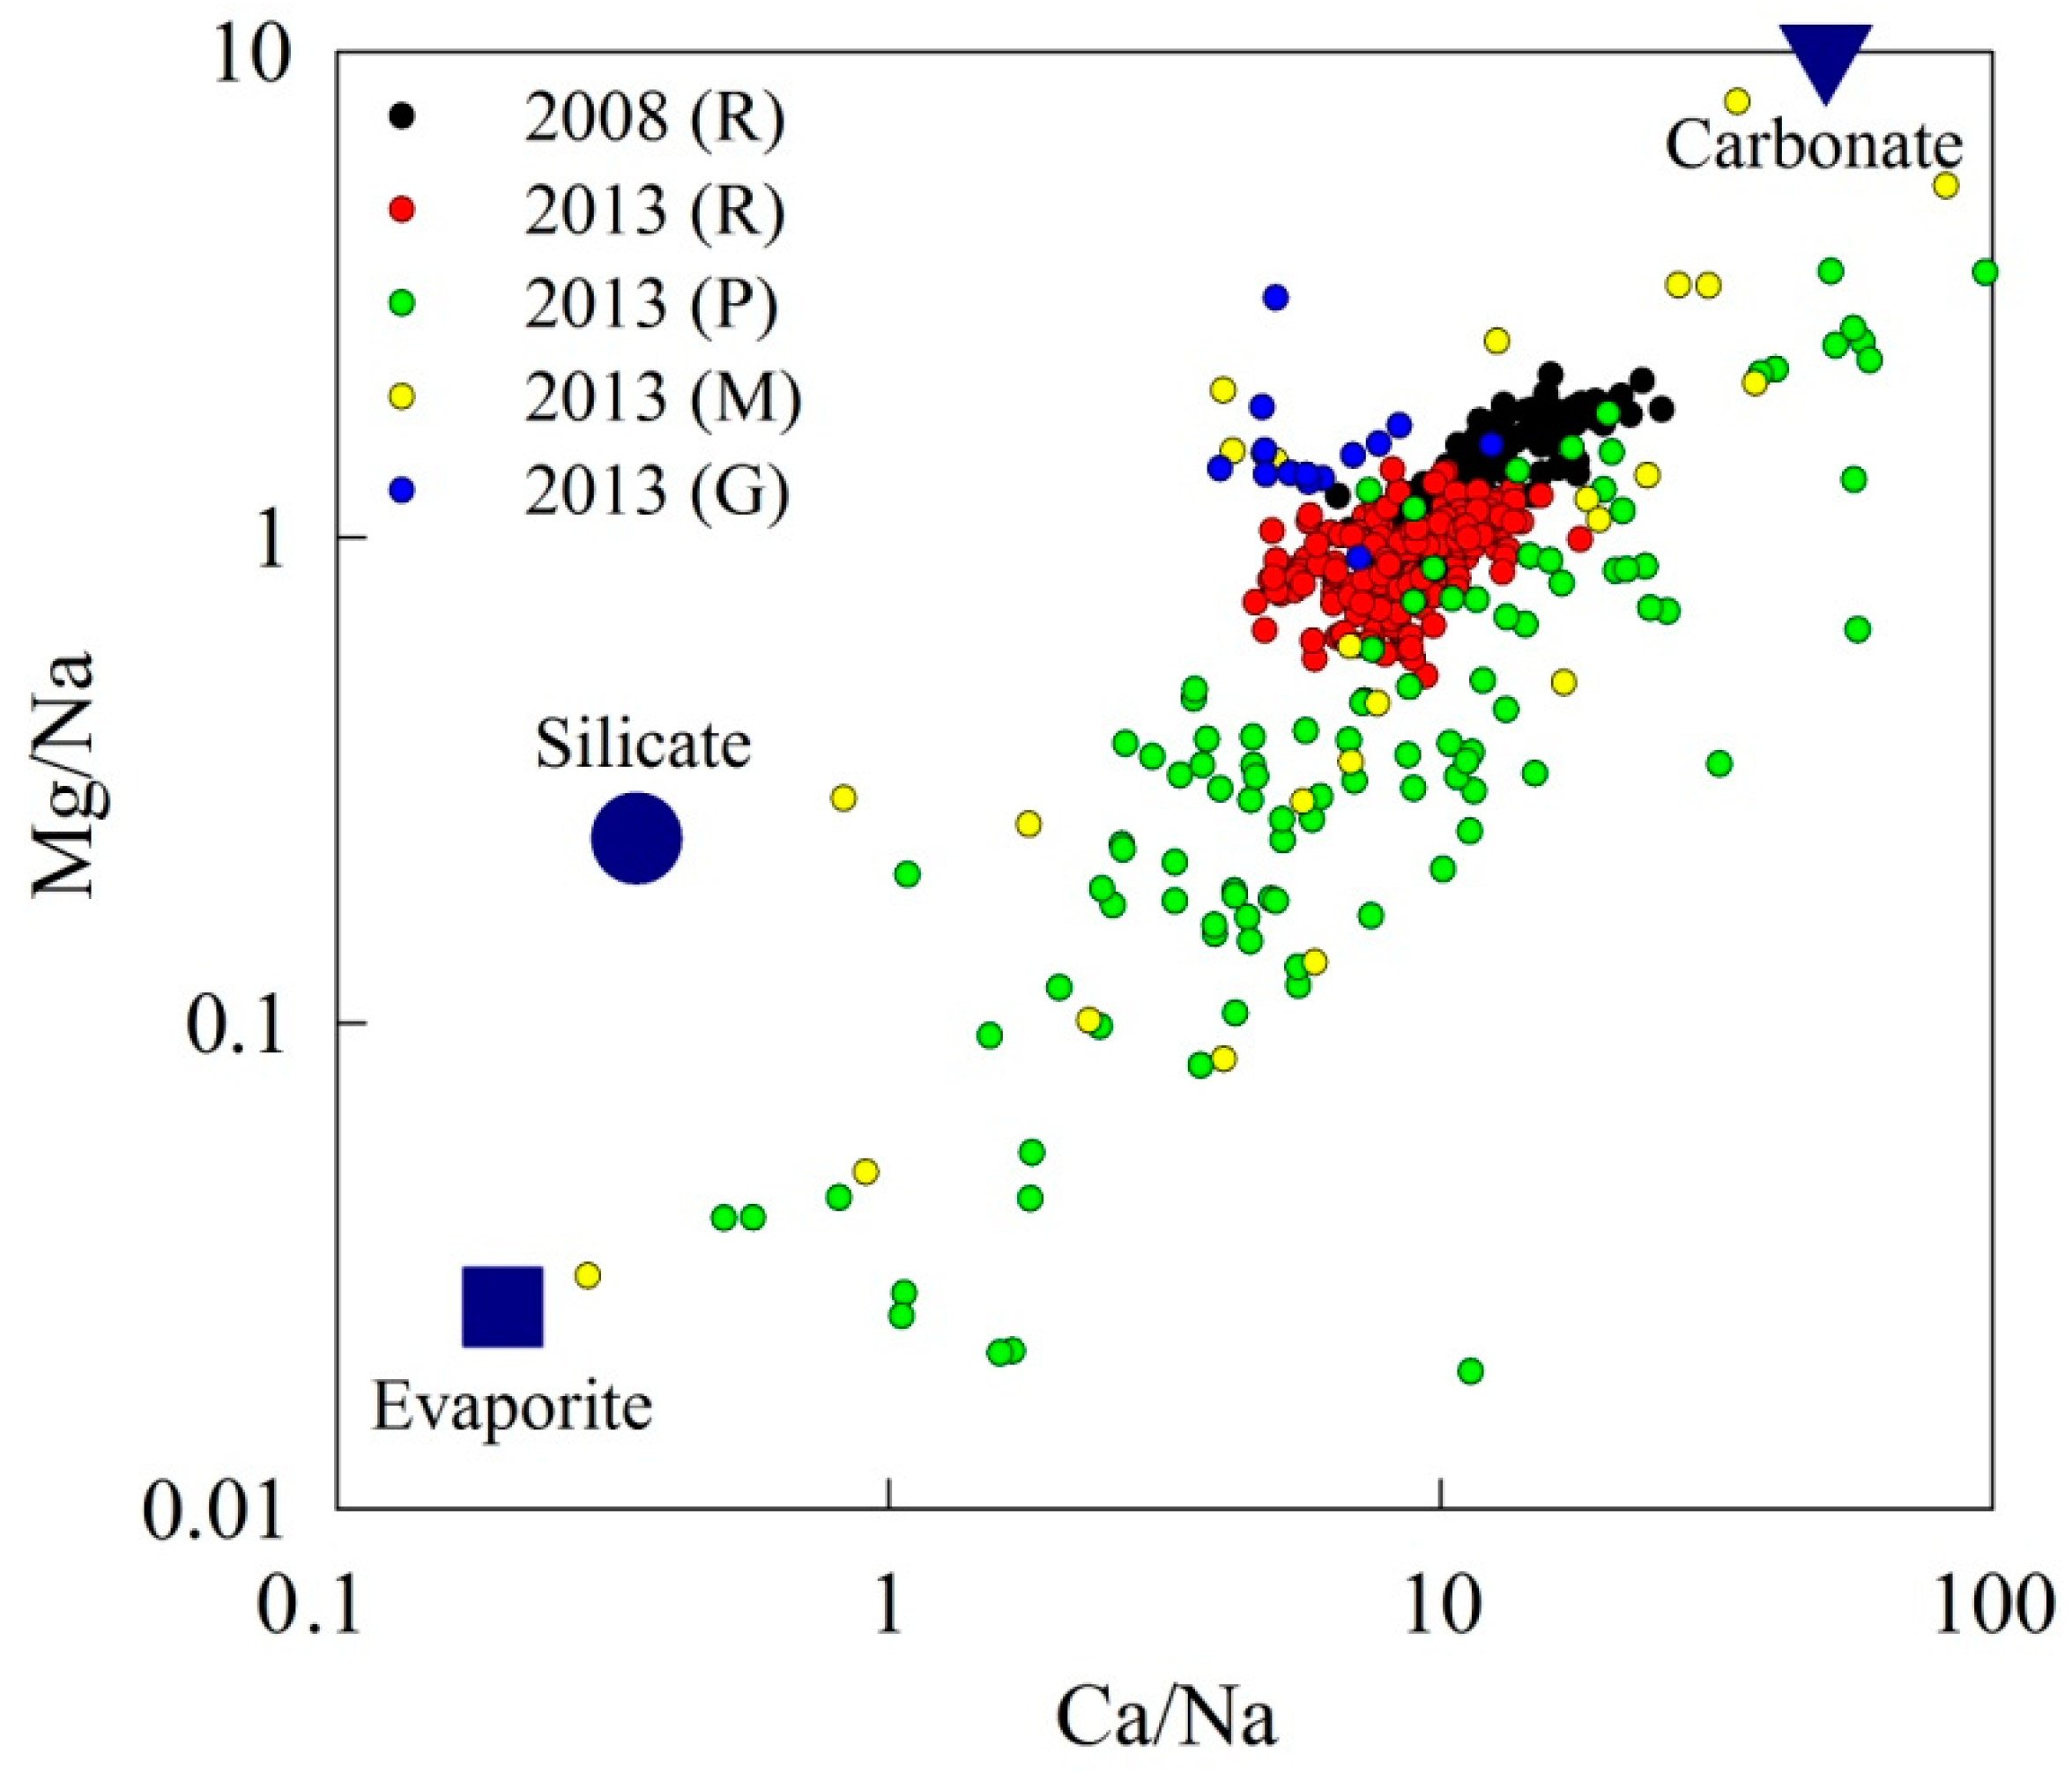
4.2. Chemical Weathering
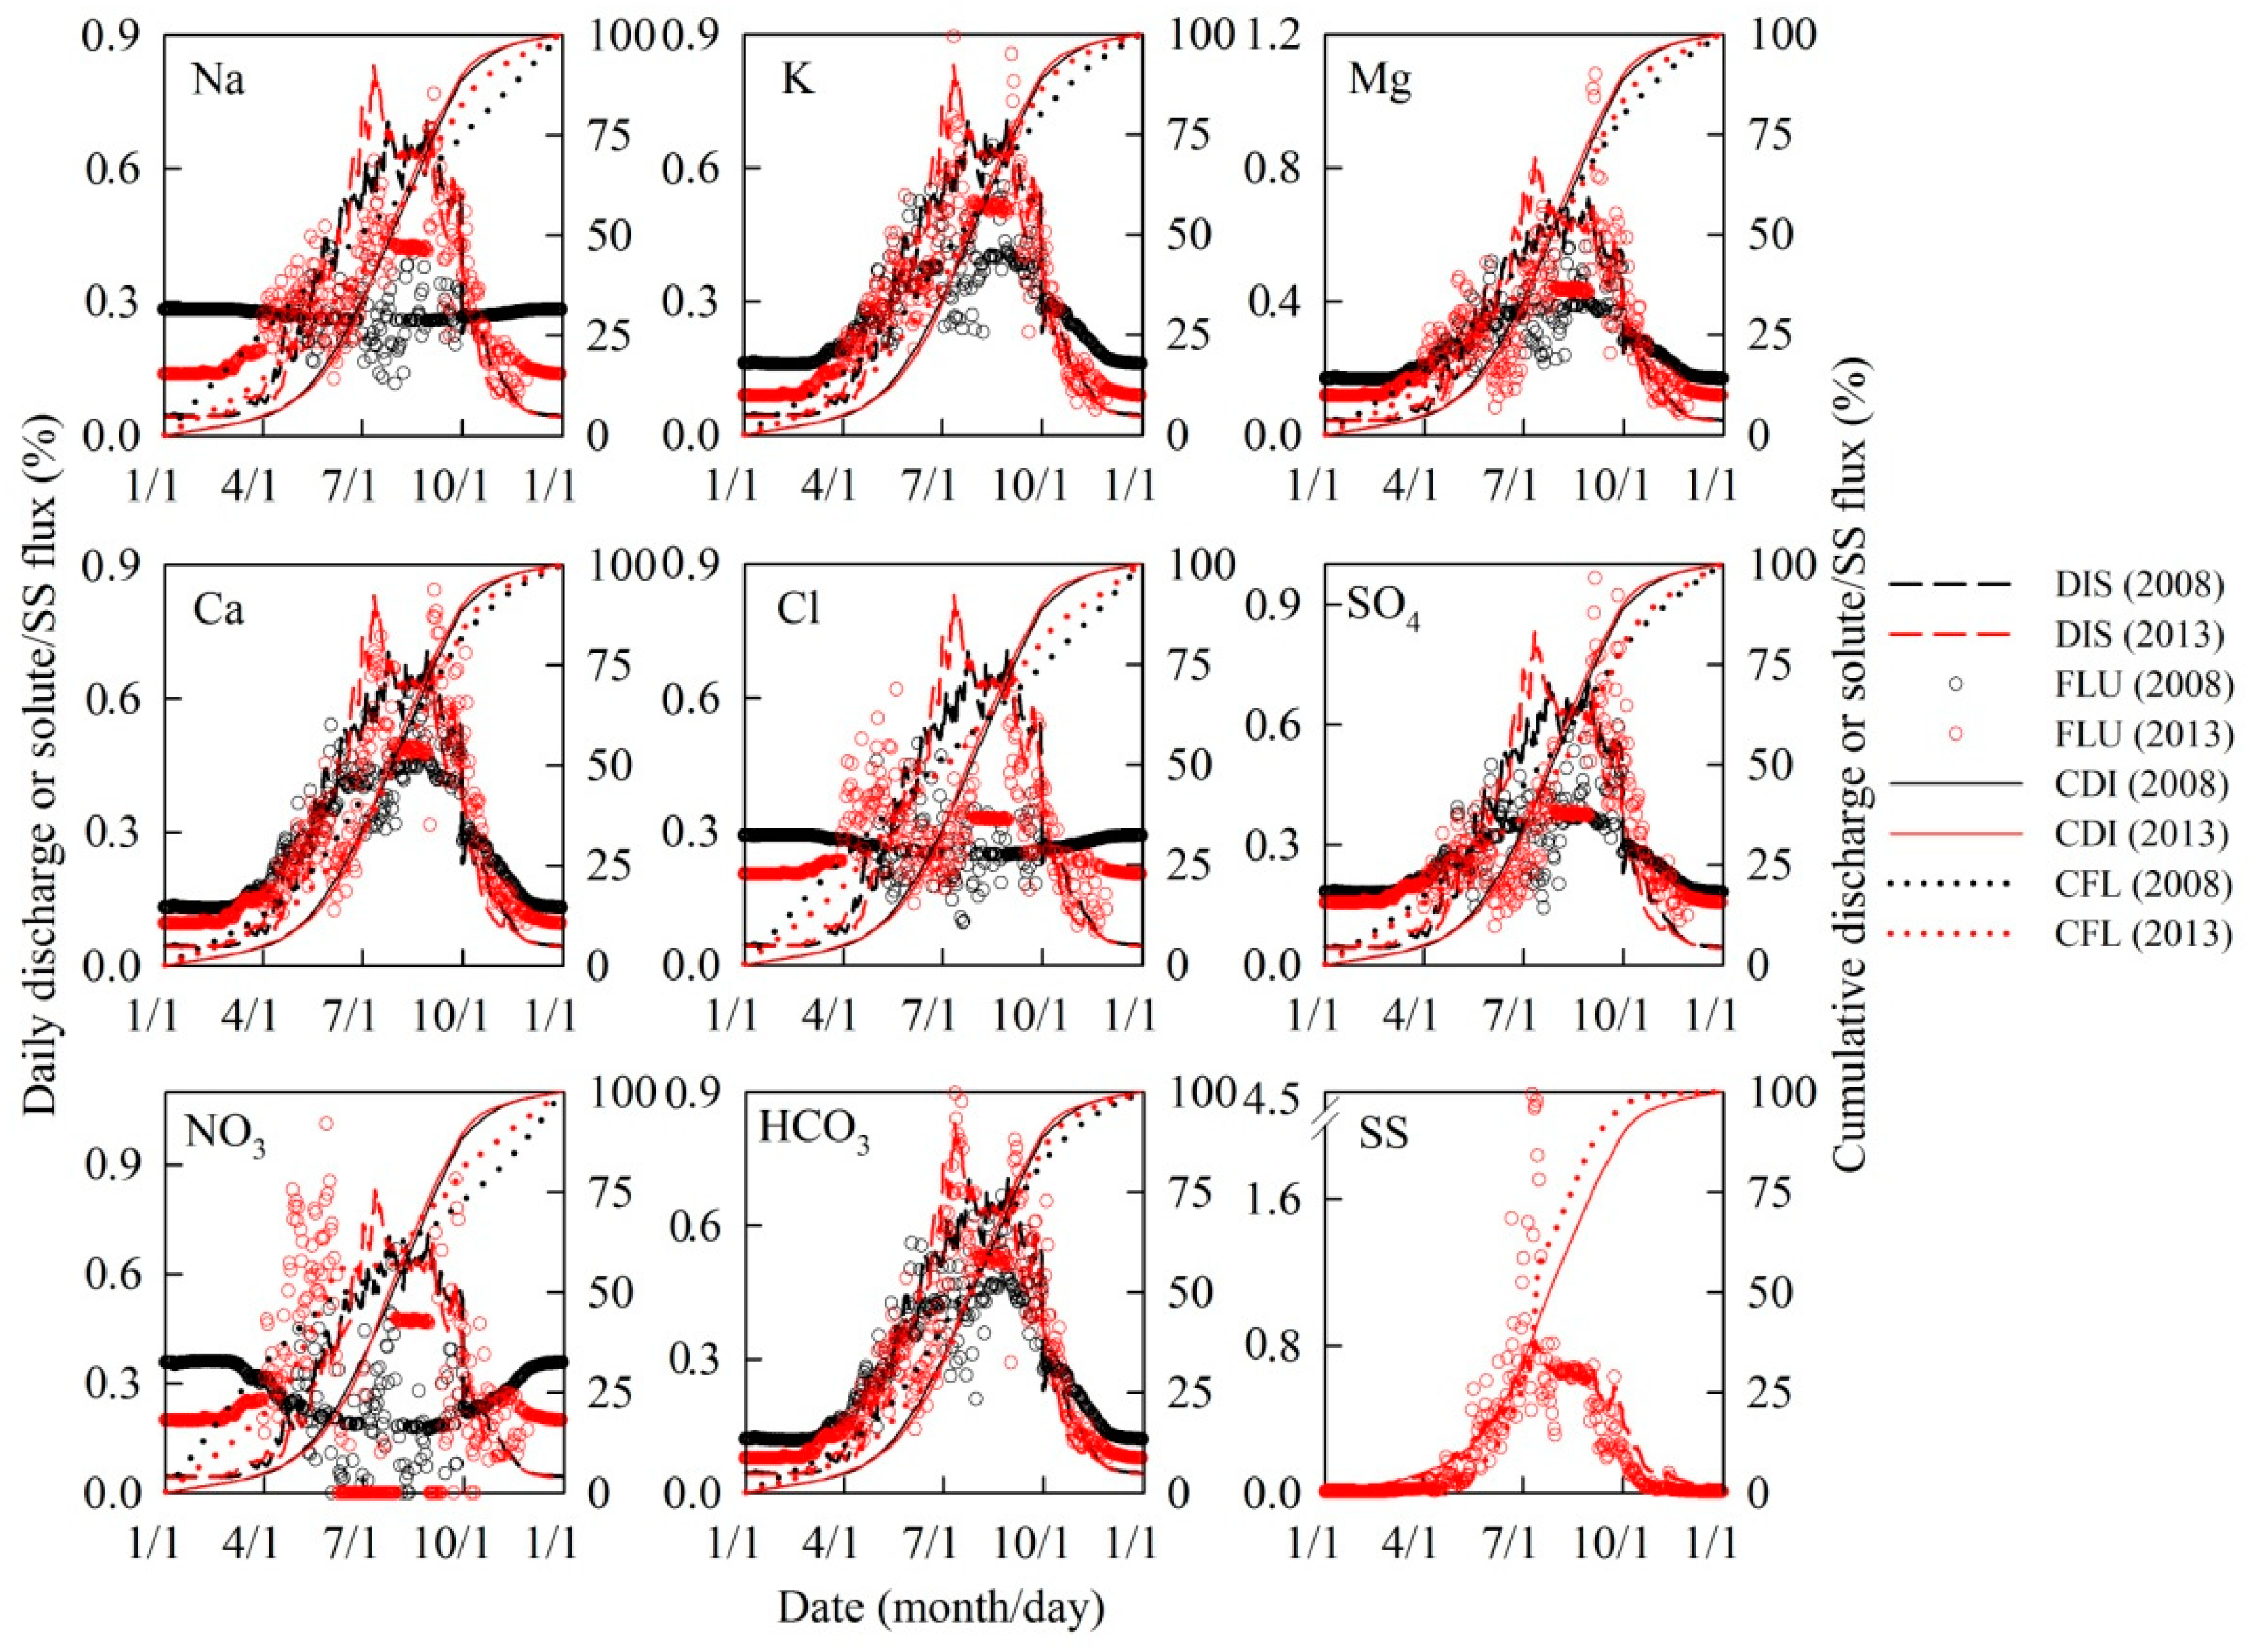
4.3. Solute/Sediment Export
5. Conclusions
Author Contributions
Funding
Acknowledgments
Conflicts of Interest
References
- Bolch, T.; Kulkarni, A.; Kääb, A.; Huggel, C.; Paul, F.; Cogley, G.; Frey, H.; Kargel, J.S.; Fujita, K.; Scheel, M.; et al. The state and fate of Himalayan glaciers. Science 2012, 336, 310–314. [Google Scholar] [CrossRef] [PubMed]
- Gardelle, J.; Berthier, E.; Arnaud, Y.; Kääb, A. Region-wide glacier mass balances over the Pamir-Karakoram-Himalaya during 1999–2011. Cryosphere 2013, 7, 1263–1286. [Google Scholar] [CrossRef]
- Immerzeel, W.W.; van Beek, L.P.H.; Bierkens, M.F.P. Climate change will affect the Asian water towers. Science 2010, 328, 1382–1385. [Google Scholar] [CrossRef] [PubMed]
- Kang, S.; Wang, F.; Morgenstern, U.; Zhang, Y.; Grigholm, B.; Kaspari, S.; Schwikowski, M.; Ren, J.; Yao, T.; Qin, D.; et al. Dramatic loss of glacier accumulation area on the Tibetan Plateau revealed by ice core tritium and mercury records. Cryosphere 2015, 9, 1213–1222. [Google Scholar] [CrossRef] [Green Version]
- Li, X.; Ding, Y.; Yu, Z.; Mika, S.; Liu, S.; Shangguan, D.; Lu, C. An 80-year summer temperature history from the Xiao Dongkemadi ice core in the central Tibetan Plateau and its association with atmospheric circulation. J. Asian Earth Sci. 2015, 98, 285–295. [Google Scholar] [CrossRef]
- Singh, D.; Swain, D.L.; Mankin, J.S.; Horton, D.E.; Thomas, L.N.; Rajaratnam, B.; Diffenbaugh, N.S. Recent amplification of the North American winter temperature dipole. J. Geophys. Res. Atmos. 2016, 121, 9911–9928. [Google Scholar] [CrossRef] [PubMed] [Green Version]
- Yang, K.; Wu, H.; Qin, J.; Lin, C.; Tang, W.; Chen, Y. Recent climate changes over the Tibetan Plateau and their impacts on energy and water cycle: A review. Glob. Planet. Chang. 2014, 112, 79–91. [Google Scholar] [CrossRef]
- Yao, T.; Thompson, L.G.; Yang, W.; Yu, W.; Gao, Y.; Gao, X.; Yang, X.; Duan, K.; Zhao, H.; Xu, B.; et al. Different glacier status with atmospheric circulations in TP and surroundings. Nat. Clim. Chang. 2012, 2, 663–667. [Google Scholar] [CrossRef]
- Zhang, Y.; Enomoto, H.; Ohata, T.; Kitabata, H.; Kadota, T.; Hirabayashi, Y. Glacier mass balance and its potential impacts in the Altai Mountains over the period 1990–2011. J. Hydrol. 2017, 553, 662–677. [Google Scholar] [CrossRef]
- Hawkings, J.R.; Wadham, J.L.; Benning, L.G.; Hendry, K.R.; Tranter, M.; Tedstone, A.; Nienow, P.; Raiswell, R. Ice sheets as a missing source of silica to the polar oceans. Nat. Commun. 2017, 8, 14198. [Google Scholar] [CrossRef]
- Hawkings, J.R.; Wadham, J.L.; Tranter, M.; Raiswell, R.; Benning, L.G.; Statham, P.J.; Tedstone, A.; Nienow, P.; Lee, K.; Telling, J. Ice sheets as a significant source of highly reactive nanoparticulate iron to the oceans. Nat. Commun. 2014, 5, 3929. [Google Scholar] [CrossRef]
- Hawkings, J.R.; Wadham, J.L.; Tranter, M.; Telling, J.; Bagshaw, E.; Beaton, A.; Simmons, S.-L.; Chandler, D.; Tedstone, A.; Nienow, P. The Greenland Ice Sheet as a hot spot of phosphorus weathering and export in the Arctic. Glob. Biogeochem. Cycles 2016, 30, 191–210. [Google Scholar] [CrossRef] [Green Version]
- Hood, E.; Battin, T.J.; Fellman, J.; O’Neel, S.; Spencer, R.G.M. Storage and release of organic carbon from glaciers and ice sheets. Nat. Geosci. 2015, 8, 91–96. [Google Scholar] [CrossRef]
- Li, X.; Ding, Y.; Xu, J.; He, X.; Han, T.; Kang, S.; Wu, Q.; Mika, S.; Yu, Z.; Li, Q. Importance of mountain glaciers as a source of dissolved organic carbon. J. Geophys. Res. Earth Surf. 2018, 123, 2123–2134. [Google Scholar] [CrossRef]
- Brown, G.H. Glacier meltwater hydrochemistry. Appl. Geochem. 2002, 17, 855–883. [Google Scholar] [CrossRef]
- Tranter, M.; Skidmore, M.; Wadham, J. Hydrological controls on microbial communities in subglacial environments. Hydrol. Process. 2005, 19, 995–998. [Google Scholar] [CrossRef]
- Wadham, J.L.; Bottrell, S.; Tranter, M.; Raiswell, R. Stable isotope evidence for microbial sulphate reduction at the bed of a polythermal high Arctic glacier. Earth Planet. Sci. Lett. 2004, 219, 341–355. [Google Scholar] [CrossRef]
- Fortner, S.K.; Mark, B.G.; McKenzie, J.M.; Bury, J.; Trierweiler, A.; Burns, P.J.; Munk, L.A. Elevated stream trace and minor element concentrations in the foreland of receding tropical glaciers. Appl. Geochem. 2011, 26, 1792–1801. [Google Scholar] [CrossRef]
- Li, X.; He, X.; Kang, S.; Mika, S.; Ding, Y.; Han, T.; Wu, Q.; Yu, Z.; Qin, D. Diurnal dynamics of minor and trace elements in stream water draining Dongkemadi Glacier on the Tibetan Plateau and its environmental implications. J. Hydrol. 2016, 541, 1104–1118. [Google Scholar] [CrossRef]
- Mitchell, A.; Brown, G.H. Diurnal hydrological-physicochemical controls and sampling methods for trace elements in an Alpine glacial hydrological system. J. Hydrol. 2007, 332, 123–143. [Google Scholar] [CrossRef]
- Qu, B.; Zhang, Y.; Kang, S.; Sillanpää, M. Water quality in the Tibetan Plateau: Major ions and trace elements in rivers of the “Water Tower of Asia”. Sci. Total Environ. 2019, 649, 571–581. [Google Scholar] [CrossRef]
- Zhao, H.; Yao, T.; Xu, B. Preliminary results on hydrological and hydrochemical features of Kartamak Glacier area in Mt. Muztag Ata. J. Mt. Sci. 2007, 4, 77–85. [Google Scholar] [CrossRef]
- Liu, F.; Williams, M.W.; Sun, J.; Zhu, S.; Hood, E.; Cheng, G. Hydrochemical process and hydrological separation at the headwaters of the Urumqi River, Tianshan Mountains, China. J. Glaciol. Geocryol. 1999, 21, 362–370. [Google Scholar]
- Li, C.; Hou, S.; Qin, D. Spatial differences of hydrochemical and its control factors of the headwater runoff in the Urumqi River, Tianshan Mountains. J. Glaciol. Geocryol. 2003, 25, 72–76. [Google Scholar]
- Wang, J.; Ding, Y.; Xu, J.; Han, H. Hydrochemical characteristic analysis of melting water flow in Koxkar Glacier, Tianshan (West) Mountains. Environ. Sci. 2006, 27, 1305–1311. [Google Scholar]
- Li, X.; Qin, D.; Jing, Z.; Li, Y.; Wang, N. Diurnal hydrological controls and non-filtration effects on minor and trace elements in stream water draining the Qiyi Glacier, Qilian Mountain. Sci. China Earth Sci. 2013, 56, 81–92. [Google Scholar] [CrossRef]
- Wang, J.; Aihemaiti, A.; Ding, Y.; Liu, S.; Wu, J. Variations of pH value and electrical conductivity in the Dongkemadi basin, Tanggula Range. Environ. Sci. 2007, 28, 2031–2037. [Google Scholar]
- Brown, G.H.; Sharp, M.; Tranter, M.; Gurnell, A.M.; Nienow, P. Impact of post mixing chemical reactions on the major ion chemistry of bulk meltwaters draining the Haut Glacier d’Arolla, Valais, Switzerland. Hydrol. Process. 1994, 8, 465–480. [Google Scholar] [CrossRef]
- Tranter, M.; Brown, G.H.; Raiswell, R.; Sharp, M.; Gurnell, A. A conceptual model of solute aqusistion by Alpine glacial meltwaters. J. Glaciol. 1993, 39, 573–581. [Google Scholar] [CrossRef]
- Hasnain, S.I.; Subramanian, V.; Dhanpal, K. Chemical characteristics and suspended sediment load of meltwaters from a Himalayan glacier in India. J. Hydrol. 1989, 106, 99–108. [Google Scholar] [CrossRef]
- Kumar, R.; Kumar, R.; Singh, A.; Singh, S.; Bhardwaj, A.; Kumari, A.; Sinha, R.K. Hydro-geochemical analysis of meltwater draining from Bilare Banga glacier, Western Himalaya. Acta Geophys. 2019, 67, 651–660. [Google Scholar] [CrossRef]
- Wu, X.; Li, Q.; Song, G.; He, J.; Jiang, X. Hydrochemical characteristics and evolution of runoff at Qiyi Glacier, Qilian Mts. Environ. Sci. 2008, 29, 613–618. [Google Scholar]
- Wu, X.; Wang, N.; Li, Q. Diurnal variation of meltwater chemistry in the Qiyi Glacier during the late ablation period. J. Glaciol. Geocryol. 2009, 31, 1080–1085. [Google Scholar]
- Ahmad, S.; Hasnain, S.I. Chemical characteristics of stream draining from Dudu Glacier: An alpine meltwater stream in Ganga Headwater, Garhwal Himalaya. J. China Univ. Geosci. 2001, 12, 75–83. [Google Scholar]
- Hasnain, S.I.; Thayyen, R.J. Controls on the major-ion chemistry of the Dokriani glacier meltwaters, Ganga basin, Garhwal Himalaya, India. J. Glaciol. 1999, 45, 87–92. [Google Scholar] [CrossRef]
- Kumar, R.; Kumar, R.; Singh, S.; Singh, A.; Bhardwaj, A.; Kumari, A.; Randhawa, S.S.; Saha, A. Dynamics of suspended sediment load with respect to summer discharge and temperatures in Shaune Garang glacierized catchment, Western Himalaya. Acta Geophys. 2018, 67, 1109–1120. [Google Scholar] [CrossRef]
- Kumar, A.; Verma, A.; Gokhale, A.A.; Bhambri, R.; Misra, A.; Sundriyal, S.; Dobhal, D.P.; Kishore, N. Hydrometeorological assessments and suspended sediment delivery from a central Himalayan glacier in the upper Ganga basin. Int. J. Sediment Res. 2018, 33, 493–509. [Google Scholar] [CrossRef]
- Kumar, A.; Bhambri, R.; Tiwari, S.K.; Verma, A.; Gupta, A.K.; Kawishwar, P. Evolution of debris flow and moraine failure in the Gangotri Glacier region, Garhwal Himalaya: Hydro-geomorphological aspects. Geomorphology 2019, 333, 152–166. [Google Scholar] [CrossRef]
- Zhang, Y.; Hirabayashi, Y.; Liu, Q.; Liu, S. Glacier runoff and its impact in a highly glacierized catchment in the southeastern Tibetan Plateau: Past and future trends. J. Glaciol. 2015, 61, 713–730. [Google Scholar] [CrossRef]
- Zhang, Y.; Hirabayashi, Y.; Liu, S. Catchment-scale reconstruction of glacier mass balance using observations and global climate data: Case study of the Hailuogou basin, south-eastern Tibetan Plateau. J. Hydrol. 2012, 444–445, 146–160. [Google Scholar] [CrossRef]
- Zhang, Y.; Fujita, K.; Liu, S.; Liu, Q.; Nuimura, T. Distribution of debris thickness and its effect on ice melt at Hailuogou Glacier, southeastern Tibetan Plateau, using in situ surveys and ASTER imagery. J. Glaciol. 2011, 57, 1147–1157. [Google Scholar] [CrossRef]
- Liu, Q.; Liu, S.; Zhang, Y.; Wang, X.; Zhang, Y.; Guo, W.; Xu, J. Recent shrinkage and hydrological response of Hailuogou glacier, a monsoon temperate glacier on the east slope of Mount Gongga, China. J. Glaciol. 2010, 56, 215–224. [Google Scholar] [CrossRef] [Green Version]
- Lü, R. The physiognomy and ecological and environmental resources in Hailuogou catchment. Res. Trends Ecol. Environ. Netw. 1996, 7, 32–39. [Google Scholar]
- Liu, G.; Zhang, Y.; Fu, H.; Chen, Y.; Shi, L. Sedimentary characteristics and subglacial processes of the glacial deposits in Hailuogou Glacier, Gongga Mountain. J. Glaciol. Geocryol. 2009, 31, 68–74. [Google Scholar]
- Deuerling, K.M.; Martin, J.B.; Martin, E.E.; Scribner, C.A. Hydrologic exchange and chemical weathering in a proglacial watershed near Kangerlussuaq, west Greenland. J. Hydrol. 2018, 556, 220–232. [Google Scholar] [CrossRef]
- Scribner, C.A.; Martin, E.E.; Martin, J.B.; Deuerling, K.M.; Collazo, D.F.; Marshall, A.T. Exposure age and climate controls on weathering in deglaciated watersheds of western Greenland. Geochim. Cosmochim. Acta 2015, 170, 157–172. [Google Scholar] [CrossRef]
- Tranter, M. Geochemical Weathering in Glacial and Proglacial Environments; Drever, I.J., Ed.; Elsevier: Amsterdam, The Netherlands, 2003; pp. 189–205. [Google Scholar]
- Ter Braak, C.J.F.; Smilauer, P. CANOCO Reference Manual and CanoDraw for Windows User’s Guide; Software for Canonical Community Ordination Version 4.5.; Biometris; Wageningen and Ceske Budejovice: Ithaca, NY, USA, 2002. [Google Scholar]
- Soil Conservation Service (SCS). Hydrology. In National Engineering Handbook; Soil Conservation Service; US Department of Agriculture: Washington, DC, USA, 1972. [Google Scholar]
- Moriasi, D.N.; Arnold, J.; Liew, M.W.; Bingner, R.L.; Harmel, R.D.; Veith, T.L. Model evaluation guidelines for systematic quantification of accuracy in watershed simulations. Trans. Am. Soc. Agric. Biol. Eng. 2007, 50, 885–900. [Google Scholar]
- Feng, F.; Li, Z.; Jin, S.; Dong, Z.; Wang, F. Hydrochemical characteristics and solute dynamics of meltwater runoff of Urumqi Glacier No.1, eastern Tianshan, northwest China. J. Mt. Sci. 2012, 9, 472–482. [Google Scholar] [CrossRef]
- Singh, V.B.; Ramanathan, A.L.; Pottakkal, J.G.; Kumar, M. Seasonal variation of the solute and suspended sediment load in Gangotri glacier meltwater, central Himalaya, India. J. Asian Earth Sci. 2014, 79, 224–234. [Google Scholar] [CrossRef]
- Singh, V.B.; Ramanathan, A.L. Hydrogeochemistry of the Chhota Shigri glacier meltwater, Chandra basin, Himachal Pradesh, India: Solute acquisition processes, dissolved load and chemical weathering rates. Environ. Earth Sci. 2017, 76, 223. [Google Scholar] [CrossRef]
- Mitchell, A.C.; Brown, G.H.; Fuge, R. Minor and trace element export from a glacierized Alpine headwater basin (Haut Glacier d’Arolla, Switzerland). Hydrol. Process. 2001, 15, 3499–3524. [Google Scholar] [CrossRef]
- Brown, G.H.; Tranter, M.; Sharp, M. Subglacial chemical erosion-seasonal variations in solute provenance, Haut Glacier d’Arolla, Switzerland. Ann. Glaciol. 1996, 22, 25–31. [Google Scholar] [CrossRef]
- Hodson, A.J.; Tranter, M.; Vatne, G. Contemporary rates of chemical denudation and atmospheric CO2 sequestration in glacier basins: An Arctic perspective. Earth Surf. Proc. Land. 2000, 25, 1447–1471. [Google Scholar] [CrossRef]
- Tranter, M.; Huybrechts, P.; Munhoven, G.; Sharp, M.; Brown, G.H.; Jones, I.W.; Hodson, A.J.; Hodgkins, R.; Wadhama, J.L. Direct effect of ice sheets on terrestrial bicarbonate, sulphate and base cation fluxes during the last glacial cycle: Minimal impact on atmospheric CO2 concentrations. Chem. Geol. 2002, 190, 33–44. [Google Scholar] [CrossRef]
- Yde, J.C.; Riger-Kusk, M.; Christiansen, H.H.; Knudsen, N.T.; Humlum, O. Hydrochemical characteristics of bulk meltwater from an entire ablation season, Longyearbreen, Svalbard. J. Glaciol. 2008, 54, 259–272. [Google Scholar] [CrossRef] [Green Version]
- Sharp, M.; Tranter, M.; Brown, G.H.; Skidmore, M. Rates of chemical denudation and CO2 drawdown in a glacier-covered alpine basin. Geology 1995, 23, 61–64. [Google Scholar] [CrossRef]
- Williams, M.W.; Yang, D.; Liu, F.; Turk, J.; Melack, J.M. Controls on the major ion chemistry of the Urumqi River, Tian shan, People’s Republic of China. J. Hydrol. 1995, 172, 209–229. [Google Scholar] [CrossRef]
- Wang, S.; Shi, X.; Cao, W.; Pu, T. Seasonal variability and evolution of glaciochemistry at an alpine temperate glacier on the southeastern Tibetan Plateau. Water 2018, 10, 114. [Google Scholar] [CrossRef]
- Gaillardet, J.; Dupré, B.; Louvat, P.; Allègre, C.J. Global silicate weathering and CO2 consumption rates deduced from the chemistry of large rivers. Chem. Geol. 1999, 159, 3–30. [Google Scholar] [CrossRef]
- Yde, J.C.; Knudsen, N.T.; Hasholt, B.; Mikkelsen, A.B. Meltwater chemistry and solute export from a Greenland Ice Sheet catchment, Watson River, West Greenland. J. Hydrol. 2014, 519, 2165–2179. [Google Scholar] [CrossRef]
- Bhatia, M.P.; Kujawinski, E.B.; Das, S.B.; Breier, C.F.; Henderson, P.B.; Charette, M.A. Greenland meltwater as a significant and potentially bioavailable source of iron to the ocean. Nat. Geosci. 2013, 6, 274–278. [Google Scholar] [CrossRef]
- Tranter, M.; Sharp, M.J.; Lamb, H.R.; Brown, G.H.; Hubbard, B.P.; Willis, I.C. Geochemical weathering at the bed of Haut Glacier d’Arolla, Switzerland—A new model. Hydrol. Process. 2002, 16, 959–993. [Google Scholar] [CrossRef]
- Hodson, A.; Porter, P.; Lowe, A.; Mumford, P. Chemical denudation and silicate weathering in Himalayan glacier basins: Batura Glacier, Pakistan. J. Hydrol. 2002, 262, 193–208. [Google Scholar] [CrossRef]
- Wadham, J.L.; Tranter, M.; Skidmore, M.; Hodson, A.J.; Priscu, J.; Lyons, W.B.; Sharp, M.; Wynn, P.; Jackson, M. Biogeochemical weathering under ice: Size matters. Glob. Biogeochem. Cycles 2010, 24. [Google Scholar] [CrossRef] [Green Version]
- Hatton, J.E.; Hendry, K.R.; Hawkings, J.R.; Wadham, J.L.; Kohler, T.J.; Stibal, M.; Beaton, A.D.; Bagshaw, E.A.; Telling, J. Investigation of subglacial weathering under the Greenland Ice Sheet using silicon isotopes. Geochim. Cosmochim. Acta 2019, 247, 191–206. [Google Scholar] [CrossRef] [Green Version]
- Reynolds, R.C.; Johnson, N.M. Chemical weathering in the temperate glacial environment of the Northern Cascade Mountains. Geochim. Cosmochim. Acta 1972, 36, 537–554. [Google Scholar] [CrossRef]
- Yde, J.C.; Knudsen, N.T. The importance of oxygen isotope provenance in relation to solute content of bulk meltwaters at Imersuaq Glacier, West Greenland. Hydrol. Process. 2004, 18, 125–139. [Google Scholar] [CrossRef]
- Yde, J.C.; Knudsen, N.T.; Nielsen, O.B. Glacier hydrochemistry, solute provenance, and chemical denudation at a surge-type glacier in Kuannersuit Kuussuat, Disko Island, West Greenland. J. Hydrol. 2005, 300, 172–187. [Google Scholar] [CrossRef]
- Stibal, M.; Wadham, J.L.; Lis, G.P.; Telling, J.; Pancost, R.D.; Dubnick, A.; Sharp, M.; O’Donnell, E.; Butler, C.E.H.; Hasan, F.; et al. Methanogenic potential of Arctic and Antarctic subglacial environments with contrasting organic carbon sources. Glob. Chang. Biol. 2012, 18, 3332–3345. [Google Scholar] [CrossRef]
- Wadham, J.L.; Hodgkins, R.; Cooper, R.J.; Tranter, M. Evidence for seasonal subglacial outburst events at a polythermal glacier, Finsterwalderbreen, Svalbard. Hydrol. Process. 2001, 15, 2259–2280. [Google Scholar] [CrossRef]
- Li, C.; Bosch, C.; Kang, S.; Andersson, A.; Chen, P.; Zhang, Q.; Cong, Z.; Chen, B.; Qin, D. Sources of black carbon to the Himalayan-Tibetan Plateau glaciers. Nat. Commun. 2016, 7, 12574. [Google Scholar] [CrossRef]
- Hodgkins, R.; Tranter, M.; Dowdeswell, J.A. Solute provenance, transport and denudation in a High-Arctic glacierised basin. Hydrol. Process. 1997, 11, 1813–1832. [Google Scholar] [CrossRef]
- Hodson, A.; Heaton, T.; Langford, H.; Newsham, K. Chemical weathering and solute export by meltwater in a maritime Antarctic glacier basin. Biogeochemistry 2010, 98, 9–27. [Google Scholar] [CrossRef]
- Church, M. On the quality of some waters on Baffin Island, Northwest Territories. Can. J. Earth Sci. 1974, 11, 1676–1688. [Google Scholar] [CrossRef]
- Gíslason, S.; Arnorsson, S.; Armannsson, H. Chemical weathering in southwest Iceland: Effects of runoff, age of rocks and vegetative/glacial cover. Am. J. Sci. 1996, 296, 837–907. [Google Scholar] [CrossRef]
- Anderson, S.P.; Drever, J.I.; Humphrey, N.F. Chemical weathering in glacial environments. Geology 1997, 25, 399–402. [Google Scholar] [CrossRef]
- Eyles, N.; Sasseville, D.R.; Slatt, R.M.; Rogerson, R.J. Geochemical denudation rates and solute transport mechanisms in a maritime temperate glacier basin. Can. J. Earth Sci. 1982, 19, 1570–1581. [Google Scholar] [CrossRef]
- Axtmann, E.V.; Stallard, R.F. Chemical weathering in the South Cascade Glacier Basin, comparison of subglacial and extra-glacial weathering. IAHS Publ. 1995, 228, 431–439. [Google Scholar]
- Collins, D.N.; Lowe, A.T.; Boult, S. Solute fluxes in meltwaters draining from glacierised high mountain basins. In Fourth International Symposium on The Geochemistry of the Earth’s Surface; Bottrell, S.H., Ed.; University of Leeds: Ilkley, UK, 1996; pp. 728–732. [Google Scholar]
- Hasnain, S.I.; Thayyen, R.J. Sediment transport and solute variation in meltwaters of Dokriani Glacier Bamak, Garwhal Himalaya. J. Geol. Soc. India 1996, 47, 731–739. [Google Scholar]
- Collins, D.N. Solute yield from a glacierised high mountain basin. IAHS Publ. 1983, 141, 41–50. [Google Scholar]
- Li, X.; He, X.; Kang, S.; Mika, S.; Ding, Y.; Han, T.; Wu, Q.; Yu, Z. Corrigendum to ‘‘Diurnal dynamics of minor and trace elements in stream water draining Dongkemadi Glacier on the Tibetan Plateau and its environmental implications”. J. Hydrol. 2017, 555, 995. [Google Scholar] [CrossRef]
- Vohra, K. Sediment Load of Chhota Shigri Glacier; Technical Report on Multi Disciplinary Glacier Expedition to Chhota Shigri; Department of Science and Technology: New Delhi, India, 1991; Volume 4, pp. 75–90.
- Puri, V.M.K. Glaciohydrological and Suspended Sediment Load Studies in the Melt Water Channel of Changme Khangpu Glacier, Mangam District, Sikkim; Symposium on Snow, Ice and Glaciers-Himalayan Prospective: Lucknow, India, 1999; p. 1. [Google Scholar]
- Singh, P.; Ramasastri, K.S. Project Report on Dokriani Glacier; National Institute of Hydrology: Roorkee, India, 1999; p. 143.
- Srivastava, D.; Swaroop, S.; Mukerji, S.; Gautam, C.K.; Roy, D. Suspended Sediment Yield and Its Variation in Dunagiri Glacier Melt Stream, Garhwal Himalaya; Symposium on Snow, Ice and Glaciers a Himalayan Perspective: Lucknow, India, 1999; p. 45. [Google Scholar]
- Collins, D.N. Seasonal and annual variations of suspended sediment transport in meltwaters draining from an Alpine glacier. IAHS Publ. 1990, 193, 439–446. [Google Scholar]
- Haritashya, U.K.; Singh, P.; Kumar, N.; Gupta, R.P. Suspended sediment from the Gangotri Glacier: Quantification, variability and associations with discharge and air temperature. J Hydrol. 2006, 321, 116–130. [Google Scholar] [CrossRef]
- Butz, D. The agricultural use of meltwater in Hopar settlement, Pakistan. Ann. Glaciol. 1989, 13, 35–39. [Google Scholar] [CrossRef]
- Bratt, G. The Bisses of Valais: Man-made Watercourses in Switzerland; Amadeus Press: Huddersfield, UK, 1995. [Google Scholar]


| Sample | Quartz | Potash Feldspar | Plagioclase | Calcite | Pyrite | Hornblende | Augite | Clay |
|---|---|---|---|---|---|---|---|---|
| HLG1 | 27.5 | 19.4 | 24.8 | N/D | 2.5 | 16.8 | 3.8 | 5.2 |
| HLG2 | 32.6 | 6.1 | 15.4 | N/D | 9.0 | 25.8 | 6.6 | 4.5 |
| HLG3 | 30.4 | 9.2 | 12.2 | 1.8 | 5.0 | 22.9 | 6.7 | 11.8 |
| HLG4 | 30.8 | 12.9 | 16.3 | 1.4 | 6.0 | 15.7 | 6.4 | 10.5 |
| HLG5 | 31.8 | 8.9 | 14.2 | 1.4 | 8.3 | 16.2 | 6.8 | 12.4 |
| Average | 30.6 | 11.3 | 16.6 | 1.5 | 6.2 | 19.5 | 6.1 | 8.9 |
| Period | NSE | PBIAS (%) |
|---|---|---|
| Calibration (1994–2000) | 0.86 | 5.0 |
| Validation (2001–2007) | 0.83 | −7.0 |
| Overall (1994–2007) | 0.85 | −4.5 |
| HLG | UG1 [51] | GG [52] | CSG [53] | HGA [54] | |||||||||||
|---|---|---|---|---|---|---|---|---|---|---|---|---|---|---|---|
| P | M | G | R | R | R | R | R | R | |||||||
| 2013 | 2013 | 2013 | Seasonal (2008) | Seasonal (2013) | Seasonal | Seasonal | Seasonal | Seasonal | |||||||
| Med | Med | Med | Min | Max | Med | St dev | Min | Max | Med | St dev | Average | Average | Average | Med | |
| N | 142 | 26 | 15 | 144 | 144 | 144 | 144 | 379 | 379 | 379 | 379 | 217 | N/A | N/A | 132 |
| SSC | N/A | N/A | N/A | N/A | N/A | N/A | N/A | 36.0 | 3608 | 193 | 346 | N/A | N/A | N/A | N/A |
| pH | 5.90 | 7.72 | 7.89 | 6.77 | 9.26 | 8.47 | 0.68 | 6.81 | 9.26 | 8.15 | 0.31 | 7.61–7.74 | 6.64 | 6.6 | 8.1 |
| EC | 8.58 | 11.70 | 153.9 | 30.30 | 90.60 | 59.10 | 14.00 | 45.30 | 178.6 | 95.40 | 30.33 | 75.4–93.6 | 78.7 | 36.8 | N/A |
| TDS | 4.33 | 5.94 | 76.60 | 15.15 | 45.30 | 29.55 | 7.00 | 23.00 | 90.30 | 48.30 | 15.28 | 48.3–59.9 | 51.5 | N/A | N/A |
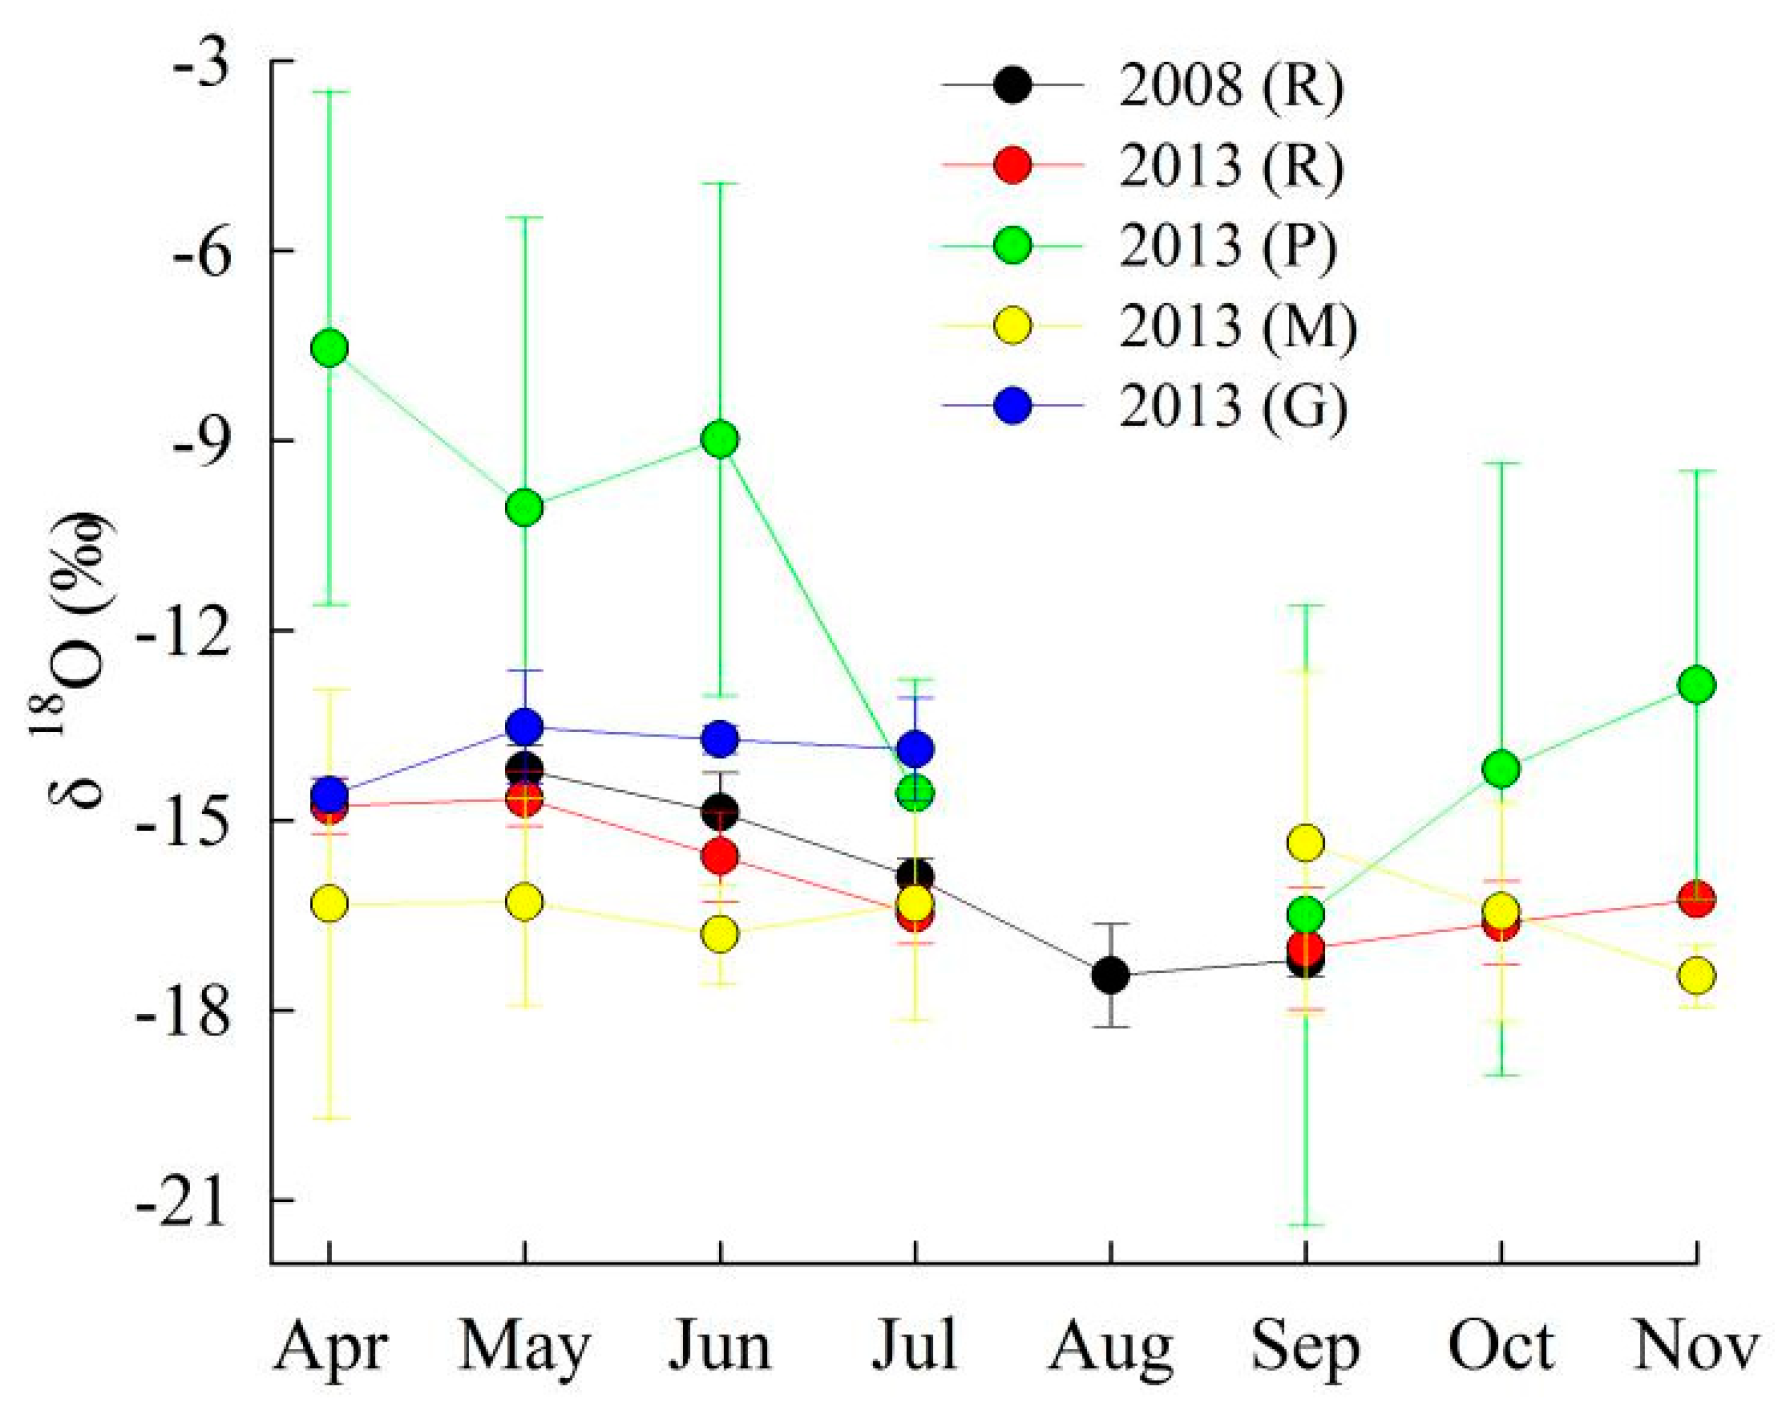
| δ2H | −73.61 | −119.3 | −93.66 | N/A | N/A | N/A | N/A | −130.8 | −93.96 | −112.6 | 8.74 | N/A | N/A | N/A | N/A |
| δ18O | −11.42 | −17.21 | −13.78 | −18.22 | −13.57 | −15.93 | 1.37 | −18.79 | −13.69 | −15.91 | 1.13 | N/A | N/A | N/A | N/A |
| Na+ | 0.582 | 6.109 | 95.96 | 5.643 | 47.91 | 16.05 | 8.304 | 7.174 | 88.39 | 27.40 | 18.18 | 26.96 | 48.43 | 37.91 | 16.09 |
| K+ | 0.589 | 8.336 | 228.7 | 31.59 | 140.8 | 61.38 | 22.61 | 24.46 | 173.7 | 77.44 | 32.31 | 23.33 | 54.33 | 30.79 | 9.487 |
| Mg2+ | 0.255 | 1.871 | 152.2 | 11.86 | 53.75 | 24.40 | 8.625 | 4.179 | 90.13 | 24.95 | 16.13 | 45.00–47.08 | 110.2 | 37.08 | 16.67 |
| Ca2+ | 3.453 | 16.07 | 586.9 | 122.0 | 414.3 | 215.1 | 54.15 | 60.28 | 529.1 | 252.3 | 103.4 | 309.8–364.8 | 129.5 | 75.00 | 165.0 |
| Cl− | 0.451 | 3.253 | 8.714 | 1.113 | 15.77 | 3.422 | 2.177 | 0.580 | 14.70 | 2.766 | 3.008 | 17.78–19.17 | 15.33 | 15.89 | 2.444 |
| SO42− | 3.646 | 1.135 | 397.7 | 28.76 | 259.2 | 85.04 | 36.35 | 19.38 | 296.9 | 113.8 | 64.73 | 177.7–199.8 | 227.5 | 56.50 | 54.17 |
| NO3− | 2.845 | 0.868 | 9.523 | 0.223 | 9.079 | 2.127 | 1.871 | 0.126 | 4.627 | 1.685 | 1.043 | 15.81–18.06 | 5.919 | 3.500 | 6.452 |
| HCO3− | 16.03 | 48.21 | 999.7 | 148.9 | 689.6 | 381.7 | 97.46 | 111.8 | 1021 | 448.0 | 157.6 | 370.3–439.3 | 217.0 | 216.0 | 278.7 |
| Species | 2008 | 2013 | ||||||
|---|---|---|---|---|---|---|---|---|
| Flux | Error | Yields | Error | Flux | Error | Yields | Error | |
| t·year−1 | t·km−2·year−1 | t·year−1 | t·km−2·year−1 | |||||
| SS | N/A | N/A | 126,390 | 6320 | 1570 | 78.5 | ||
| Na+ | 251 | 12.6 | 3.12 | 0.16 | 225 | 11.3 | 2.8 | 0.14 |
| K+ | 1174 | 58.7 | 14.6 | 0.73 | 1072 | 53.6 | 13.3 | 0.67 |
| Mg2+ | 283 | 14.2 | 3.51 | 0.18 | 216 | 10.8 | 2.68 | 0.13 |
| Ca2+ | 3712 | 186 | 46.1 | 2.31 | 3482 | 174 | 43.3 | 2.17 |
| Cl− | 88.1 | 4.41 | 1.09 | 0.05 | 40.2 | 2.01 | 0.5 | 0.03 |
| SO42− | 4073 | 204 | 50.6 | 2.53 | 3523 | 176 | 43.8 | 2.19 |
| NO3− | 102 | 5.10 | 1.27 | 0.06 | 20.6 | 1.03 | 0.26 | 0.01 |
| HCO3− | 9752 | 488 | 121 | 6.05 | 9516 | 476 | 118 | 5.90 |
| Dissolved solutes | 19,435 | 972 | 241 | 12.1 | 18,095 | 905 | 225 | 11.2 |
| Basin | Type | Solute Yields | CDR | CWI | Reference |
|---|---|---|---|---|---|
| Tuva Glacier | Antarctic | N/A | 163 | 308 | [76] |
| Austre Broggerbreen | Arctic | 23,000–28,000 | 240–270 | 208–286 | [56] |
| Erdmannbreen | Arctic | 16,000 | 190 | 235 | [56] |
| Erikbreen | Arctic | 31,000 | 320 | 627 | [56] |
| Hannabreen | Arctic | 30,000 | 320 | 400 | [56] |
| Finsterwalderbreen | Arctic | N/A | 210–440 | 250–1257 | [73] |
| Scott Turnerbreen | Arctic | 16,000 | 160 | 308 | [75] |
| Longyearbreen | Arctic | 23,535 | 322 | 940 | [58] |
| Midre Lovénbreen | Arctic | 41,000–47,000 | 450–560 | 300–431 | [76] |
| Lewis River | Arctic | N/A | 94 | 132 | [77] |
| Kuannersuit | Greenland | 15,900 | 680–850 | 272–340 | [70,71] |
| Mittivakkat | Greenland | N/A | 270 | 83 | [76] |
| Watson River | Greenland | N/A | 38–56 | 100–138 | [63] |
| Tungufljót | Icelandic | 98,000 | 720 | 343 | [78] |
| Hvítá-S/W | Icelandic | 80,000–123,000 | 650–1100 | 361–524 | [78] |
| Worthington Glacier | N American | 15,000 | 1600 | 208 | [79] |
| Berendon Glacier | N American | N/A | 947 | 256 | [80] |
| S Cascade Glacier | N American | 14,100 | 676–930 | 173–282 | [69,79,81] |
| Batura Glacier | Himalayan | N/A | 1460 | 730 | [66,82] |
| Chhota Shigri Glacier | Himalayan | 17,400 | 750–935 | 214 | [30,53,66] |
| Dokriani | Himalayan | 9700 | 462–4200 | 385–646 | [62,83] |
| Gornergletscher Glacier | Alpine | N/A | 450 | 321 | [84] |
| Haut Glacier d’Arolla | Alpine | 50,000–61,000 | 64–685 | 298–376 | [59] |
| Dongkemadi Glacier | Alpine | 14,911 | 185 | 189 | [19,85] |
| Glacier No.1 | Alpine | 43,240–52,329 | 577–703 | N/A | [51] |
| Hailuogou Glacier | Alpine | 231,700–241,428 | 2850–3108 | 616–711 | This study |
| Glacier | Basin Area (km2) | Glacierized Area (%) | SSL (t∙day−1) | SSY (t·km−2·day−1) | Reference |
|---|---|---|---|---|---|
| Shaune Garang | 38.1 | N/A | 43 | 1.1 | [37] |
| Gangotri | 556 | 51.4 | 11,673 | 21.0 | [52] |
| Chhota Shigri | 45 | 25 | 135 | 3.0 | [86] |
| Dunagiri | 17.9 | N/A | 47 | 2.6 | [87] |
| Changme Khangpu | 4.5 | N/A | 18 | 4.0 | [88] |
| Dokriani | 16.1 | 45 | 447 | 27.8 | [89] |
| Hailuogou | 80.5 | 45.3 | 346 | 4.3 | This study |
| Dates for Cumulative Percentage of Species Flux and Discharge | Lead Days of Species Flux Relative to Discharge | |||||
|---|---|---|---|---|---|---|
| 10% | 50% | 90% | 10% | 50% | 90% | |
| DIS | 5 May/7 May | 28 Jul/26 Jul | 6 Oct/2 Oct | NA/NA | NA/NA | NA/NA |
| SS | NA/3 Jun | NA/14 Jul | NA/10 Sep | NA/+27 | NA/−12 | NA/−22 |
| Na+ | 5 Feb/12 Mar | 29 Jun/23 Jul | 26 Nov/26 Oct | −90/−56 | −29/−3 | +51/+24 |
| K+ | 3 Mar/4 Apr | 18 Jul/23 Jul | 6 Nov/13 Oct | −63/−33 | −10/−3 | +31/+11 |
| Mg2+ | 29 Feb/20 Mar | 19 Jul/29 Jul | 8 Nov/21 Oct | −66/−48 | −9/+3 | +33/+19 |
| Ca2+ | 16 Mar/1 Apr | 23 Jul/2 Aug | 30 Oct/19 Oct | −50/−36 | −5/+7 | +24/+17 |
| Cl− | 4 Feb/18 Feb | 27 Jun/7 Jul | 27 Nov/10 Nov | −91/−78 | −31/+19 | +52/+39 |
| SO42− | 24 Feb/5 Mar | 19 Jul/7 Aug | 10 Nov/3 Nov | −71/−63 | −9/+15 | +35/+32 |
| NO3− | 28 Jan/19 Feb | 15 Jun/30 May | 3 Dec/13 Nov | −98/−77 | −43/−57 | +58/+42 |
| HCO3− | 21 Mar/12 Apr | 23 Jul/29 Jul | 28 Oct/14 Oct | −45/−25 | −5/+3 | +22/+12 |
© 2019 by the authors. Licensee MDPI, Basel, Switzerland. This article is an open access article distributed under the terms and conditions of the Creative Commons Attribution (CC BY) license (http://creativecommons.org/licenses/by/4.0/).
Share and Cite
Li, X.; Ding, Y.; Liu, Q.; Zhang, Y.; Han, T.; Jing, Z.; Yu, Z.; Li, Q.; Liu, S. Intense Chemical Weathering at Glacial Meltwater-Dominated Hailuogou Basin in the Southeastern Tibetan Plateau. Water 2019, 11, 1209. https://doi.org/10.3390/w11061209
Li X, Ding Y, Liu Q, Zhang Y, Han T, Jing Z, Yu Z, Li Q, Liu S. Intense Chemical Weathering at Glacial Meltwater-Dominated Hailuogou Basin in the Southeastern Tibetan Plateau. Water. 2019; 11(6):1209. https://doi.org/10.3390/w11061209
Chicago/Turabian StyleLi, Xiangying, Yongjian Ding, Qiao Liu, Yong Zhang, Tianding Han, Zhefan Jing, Zhongbo Yu, Qijiang Li, and Sha Liu. 2019. "Intense Chemical Weathering at Glacial Meltwater-Dominated Hailuogou Basin in the Southeastern Tibetan Plateau" Water 11, no. 6: 1209. https://doi.org/10.3390/w11061209