Nitrogen and Phosphorus Budget for a Deep Tropical Reservoir of the Brazilian Savannah


Institute of Chemistry, Campus Darcy Ribeiro, University of Brasília, Brasília DF 71910-000, Brazil
*
Author to whom correspondence should be addressed.
Water 2019, 11(6), 1205; https://doi.org/10.3390/w11061205
Submission received: 23 April 2019
/
Revised: 20 May 2019
/
Accepted: 27 May 2019
/
Published: 10 June 2019
(This article belongs to the Section Water Quality and Contamination)
Abstract
:This research investigated the source and fate of different chemical species of N and P on a deep tropical urban reservoir, the artificial Lake Paranoá, located in the city of Brasilia (Brazil). To determine an N and P budget, nutrient input from the external load (four main tributaries and two wastewater treatment plants), internal load (from sediment) and nutrient output (from a downstream dam) were estimated empirically. Nutrient storage was evaluated in two compartments: water column and sediment. Nutrient input from the tributaries varied by season presenting higher loads in the wet season, especially N. Nutrient budgets in our study indicated that Lake Paranoá retained dissolved inorganic nitrogen (DIN), PO43−-P, total organic phosphorus (TOP) and exported total organic nitrogen (TON), both on a seasonal and annual scale. Surface sediment is the major storage compartment for both N and P. These results show the pressing need for action to reduce the P outcome charges, mainly, from the wastewater treatment plants. The data here presented contributes to the recognition of this situation and to a better comprehension of these nutrient dynamics, as well as an understanding of the behavior of tropical deep-water reservoirs. This can help to promote more effective management, providing a reference for other similar systems.
1. Introduction
Water availability and demand issues are exacerbated by the lack of planning regarding usage and occupation of a hydrographic basin. Through ‘point sources’ or ‘diffuse sources’ in a hydrographic basin (external load), considerable amounts of nutrients can reach lakes and reservoirs, inducing eutrophication with P perceived as the limiting nutrient to primary production [1,2] and the key factor in determining the trophic state in continental water systems. The P input from sediment (internal load) has also been reported to be an important source for the eutrophication of water bodies [3,4].
Eutrophication can significantly compromise the quality of lake and reservoir waters, undermining multiple uses of the water, for instance: for agricultural irrigation, industrial use, human and animal consumption, and preservation of aquatic ecosystems. One of the main concerns related to the eutrophication process is the proliferation of cyanobacteria over other aquatic species. According to Codd et al. [5], various types of cyanobacteria can produce toxins (cyanotoxins) that cause adverse effects to water ecosystems and human health.
There have been many attempts to assess and control the external loading and retention of nutrients and particularly P, in order to restrain eutrophication in lakes and reservoirs around the world [6,7,8,9,10]. Most of this research, however, has been conducted in shallow lakes [4,6,11,12] and/or in lakes located in temperate zones [13,14,15]. As far as we know, there are only a few studies [16,17], and little information exists about deep reservoirs, especially in tropical and semi-arid regions.
Tropical lakes differ from their counterparts in many aspects. One of the most important is the level of irradiance, which is higher in tropical areas. In addition, there is no great seasonal variation of irradiation, which, combined with lower Coriolis effects at low latitudes, creates weakly stratified lakes with relatively warm and uniform temperatures [18].
The influence of latitude on the biogeochemical cycles is less documented than its influence on the ecology of a lake [19,20]. Two features can be expected to distinguish the nutrients and other elements cycling in tropical lakes from those in temperate ones: the absence of a temperature-driven convective overturn in tropical lakes, due to the lack of thermal stratification; and the significantly higher fluxes of allochthonous Fe and Mn (hydr) oxides from the intensely weathered tropical soils of the catchment area [18].
This need for more information indicates the importance of studies involving the nutrient mass balance of different chemical species of N and P in reservoirs located in tropical savannah climates, as well as the mechanisms of retention and export. This is especially true for N, as it has been the subject of few studies and the internal load is usually neglected. This, in itself, justifies the importance of the present study. However, a more recent issue increases this importance: despite receiving the effluents from two sewage treatment plants, the reservoir under study, at Lake Paranoá, has been used as a source of drinking water since 2017 for the population of the national capital, Brasilia.
The main contributions and innovations of the present study are that this is the first, as far as we know, that deals with the mass balance of nutrients including the evaluation of external and internal loads in deep tropical reservoirs, especially for nitrogen. In addition, it is one of the few studies that take into account the different chemical forms of the nutrients in the budget, not just total nitrogen and total phosphorus. The aim of this paper is to present, based on an empirical model, the seasonal and annual budget of different species of N and P, to identify the main sources of each nutrient, to discuss the prominent factors concerning the retention or export of them in a deep reservoir and evaluate the importance of the internal load to the budget.
2. Materials and Methods
2.1. Study Area
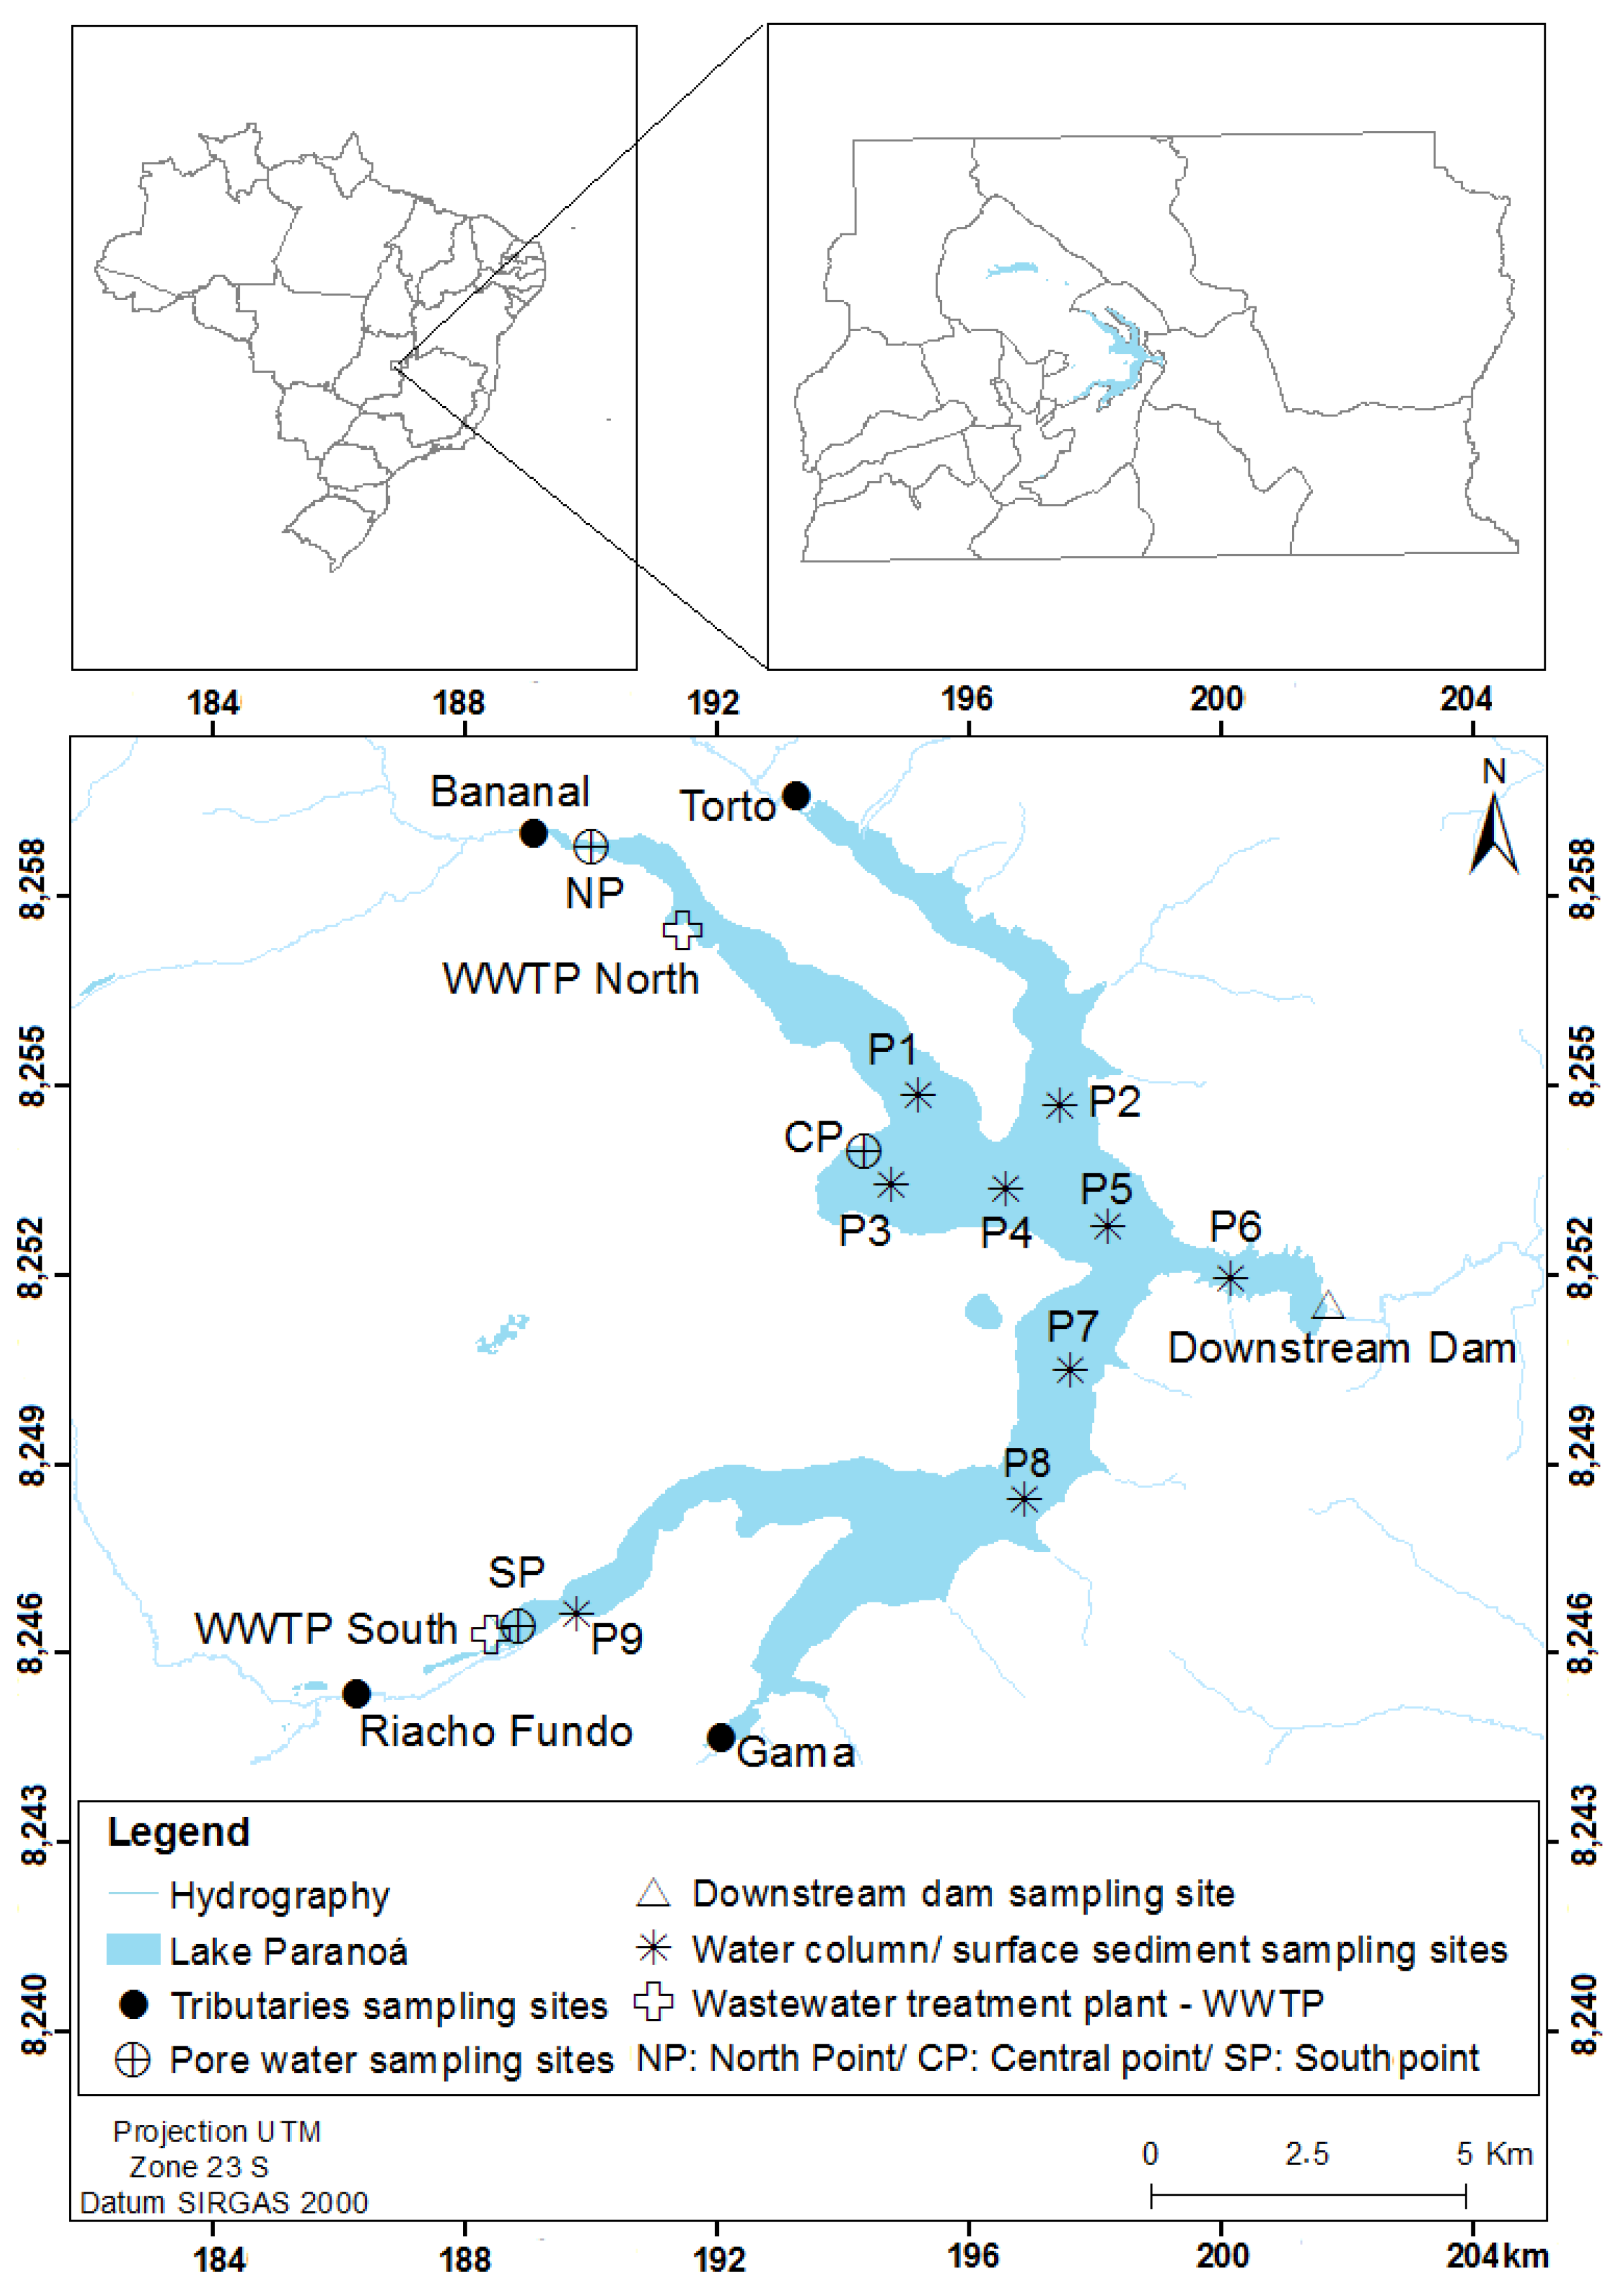
Lake Paranoá (LP) is an urban reservoir located in the city of Brasilia, capital of Brazil (Figure 1). LP is a deep artificial lake, with an average water depth of 12.42 m (max. 38 m, near the dam) and a surface area of 37.5 km2. The reservoir has a maximum storage capacity of 498 × 106 m3. The retention time of the water in the lake used to be 0.82 years [21] until the period of the present study, when it increased to more than 2 years, due to a reduction of the discharge through the dam. This discharge reduction was necessary to allow capture of the lake water to supply the population during the severe water crisis recorded at that time. The catchment area is 1034 km2 and there are four main tributaries that discharge into Lake Paranoá: The Riacho Fundo and Gama streams at the south and the Bananal and Torto streams at the north. Accordingly, five sub-catchments can be considered: Riacho Fundo, Gama, Torto, Bananal and Lake Paranoá.
Lake Paranoá basin is the most human-influenced in the Federal District. Its main issues are related to population growth (2.9 million, Brazilian Institute of Geography and Statistic (IBGE)) [22], land use and occupation (Figure 2). The sub-basins located to the North (Torto and Bananal) are the best preserved due to the influence of the Brasilia National Park, a less densely populated area with more preserved savannah vegetation. Between these, the Torto sub-basin has the highest load of nutrients (nitrogen and phosphorus), with a visible process of siltation in its watercourse in the extreme northern part of the lake, near the mouths of Torto and the Bananal streams [23,24]. The southern sub-basins (Riacho Fundo and Gama), however, are more urbanized and densely populated, therefore, more impacted, than the northern ones, mainly due to deforestation, gravel pit exploitation, soil movements, and soil exposure and degradation [24]. The Riacho Fundo sub-basin is the basin that exhibits the highest nutrient load among all the tributaries [23] also with visible aspects of siltation along its natural watercourse.
Lake Paranoá also receives effluents from two wastewater treatment plants (WWTP North and WWTP South). According to Mar da Costa et al. [25], the treatment plants operate using similar processes, activated sludge with nitrogen and phosphorus biological removal, followed by an additional flotation treatment to upgrade phosphorus removal.
The regional climate, according to the Köppen-Geiger classification [26], is the Savannah Climate (Aw) type, with two distinct seasons: a dry season during winter (historically: May–September) and a wet season during summer (historically: October–April), with annual average precipitation of 1600 to 1700 mm [27].
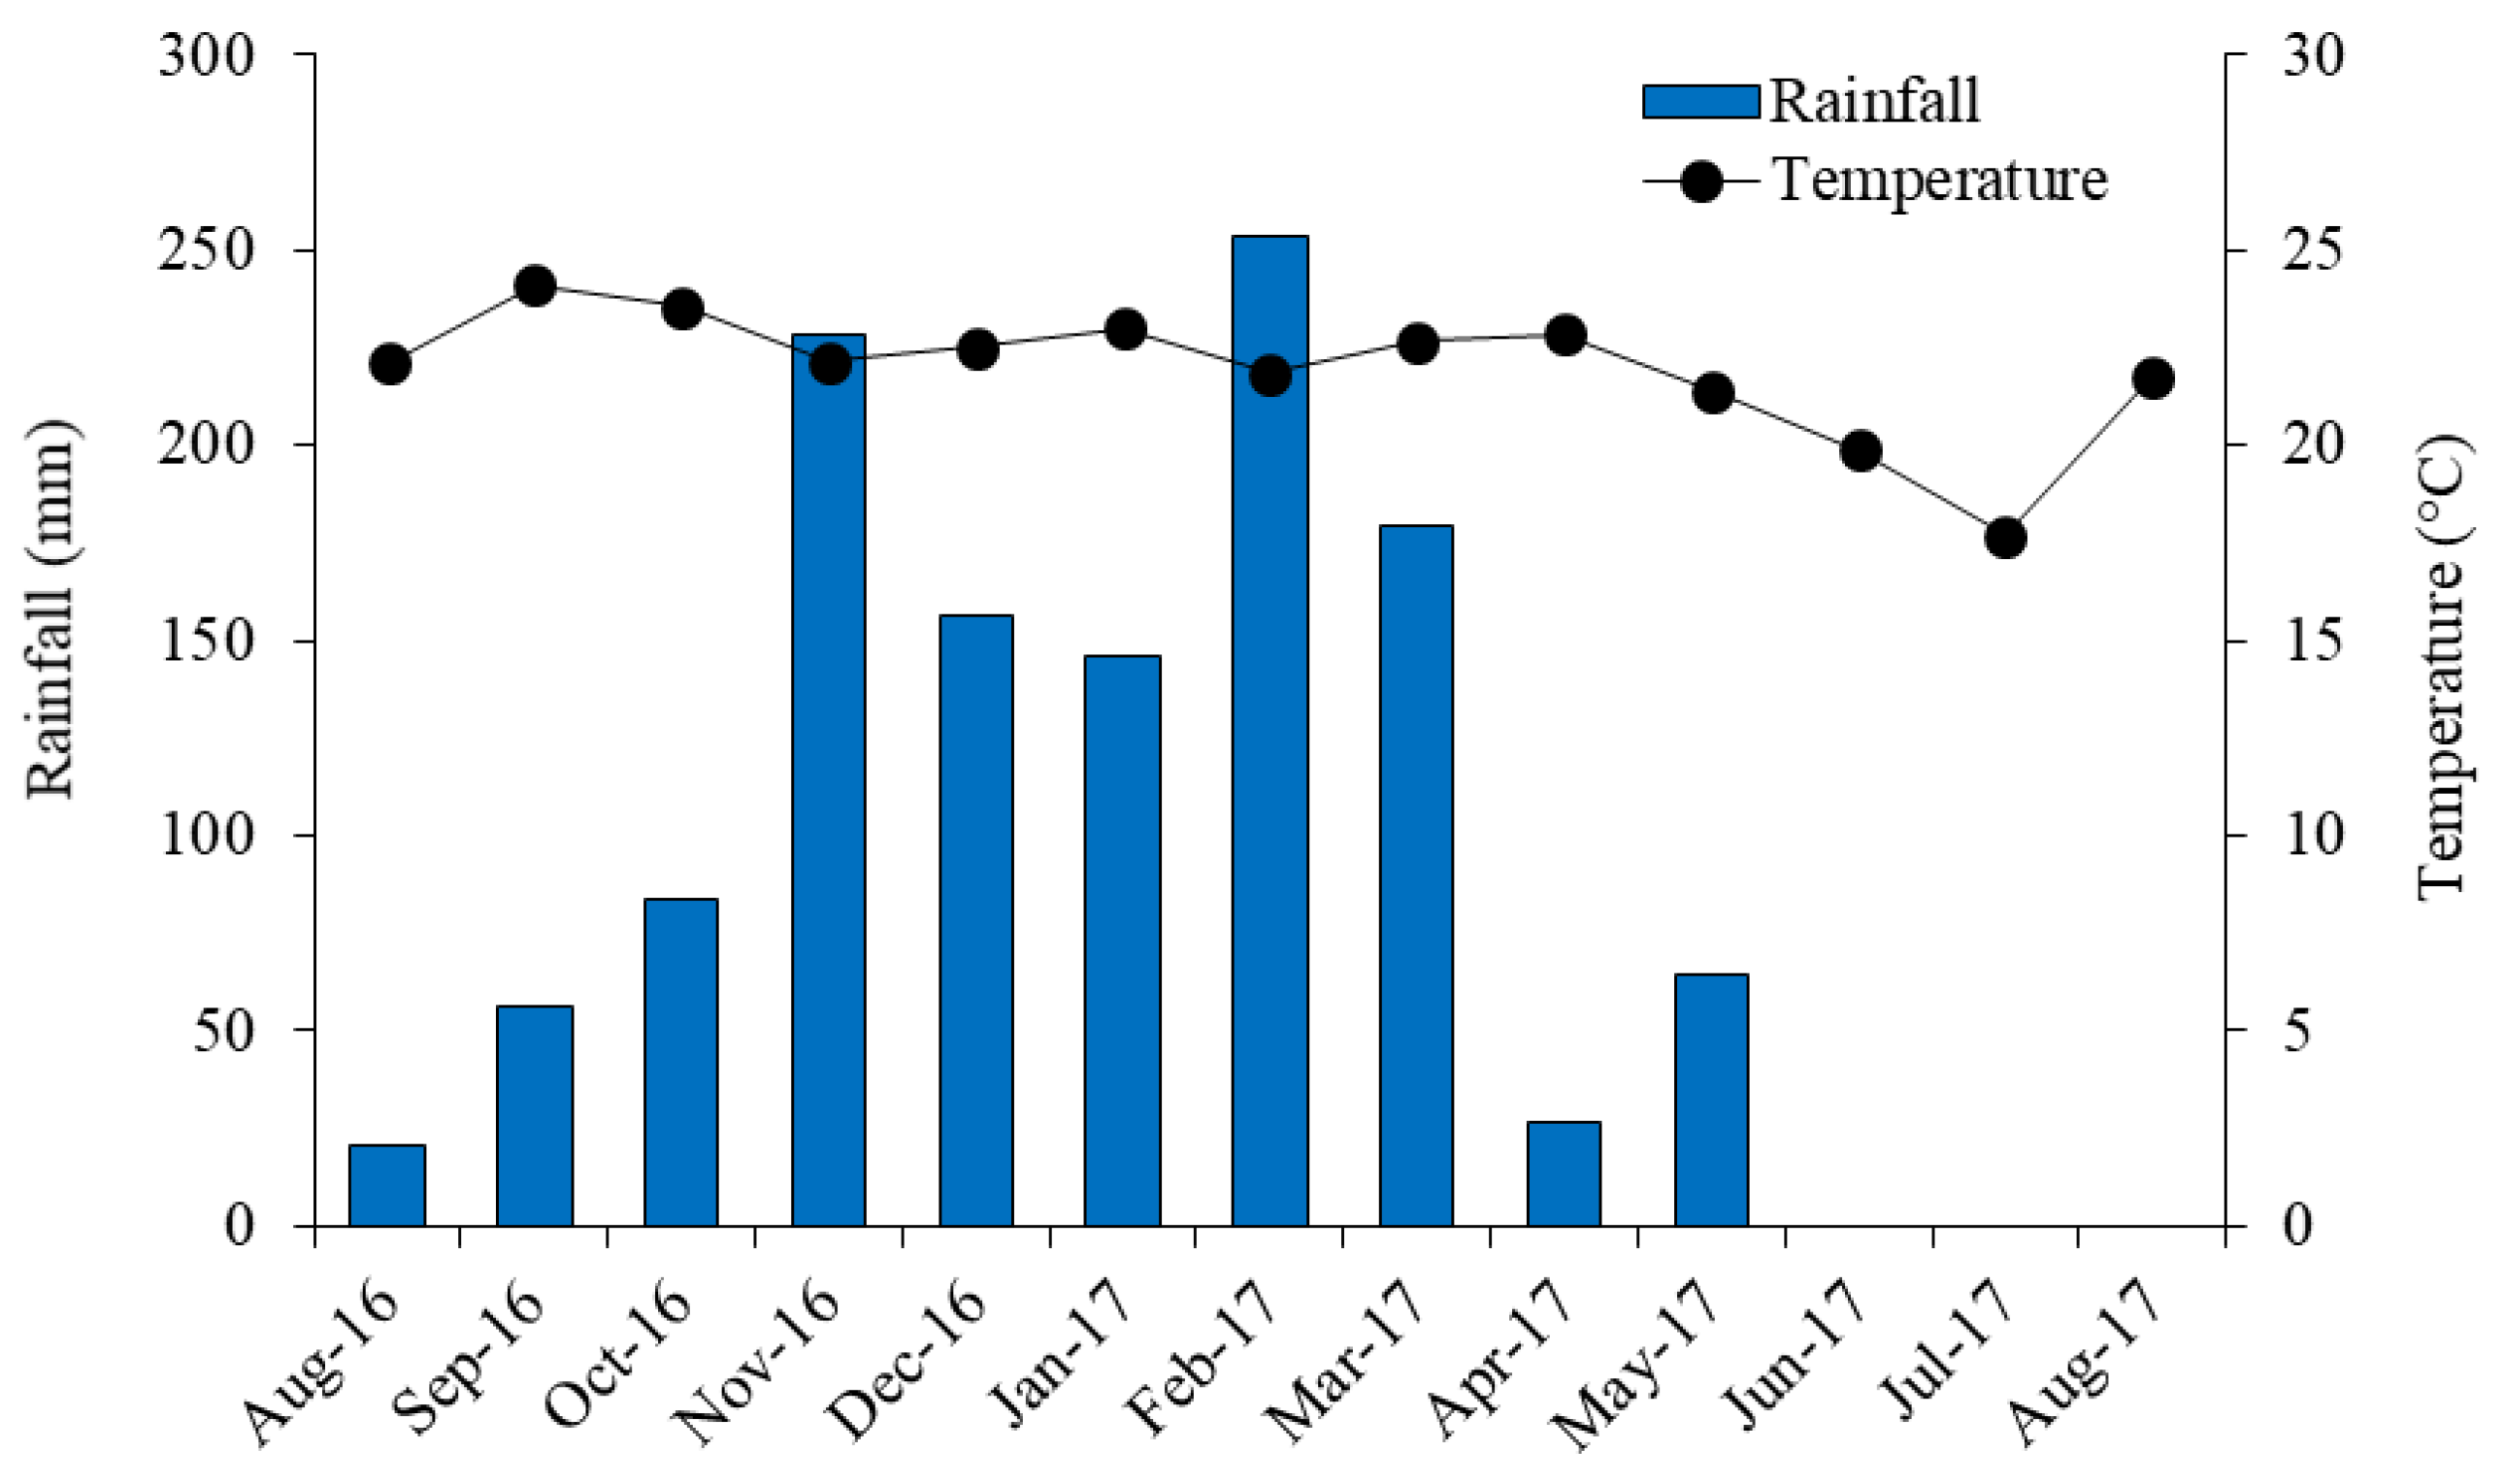
The average annual air temperature for the study period was 21.9 °C, with little variation over the year. The monthly rainfall was below the historical average in most of the months studied. Average yearly total rainfall was 1214 mm, alternating between dry season with precipitation below 251 mm and wet season with precipitation above 963 mm (Figure 3).
2.2. Sample Collection
2.2.1. Tributaries and Downstream Dam
Subsurface water samples were collected monthly between November 2016 and August 2017 at the stream-mouth of the main tributaries of Lake Paranoá (Torto, Bananal, Riacho Fundo and Gama) and at the downstream dam (Figure 1). Considering the low medium-depth (<1 m) of the tributaries and the downstream dam point for the most of the sampling period, all the samples were collected in 5 L polypropylene bottles (previously cleaned with a hydrochloric acid solution, 10%), collected at approximately 30 cm below the water surface and immediately transported in thermal boxes, under refrigeration, to the laboratory.
2.2.2. Lake Water Column
Five field trips (December 2016, February 2017, April 2017, June 2017, 17 August 2017) were conducted in order to collect water samples from nine points distributed along Lake Paranoá (P1–P9, Figure 1), including wet and dry periods. Water samples were collected at two depths: subsurface and bottom, using a horizontal Van Dorn sampler. The water samples were then transferred to previously cleaned 5 L polypropylene bottles and immediately transported to the laboratory in thermal boxes, under refrigeration.
2.2.3. Wastewater Treatment Plant
The average monthly nutrients concentrations data and the average monthly effluent flow from the wastewater treatment plants (WWTP North and WWTP South, Figure 1) for the study period (November 2016 to August 2017) were provided by the Company of Environmental Sanitation of the Federal District (CAESB).
2.2.4. Pore Water
Pore water samples were taken from three different sites, located at the north, center and south parts of the lake (Figure 1). In situ samplers, referred to as sampling candles, were used to obtain pore water profiles on the same day at the three points. The sampler has ten vertically separate chambers machined to 2.5 cm resolution, that allow sampling of ten strata (depth) simultaneously. The chambers were made of tubular ceramic water filters, with pore dimensions between 2 and 3 µm. Before installation in the field, the samplers were purged and filled with nitrogen gas. Then, the samplers were introduced into the sediments, leaving two chambers in the overlying water above the sediment to allow for complete sediment-water interface sampling, and left for 12 h. After that, the pore water samples were collected from each chamber with a sealed syringe. The sampler structure and operating principle are detailed described by Carmouze et al. [29]. The pore water samples were collected at six different periods (February 2017, March 2017, April 2017, June 2017, July 2017, August 2017), including wet and dry periods.
2.2.5. Sediment
A surface sediment sampling was conducted (October 2017) at the same locations as the water column collection (P1–P9, Figure 1) using a Van Veen Grab sampler. After rough material (e.g., twigs, stones, plastic) removal, the samples were transferred to 50 mL conical Falcon tubes using a spatula and then immediately transported to the laboratory in refrigerated thermal boxes, and subsequently frozen at −20 °C.
2.3. Sample Preparation and Chemical Analyses
All reagents used were analytic grade and were obtained from Sigma-Aldrich (Saint Louis, MO, USA).
2.3.1. Water Column (Tributaries and Lake)
Water samples were filtered through 0.45 µm cellulose acetate membranes from Sartorius Stedim Biotech (Gotingen, Germany) for analysis of inorganic and dissolved organic nutrients. The samples destined for ammonium analysis were preserved with the addition of a phenol solution. Ammonium (NH4+), nitrite (NO2−), nitrate (NO3−) and orthophosphate (PO43−) were determined by phenate, colorimetric (Griess reaction), cadmium reduction and ascorbic acid methods, respectively, with all measurements made in a UV-VIS spectrophotometer Agilent Cary 8454 (Agilent Technologies, Santa Clara, CA, USA) [30]. The sum of NH4+, NO2− and NO3− represents dissolved inorganic nitrogen (DIN) in the water samples.
In order to determine total organic nitrogen (TON) and total organic phosphorus (TOP), unfiltered water samples were used. To determined dissolved organic nitrogen (DON) and dissolved organic phosphorus (DOP), filtered water samples were used. All samples destined for the determination of the organic forms of nutrients had been previously digested (using specific persulfate solution for each of the nutrients) in an autoclave at 120 °C for 50 min, to liberate the inorganic forms of N or P [30]. The digestion was performed on the sampling day and the digested samples were kept under refrigeration until the time of analysis. These resulting inorganic forms were then determined as described above for the original inorganic forms, as nitrate for the N and as orthophosphate for P.
Particulate organic nitrogen (PON) and particulate organic phosphorus (POP) were calculated by the difference between TON and DON; TOP and DOP, respectively. The concentrations of total nitrogen (TN) and total phosphorus (TP) were calculated by the sum of their respective organic and inorganic species.
2.3.2. Wastewater Treatment Plant
NH4+ and PO43− concentrations in the WWTPs effluents were quantified by ionic chromatography (Metrohm 850 ionic chromatography system, Metrohm, Herisau, Switzerland). TP concentrations were measured by UV/visible spectrophotometric analysis (Spectrophotometer Perkin Elmer UV/Vis Lambda 25, Perkin Elmer, Shelton, CT, USA) after persulfate digestion. TOP was calculated by the difference between TP and PO43−. All the analyses were performed based on standard methods [30].
2.3.3. Pore Water
The pore water samples were analyzed for the inorganic species NH4+ and PO43−, using the same methodology as for the free water samples, described above.
2.3.4. Sediment
The sediments samples (previously freeze-dried) were used to determine P and N.
Phosphorus fractions were determined using an adaptation of the sequential extraction method according to Pellens et al. [31]. Total phosphorus (TP) concentration in the surface sediments was calculated by the sum of all the fraction concentrations targeted during the sequential extractions (inorganic phosphorus, organic phosphorus, non-apatite inorganic phosphorus and apatite phosphorus). After extracting procedures, the resulting reactive inorganic phosphate was determined by UV-VIS spectrometry using the ascorbic acid method [30].
Total nitrogen (TN) was measured using a CHNS elemental analyzer, (Perkin Elmer EA 2400 Series II, Perkin Elmer, Shelton, CT, USA).
2.4. N and P Loads Calculations
2.4.1. External Inputs
Monthly nutrient input (IN,P) was determined for each source (tributaries and WWTPs) by multiplying the measured concentration and the mean streamflow at the sampling point. The monthly streamflow of each tributary and all the data from the WWTPs were obtained from CAESB. The average monthly flows were obtained, indirectly, from daily water level data through a rating curve, as estimated by Mentzafou and Dimitriou [32] and Waters and Webster-Brow [4]. All the flow data provided by CAESB were obtained at a hydrometric gauging station.
2.4.2. Internal Input
The input from the internal load was obtained by multiplying the diffusive fluxes at the sediment-water interface and the area of Lake Paranoá.
The diffusive fluxes (J) of NH4+-N and PO43−-P were predicted from the concentration gradients observed in the pore water profiles and calculated according to Fick’s first law of diffusion [33] for sediments (Equation (1)).
where corresponds to the diffusive flux in mg m−2 d−1, is the porosity, is the molecular coefficient correct for sediment tortuosity in cm2 s−1, dCi/dz is the concentration gradient of NH4+-N and PO43−-P in mg L−1 across the sediment-water interface. The gradient concentration of the constituent i on the sediment-water interface was calculated from the linear portion of its profile in pore water, through linear regression of the points contained in this segment [34].
The diffusion coefficients for NH4+ and PO43− at 25 °C (D25°C) in sediment-water systems are 19.8 × 10⁻⁶ cm−2 d s−1 and 7.34 × 10⁻⁶ cm−2 d s−1, respectively [35]. The temperature dependence of the D25°C was considered according to the Stokes-Einstein relation (Equation (2)).
where T is the temperature in Kelvin during sampling, T25°C the temperature 25 °C in Kelvin (298.15 K), 25 °C the dynamic viscosity of water at 25 °C (0.8903 g m−1 s−1) and the dynamic viscosity of water at temperature T (g m−1 s−1).
The porosity was determined by the water loss method at 60 °C (wet weight) until it reached the constant weight and calculation according to Berner [36] (Equation (3)).
where is the sediment porosity, is the % of wet weight, is the mean density of the solid particles (sediment), determined from the mass of dry sediment at a given volume and is the mean density of pore water.
A negative flux value indicates a solute flowing into the sediment (sediment acts as a sink) whereas a positive flux indicates a solute release from the sediment (sediment acts as a source).
2.4.3. Output
Monthly nutrient output (ON,P) was settled by multiplying the average concentration and the mean streamflow at the downstream dam. The data concerning streamflow at the downstream dam was provided by CAESB.
2.5. N and P Storage Calculations
2.5.1. Lake Water Column
The stock of N and P contained in the lake water column was derived from lake volume and NT and TP mean concentrations observed in the lake. The lake volume, during the study time, was calculated based on the volume-quote curve provided by CAESB. The data from used quotes were gathered from the Information System on Hydric Resources-DF from the Federal District’s Water, Energy, and Sanitation Regulatory Agency (ADASA).
2.5.2. Sediment
The stock of N or P contained in the sediment was derived from the lake area, sediment density and TN or TP mean concentrations observed in the surface sediment, considering only the first 10 cm of the sediment.
2.6. N and P Budget Calculations
The general mass-balance equation (Equation (4)) for the nutrients N and P was based on studies by Ramírez-Zierold et al. [9], Torres et al. [36] and Waters and Webster-Brown [4].
where , named retention, is the change of N or P retained in the lake (or exported from the lake, if negative), IN,P is the nutrient inputs via external (tributaries and WWTPs) and internal (from sediment) sources, and ON,P is the nutrient output from the downstream dam.
The seasonality in the study region is well defined as being a wet season and a dry season. These two seasons were established from the monthly precipitation data of the National Institute of Meteorology (INMET): wet season (WS, monthly rainfall > 100 mm) and dry season (DS, monthly rainfall < 100 mm), according to Torres et al. [37].
In order to evaluate the nutrient seasonal mass balance, the nitrogen and phosphorus input loads (tributaries, WWTP and internal load) or output load (downstream dam) were obtained from the sum of the months corresponding to the wet (WS, November 2016–March 2017) and dry (DS, April–August 2017) seasons. The annual loads, in turn, were obtained from the sum of the input loads (IN,P) or output loads (ON,P), over the entire study period (November 2016–August 2017).
The contribution of the internal load was considered only for the annual budget because it represents a very small contribution when compared to the other sources. This contribution was obtained from the sum of the monthly average diffusive fluxes of the N and P species multiplied by the lake area.
The atmospheric deposition and groundwater nutrients flow were not monitored in the catchment region and not included for the budget in the current assessment. Evaporation losses of materials other than water also were assumed to be negligible and were not included in the load estimates, as was done by Ramírez-Zierold et al. [9]. It is important to point out that there is historically little variation in the lake water level (3%) over the year.
3. Results and Discussion
3.1. N and P Dynamic in the Lake Paranoá Catchment
Average flows and nutrients concentrations of the four investigated tributaries, the two wastewater treatment plants (WWTP), the downstream dam and average concentrations of the nutrients in the lake for the wet and dry seasons are shown in Table 1.
The nonparametric Mann-Whitney test showed that there were no significant differences (p < 0.05) between dry and wet season concentrations for the majority of the investigated nutrients, considering all tributaries. The exceptions were:
- Significantly higher mean concentration (p < 0.05) of PO43−-P in the Riacho Fundo stream in the dry season,
- Significantly higher mean concentration (p < 0.05) of TOP in the Gama stream in the wet season.
These results suggest different sources for these two chemical forms of P in the streams in the southern part of the lake (Figure 1).
The higher concentration of PO43−-P in the Riacho Fundo Stream during the dry period demonstrates the contribution of the wastewater treatment plant that discharges its effluent in this tributary.
The downstream dam water samples showed significantly lower concentration (p < 0.05) only for ammonium in the wet season. This can be attributed to dilution by the rainwater and the lower concentration of the discharge (p < 0.05) of the wastewater treatment plant (WWTP) located on the shore of the lake in its northern portion.
Differences in the ammonium and total organic phosphorus (TOP) dynamics were found between the two WWTP located on the shore of the lake. As mentioned above, only the one located at the northern portion shows a decrease in ammonium concentration during the wet season. On the other hand, the WWTP located at the southern portion of the lake was the only one to present a significant increase of TOP concentration (p < 0.05) in its discharges into the lake. These differences can be attributed to their different operating conditions. The WWTP located at the northern portion was operating at half of its maximum capacity; the one located at the southern portion, according to data from the Sanitation Company (CAESB) itself, was close to its operating limit resulting in an inefficient treatment for phosphorus removal.
The lake waters showed significant differences (p < 0.05) between seasons only for ammonium and nitrate. These two nutrients showed an inverse behavior, registering a decrease in the nitrate concentration and an increase in the ammonium concentration in the dry season. This can be attributed, at least in part, to the biogeochemical process of nitrate reduction or denitrification in the dry period. The data related to the lake are presented (Table 1) in terms of general average, including the nine points of sampling and the two depths, for each season used for the calculation of the nutrient stock in the water column.
3.2. N and P Load and Storage
Table 2 shows the results of N and P loads imported to the LP from external (Torto, Bananal, Riacho Fundo, Gama, WWTP North and WWTP South) and internal sources during the wet and dry seasons as well as the loads discharged from the LP (downstream dam).
The Torto and Gama streams presented the greatest variations between the dry and the wet season loads. The load of the Torto stream during the wet season was 13 times higher than that in the dry season for DIN and 12 times for TON. Increase of this magnitude was not observed for P in this tributary. Gama also presented wide input variation between wet and dry seasons. The load of this stream in the wet season was: 8, 6, 3.5 and 10 times higher than in dry season for DIN, TON, PO43− and TOP, respectively.
The Riacho Fundo e Gama tributaries, which discharge into the southern portion of the lake, presented the highest contributions of both N and P in the two periods.
The tributaries located in the northern portion contributed considerably less in the two periods, drought and rainfall. Among all, the Riacho Fundo stream was by far the one that contributed the most N and P to the lake.
The annual DIN load imported to the lake (Table 2) shows the dominance of WWTP on input in the lake. The two wastewater treatment plants, the WWTP North and WWTP South, provide the major annual contribution of DIN (275 Mg, 66.8%).
The Southern tributaries (Riacho Fundo and Gama) provided the second major annual contribution of DIN (132 Mg, 32%). The Northern tributaries (Torto and Bananal) and internal load provided 1.2% (5.0 Mg) and 0.01% (0.03 Mg), respectively.
With regard to the data from the tributaries, these results can be related to the use and occupation of the soil in the hydrographic basin since the southern tributaries run through more urbanized areas, with a greater level of soil sealing and poorer sanitation system coverage. The northern tributaries, in turn, are less affected by urban expansion since they are located in an environmental preservation area and have greater sanitation system coverage.
A load of 62 Mg of DIN was discharged through the dam, which is equivalent to 15% of the input load.
Considering only the contributions of the tributaries, as there is no estimate of organic nitrogen from the wastewater treatment plants, the streams of the southern region provided the major contribution of TON (146 Mg, 70%). Therefore, 30% of TON (62 Mg) was supplied by tributaries of the northern region (Torto and Bananal).
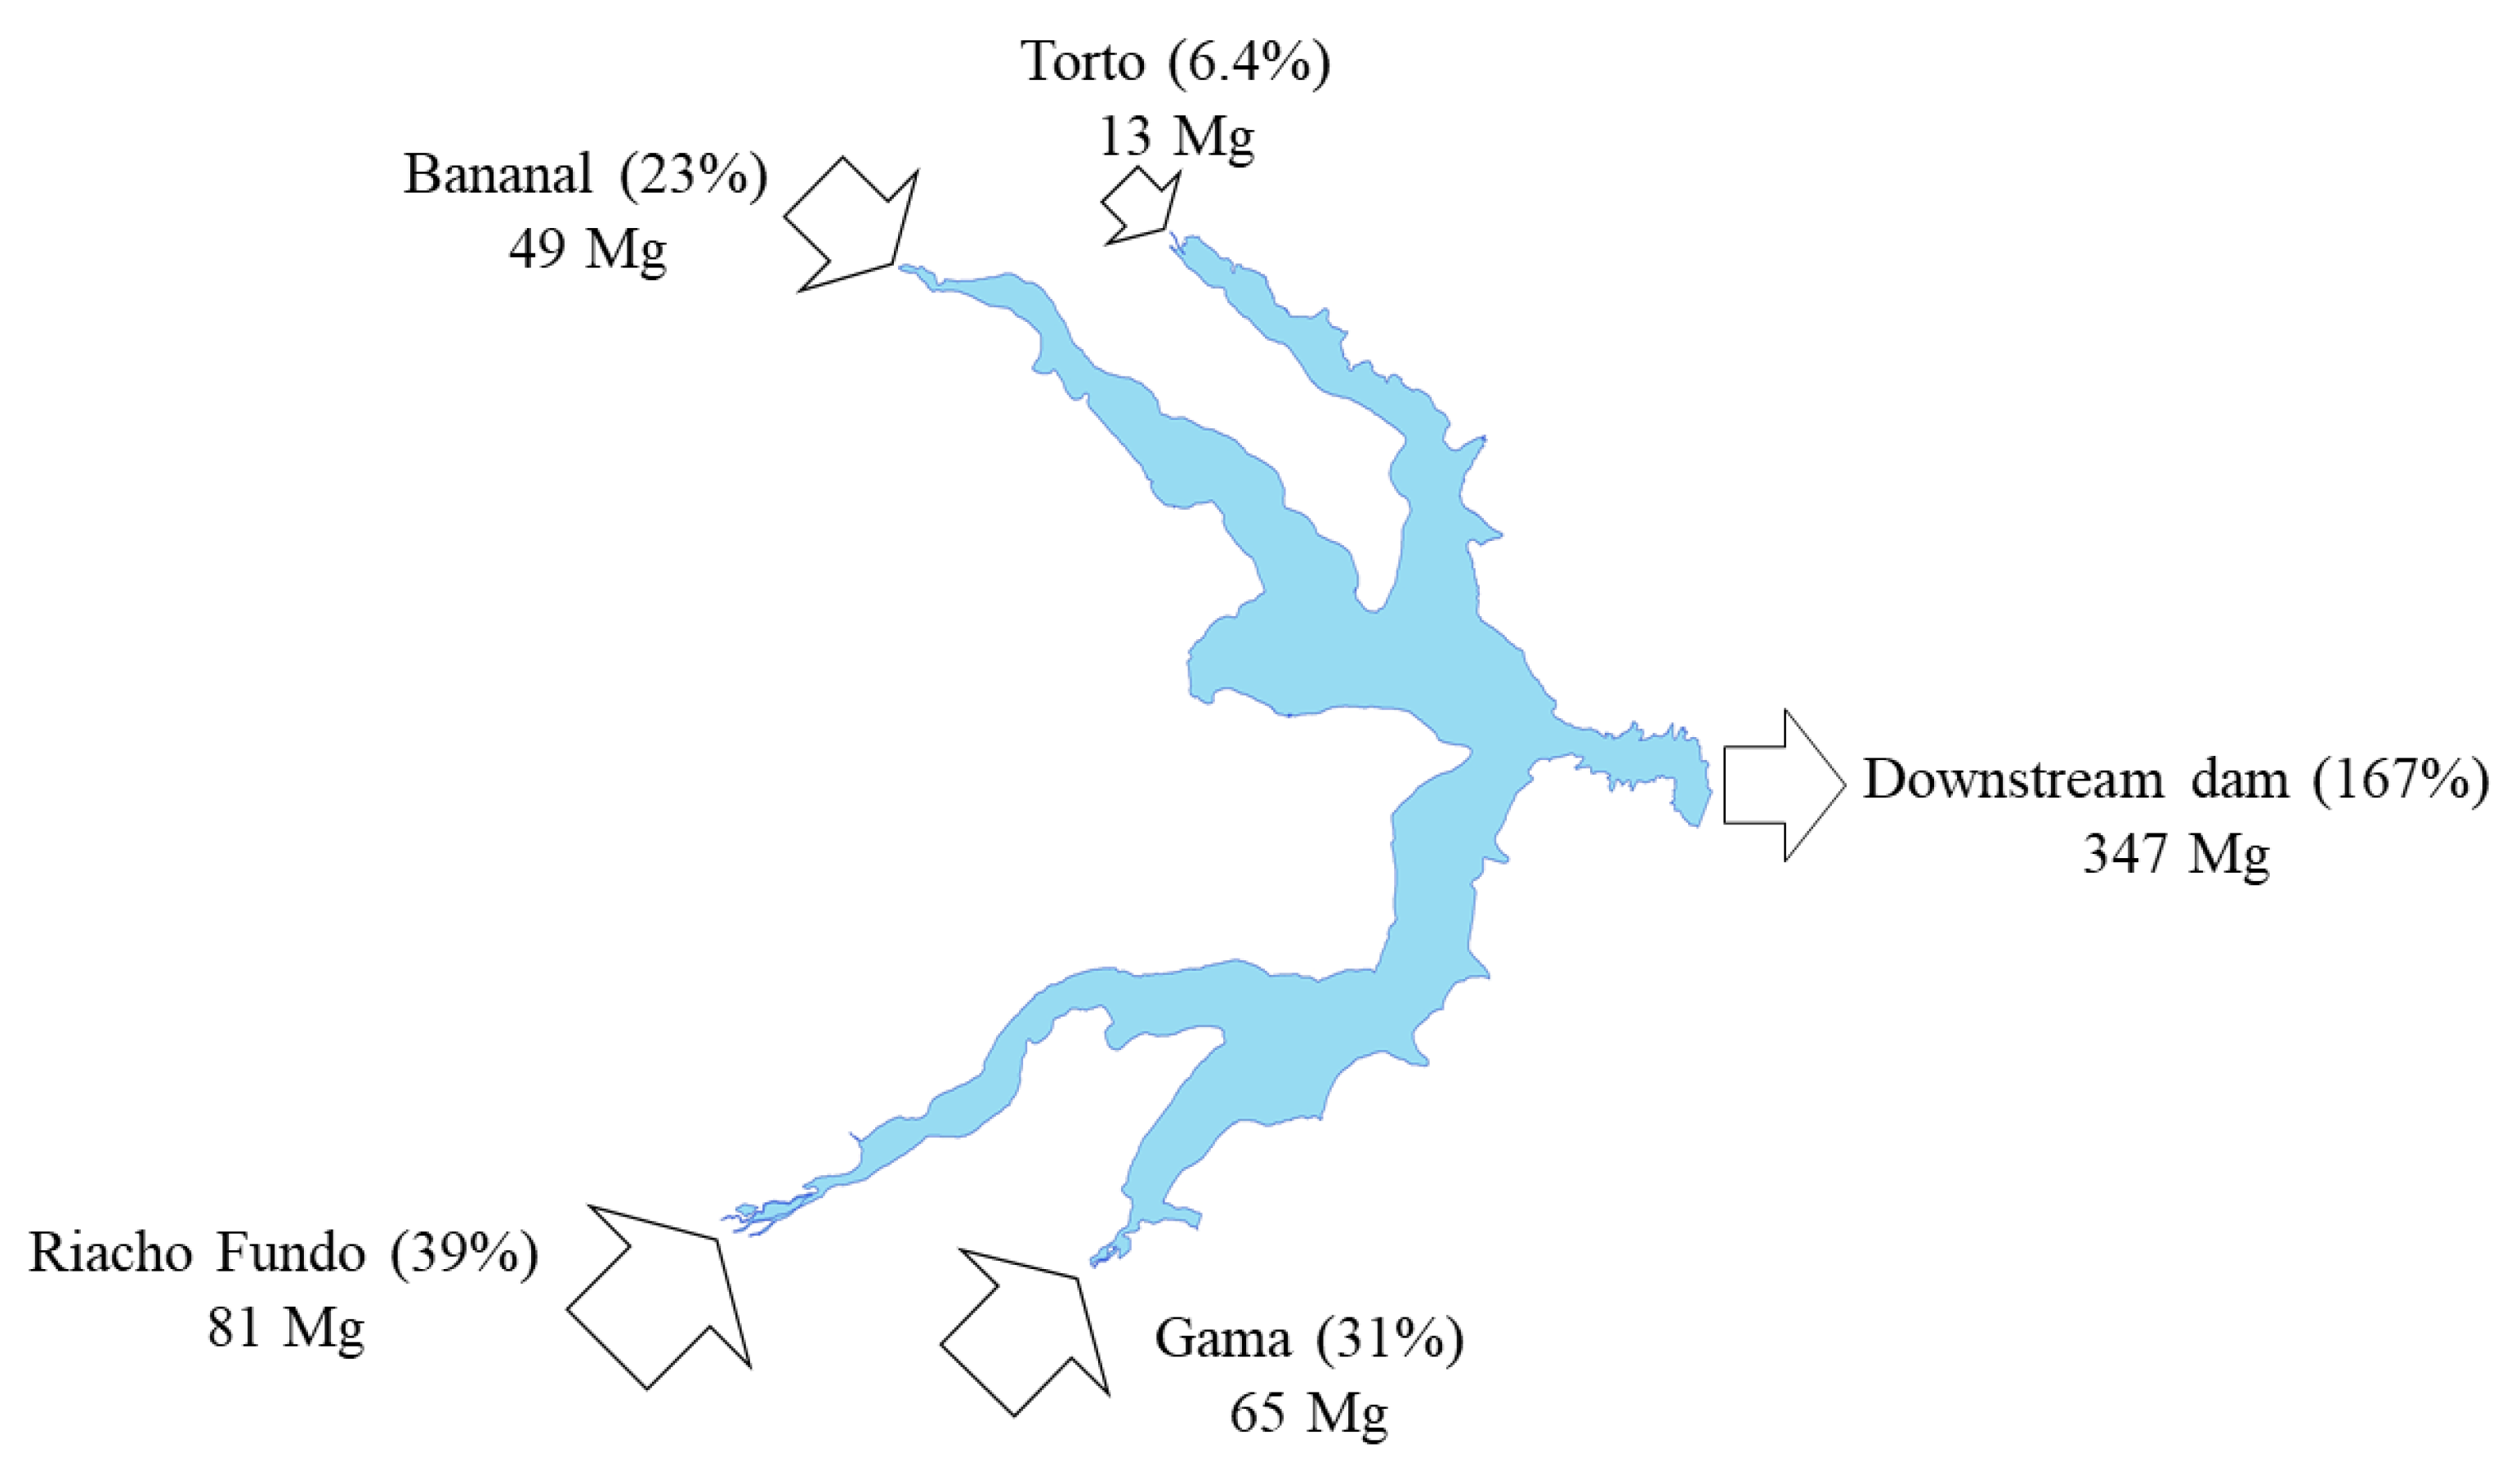
A total load of 347 Mg of TON was exported through the dam, which is equivalent to 67% of the input load.
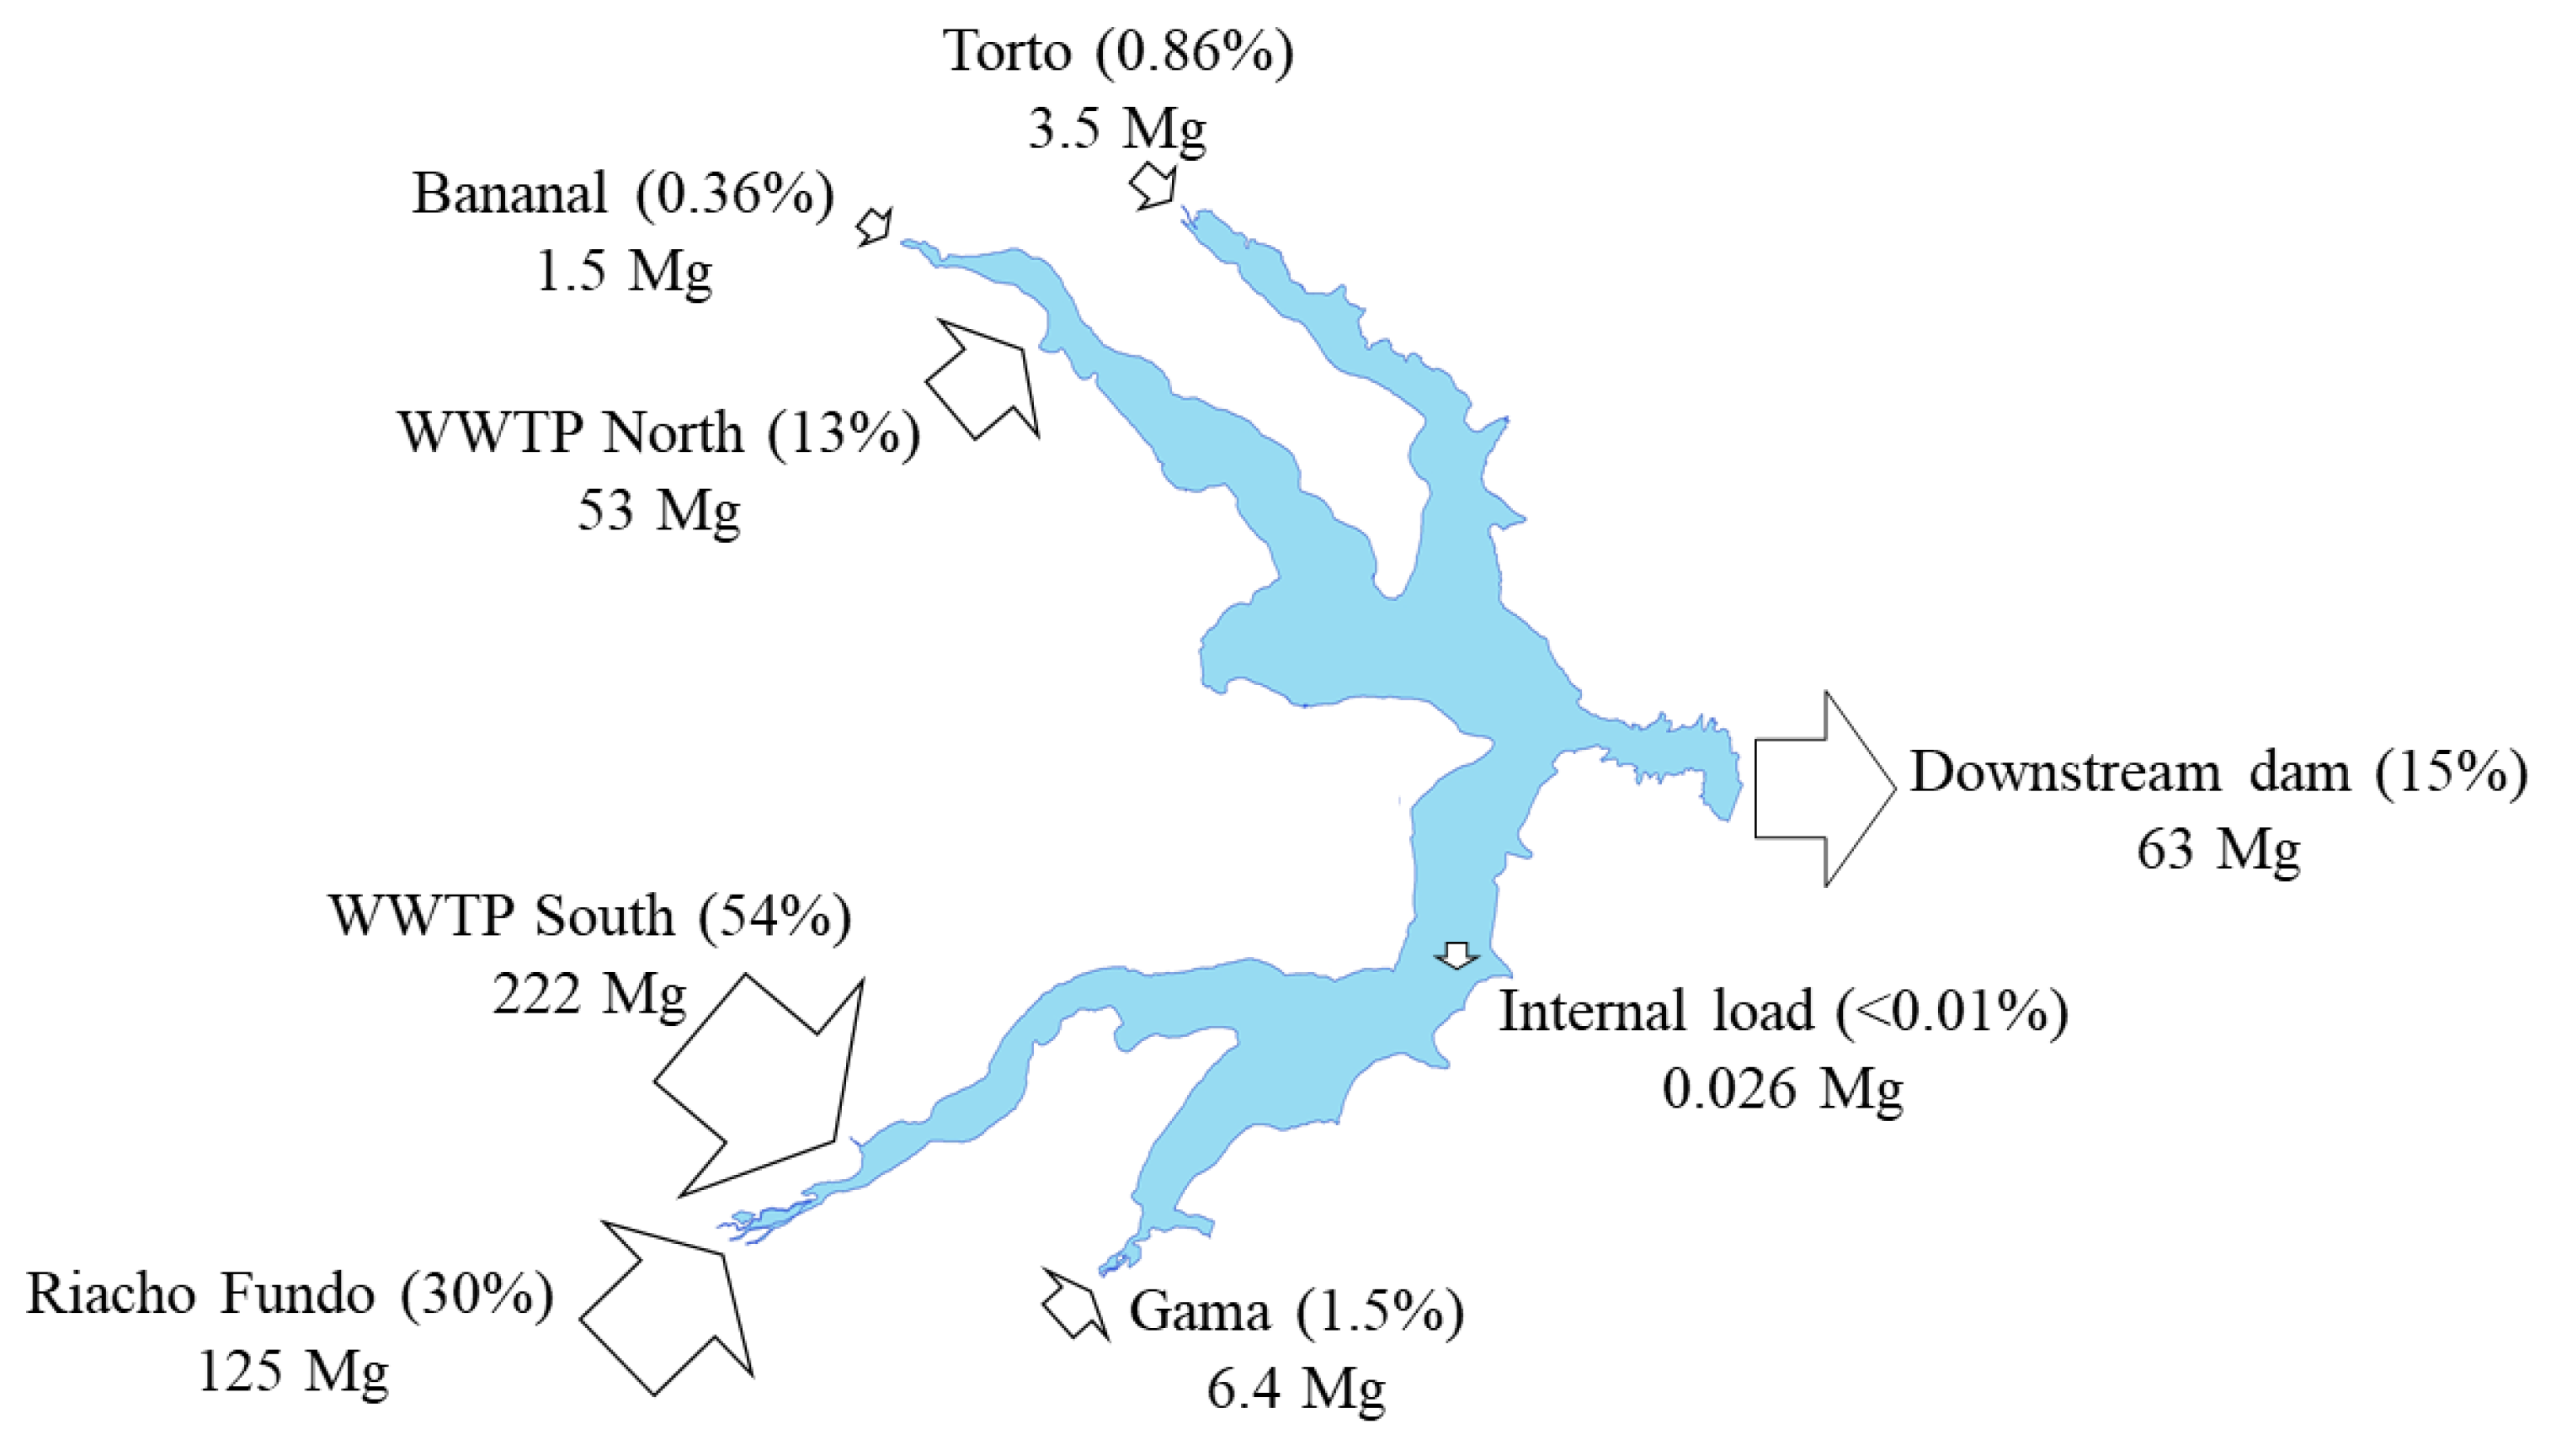
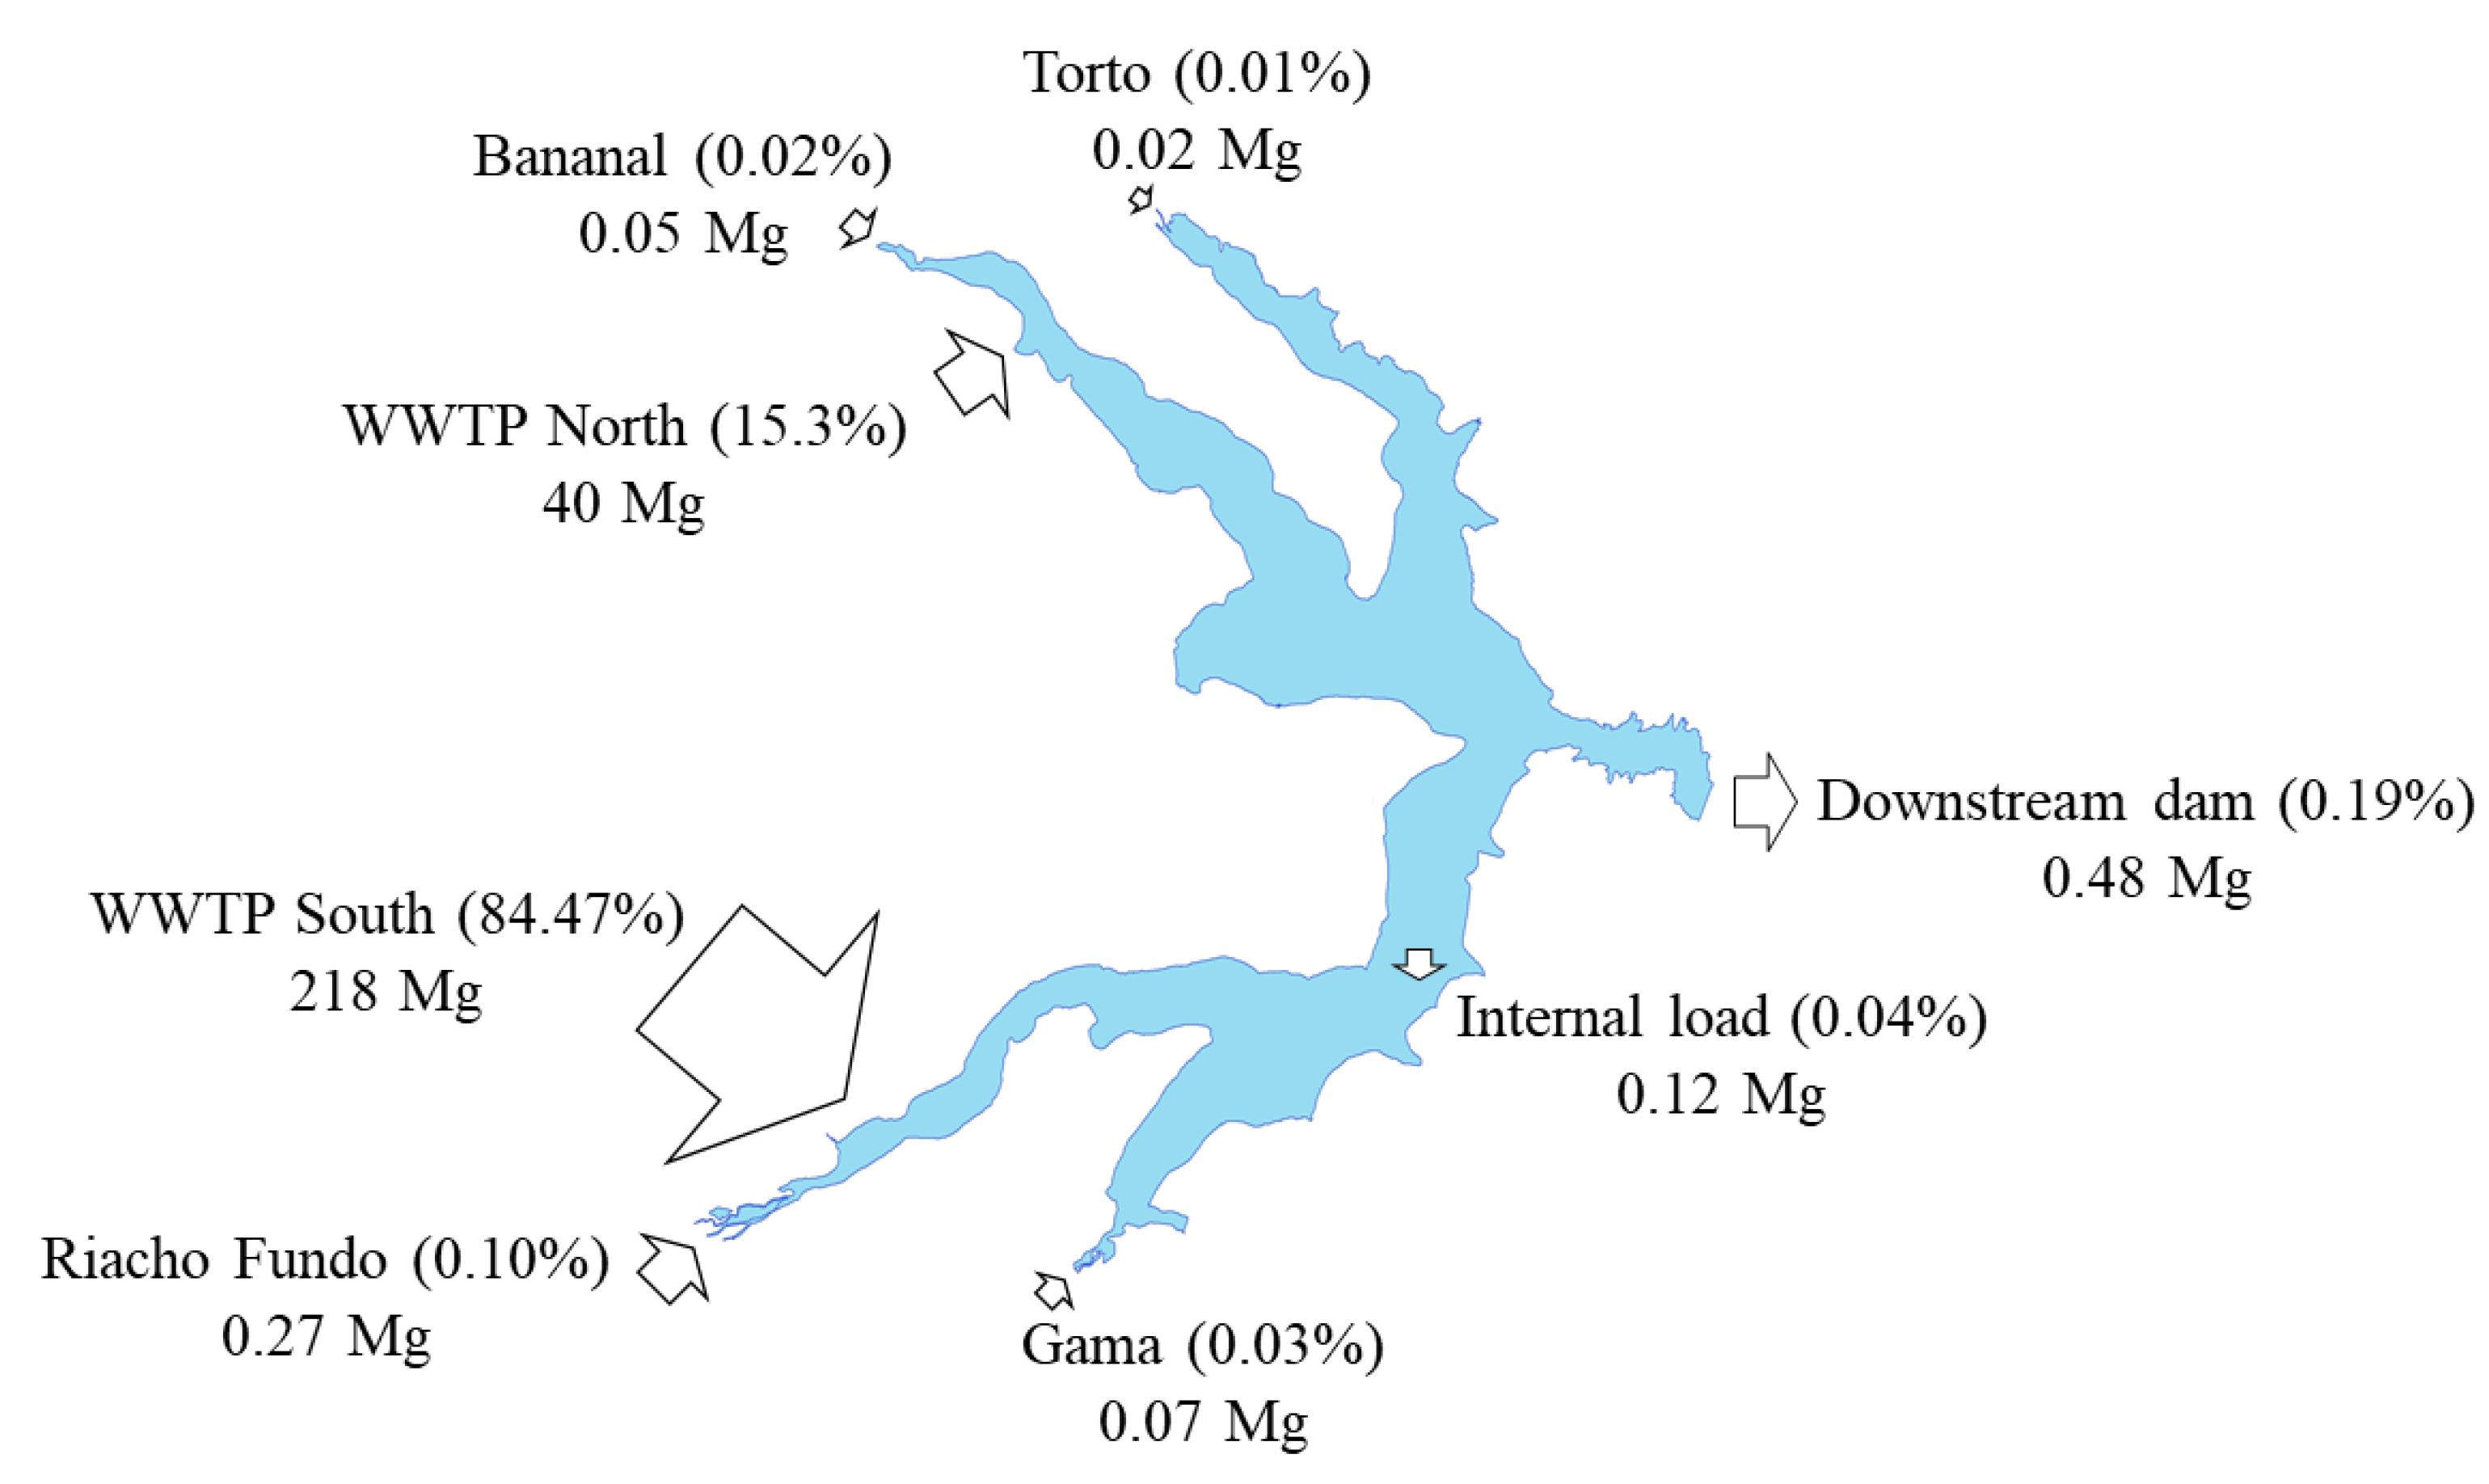
In relation to P, the WWTPs are responsible for 99.8% (258 Mg) of the PO43− input with WWTP South alone adding 84.5% (218 Mg) to the lake’s total annual external load. The tributaries (Torto, Bananal, Riacho Fundo and Gama) can contribute up to 0.16% (0.41 Mg) to the total annual load imported to the lake. The internal load was much less significant, reaching only 0.04% (0.12 Mg).
A load of 0.48 Mg of PO43−-P was discharged through the dam, which is equivalent to 0.20% of the input load.
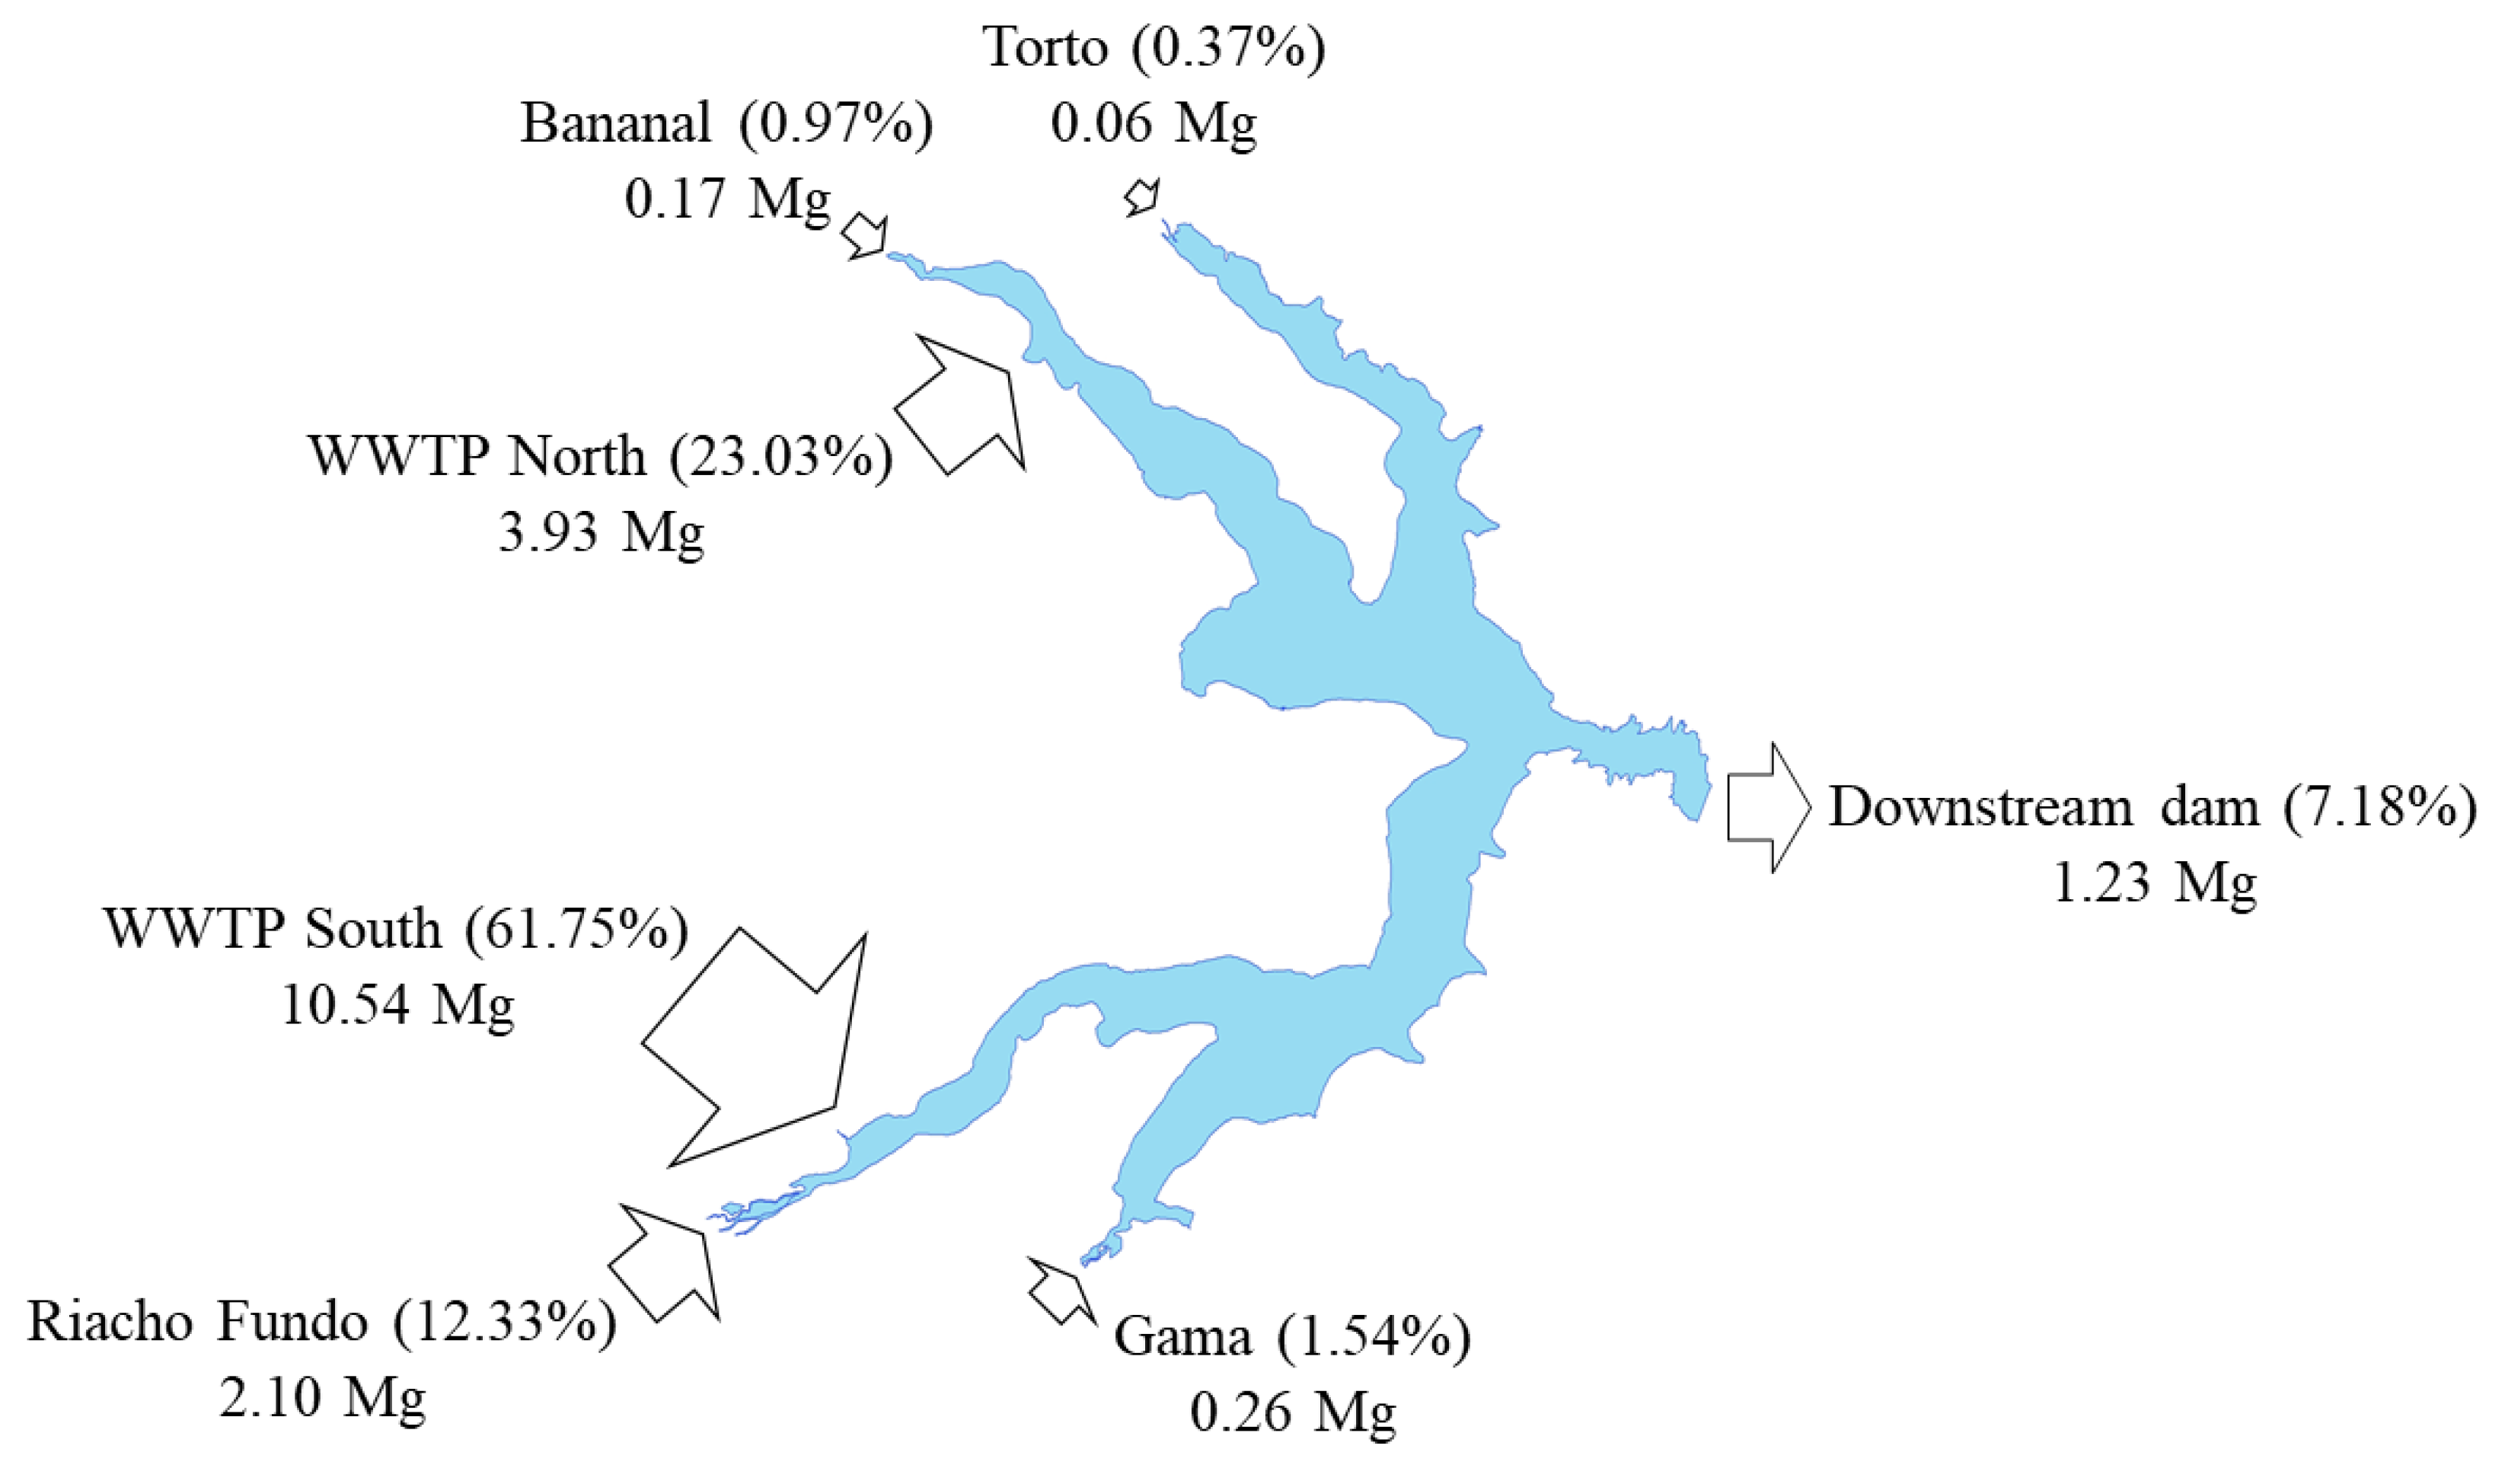
The WWTPs were responsible for 84.8% (14 Mg) of the TOP input with WWTP South alone contributing 61.8% (11 Mg) to the lake’s total annual, external load. The tributaries imported 15.2% (2.6 Mg) to the total annual.
In general, these results suggesting that external loads can be major sources of N and P, contributing to eutrophication in LP. On an annual basis, the N input to Lake Paranoá is mainly controlled by the southern tributaries and the WWTPs, while the WWTPs provide by far the majority of the external loads of P. Therefore, the internal load provides a secondary role in the eutrophication of LP.
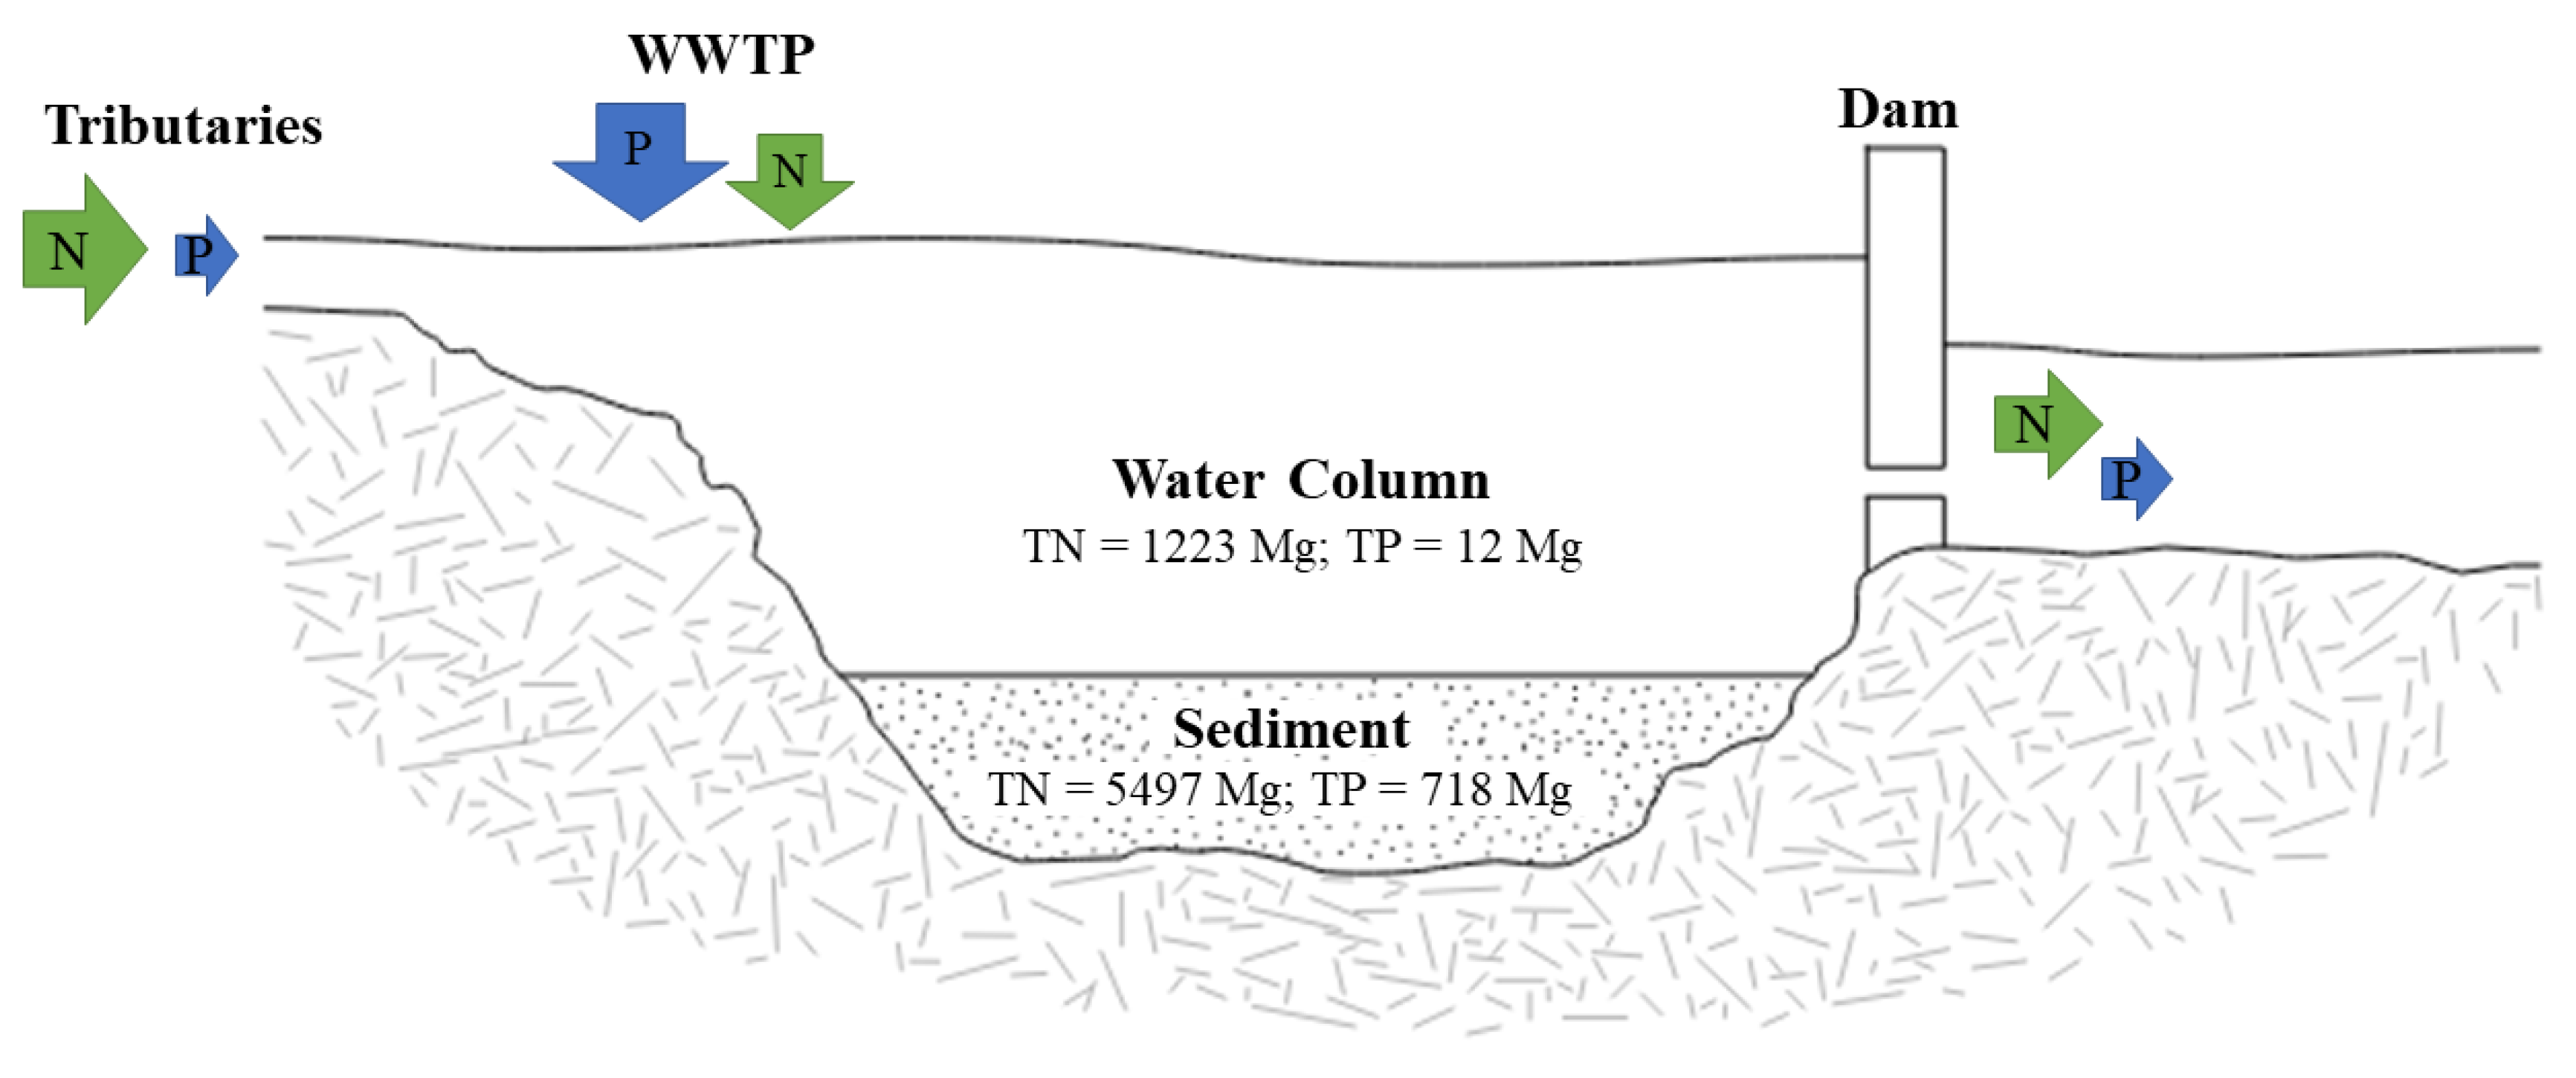
The N and P stock in each compartment (water column and sediment) of Lake Paranoá is shown in Figure 4. Surface sediment is the major storage compartment for both N and P. As expected, phosphorus is usually transported in the particulate form attached to sediment [38], whereas nitrogen, can be largely fixed in eutrophic lakes [39] and transported from the water column to the sediment.
Total stocks of N and P in the water column of LP were approximately three and two times higher respectively than those reported by Ramírez-Zierold et al. [9] for the Valle de Bravo (VB) reservoir, a deep urban lake in Mexico. The total stocks of N and P in the VB were 375 Mg and 27.4 Mg respectively. N and P stocks in the sediment were not determined for the Valle de Bravo. LP and VB had comparable results, probably due to the high hydraulic residence time (>2 years) and high inputs recorded in both reservoirs.
Water column nutrient stocks in shallow lakes located in the USA, Japan, China and New Zealand are in the range of 185–7115 Mg for TN and the 3–464 Mg for TP [4,6]. The data presented here (Figure 4) fit within these values suggesting that average depth and climate are not determinant factors for nutrient storage in lacustrine environments.
Comparable published data, especially for N storage calculations in sediment, were difficult to find. To date, most of the N and P stock calculation studies have been conducted in shallow lakes in temperate climate zones [4,6], the data from which cannot be easily applied to tropical deep lakes. Besides this, many studies have focused on a single lake compartment (e.g., water column) or a single nutrient (e.g., phosphorus).
Total P stock in the sediment of LP (Figure 4) was approximately four and nine times higher than stocks reported by Waters and Webster-Brown [4], respectively, for Lake Forsyth in New Zealand, and by Ul Solim and Wanganeo [12], for Dal lake in India, both shallow lakes located in temperate zones. The total stock of P in Lake Forsyth was reported as 182 Mg and Dal lake, 79 Mg. Total N stock in the sediment was not determined for either lake.
These results may be related to the high P inputs and the high hydraulic residence time of Lake Paranoá. Inputs and hydraulic residence time are key factors for P storage [7,40]. LP had its hydraulic residence time increased due to the water crisis registered between 2016 and 2017. Besides this, most (>98%) of the P total load in Lake Paranoá originates from the two WWTPs (WWTP North and WWTP South) located on the shores of the lake. Most lakes and reservoir studies that have been reported in the specialized literature are not impacted by WWTP effluents.
3.3. N and P Budget
The results of the TN and TP mass budget in the hydrological period of 2016–2017 indicated that Lake Paranoá acts as a sink for both nutrients (Table 3). Different forms of N show different behavior: inorganic forms are retained (NH4+-N, NO2−-N and NO3−-N) in the lake; while the organic form is exported (TON), regardless of the period considered. In the case of P, all chemical forms exhibited the same behavior, both the organic form (TOP) and the inorganic one (PO43−-P) were retained during the entire study period (wet and dry season).
NO2−-N retention tended to be lower during the dry season than in wet season, while NO3−-N retention tended to be higher. TON exportation tended to be lower during the dry season more than in the wet season. NH4+-N, PO43−-P and TOP retention was similar in both seasons (Table 3). Despite the export of TON, there was a net balance in retention and export over the study period owing to the higher retention of N inorganic forms.
TON was the only exported form of N throughout the period, with a high export percentage (67%) of the total incoming load (Figure 5). This information suggests that there are other important sources that were not part of the study, such as N fixation and discharge by WWTPs, the latter being the most probable.
Nutrient budgets have been estimated for a series of lakes and reservoirs around the world (Table 4). In some cases, both inorganic and total phosphorus and nitrogen [11] were analyzed; while in others, only the inorganic and total phosphorus and nitrogen and the total Kjeldahl nitrogen were determined in the nutrient budget [41]. Since many studies have considered only the nutrient budget for TN and TP, a data comparison with regard to organic forms was difficult.
Although quite unusual among the systems already studied, the export of N was also recorded by Cook et al. [41] in two shallow reservoirs in a semi-arid region of Australia and by Garnier et al. [13] in three deep reservoirs in France. Cook et al. [41], for example, found an average retention of 7% of total nitrogen and an average export of 6% of organic nitrogen. According to the authors, this export of N may have been related to high rates of biological N fixation, which is more common in subtropical and semi-arid climatic reservoirs, leading to a reduction in the retention capacity of this nutrient. The N exportation found by Garnier et al. [13] was very high (100%–350%) of the NH4+-N.
According to Matson et al. [42], anthropogenic activities have more than doubled the N input into terrestrial ecosystems. Environments initially limited in N have retained this element in vegetation and microbial growth, accumulation in biomass, and possibly also in soil organic matter. However, at some point, the input of N can exceed the biological demands and the system will begin to lose its retention capacity for this nutrient, which may explain the exportation to surrounding aquatic environments, as in the case of Lake Paranoá.
The annual N budget for dissolved inorganic nitrogen (DIN), however, showed retention of this form of N, equivalent to 85% of the total incoming load (Figure 6). The total load retained in LP can be attributed to the increase of the hydraulic retention time (>2 years) and high inputs, especially from WWTPs (WWTP North and WWTP South). It is noteworthy that WWTP North at 49% of its capacity utilization, while WWTP South at 88%.
The retention of P in Lake Paranoá (Figure 7 and Figure 8) fit within other values reported in the literature (Table 4). The retention of P in LP was similar to what has been reported for the Valle de Bravo [9], but higher when compared to Swiss lakes [8]. Despite the high hydraulic residence time of Swiss lakes, low P retention may be associated with low inputs imported to the lakes (Table 4).
Although it is difficult to compare different lakes, Brazilian shallow lakes with lower hydraulic residence time (<1 year) showed retention of phosphorus ranging from 15% to 67%. The highest input, in Lake Broa (3260 Mg), resulted in the lowest retention percentage (Table 4).
Amongst the factors that can affect nutrient retention (particularly phosphorus), the parameter hydraulic retention time predominates [7,37,43].
The hydraulic retention time of LP was calculated for the study period concurrent with the period of increased water retention rate in the reservoir in the function of the lower flushing rate from the dam. This was done to provide an emergency catchment of 700 L s−1 water for human consumption as regulated by Company of Environmental Sanitation of the Federal District (CAESB) in October 2017 to meet the water demand during the period of Brasilia’s water crisis, 2016/2017. At that time, the volume of L. P’s main reservoirs was used to supply the population and the Descoberto and Santa Maria reservoirs reached the lowest levels in history. As this location has been chosen for permanent water collection by CAESB, this higher TR will likely become normal.
With high hydraulic retention times, the flushing rate from Lake Paranoá was lower and the retention of TP in the lake system was very high (99% of inflows). This phosphorus retention coefficient (RP) of 0.99 is at the higher end of what has been recorded in the published data. Kõiv et al. [7] reported RP values of between 0 and 0.93 with a mean of 0.5 for 54 lakes and reservoirs worldwide. According to these authors, the standard P retention in natural lakes corresponds to 47% ± 28% and in reservoirs to 42% ± 22% of total external input of phosphorus, therefore, there are no meaningful differences among lakes and reservoirs. It should be noted, however, that the majority of the data originated from temperate zones in Europe and North America.
Another important factor in phosphorus retention is the relative depth (ZR). According to Nõges et al. [53] and Kõiv et al. [7], phosphorus retention in lakes and reservoirs is directly proportional to relative depth. This was validated by the latter only for great lakes (>25 km2) and with shorter hydraulic retention time (TR < 0.3 years). Considering the relative depth of Lake Paranoá (ZR = 0.55), our results confirmed the previous hypothesis that phosphorus retention capacity is higher in deeper lakes with higher ZR than in shallow ones with deeper ZR. On the order hand, our results indicated that this relationship was also valid for a reservoir with a higher hydraulic retention time, as in the case of Lake Paranoá.
Although the work of Kõiv et al. [7] exhibits significant considerations concerning the P retention process in lakes and reservoirs, most of the data was derived from climate regions different from LP, that is a tropical reservoir in a savannah climate. Furthermore, it is important to point out that while nutrient cycling is a common process in all ecosystems, the amount of element retention in the water column and in the sediment (N and P storage), as well as the diffusive fluxes that occur among these compartments, are relative to each ecosystem.
This study, then, introduces an important contribution to the knowledge of the behavior of these nutrients in deep urban reservoirs in a tropical savannah climate, where the retention and export mechanisms are still not well known.
4. Conclusions
The approach used in this study, based on a mass balance for N and P, including several inorganic and organic species of these elements in the different compartments of Lake Paranoá, is shown to be an appropriate and important tool for the implementation of hydric resources management mechanisms that focus on the reduction of nutrient input, and resulting development of eutrophication processes, mainly in deep tropical reservoirs, where studies are yet incipient.
The mass balance enabled the identification of spatial patterns on the external load of N to the lake, emphasizing the southern region tributaries, more specifically Riacho Fundo and the wastewater treatment plants, as the most important sources for N and the wastewater treatment plants as the major source for P. Therefore, the internal load has a secondary role in nutrient input.
The budget also identified the levels of N and P retention and key storage reservoirs, with the great majority of nutrients transported from the catchment ending up sequestered in the lake’s sediments.
Our study revealed that although climatic conditions and depth are important factors in nutrient retention in lakes and reservoirs, in Lake Paranoá, retention of N and P is strongly influenced by input loads and hydraulic retention time. Therefore, the high amount of nutrient retention (especially P) can also occur in deep tropical reservoirs with high hydraulic retention time and high nutrient loads. These factors will assist in management decisions and direct actions to reduce N and P loading in the lake and control subsequent eutrophication. The N budget of Lake Paranoá clearly indicates that targeted measures to control N transport should be aimed at the southern tributaries and wastewater treatment plants, whereas managing P should additionally focus on reducing its transport from wastewater treatment plants.
The results presented indicate that the main actions for adequate management of the water quality of the Lake Paranoá for its multiples uses should be focused on the expansion of the Wastewater Treatment Plants as well as on the improvement of the treatment system. In addition, a public policy of greater control of urban and agricultural expansion should be established for the catchment area of the lake.
Author Contributions
Conceptualization, J.d.S.B.B. and V.R.B.; methodology, J.d.S.B.B., D.B.d.S., T.B.L. and V.R.B.; software, J.d.S.B.B. and V.R.B.; investigation, J.d.S.B.B., D.B.d.S., T.B.L.; data curation, J.d.S.B.B., D.B.d.S. and V.R.B.; writing—original draft preparation, J.d.S.B.B.; writing—review and editing, J.d.S.B.B. and V.R.B.
Funding
This research was funded by Federal District Foundation-FAPDF, number proc. 0193.000996/2015.
Acknowledgments
The authors would like to thank the Federal District Foundation-FAPDF for financial support under Project Contract no. 0193.000996/2015, CAESB for the provision of data from the wastewater treatment plants and tributary streamflow, CEB for authorizing access to the downstream dam spot and provision of downflow data, the Federal District Environmental Lacustrine Police Battalion for support on sediment sampling, Gilliard Nunes, of the Postgraduate Program on Environmental Technology and Water Resources, University of Brasília, for providing the cartographic database for land use and occupation of the Lake Paranoá catchment area and the Institute Brasília Environmental (Ibram) for lending the multiparametric probe used in this study. The English text of this paper has been revised by Sidney Pratt, Canadian, MAT (The Johns Hopkins University), RSAdip (Cambridge University).
Conflicts of Interest
The authors declare no conflict of interest.
References
- Wetzel, R.G.; Likens, G.E. Limnological Analysis, 2nd ed.; Springer: New York, NY, USA, 1991. [Google Scholar]
- Zamparas, M.; Zacharias, I. Restoration of eutrophic freshwater by managing internal nutrient loads. Sci. Total Environ. 2014, 496, 551–562. [Google Scholar] [CrossRef]
- Nikolai, S.J.; Dzialowski, A.R. Effects of internal phosphorus loading on nutrient limitation in a eutrophic reservoir. Limnologica 2014, 49, 33–41. [Google Scholar] [CrossRef]
- Waters, S.; Webster-Brown, J.G. The use of a mass balance phosphorus budget for informing nutrient management in shallow coastal lakes. J. Hydro-Environ. Res. 2016, 10, 32–49. [Google Scholar] [CrossRef]
- Codd, G.A.; Morrison, L.F.; Metcalf, J.S. Cyanobacterial toxins: Risk management for health protection. Toxicol. Appl. Pharmacol. 2005, 203, 264–272. [Google Scholar] [CrossRef]
- Havens, K.E.; Fukshima, T.; Xie, P.; Iwakuma, T.; James, R.T.; Takamura, N.; Hanazato, T.; Yamamoto, T. Nutrient dynamics and the eutrophication of shallow lakes Kasumigaura (Japan), Donghu (PR China), and Okeechobee (USA). Environ. Pollut. 2001, 111, 263–272. [Google Scholar] [CrossRef]
- Kõiv, T.; Nõges, T.; Laas, A. Phosphorus retention as a function of external loading, hydraulic turnover time, area and relative depth in 54 lakes and reservoirs. Hydrobiologia 2011, 660, 105–115. [Google Scholar] [CrossRef]
- Moosmann, L.; Gächter, R.; Müller, B.; Wüest, A. Is phosphorus retention in autochthonous lake sediments controlled by oxygen or phosphorus? Limnol. Oceanogr. 2006, 51, 763–771. [Google Scholar] [CrossRef]
- Ramírez-Zierold, J.A.; Merino-Ibarra, M.; Monroy-Ríos, E.; Olson, M.; Castillo, F.S.; Gallegos, M.E.; Vilaclara, G. Changing water, phosphorus and nitrogen budgets for Valle de Bravo reservoir, water supply for Mexico City Metropolitan Area. Lake Reserv. Manag. 2010, 26, 23–34. [Google Scholar] [CrossRef]
- Schernewski, G. Nutrient budgets, dynamics and storm effects in a eutrophic, stratified baltic lake. Acta Hydrochim. Hydrobiol. 2003, 31, 152–161. [Google Scholar] [CrossRef]
- Coppens, J.; Ozen, A.; Tavsanoglu, U.N.; Erdogan, S.; Levi, E.E.; Yozgatligil, C.; Jeppesen, E.; Beklioglu, M. Impact of alternating wet and dry periods on long-term seasonal phosphorus and nitrogen budgets of two shallow Mediterranean lakes. Sci. Total Environ. 2016, 563, 456–467. [Google Scholar] [CrossRef] [PubMed]
- Ul Solim, S.; Wanganeo, A. Excessive phosphorus loading to Dal Lake, India: Implications for managing shallow eutrophic lakes in urbanized watersheds. Int. Rev. Hydrobiol. 2008, 93, 148–166. [Google Scholar] [CrossRef]
- Garnier, J.; Leporcq, B.; Sanchez, N.; Philippon. Biogeochemical mass-balances (C, N, P, Si) in three large reservoirs of the Seine Basin (France). Biogeochemistry 1999, 47, 119–146. [Google Scholar]
- Morabito, G.; Rogora, M.; Austoni, M.; Ciampittiello, M. Could the extreme meteorological events in Lake Maggiore watershed determine a climate-driven eutrophication process? Hydrobiologia 2018, 824, 163–175. [Google Scholar] [CrossRef]
- Tomaszek, J.A.; Koszelnik, P. A simple model of nitrogen retention in reservoirs. Hydrobiologia 2003, 504, 51–58. [Google Scholar] [CrossRef]
- Nishri, A.; Hamilton, D.P. A mass balance evaluation of the ecological significance of historical nitrogen fluxes in Lake Kinneret. Hydrobiologia 2010, 655, 109–119. [Google Scholar] [CrossRef]
- Woldeab, B.; Beyene, A.; Ambelu, A. Seasonal and spatial variation of reservoir water quality in the southwest of Ethiopia. Environ. Monit. Assess. 2018, 190, 163. [Google Scholar] [CrossRef]
- Crowe, S.A.; O’Neill, A.H.; Katsev, S.; Hehanussa, P.; Haffner, G.D.; Sundby, B. The biogeochemistry of tropical lakes: A case study from Lake Matano, Indonesia. Limnol. Oceanogr. 2008, 53, 319–331. [Google Scholar] [CrossRef] [Green Version]
- Lewis, W.M. Tropical limnology. Ann. Rev. Ecol. Syst. 1987, 18, 159–184. [Google Scholar] [CrossRef]
- Reynolds, C.S.; Reynolds, S.N.; Munawar, I.F.; Munamar, M. The regulation of phytoplankton population dynamics in the world’s largest lakes. Aquat. Ecosyst. Heal. Manag. 2000, 3, 1–21. [Google Scholar] [CrossRef]
- Ferrante, J.E.T.; Rancan, L.; Braga Netto, P.; Meio, F. Olhares sobre o Lago Paranoá, 1st ed.; Fonseca, F.O., Braga Netto, P., Cavalvante, C.V., Eds.; Secretaria de Meio Ambiente e Recursos Hídricos: Brasília, Brasil, 2001; Volume 1, pp. 45–79.
- Projeções e Estimativas da População do Brasil e das Unidades da Federação. Available online: https://www.ibge.gov.br/apps/populacao/projecao/index.html (accessed on 12 February 2019).
- Braga, P.N. Sustentabilidade ameaçada. In Olhares Sobre o Lago Paranoá, 1st ed.; Fonseca, F.O., Braga Netto, P., Cavalvante, C.V., Eds.; Secretaria de Meio Ambiente e Recursos Hídricos: Brasília, Brasil, 2001; Volume 1, pp. 167–188. [Google Scholar]
- GDF. 3.1—Relatório do Meio Físico e Biótico; Zoneamento Ecológico-Econômico do (ZEE): Brasília, Brasil, 2009; pp. 1–172.
- Mar da Costa, N.Y.; Boaventura, G.R.; Mulholland, D.S.; Araújo, D.F.; Moreira, R.C.A.; Faial, K.C.F.; Bomfim, E.O. Biogeochemical mechanisms controlling trophic state and micropollutant concentrations in a tropical artificial lake. Environ. Earth Sci. 2016, 75, 854. [Google Scholar] [CrossRef]
- Kottek, M.; Grieser, J.; Beck, C.; Rudolf, B.; Rubel, F. World map of the Köppen-Geiger climate classification updated. Meteorol. Zeitschrift 2006, 15, 259–263. [Google Scholar]
- Levantamento da Geodiversidade. Projeto Atlas Pluviométrico do Brasil. Isoietas Anuais Médias. Período 1977 a 2006. Available online: http://www.cprm.gov.br/publique/media/hidrologia/mapas_publicacoes/atlas_pluviometrico_brasil/isoietas_totais_anuais_1977_2006.pdf (accessed on 6 April 2019).
- Nunes, G. Aplicação do modelo SWAT no estudo hidrológico e de qualidade de água da Bacia Hidrográfica do lago Paranoá—DF. Master’s Thesis, Universidade de Brasília, Brasília, Brazil, August 2016. [Google Scholar]
- Carmouze, J.-P.; Bellotto, V.R.; Maddock, J.; Romanazzi, A. A versatile in situ sediment pore water sampler. Mangroves Salt Marshes 1997, 1, 77–78. [Google Scholar] [CrossRef]
- American Public Health Association (APHA); American Water Works Association (AWWA); Water Environment Federation (WEF). Standard Methods for the Examination of Water and Wastewater, 21st ed.; American Public Health Association: Washington, DC, USA, 2005. [Google Scholar]
- Pellens, I.C.; Bellotto, V.R.; Kuroshima, K.N.; Abreu, J.G.N. Resultados preliminares de fósforo e suas formas nos Sedimentos da plataforma continental do Estado de Santa Catarina. Braz. J. Aquat. Sci. Technol. 1998, 2, 51–60. [Google Scholar] [CrossRef]
- Mentzafou, A.; Dimitriou, E. Science of the Total Environment Nitrogen loading and natural pressures on the water quality of a shallow Mediterranean lake. Sci. Total Environ. 2019, 646, 134–143. [Google Scholar] [CrossRef] [PubMed]
- Berner, R.A. Early Diagenesis: A theoretical Approach, 1st ed.; Princeton University Press: Princeton, NJ, USA, 1980. [Google Scholar]
- Klump, J.V.; Martens, C.S. Biogeochemical cycling in an organic rich coastal marine basin-II. Nutrient sediment-water exchange processes. Geochim. Cosmochim. Acta 1981, 45, 102–121. [Google Scholar] [CrossRef]
- Li, Y.-H.; Gregory, S. Diffusion of Ions in Sea Water and in Deep Sea Sediments. Geochim. Cosmochim. Acta 1974, 38, 703–714. [Google Scholar]
- Berner, R.A. Principles of Chemical Sedimentology, 1st ed.; MacGraw-Hi: New York, NY, USA, 1971. [Google Scholar]
- Torres, I.C.; Resck, R.P.; Pinto-Coelho, C.R. Mass balance estimation of nitrogen, carbon, phosphorus and total suspended solids in the urban eutrophic, Pampulha reservoir, Brazil. Acta Limnol. Bras. 2007, 19, 79–91. [Google Scholar]
- Morales-Marín, L.A.; Wheater, H.S.; Lindenschmidt, K.E. Assessment of nutrient loadings of a large multipurpose prairie reservoir. J. Hydrol. 2017, 550, 166–185. [Google Scholar] [CrossRef]
- Howarth, R.W.; Roxane, M.; Lane, J.; Cole, J.J. Nitrogen fixation in freshwater, estuarine, and marine ecosystems. 1. Rates and importance. Limnol. Ocean. 1988, 33, 669–687. [Google Scholar] [CrossRef]
- Cavalcante, H.; Araújo, F.; Noyma, N.P.; Becker, V. Phosphorus fractionation in sediments of tropical semiarid reservoirs. Sci. Total Environ. 2018, 620, 1022–1029. [Google Scholar] [CrossRef]
- Cook, P.L.M.; Aldridge, K.T.; Lamontagne, S.; Brookes, J.D. Retention of nitrogen, phosphorus and silicon in a large semi-arid riverine lake system. Biogeochemistry 2010, 99, 49–63. [Google Scholar] [CrossRef]
- Matson, P.A.; McDowell, W.H.; Townsend, A.R.; Vitousek, P.M. The globalization of N deposition: Ecosystem\nconsequences in tropical environments. Biogeochemistry 1999, 46, 67–83. [Google Scholar] [CrossRef]
- Søndergaard, M.; Jensen, J.P.; Jeppesen, E. Role of sediment and internal loading of phosphorus in shallow lakes. Hydrobiologia 2003, 506–509, 135–145. [Google Scholar]
- Saraiva, A.L.L. Análise dos Impactos da Dinâmica de Sólidos e de Nutrientes na Qualidade da Água de Ambiente Lêntico Utilizado no Abastecimento de Comunidades Amazônicas. Ph.D. Thesis, Universidade Federal do Pará, Belém, Brazil, August 2012. [Google Scholar]
- Cope, V.; Mercante, C.T.J.; Carmo, C.F.; Sendacz, S.; Monteiro Junior, A.J. Mass balance of nutrients during the filling phase of two reservoirs of Sistema Produtor Alto Tietê (SPAT). Acta Sci. Biol. Sci. 2011, 33, 49–57. [Google Scholar] [CrossRef]
- Miranda, S.A.; Matvienko, B. Rain and groundwater as phosphorus sources of a small reservoir. Lakes Reserv. Res. Manag. 2003, 8, 27–30. [Google Scholar] [CrossRef]
- Bezerra, A.F.M.; Becker, V.; Mattos, A. Balanço de Massa de Fósforo Total e o Estado Trófico em Reservatórios do Semiárido Brasileiro. Rev. Bras. Recur. Hídricos 2014, 19, 67–76. [Google Scholar] [CrossRef]
- Oliveira, J.N.P. A Influência da Poluição Difusa e do Regime Hidrológico Peculiar do Semiarido na Qualidade da Água de um Reservatório Tropical. Master’s Thesis, Universidade Federal do Rio Grande do Norte, Natal, Brazil, 2012. [Google Scholar]
- Vidal, T.F.; Capelo, J.N. Dinâmica de nitrogênio e fósforo em reservatório na região semiárida utilizando balanço de massa. Rev. Bras. Eng. Agríc. Ambient. 2014, 18, 402–407. [Google Scholar] [CrossRef]
- Henry, R.; Do Carmo, C.F.; Bicudo, D.D.C. Trophic status of a Brazilian urban reservoir and prognosis about the recovery of water quality. Acta Limnol. Bras. 2004, 16, 251–262. [Google Scholar]
- Kenney, W.F.; Whitmore, T.J.; Buck, D.G.; Brenner, M.; Curtis, J.H.; Di, J.J.; Kenney, P.L.; Lchelske, C.L. Whole-basin, mass-balance approach for identifying critical phosphorus-loading thresholds in shallow lakes. J. Paleolimnol. 2014, 51, 515–528. [Google Scholar] [CrossRef]
- Gibson, C.E.; Wang, G.; Foy, R.H.; David Lennox, S. The importance of catchment and lake processes in the phosphorus budget of a large lake. Chemosphere 2000, 42, 215–220. [Google Scholar] [CrossRef]
- Nõges, P. Water and nutrient mass balance of the partly meromictic temperate Lake Verevi. Hydrobiologia 2005, 547, 21–31. [Google Scholar] [CrossRef]
Figure 1.
Localization of study area and sampling points.

Figure 2.
Land use and occupation of Lake Paranoá catchment area (adapted) [28].
Figure 2.
Land use and occupation of Lake Paranoá catchment area (adapted) [28].

Figure 3.
Monthly rainfall and air temperature in the Lake Paranoá catchment area.

Figure 4.
Storage of N and P in Lake Paranoá.

Figure 5.
Annual total organic nitrogen (TON) budget for Lake Paranoá.

Figure 6.
Annual dissolved inorganic nitrogen (DIN) budget for Lake Paranoá.

Figure 7.
Annual total organic phosphorus (TOP) budget for Lake Paranoá.

Figure 8.
Annual PO43−-P budget for Lake Paranoá.


Table 1.
Mean flows, mean concentrations and standard deviations of nitrogen and phosphorus in the streams (input), effluent from WWTPs (input), downstream dam (output) and lake for the wet and dry seasons.
Table 1.
Mean flows, mean concentrations and standard deviations of nitrogen and phosphorus in the streams (input), effluent from WWTPs (input), downstream dam (output) and lake for the wet and dry seasons.
| Input/Output/Lake | Flow (m3 s−1) | NH4+-N (mg L−1) | NO2−-N (mg L−1) | NO3−-N (mg L−1) | TON (mg L−1) | PO43−-P (mg L−1) | TOP (mg L−1) | |||||||
|---|---|---|---|---|---|---|---|---|---|---|---|---|---|---|
| Wet | Dry | Wet | Dry | Wet | Dry | Wet | Dry | Wet | Dry | Wet | Dry | Wet | Dry | |
| Torto Stream | 0.6 | 0.090 | 0.038 ± 0.02 | 0.024 ± 0.02 | 0.010 ± 0.01 | 0.004 ± 0.00 | 0.30 ± 0.18 | 0.24 ± 0.07 | 1.3 ± 1.19 | 1.5 ± 1.10 | 0.002 ± 0.00 | <DL | 0.005 ± 0.01 | 0.014 ± 0.02 |
| Bananal Stream | 1.4 | 0.83 | 0.007 ± 0.00 | 0.006 ± 0.00 | 0.002 ± 0.00 | 0.002 ± 0.00 | 0.032 ± 0.02 | 0.059 ± 0.02 | 2.0 ± 1.25 | 1.9 ± 1.47 | 0.002 ± 0.00 | 0.002 ± 0.00 | 0.008 ± 0.01 | <DL |
| Riacho Fundo Stream | 5.1 | 2.1 | 0.056 ± 0.05 | 0.257 ± 0.31 | 0.039 ± 0.02 | 0.052 ± 0.03 | 0.99 ± 0.31 | 1.5 ± 0.55 | 0.88 ± 1.22 | 0.67 ± 1.03 | 0.002 ± 0.00 | 0.006 ± 0.00 | 0.024 ± 0.02 | 0.009 ± 0.01 |
| Gama Stream | 2.0 | 0.64 | 0.011 ± 0.00 | 0.015 ± 0.01 | 0.002 ± 0.00 | 0.001 ± 0.00 | 0.17 ± 0.16 | 0.087 ± 0.03 | 1.7 ± 1.03 | 1.8 ± 1.27 | 0.002 ± 0.00 | 0.002 ± 0.00 | 0.008 ± 0.01 | 0.003 ± 0.01 |
| WWTP North | 0.45 | 0.46 | 2.5 ± 2.59 | 7.3 ± 3.97 | NA | NA | NA | NA | NA | NA | 2.6 ± 2.60 | 4.5 ± 3.97 | 0.35 ± 0.08 | 0.31 ± 0.10 |
| WWTP South | 1.4 | 1.2 | 7.5 ± 3.98 | 5.8 ± 1.37 | NA | NA | NA | NA | NA | NA | 7.6 ± 3.98 | 4.4 ± 3.14 | 0.36 ± 0.09 | 0.22 ± 0.05 |
| Downstream dam | 13 | 3.0 | 0.038 ± 0.04 | 0.19 ± 0.20 | 0.009 ± 0.01 | 0.030 ± 0.02 | 0.18 ± 0.13 | 0.23 ± 0.03 | 1.7 ± 1.04 | 2.2 ± 1.85 | 0.002 ± 0.00 | <DL | 0.005 ± 0.01 | 0.003 ± 0.00 |
| Lake | - | - | 0.122 ± 0.14 | 0.29 ± 0.07 | 0.025 ± 0.04 | 0.033 ± 0.03 | 0.20 ± 0.19 | 0.051 ± 0.06 | 2.1 ± 1.43 | 2.9 ± 0.92 | <DL | <DL | 0.021 ± 0.03 | 0.036 ± 0.05 |
WWTP—wastewater treatment plant. TON–total organic nitrogen. TOP–total organic phosphorus. DL: detection Limit (DL = 0.002 mg L−1). NA—data not available.
Table 2.
Nitrogen and phosphorus load imported from streams (input), WWTPs (input), internal load (input) and discharged through the dam (output).
Table 2.
Nitrogen and phosphorus load imported from streams (input), WWTPs (input), internal load (input) and discharged through the dam (output).
| Input/Output | DIN (Mg) | TON (Mg) | PO43−-P (Mg) | TOP (Mg) | ||||||||
|---|---|---|---|---|---|---|---|---|---|---|---|---|
| Wet | Dry | Annual | Wet | Dry | Annual | Wet | Dry | Annual | Wet | Dry | Annual | |
| Torto Stream | 3.3 | 0.25 | 3.53 (0.86%) | 12 | 1.0 | 13 (6.4%) | 0.019 | ND | 0.02 (0.01%) | 0.051 | 0.013 | 0.06 (0.37%) |
| Bananal Stream | 0.9 | 0.59 | 1.50 (0.36%) | 36 | 12 | 49 (23%) | 0.034 | 0.017 | 0.05 (0.02%) | 0.158 | ND | 0.17 (0.97%) |
| Riacho Fundo Stream | 86 | 40 | 125 (30.4%) | 70 | 11 | 81 (39%) | 0.13 | 0.13 | 0.27 (0.10%) | 1.9 | 0.20 | 2.10 (12.3%) |
| Gama Stream | 5.7 | 0.69 | 6.37 (1.55%) | 55 | 9.2 | 65 (31%) | 0.052 | 0.015 | 0.07 (0.03%) | 0.24 | 0.023 | 0.26 (1.54%) |
| WWTP North | 17 | 35 | 52.9 (12.8%) | NA | NA | NA | 18 | 21 | 40 (15.3%) | 2.5 | 1.5 | 3.93 (23%) |
| WWTP South | 161 | 62 | 222 (53.9%) | NA | NA | NA | 163 | 56 | 218 (84.5%) | 7.7 | 2.8 | 10.5 (62%) |
| Internal load | NA | 0.026 | 0.026 (0.01%) | NA | NA | NA | 0.12 | NA | 0.12 (0.04) | NA | NA | NA |
| Total input | 274 | 138 | 412 (100%) | 174 | 34 | 207 (100%) | 181 | 77 | 258 (100%) | 13 | 4.6 | 17.1 (100%) |
| Output | 48 | 14 | 62.5 (15.2%) | 296 | 51 | 347 (167%) | 0.44 | 0.042 | 0.48 (0.19%) | 1.1 | 0.11 | 1.23 (7.2%) |
WWTP—wastewater treatment plant. Numbers in italics represent only NH4+-N (WWTPs and internal load). DIN: dissolved inorganic nitrogen. NA: data not available. ND: not detect.
Table 3.
Annual nitrogen and phosphorus budget for Lake Paranoá during the wet and dry seasons.
| Parameter | Wet Season | Dry Season | ||||
|---|---|---|---|---|---|---|
| Input (Mg) | Output (Mg) | Retention (Mg) | Input (Mg) | Output (Mg) | Retention (Mg) | |
| NH4+-N | 184 | 7.9 | 176 (96%) | 103 | 6.0 | 97 (94%) |
| NO2−-N | 3.3 | 1.8 | 1.5 (45%) | 1.2 | 0.97 | 0.22 (19%) |
| NO3−-N | 87 | 39 | 48 (56%) | 34 | 7.2 | 27 (79%) |
| TON | 174 | 296 | −122 (70%) | 34 | 51 | −17 (52%) |
| PO43−-P | 181 | 0.44 | 181 (100%) | 77 | 0.042 | 77 (100%) |
| TOP | 13 | 1.1 | 11 (91%) | 4.6 | 0.11 | 4.5 (98%) |
Positive values indicated retention and negative values indicated exportation.
Table 4.
General features, input, output, and nutrients (total nitrogen and total phosphorus) retention in lakes and reservoirs in this study and worldwide.
Table 4.
General features, input, output, and nutrients (total nitrogen and total phosphorus) retention in lakes and reservoirs in this study and worldwide.
| Site | Location | Climatic Region | Mean Depth (m) | Hydraulic Retention Time (Year) | TN (Mg Year−1) | TP (Mg Year−1) | ||||
|---|---|---|---|---|---|---|---|---|---|---|
| Input (I) | Output (O) | Retention (=I−O) | Input (I) | Output (O) | Retention (=I−O) | |||||
| This study | Brazil | Aw | 14 | 2.71 | 620 | 410 | 210 (34%) | 275 | 1.6 | 273 (99%) |
| Água Preta [44] | Brazil | Af | NA | 0.64 | 38.8 | 27 | 11.8 (30%) | 7.9 | 5.1 | 2.8 (35%) |
| Baldeggersee [8] | Switzerland | Dfb | NA | 4.0 | NA | NA | NA | 11.2 | 6.8 | 4.4 (39%) |
| Greifenseen [8] | Switzerland | Dfb | NA | 1.2 | NA | NA | NA | 42.7 | 38.8 | 3.9 (9.1%) |
| Hallwilersee [8] | Switzerland | Dfb | NA | 3.9 | NA | NA | NA | 14.6 | 10.8 | 3.8 (26%) |
| Pfaffikersee [8] | Switzerland | Dfb | NA | 2.1 | NA | NA | NA | 6.8 | 4.9 | 1.9 (28%) |
| Sempachersee [8] | Switzerland | Dfb | NA | 15.3 | NA | NA | NA | 8.9 | 4.2 | 4.7 (53%) |
| Belau [10] | Germany | Cfb | NA | 0.73 | 35.42 | 32.67 | 2.75 (7.8%) | 1.25 | 1.11 | 0.14 (11.2%) |
| Biritiba [45] | Brazil | Cwb | NA | 0.95 | 22.5 | 0.4 | 22.1 (98%) | 1.5 | 0.5 | 1.0 (67%) |
| Paraitinga [45] | Brazil | Cwb | NA | 0.48 | 25 | 15 | 10 (40%) | 1.4 | 0.9 | 0.5 (36%) |
| Broa [46] | Brazil | Cwa | 3.0 | 0.08 | NA | NA | NA | 3260 | 2765 | 495 (15%) |
| Cruzeta [47] | Brazil | Bsh | 3.8 | 0.33 | NA | NA | NA | 10.18 | 4.05 | 6.13 (60%) |
| Gargalheiras [47] | Brazil | Bsh | 5.5 | 1.27 | NA | NA | NA | 6.13 | 0.26 | 5.87 (96%) |
| Dal [12] | India | Dsb | 0.9 | NA | NA | NA | NA | 88.1 | 59 | 29.1 (33%) |
| Donghu [6] | China | Cfa | 2.2 | 0.43 | 1480 | 585 | 895 (60%) | 95 | 10 | 85 (89%) |
| Kasumigaura [6] | Japan | Cfa | 4.0 | 0.57 | 3890 | 1193 | 2697 (69.3%) | 220 | 78 | 142 (64%) |
| Okeechobee [6] | USA | Cfa | 2.7 | 3.8 | 5554 | 2986 | 2568 (46%) | 426 | 148 | 278 (65%) |
| Dourado [48] | Brazil | Bsh | 3.0 | 0.83 | NA | NA | NA | 2.0 | 0.95 | 1.05 (52%) |
| Gavião [49] | Brazil | Aw | NA | NA | 289.5 | 168.1 | 121.4 (42%) | 63.21 | 35.15 | 28.06 (44%) |
| Forsyth [4] | New Zealand | Cfb | NA | 0.15 | NA | NA | NA | 9.14 | 2.78 | 6.36 (70%) |
| Garças [50] | Brazil | Cwa | 2.1 | 0.19 | 37.16 | 5.52 | 31.63 (85%) | 6.52 | 2.56 | 3.96 (61%) |
| Koumoundorou [31] | Greece | Csa | 1.0 | NA | 4012 | 0.154 | 3858 (96%) | NA | NA | NA |
| Locholoosa [51] | USA | Cfa | 2.1 | 0.74 | NA | NA | NA | 3.22 | 1.47 | 1.75 (54%) |
| Lough Neagh [52] | Ireland | Cfb | 8.9 | 1.27 | NA | NA | NA | 509 | 323 | 186 (36%) |
| Pampulha [37] | Brazil | Cwa | 4.1 | NA | 67.39 | 23.79 | 43.60 (65%) | 9.14 | 1.74 | 7.4 (81%) |
| Valle de Bravo [9] | Mexico | Cwb | 21.1 | NA | 591.8 | 319.7 | 272.1 (46%) | 120.8 | 26.2 | 94.6 (78%) |
Aw: Savannah climate. Af: Equatorial rainforest climate. Bsh: Hot semi-arid climate. Cfa: Humid subtropical climate. Cfb: Temperate oceanic climate. Csa: Hot-summer Mediterranean climate. Cwa: Monsoon-influenced humid subtropical climate. Cwb: Subtropical highland climate. Dfb: Warm-summer humid continental climate. Dsb: Mediterranean-influenced warm-summer humid continental climate. NA—data not available. Data in italics indicate DIN.
© 2019 by the authors. Licensee MDPI, Basel, Switzerland. This article is an open access article distributed under the terms and conditions of the Creative Commons Attribution (CC BY) license (http://creativecommons.org/licenses/by/4.0/).
Share and Cite
MDPI and ACS Style
Barbosa, J.d.S.B.; Bellotto, V.R.; da Silva, D.B.; Lima, T.B. Nitrogen and Phosphorus Budget for a Deep Tropical Reservoir of the Brazilian Savannah. Water 2019, 11, 1205. https://doi.org/10.3390/w11061205
AMA Style
Barbosa JdSB, Bellotto VR, da Silva DB, Lima TB. Nitrogen and Phosphorus Budget for a Deep Tropical Reservoir of the Brazilian Savannah. Water. 2019; 11(6):1205. https://doi.org/10.3390/w11061205
Chicago/Turabian StyleBarbosa, Jackeline do S. B., Valéria R. Bellotto, Damiana B. da Silva, and Thiago B. Lima. 2019. "Nitrogen and Phosphorus Budget for a Deep Tropical Reservoir of the Brazilian Savannah" Water 11, no. 6: 1205. https://doi.org/10.3390/w11061205
Note that from the first issue of 2016, this journal uses article numbers instead of page numbers. See further details here.