Effects of Cemented Porous Media on Temporal Mixing Behavior of Conservative Solute Transport


School of Earth Sciences and Engineering, Hohai University, Nanjing 210098, China
*
Authors to whom correspondence should be addressed.
Water 2019, 11(6), 1204; https://doi.org/10.3390/w11061204
Submission received: 26 April 2019
/
Revised: 27 May 2019
/
Accepted: 6 June 2019
/
Published: 9 June 2019
(This article belongs to the Section Hydrology)
Abstract
:The cementation of porous media leads to the variation of the pore space and heterogeneity of the porous media. In this study, four porous media (PM1, PM2, PM3, and PM4) with the different radii of solid grains were generated to represent the different cementation degrees of the porous media. The direct simulations of flow and conservative solute transport in PM1–4 were conducted to investigate the influence of the cemented porous media and Peclet number (Pe) on the temporal mixing behavior. Two metrics, scalar dissipation rates (SDR) and dilution index, were employed to quantify the temporal mixing behavior. It was found that the spatial velocity variability of the flow field was enhanced as cementation degree increased. The results of the coefficient of velocity variation () increased from 0.943 to 2.319 for PM1–4. A network consisted of several preferential flow paths was observed in PM1–4. The preferential flow enhanced the mixing of the conservative solute but had a negative influence on the mixing of the solute plume when the cemented solid grains formed several groups, and there were some stagnant regions where the flow was almost immobile. As the Pe increased, for PM1–3, the exponent of the best-fitting power law of the global SDR decreased. At the case of Pe = 400, the slope of the global SDR reduced to around −1.9. In PM4 where the preferential flow was enhanced by the cemented solid grains, the slope of the global SDR increased as the Pe increased. The global SDR results indicated that the temporal mixing behavior followed a Fickian scaling () in the early stage (Pv < 0.05), while the mixing behavior turned to be non-Fickian in the late stage. The transition time from the Fickian scaling to the non-Fickian scaling was found to be sensitive to the cementation degree of the porous media.
1. Introduction
The solute transport in porous media plays an important role in subface environment problems (e.g., contaminant degradation [1], nuclear waste disposal [2], and bioremediation [3]). In recent decades, the investigation of dilution and mixing processes in porous media has been focused on by the scholars in various fields [4,5,6,7]. The characterization of the spreading and mixing processes of the conservative solute is instrumental in understanding and assessing reactive solute transport, which is necessary for studying complex chemical biological reaction-transport in groundwater. Although many studies [8,9] have provided new insights into the mechanisms and properties of the mixing behavior at the Darcy scale or the larger field scale, little attention has been focused on porous media at the pore scale. There is always an influence of smaller-scale processes on larger scale behaviors [10]. Therefore, understanding and evaluating mixing processes at pore-scale with suitable methods is very significant [11].
The spatial heterogeneities of the pore space in aquifers lead to complex fluid flow and anomalous solute transport. The occurrence of preferential flow paths and/or cementations, which can be found in several systems, result in the non-Fickian solute transport. The cementation of solid grains is ubiquitous in natural soil and is one of the most common reasons for the variation of pore space and heterogeneity of the porous media. In many laboratory and field scale studies [12,13,14,15], results show that the solute transport followed the non-Fickian transport. By fitting the experimentally measured or directly simulated breakthrough curves of solute plumes with continuous-time random walk (CTRW) models, some studies [16,17,18] indicated a strong link between the non-Fickian transport and heterogeneity of porous media. The varied geometry of pore channels and the cementation of solid grains are very common in natural solids, resulting in the heterogeneity of porous media. Previous studies indicated that the characteristics of pore channels such as connectivity or pore particle distribution could affect the flow field and solute transport processes [19,20]. The evolution of solute mixing in porous media with different degrees of heterogeneity is caused by the changes in pore channel geometry and solid grains due to the cementation of porous media [17]. However, little attention has been focused on this problem until now.
For the heterogeneous system, the flow velocity distribution in the porous media is a fundamental issue for understanding the mixing behavior of solute plume [21]. As the mixing process is highly influenced by the flow field [22,23], molecular diffusion causes the solute molecule movement between streamlines and enhances mixing. Some recent studies characterized topological [24] and kinematic [25] features of the flow field to explore the influence of the flow field on the mixing behavior of the solute plume. In many types of research in contaminant transport, insufficient mixing could restrict mass transformation or transformation rates of contaminants. The conservative solute transport could be considered as a process composed of spreading and mixing. However, the difference between the spreading and mixing needs to be distinguished in detail [26]. Spreading is the change of solute plume shape associated with the deformation and stretching, which are caused by the variability of the flow field. Mixing indicates concentration redistribution and trends to be uniform inside the solute plume. Many approaches have been proposed to quantify and describe the mixing behavior. In homogenous porous media, second central spatial moments can be adopted as a good measure for quantifying mixing. However, it can’t accurately reflect the mixing (or dilution) processes in the heterogeneous system [27]. Kitanidis [28] proposed the dilution index that measures the volume occupied by the solute plume. Rolle et al. [27] proposed a flux-related dilution index based on the concept of dilution index to quantify dilution in steady-state flow with a continuous injection mode. Kapoor and Kitanidis [29] used concentration variance to quantify the mixing. Several scholars quantified the mixing in subsurface problems by the scalar dissipation rate (SDR), which was proposed to describe the turbulent flow and combustion originally. Mixing at pore-scale is a necessary condition for the reaction between different dissolved compounds [28,30]. Thus, quantification of mixing at pore-scale is a key to understanding and predicting the process of contaminant transport or reaction.
The main goal of this study is to investigate the influence of the cemented porous media and Peclet number (Pe) on the mixing process of conservative solute in the different cemented porous media. Four pore-scale domains with the distinct pore channel morphology were considered to represent the different degrees of the cemented porous media and named as PM1, PM2, PM3, and PM4, respectively. The computational fluid dynamics (CFD) simulations of the flow field and solute transport in the porous media were performed and effectively determined the effect of characteristics of pore channel on the flow field and the mixing behavior of conservative solute. Solute mixing processes in the different porous media (e.g., PM1–4) were quantitively analyzed by both the SDR and dilution index.
2. Materials and Methods
2.1. Generation of Cemented Porous Media
Due to the complexity of the natural porous media, it is difficult to characterize the flow and solute transport. Although many numerical simulation methods have been greatly developed in recent years, pore-scale direct simulation of flow and solute transport in three-dimensional porous media is still a challenge. However, two-dimensional pore-scale simulation can also capture most of the physical processes and features [31]. In this paper, a two-dimensional porous medium model with the given porosity was developed to simulate the fluid flow and solute transport.
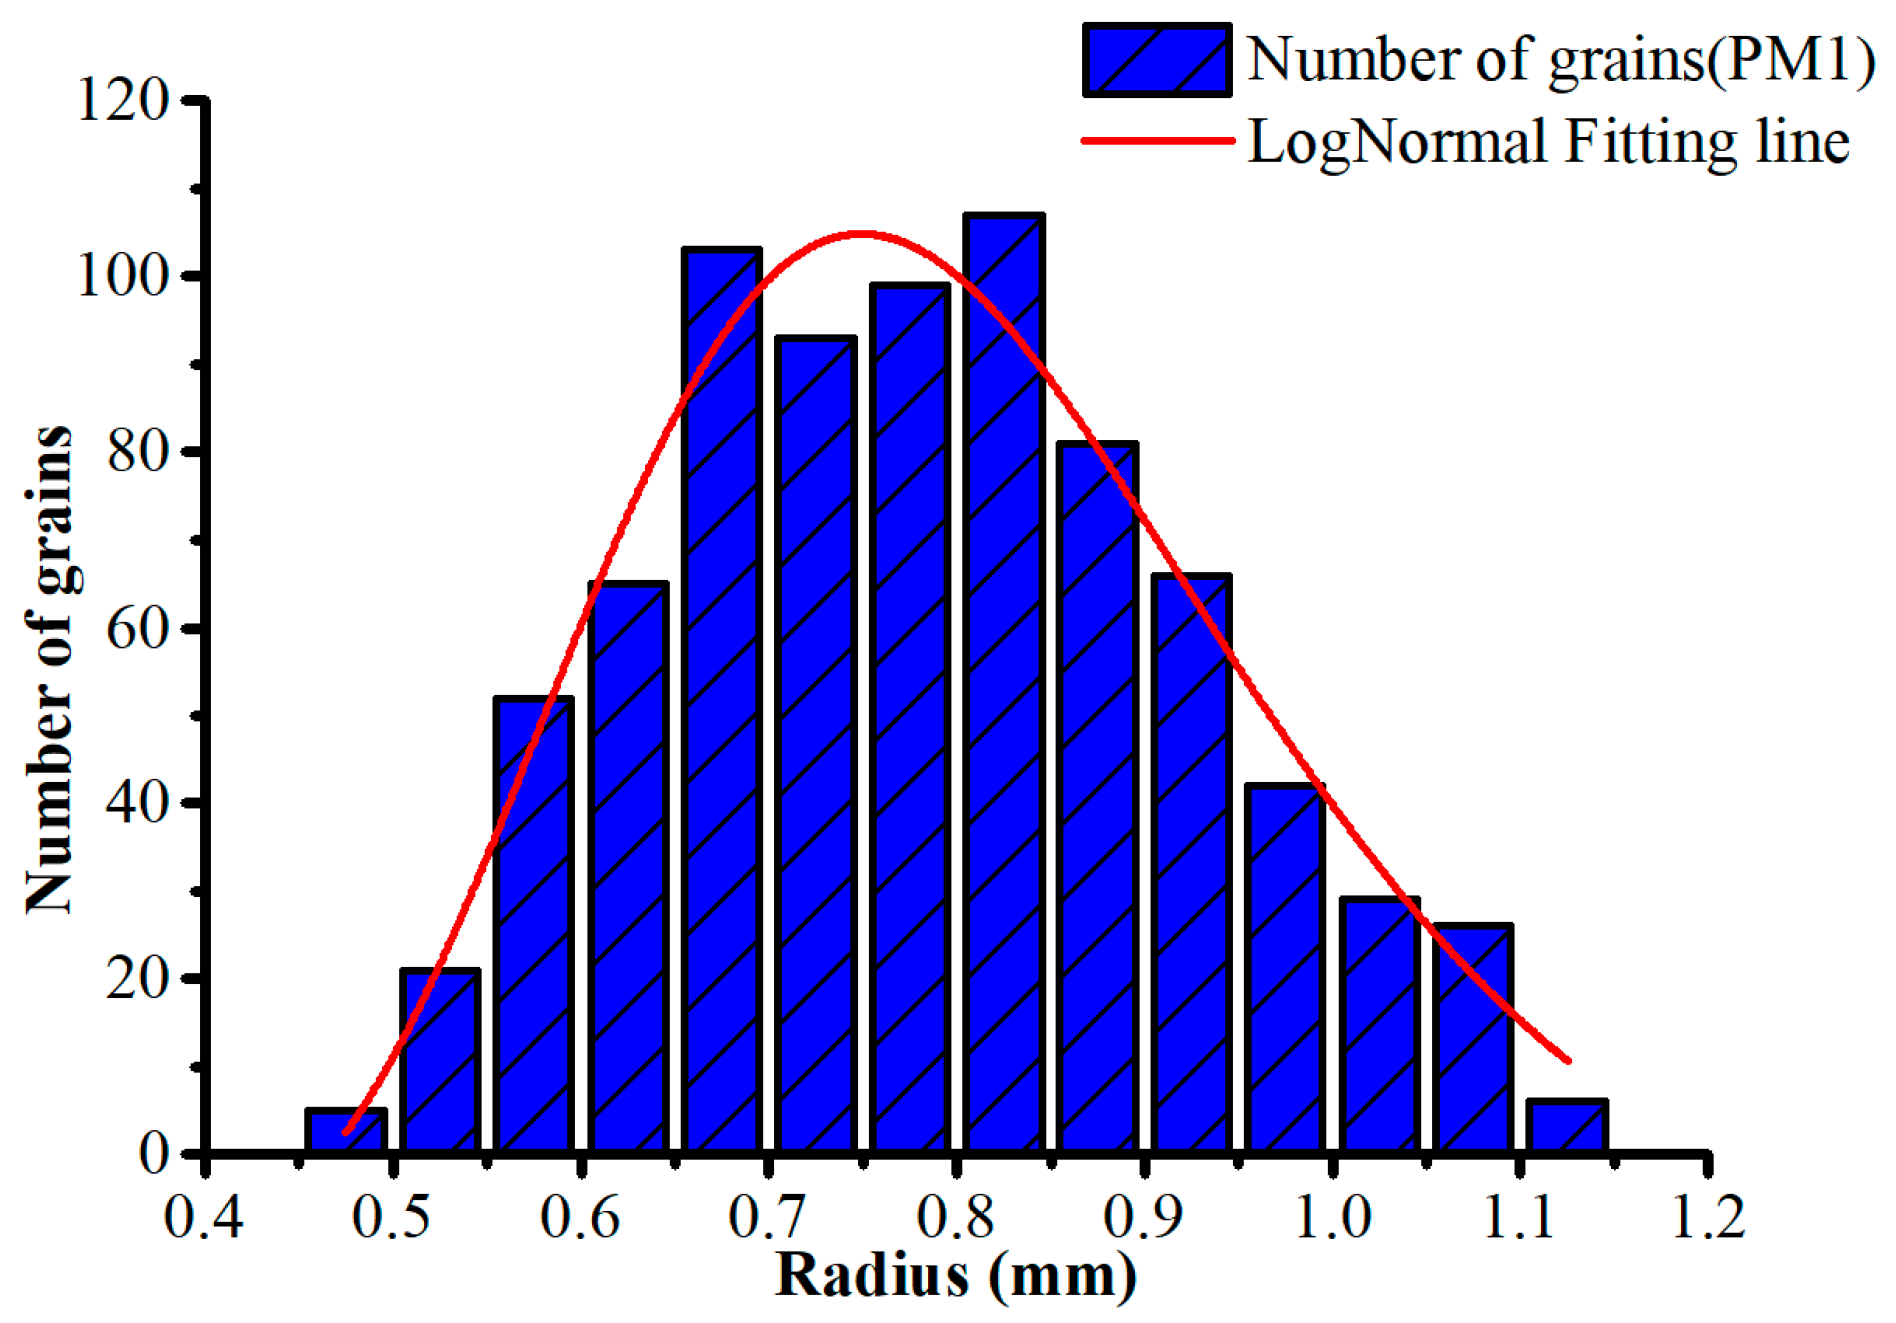
In certain two-dimensional zones, circular particles with the different radii are generated to represent solid grains. By using Matlab programming, an array that represents solid grains’ random radii is generated first. The random radius distribution of the generated solid grains is assumed to follow the lognormal distribution, which is consistent with the previous study [32]. The number of solid grains n is related to the area of the zone and target porosity of porous medium (), where S is the area of the zone, is the target porosity, and is the mean radii). Second, the solid grains with random radius are continuously generated in the zone one by one. To achieve this goal, the location of grain is determined by using a random procedure, which is used to generate the coordinate of the grain in the zone. It should need to be noted that the solid grains must be generated in the zone in order of radius from large to small, which could improve efficiency. Third, the real-time porosity was calculated as a grain was generated in the zone. The porosity of the generated solid grains in the two-dimensional domain is defined as
where n is the number of solid grains, is the radius of th solid grain, is the area of the part of solid grain beyond the boundary, and is the area of the two-dimensional zone where the solid grains are generated. Until the porosity (∅) reached the target value, the porous medium was obtained. Then, the data of particles’ locations and radii are imported into COMSOL for next work.
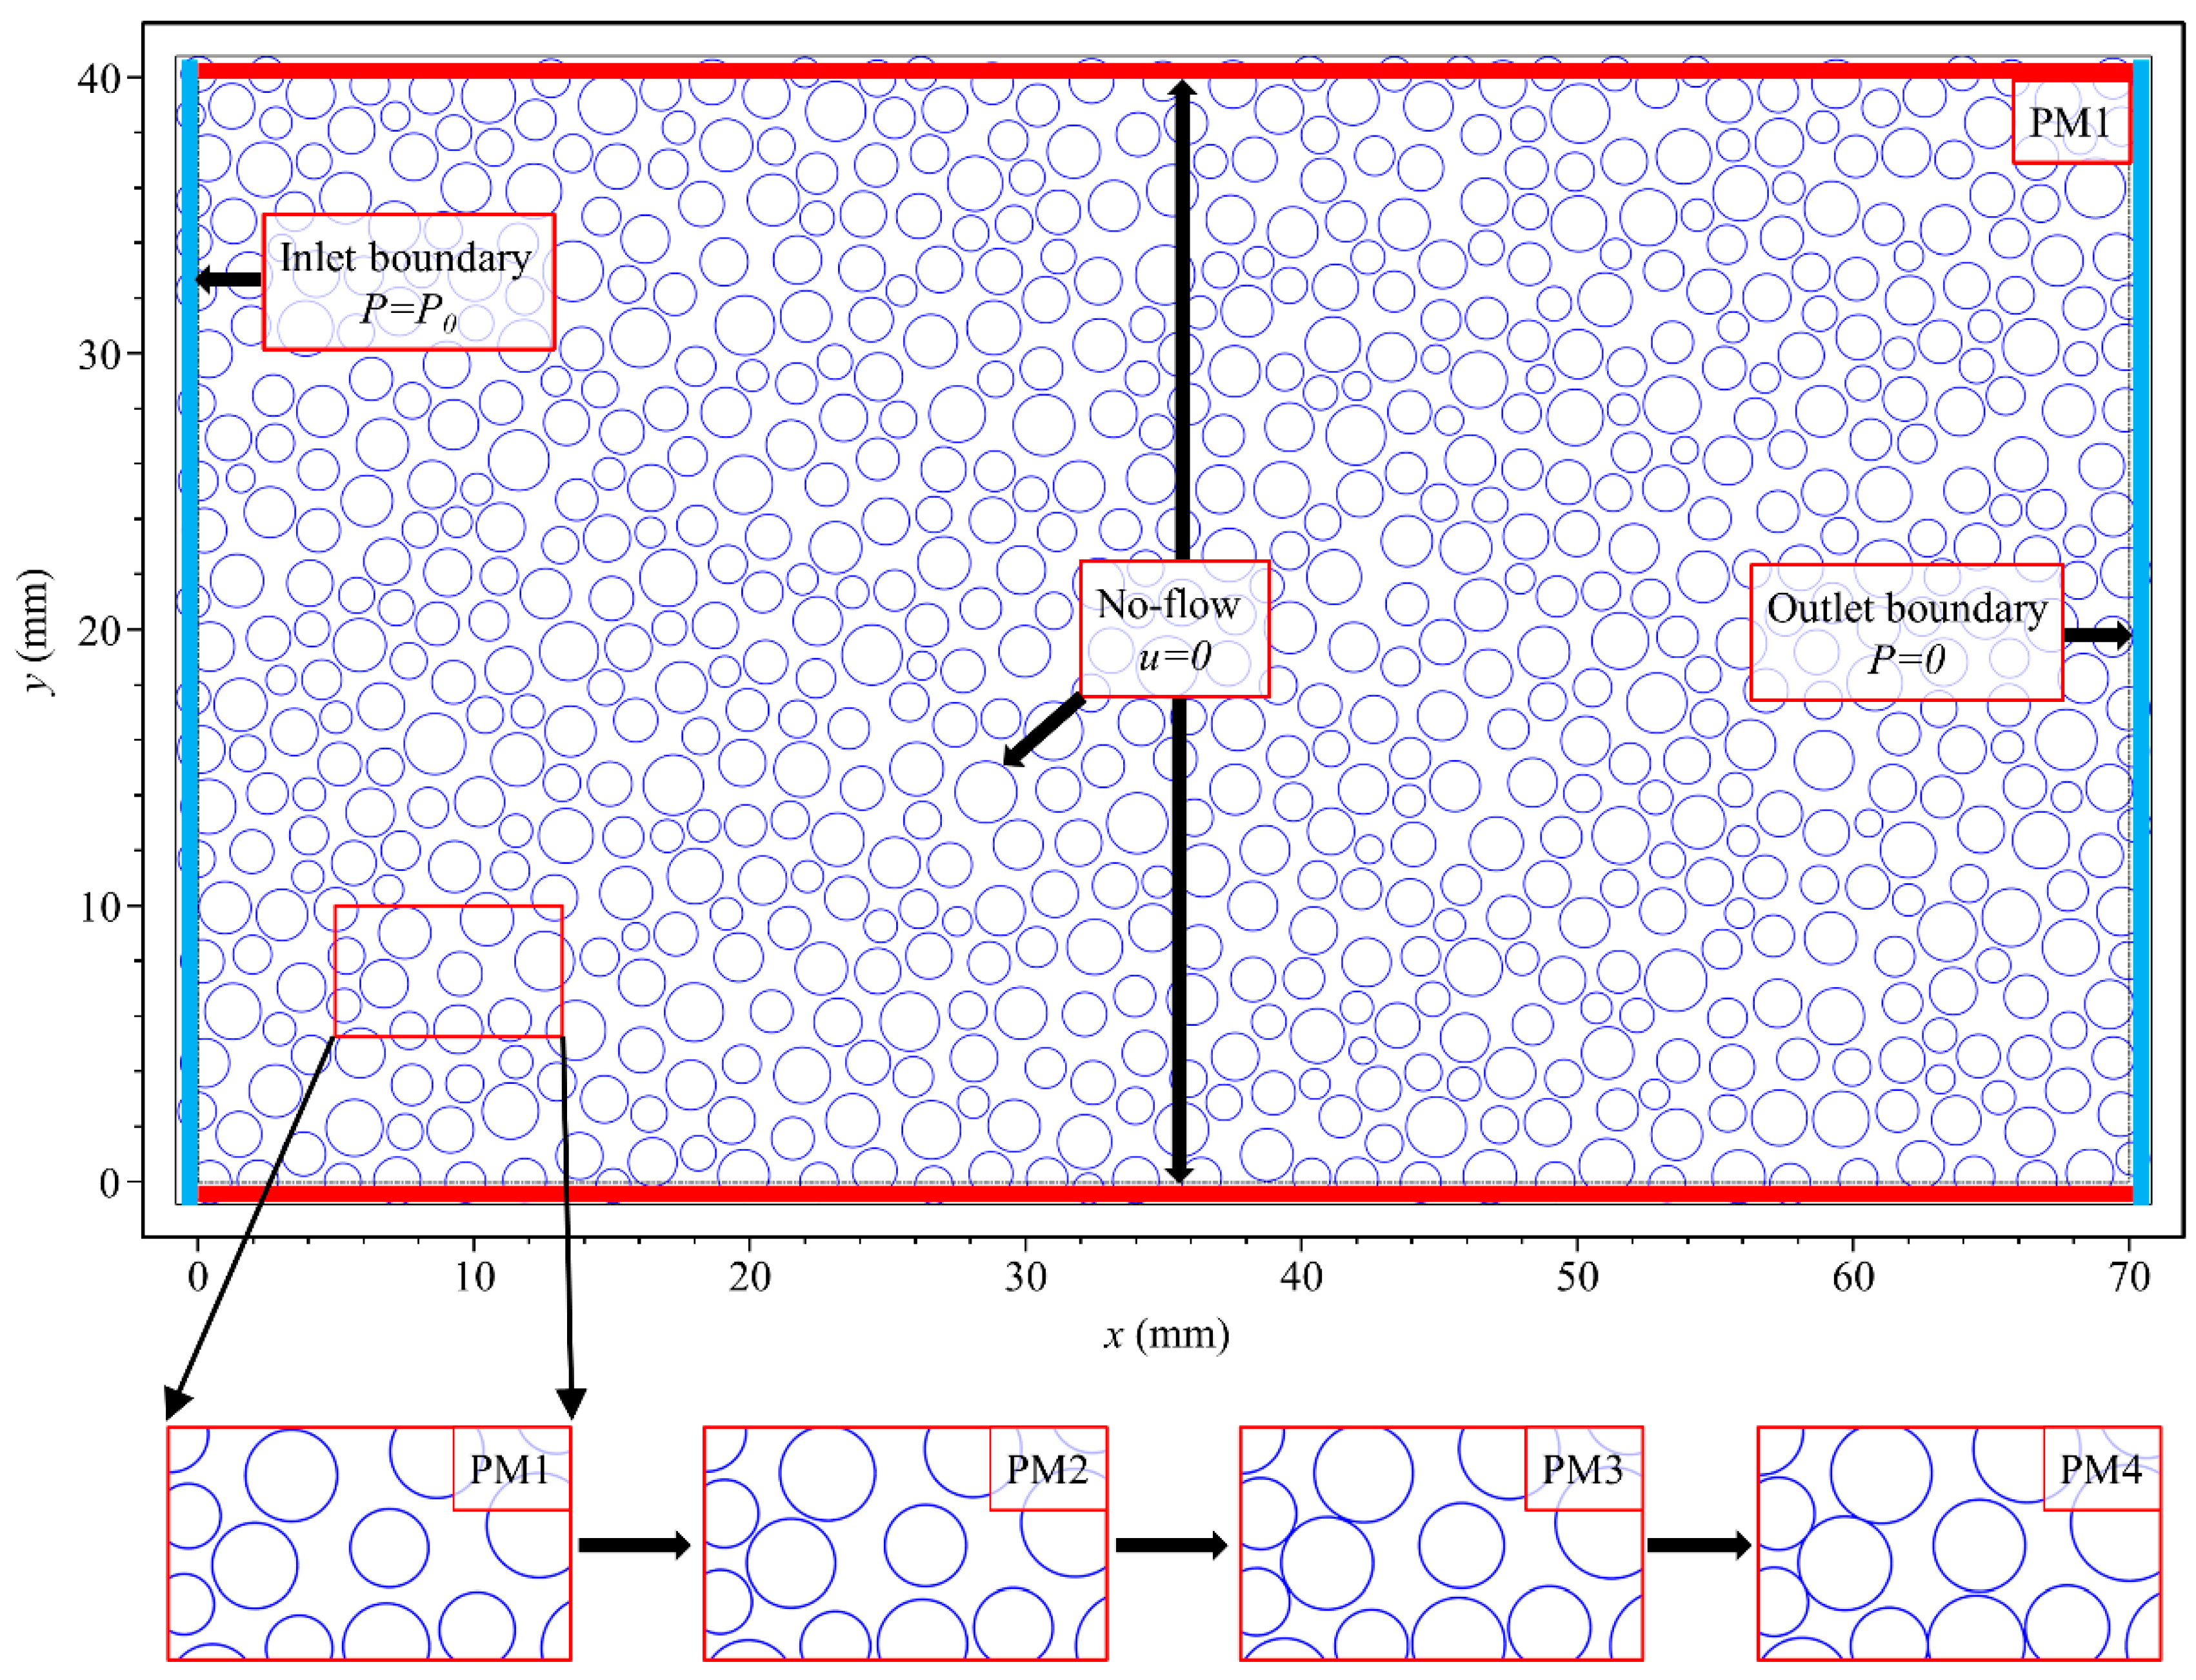
In this study, 795 solid grains were randomly distributed in a two-dimensional domain of 70 × 40 mm2, as shown in Figure 1. The corresponding porosity of the generated solid grains in this two-dimensional domain was 0.45. It should be mentioned that a checking algorithm during the random distribution process of the solid grains was used to avoid the overlapping solid grains. In addition, to obtain the different degrees of the cementation in the same porous media model, we assumed that a minimum distance between any two solid grains was set to be one-fifth of the mean radius. As can be observed in Figure 1, the solid grains were totally free and non-overlapping. The solid grains’ mean radius and the coefficient of variation (COV) were set to 0.8 mm and 0.2 mm, respectively. The original porous media in Figure 1 was named as PM1. The probability distribution of the radii of the solid grains is shown in Figure 2.
In order to investigate the influence of the cemented solid grains on the solute transport and mixing process, another three solid grains with the different degrees of cementation were generated on the base of PM1 by increasing the radii and referred to as PM2, PM3, and PM4, respectively. All locations of solid grains in PM1–4 were consistent. With the increase of radii, the pore space between solid grains shrunk. As a result, another two porous media (e.g., PM2 and PM3) with the porosities of 0.40 and 0.35 were obtained, respectively. It should be mentioned that the solid grain in both PM2 and PM3 were still set to be totally non-overlapping. As the radius of the solid grains increased, some solid grains tended to contact and began to cement. Once solid grains contacted, the radius of these solid grains stopped increasing, and other radii of the solid grains keep increasing by the same stage value (1/200 of mean radius). As a result, a fraction of the solid grains in PM4 was cemented, and the corresponding porosity was 0.30. Due to the cemented solid grains in PM4, the characteristics of the pore space in PM4 changed most compared to PM1. In order to quantify the degrees of the cementation of PM1–4, the number of cemented groups () and the average number of individual solid grains contained in a cemented group () were introduced as two metrics. The properties of the cementation of PM1–4 are listed in Table 1.
As can be seen in Table 1, for PM1–3, the decreases as the radius of solid grains increase, while the keeps constant due to the fact that the solid grains in PM1–3 are not cemented. When the average radius of PM4 increases by 13.12%, the corresponding porosity decreases and the cementation degree (the ratio of cemented solid grains to all solid grains) becomes 89.13%—associated with the decrease of . Although the decreases by 33.77% in PM4, the slightly increases and is larger than that in PM3. This could lead to the spatial velocity variability of the flow field. The spatial velocity variability of the flow fields was quantitively analyzed by introducing a coefficient of velocity variation () in the Section 3.2.
2.2. Flow Field and Solute Transport Models in Porous Media
The fluid in the flow field is assumed to be incompressible and not affected by gravity. The flow field is solved by using the continuity and the Navier–Stokes equations,
where is the density of the fluid, is the velocity vector, is the fluid pressure, and is the dynamic viscosity of the fluid.
The boundary condition of the flow field is schematically illustrated in Figure 1. In each model, the left and right boundaries are set to be the first-type boundary. The steady-flow is induced from left to right by the given pressure drop. The no-slip boundary condition is applied at the solid–liquid interfaces. There is no flux across the top and bottom boundaries.
Transient solute transport is described by the advection-diffusion equation for conservative non-sorbing solute transport at the pore-scale,
where is the solute concentration, is time, and is the molecular diffusion coefficient. The velocity vector in Equation. (4) is from the flow field based on the solution of Equations (2) and (3). A dimensionless parameter related to the time (e.g., pore volume) is introduced as follows,
where Q is the flow rate per length, and A is the area of pore space. The porous media is initially saturated with water. At time , the solute was injected by the line source pulse with a uniform concentration at the inlet boundary (). For the simulations of the solute transport in PM1–4, the line source pulse lasts from = 0 to = 0.01.
2.3. Quantification of Mixing
In this study, the mixing behavior of the conservative solute is quantified by the dilution index and the SDR, respectively. The dilution index, introduced by Kitanidis [28], is capable of quantifying the degree of the mixing and presents a measure of the porous media volume occupied by a solute plume. This metric is expressed as the exponential of the Shannon entropy,
where is interpretation as the probability distribution of the location at time t, which has units of 1 over volume.
Another metric for quantifying the mixing behavior of the conservative solute is the SDR. The SDR is defined as,
The numerical calculation of the concentration gradient in Equation (8) is one of the main difficulties since the concentration gradient can vary sharply over a small distance in the highly heterogeneous porous media. For instance, in the highly heterogeneous flow field, a very fine numerical discretization for both the flow and the concentration field is required to obtain an accurate quantification of concentration gradients, which results in multiplying the amount of computation. To avoid this, Pope SB [33] suggests that the global SDR can be defined by using the integral of the squared concentration instead of the local concentration gradients. Multiplying Equation (4) by c(x, t) and integrating over the spatial domain,
In this paper, the SDR was only considered within the time from the end of injection to the beginning of the solute through the outlet boundary. In this time period, there was no mass flux out of the domain. Thus, the flow field was divergence-free, and the terms involving a divergence operator in Equation (9) are zero. Then,
where is the concentration second moment and can be expressed as,
By assuming that the solute transport follows the Fick’s Law, the corresponding one-dimensional analytical solution for the concentration distribution in the absence of reaction is given by
By integrating the square of Equation (12) overall domains, the corresponding concentration second moment can be expressed as
From Equation (10), the one-dimensional analytical SDR solution can thus be expressed as
3. Result and Discussion
3.1. Model Setup
In this study, the void space in the porous media was saturated by the water with standard properties at 20 °C (e.g., = 998.2 kg/m3 and Pa∙s). The numerical simulation of conservative solute transport was performed. The corresponding solute molecular diffusion was set to m2/s. The flow field and transient solute transport models based on Equations (2)–(4) were implemented in the COMSOL Multiphysics package (COMSOL Inc., Burlington, MA, USA) using the Galerkin finite-element method. The steady-state flow field was induced by adjusting the pressure drop over the entire porous media to obtain the same Pe. The solved flow field serves as the input for the transient solute transport model. In this work, the total simulation time was 1000 s with the time step was set as 0.5 s. In order to ensure numerical stability and accuracy, the sensitivity analysis for mesh dependency was performed, and the corresponding results showed that when the porous media domain was discretized into ~196,000 triangular elements, the solutions were mesh-independent and the numerical dispersion was negligible.
The Pe is defined by , which is the ratio of the characteristic diffusion time to the characteristic advection time (), where is the mean flow velocity in the porous media and is the average diameter of particles. The Reynolds number is defined as , where is the kinematic viscosity of the fluid. Three different Pe (e.g., Pe = 100, 200, and 400) was considered in this work, and the value was changed by adjusting the pressure drop between the inlet boundary and the outlet boundary.
3.2. Flow Fields
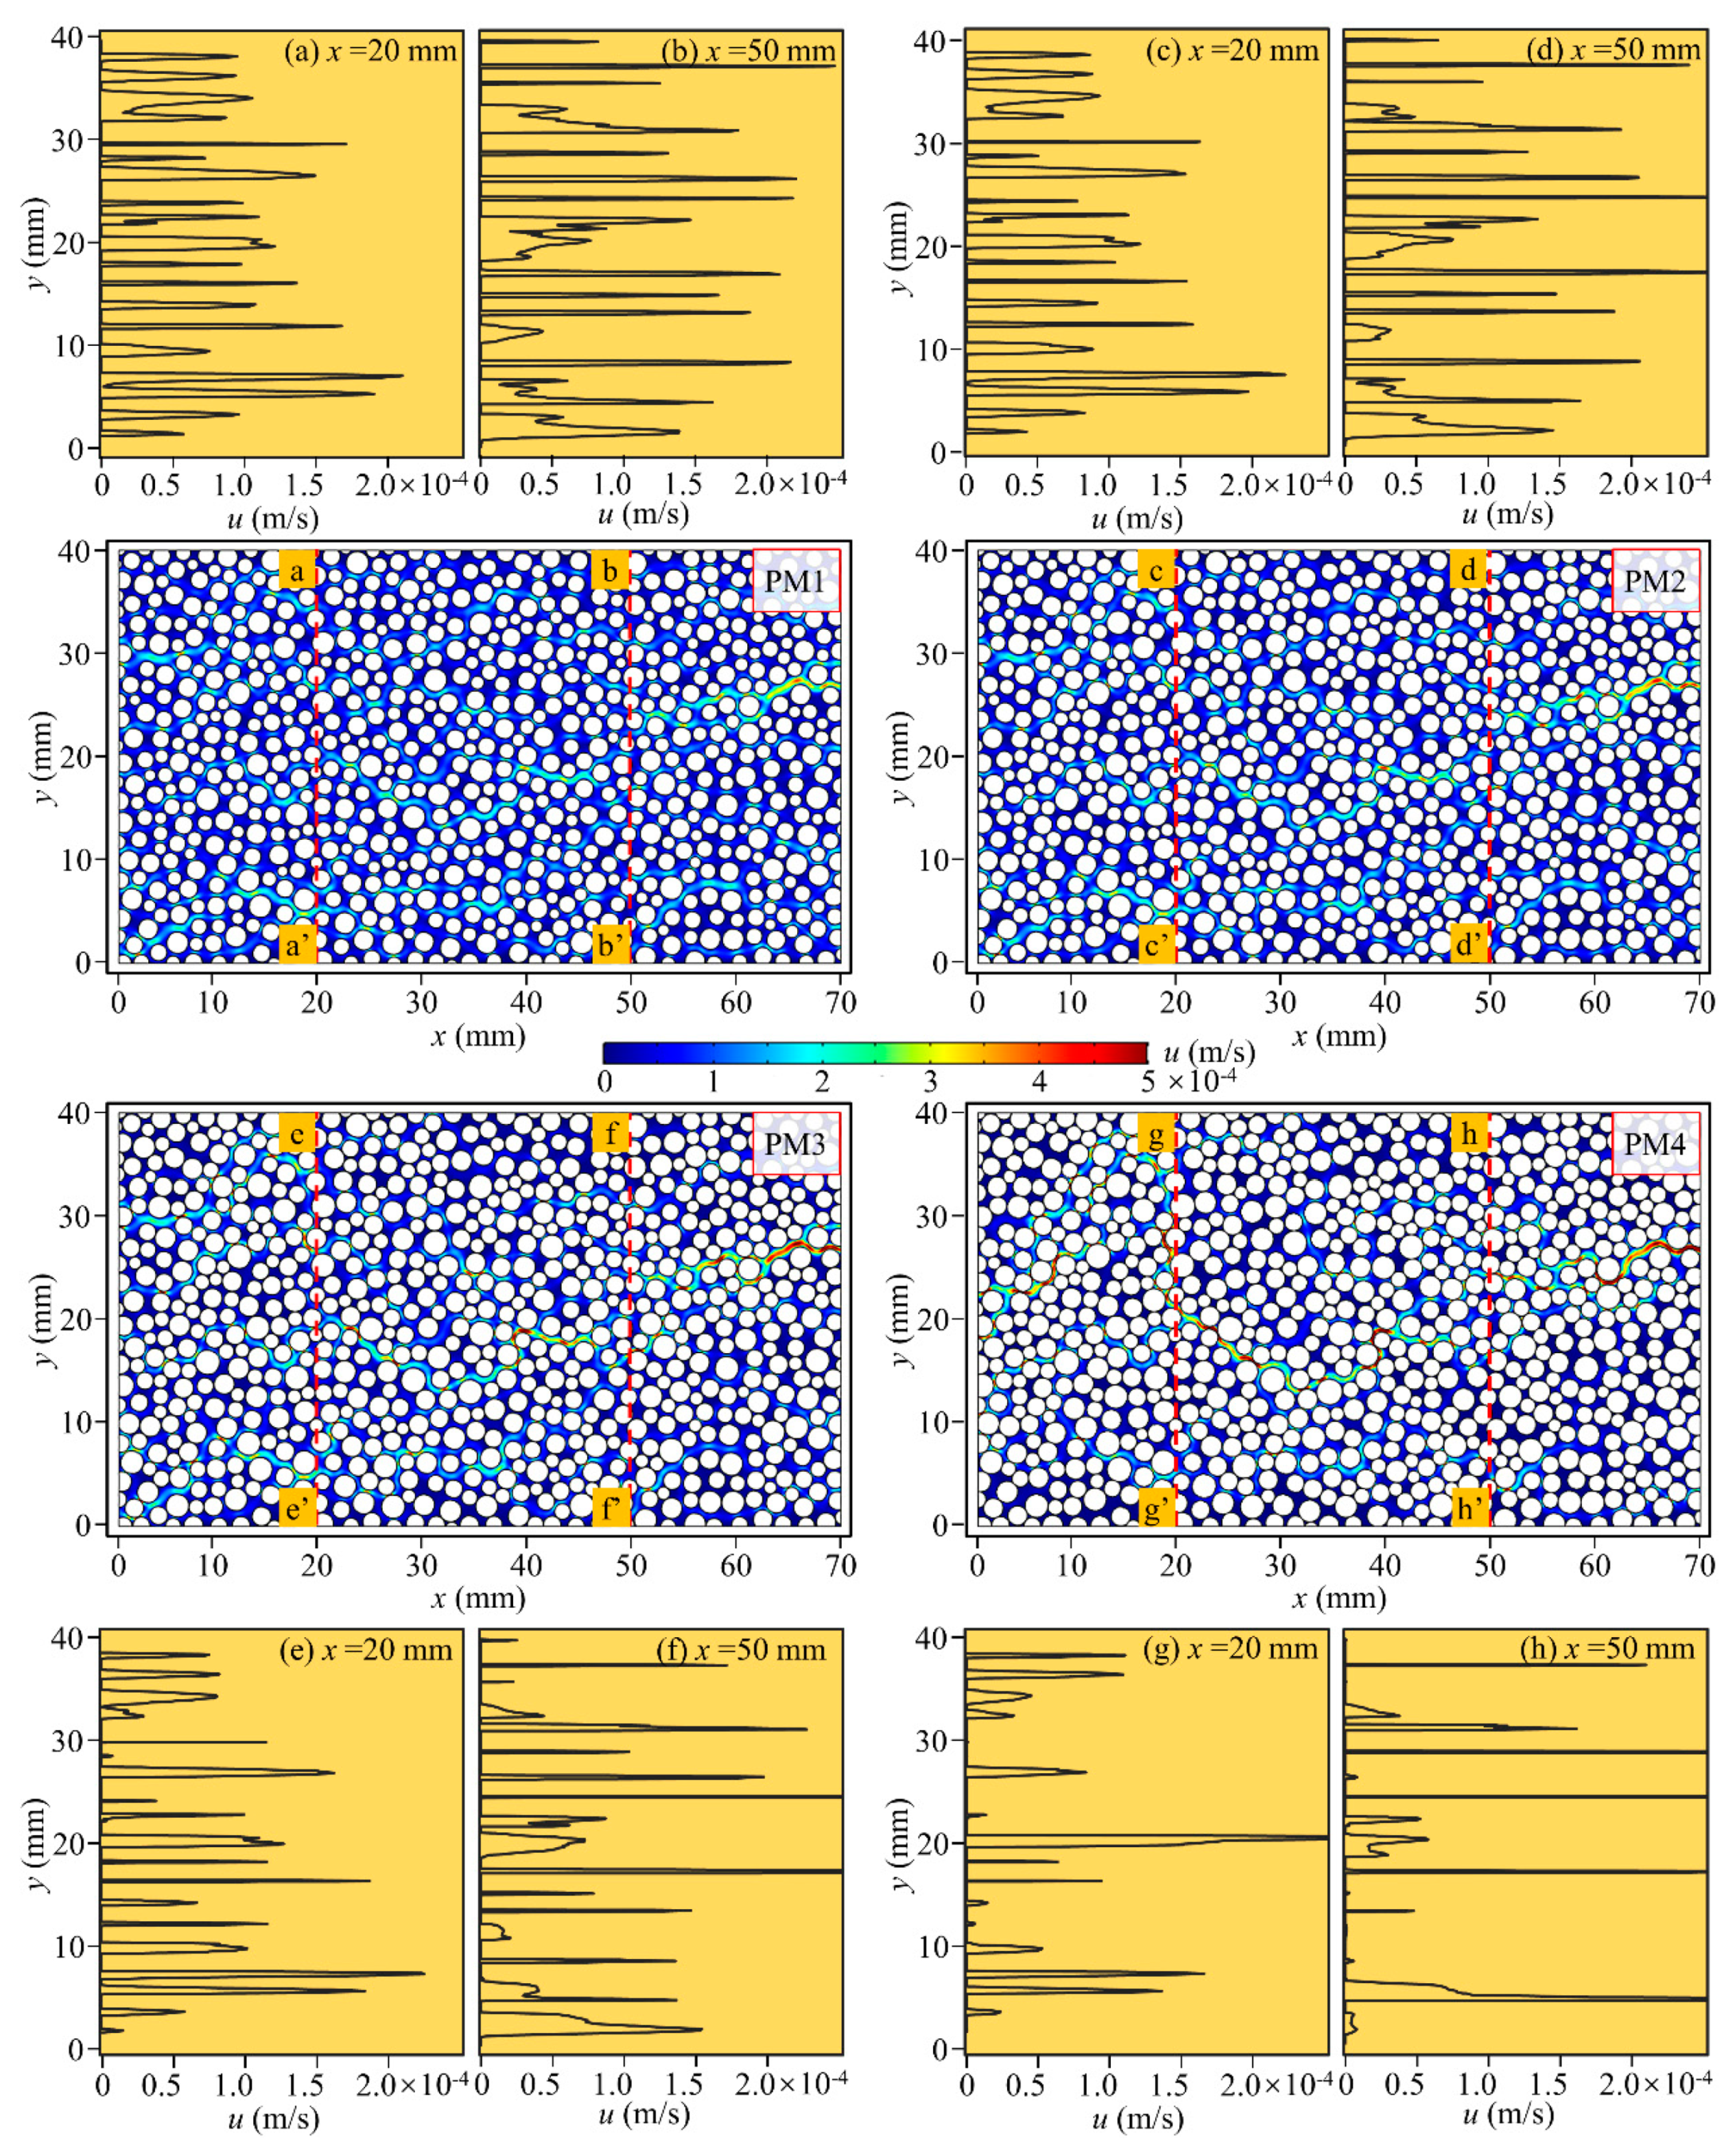
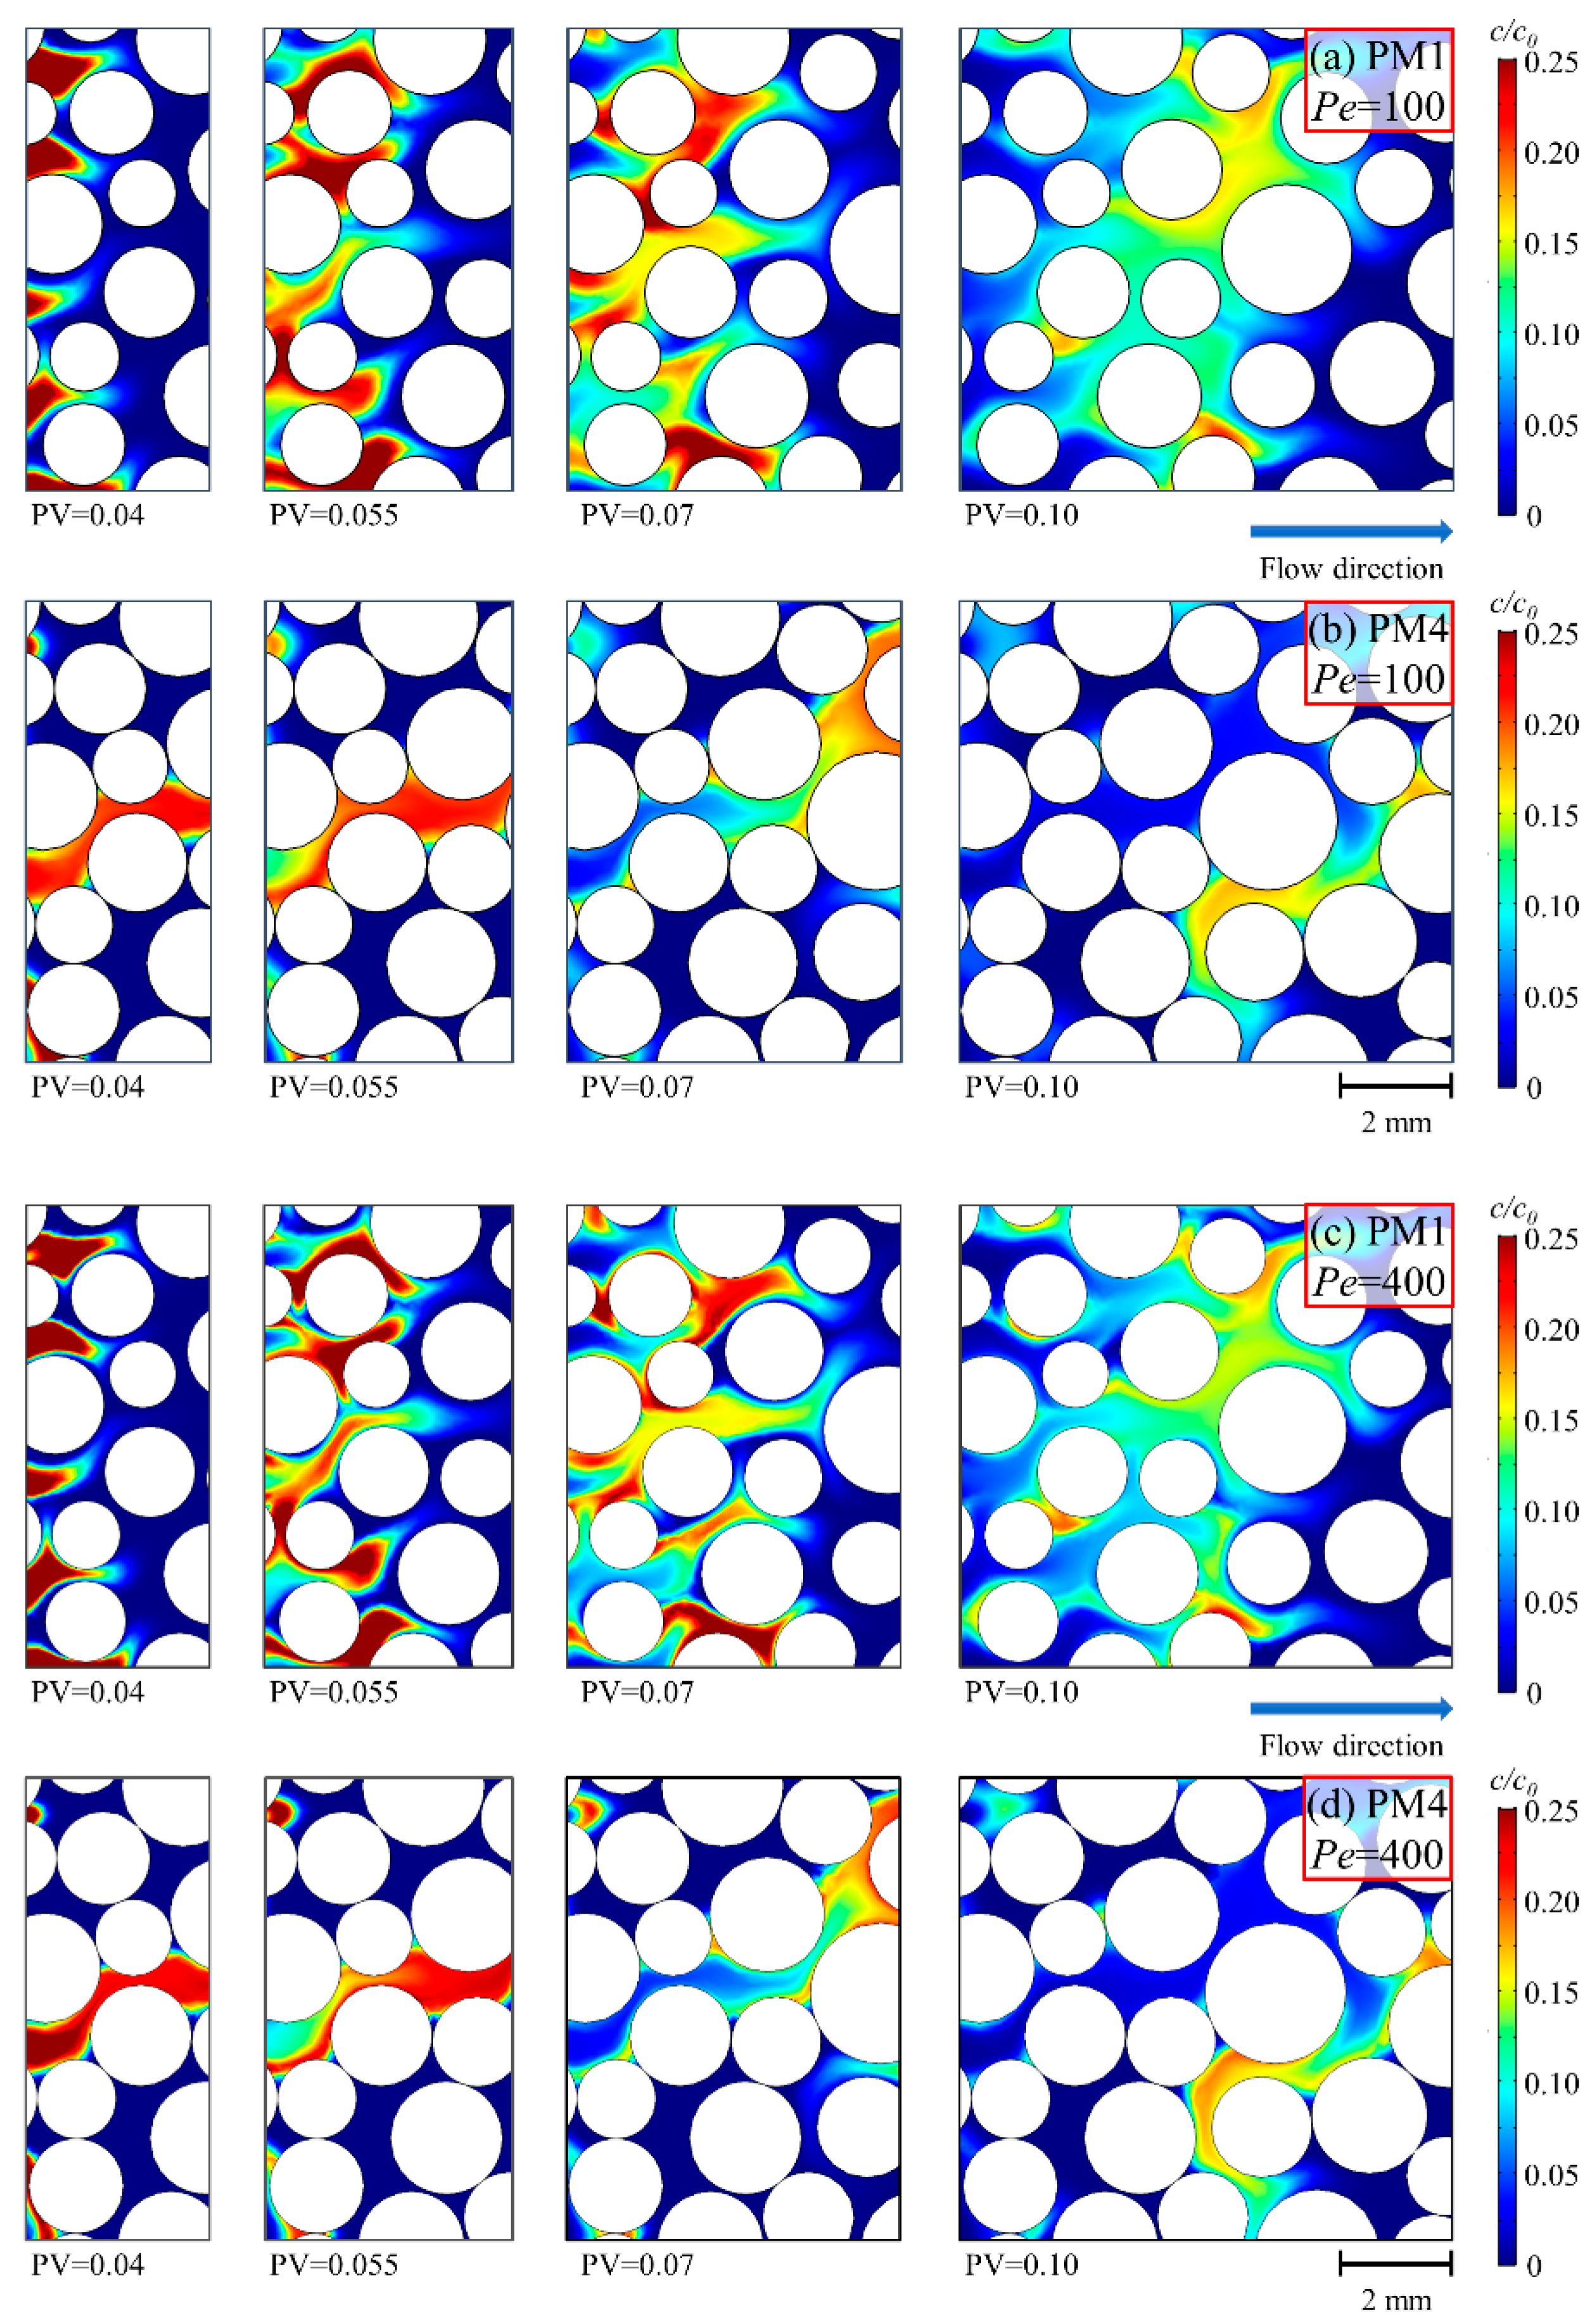
Figure 3 shows the flow fields in PM1–4 with the Pe = 100. The color contrast in PM1 is small and represents a relatively uniform velocity distribution. A network consisting of several preferential flow paths could be found in PM1. The velocity reaches the maximum value in those flow paths. As the radii of solid grains increase and the pore space gradually narrows, the morphology of the pore space become complicated, causing a pronounced flow velocity variability. In PM3 and PM4, the area of the dark blue color regions increases, which represents that the local flow velocity is much smaller than the average flow velocity. The flow velocity in the preferential flow path in PM3 is higher than that in PM1 and PM2. Since the cemented solid grains formed several groups of the solid grains in PM4, the preferential flow paths become more irregular than that in PM1–3. The flow velocity distribution in PM4 is the most non-uniform. In PM4, the preference flow paths, which originally existed in PM1, turn into a continuous dominant path connecting the inlet and outlet boundaries. It can be seen in PM4 that there are some stagnant regions where the fluid flow is almost immobile, especially near the top and bottom boundaries. Thus, the preference flow in PM4 is enhanced.
The proposed by Rolle and Kitanidis [34] was selected as a global measure of spatial velocity variability of the flow field in PM1–4. The was defined as,
where the velocity component of the fluid in the flow direction, and are the variance and average value of , respectively, and is the pore space occupied by the fluid.
The properties of flow velocity distribution in PM1–4 were listed in Table 2. As shown in Table 2, the cemented porous media has a significant influence on the flow field. As the radii of solid grains increase, at the case of Pe = 100, the in PM2–PM4 are 31.79%, 110.82%, and 190.24% higher than in PM1, respectively. Combined with the plots of local velocity at the cross-sections, the locations of the high velocity are almost unchanged and where the pore spaces are relatively narrow. The increase of is due to the coarctation of pore space. However, as the solid grains become cemented (e.g., PM4), some stagnant regions where the fluid flow is almost immobile appear and result in the and decrease. The in PM4 is 88.37% of that in PM1. The in PM4 is only 68.13% of that in PM1. Such opposite trend (the increase of and the decrease of ) indicates that the flow velocity distribution becomes more and more non-uniform during the cementation of the porous media. Meanwhile, the value of increases during the cementation of the porous media. This reflects that the preferential flow is enhanced, which is consistent with the feature reflected in Figure 3.
For a given porous media, the is constant under the different Pe while it can be seen that the is considerably higher in PM4 where the calculated is approximately three times than in PM1. As the radii of the porous media increase, the increases. This indicates that the heterogeneity of the flow field is sensitive to the variation of the pore space caused by the cementation of the porous media. This also implies that the is capable of describing the magnitude of the heterogeneity of the flow field in porous media. In this study, the magnitude of the heterogeneity of flow field was defined by the . Since the of PM4 is larger than PM1–3, PM1, PM2-PM3, and PM4 is considered as a weakly, mildly and highly heterogeneous porous media, respectively.
3.3. Characteristic of Solute Transport
In order to investigate the influence of the cemented porous media on the temporal solute mixing process, the conservative solute transport simulations were conducted in PM1–4 with the Pe = 100, 200 and 400.
3.3.1. Plume Dilution
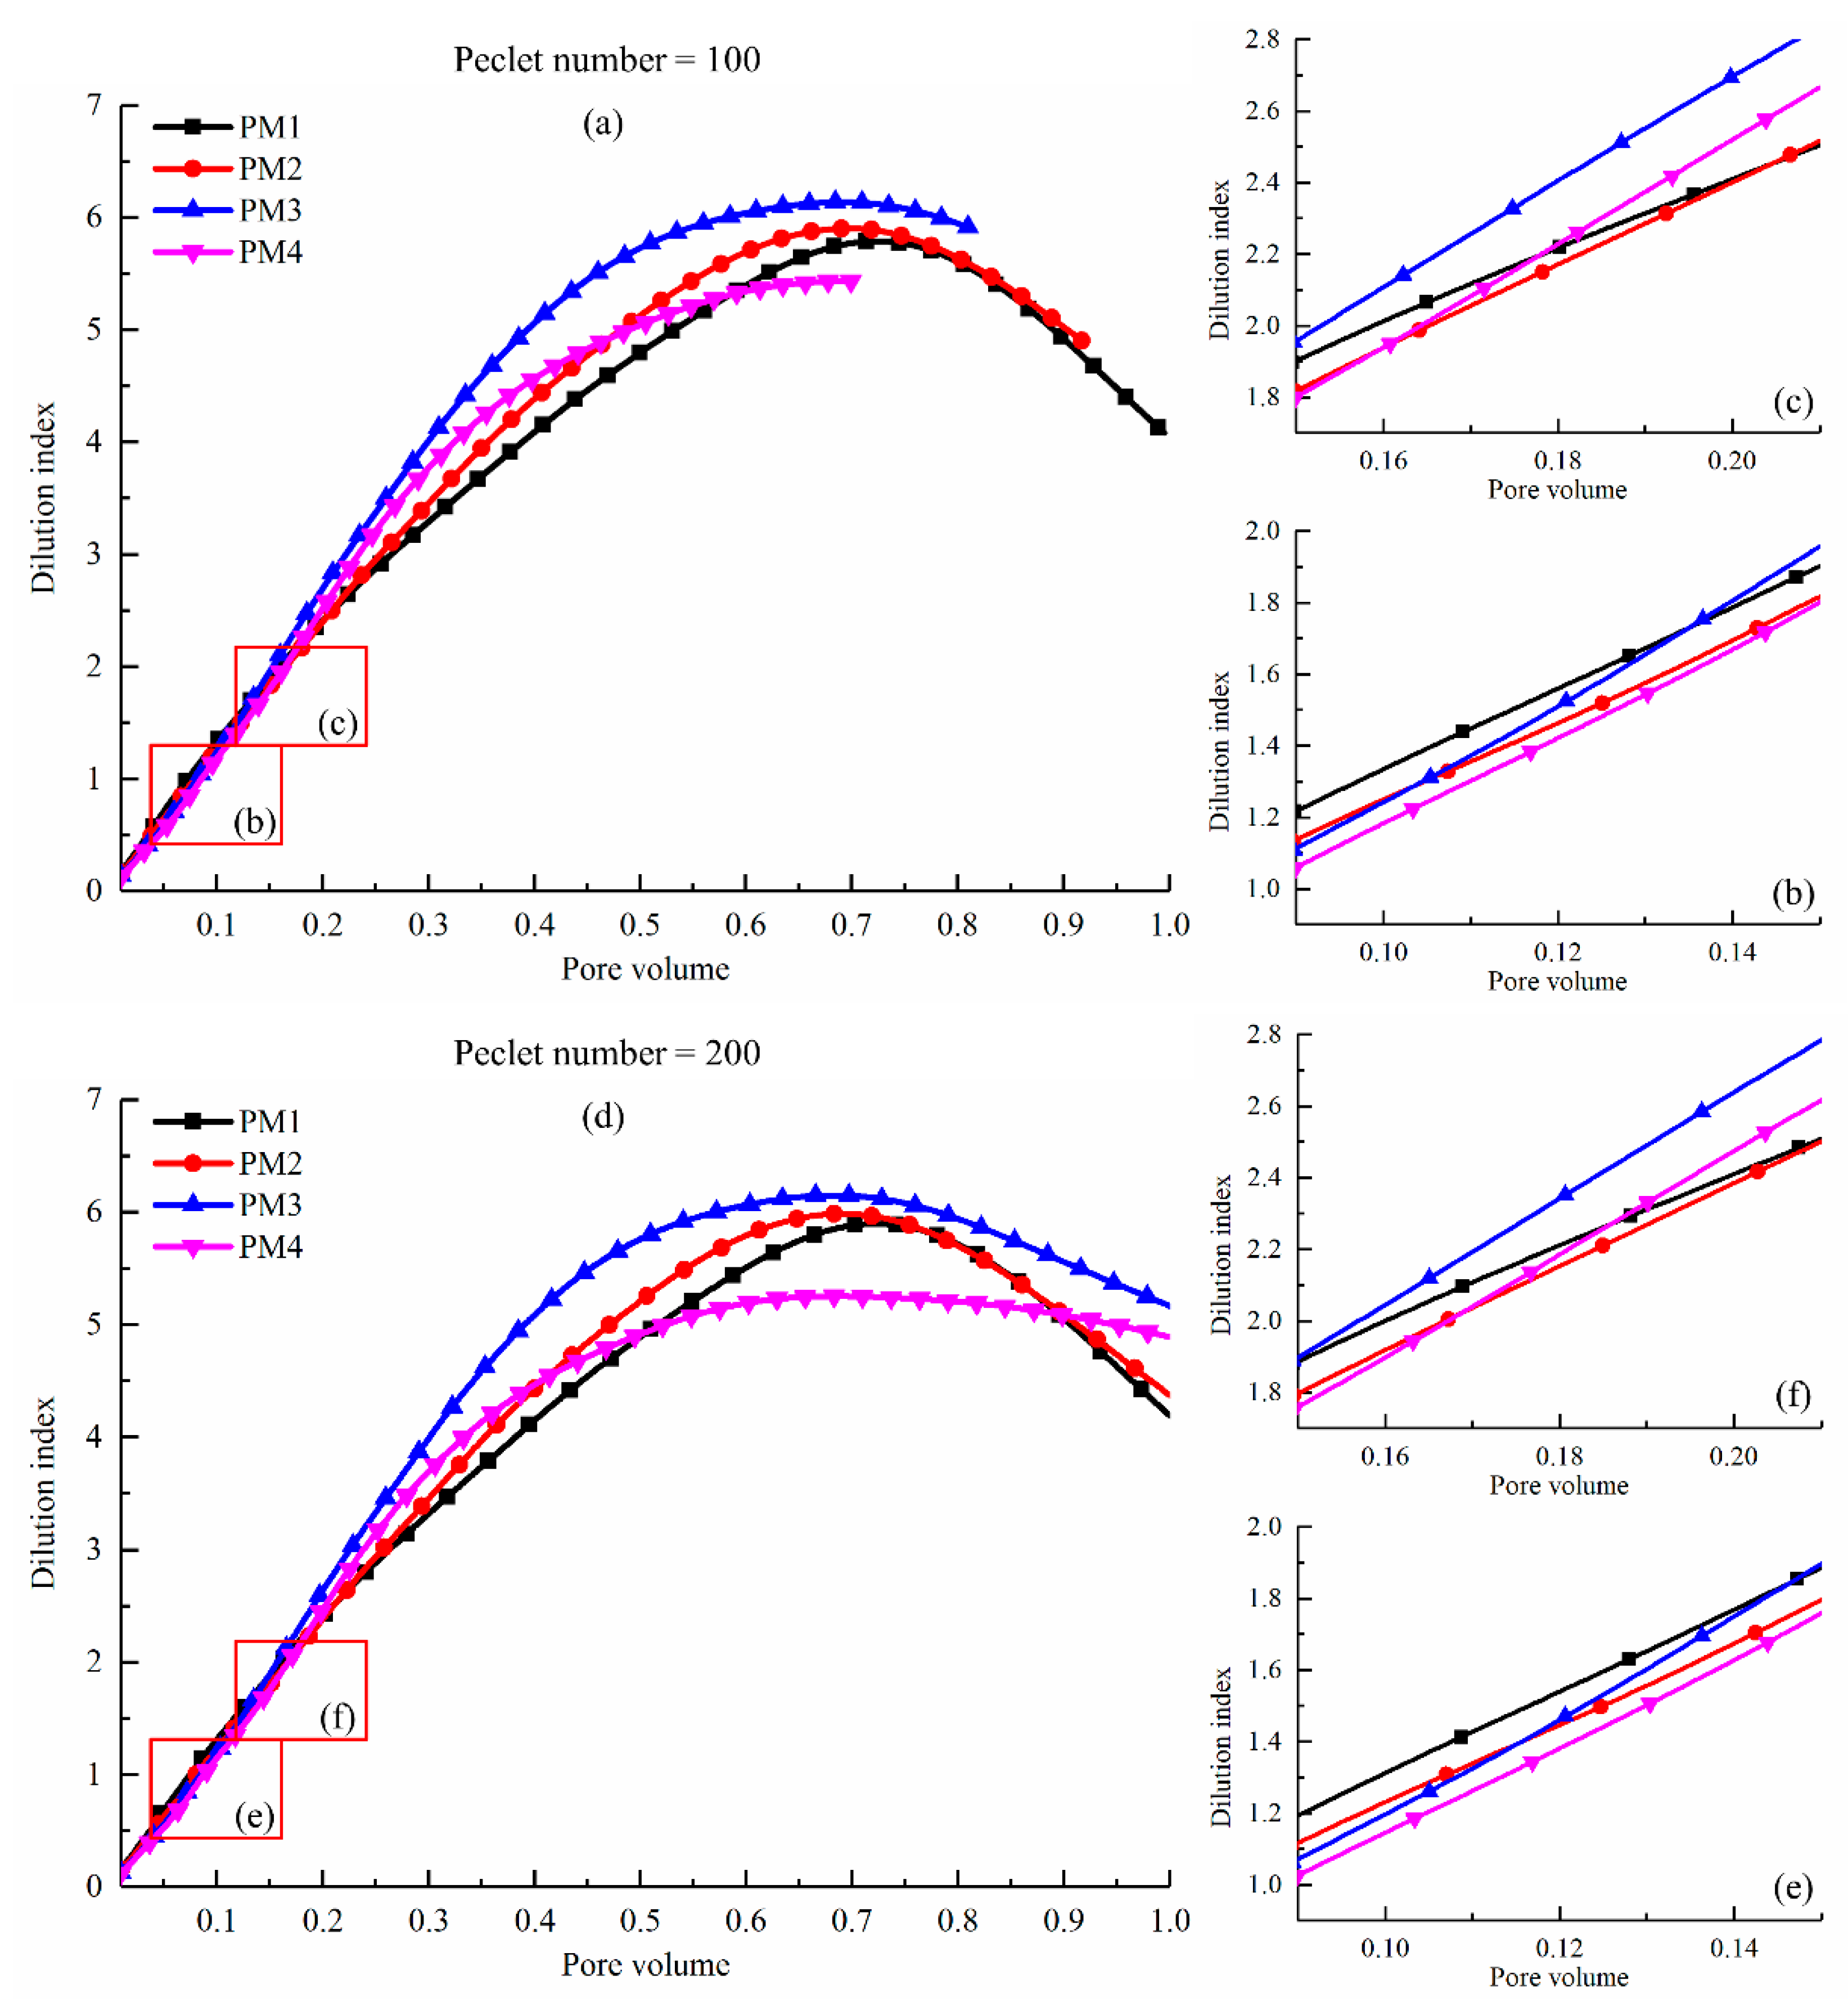
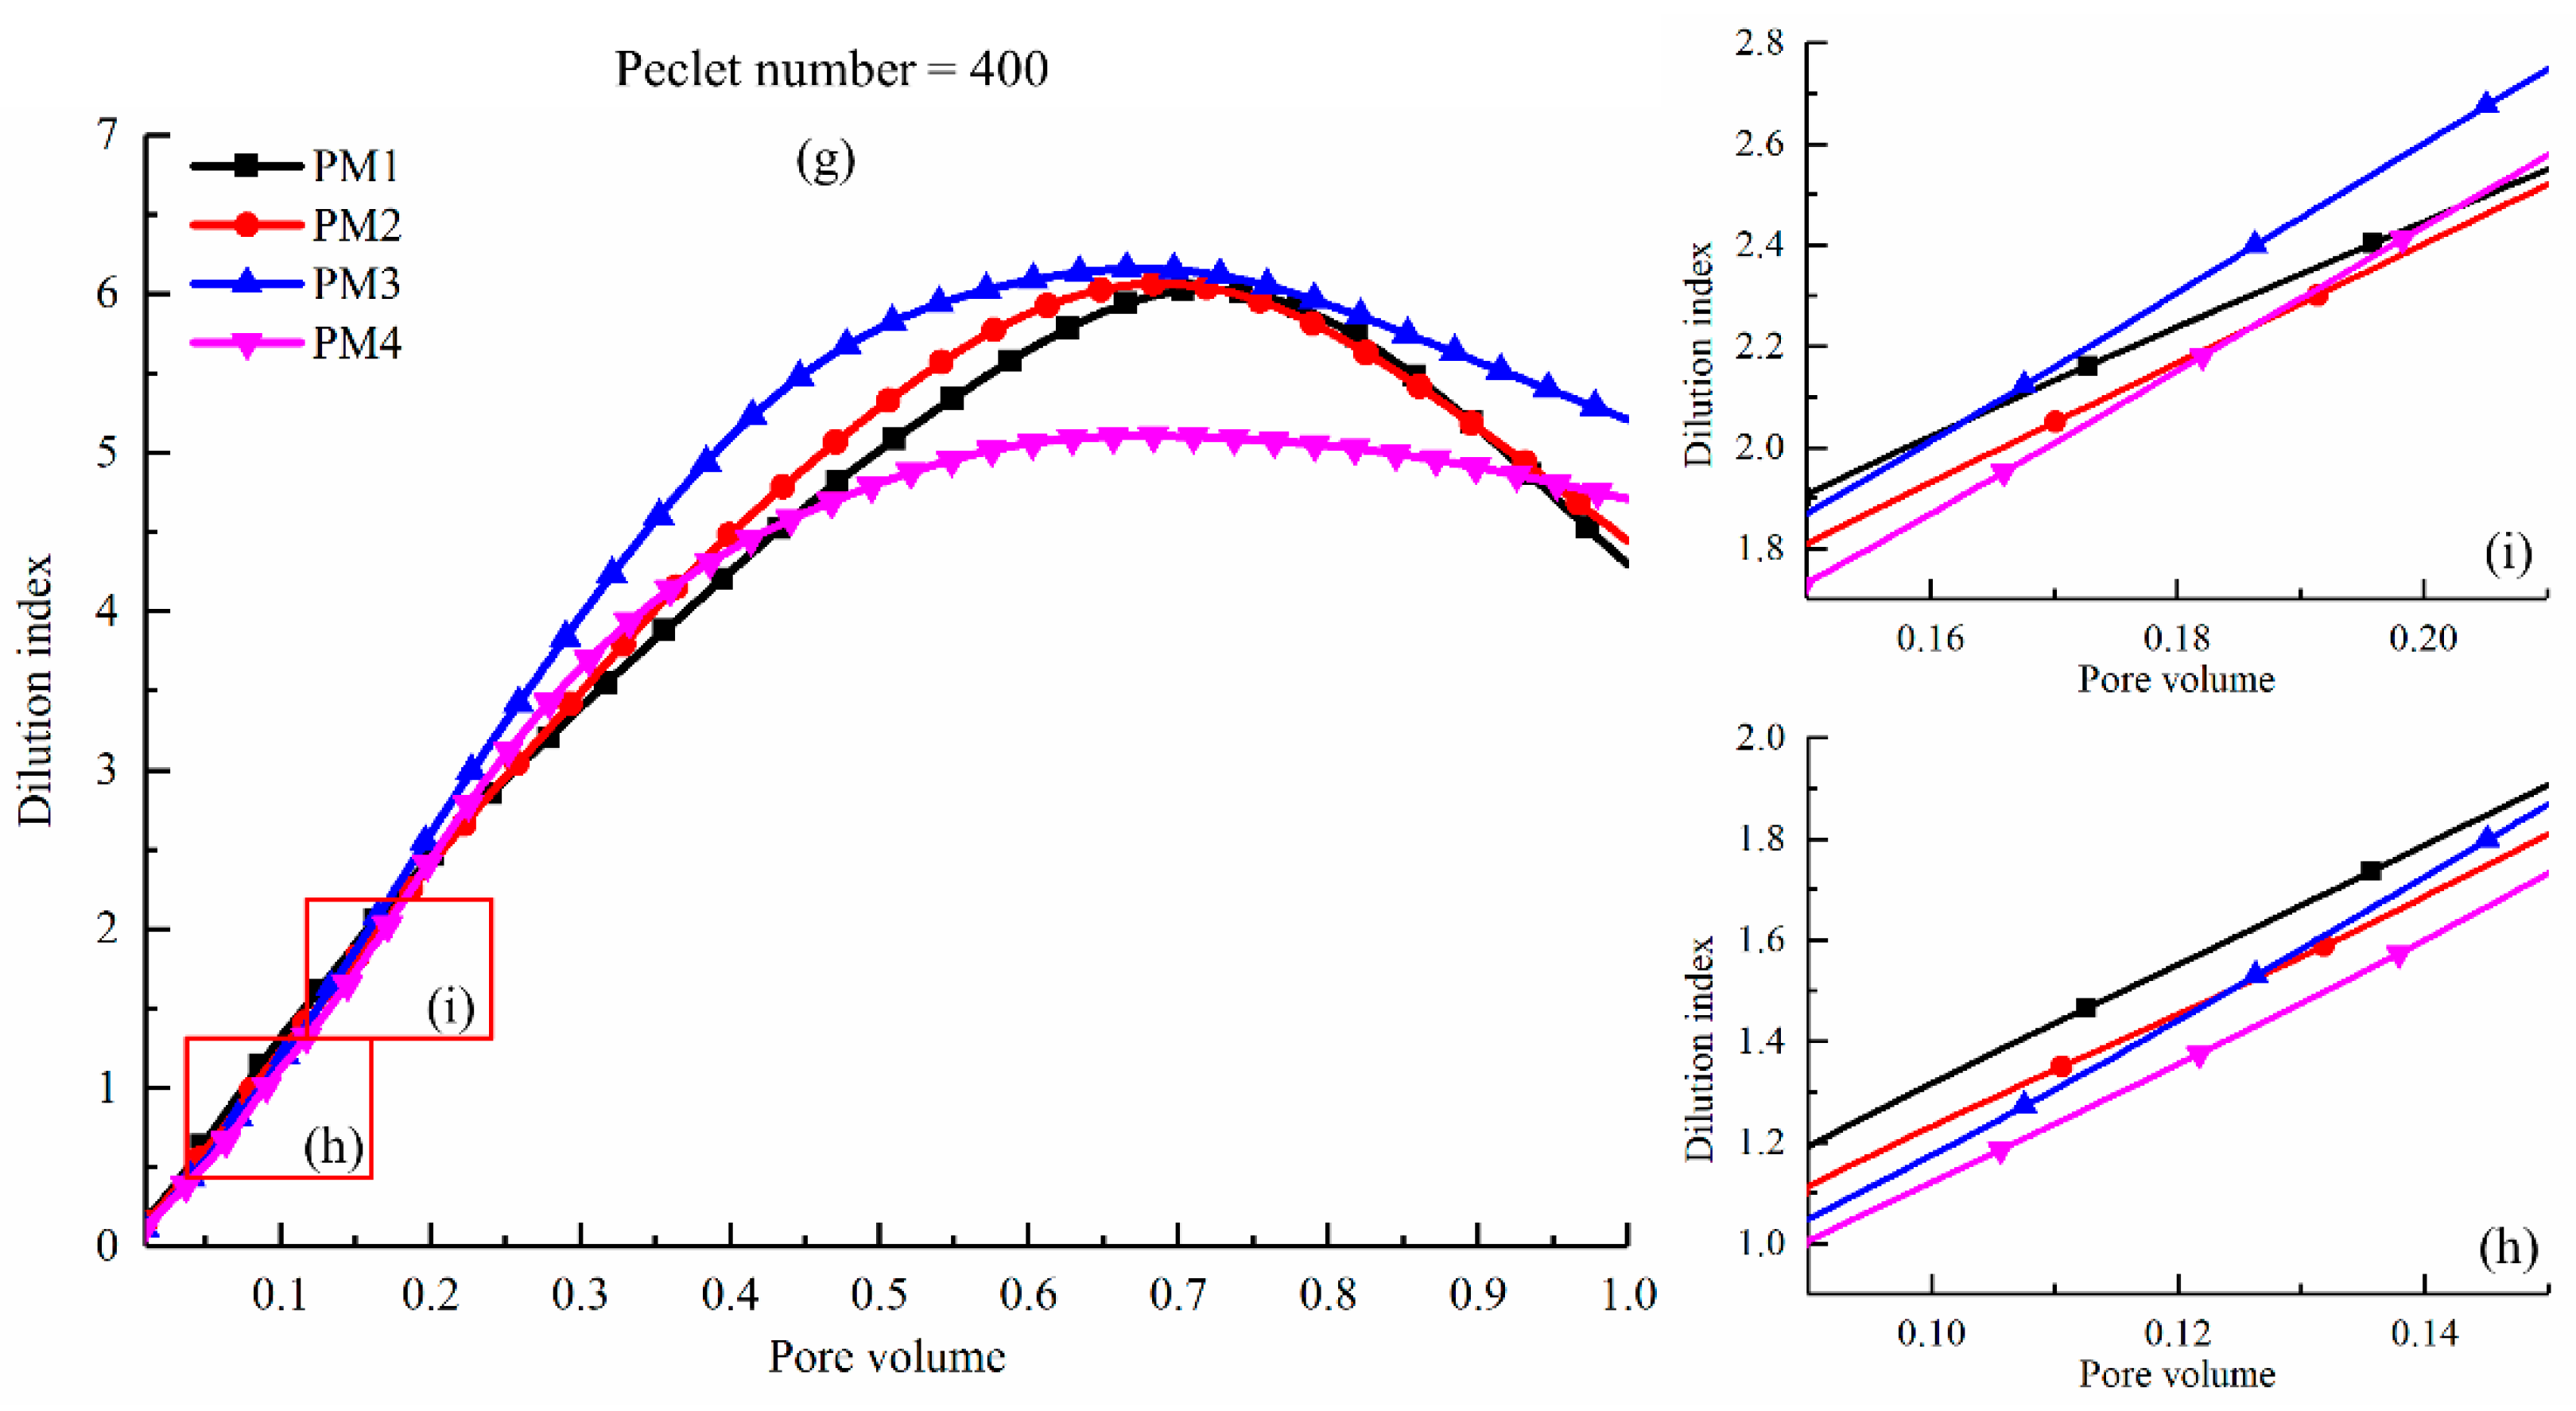
The dilution index in PM1–4 was calculated at the Pe = 100, 200 and 400, respectively, as shown in Figure 4. In general, the cemented porous media has a significant influence on the dilution index, while the Pe has little influence on the dilution index for a given porous media. At the first stage (Pv < 0.1) as shown in Figure 4b,c,f–h, the dilution index in PM1 and PM2 are a bit greater than that in PM3 and PM4. As the Pv increases, the dilution index monotonically increases. The value of the dilution index in the highly heterogeneous porous media (e.g., PM4) begins to exceed that in the mildly heterogeneous porous media (e.g., PM2 and PM3). It is worth noting that the dilution index in PM3 is greater than in PM4 during the entire process. Although the porosity of PM4 is the smallest among all porous media, the corresponding peak value of the dilution index in PM3 is the largest (see Table 3). Considering the analysis of the flow field, this indicates that the enhanced preferential flow in PM4 has a negative influence on the dilution of the solute plume. At the same Pv condition, the ratio of the fluid volume that flowed into the porous media to the pore space volume is the same. The solute transports mainly along with the fluid flow. It could be found that, in Figure 5, the concentration distribution for the Pe = 400 is almost same with it for the Pe = 100. Since the dilution index is a measure of porous media volume occupied by a solute plume. Therefore, the change in Pe has little influence on the dilution index for the same porous media.
The zoomed snapshots of the local solute transport in PM1 and PM4 were represented in Figure 5. Due to the increase of the radii of solid grains in PM4, some pore space forms the immobile regions. The local flow velocities in these immobile regions are much smaller than the average fluid flow velocity. For the solute transport via the dominant paths, it is difficult to occupy these regions in a short period of time. This leads to the fact that the dilution index is lower than that in the porous media with high connectivity (e.g., PM2 and PM3). Since the residual solute is captured in these local pores, the dilution index in the highly heterogeneous porous media (e.g., PM4) is relatively high in the late period. Therefore, the enhanced preferential flow has a negative influence on the dilution process in the highly heterogeneous porous media. When the Peclet number was increased, the concentration distribution in certain porous media for the Pe = 400 is almost same with it for Pe = 100. But the concentration gradient of the plume is slightly pronounced.
3.3.2. Global SDR
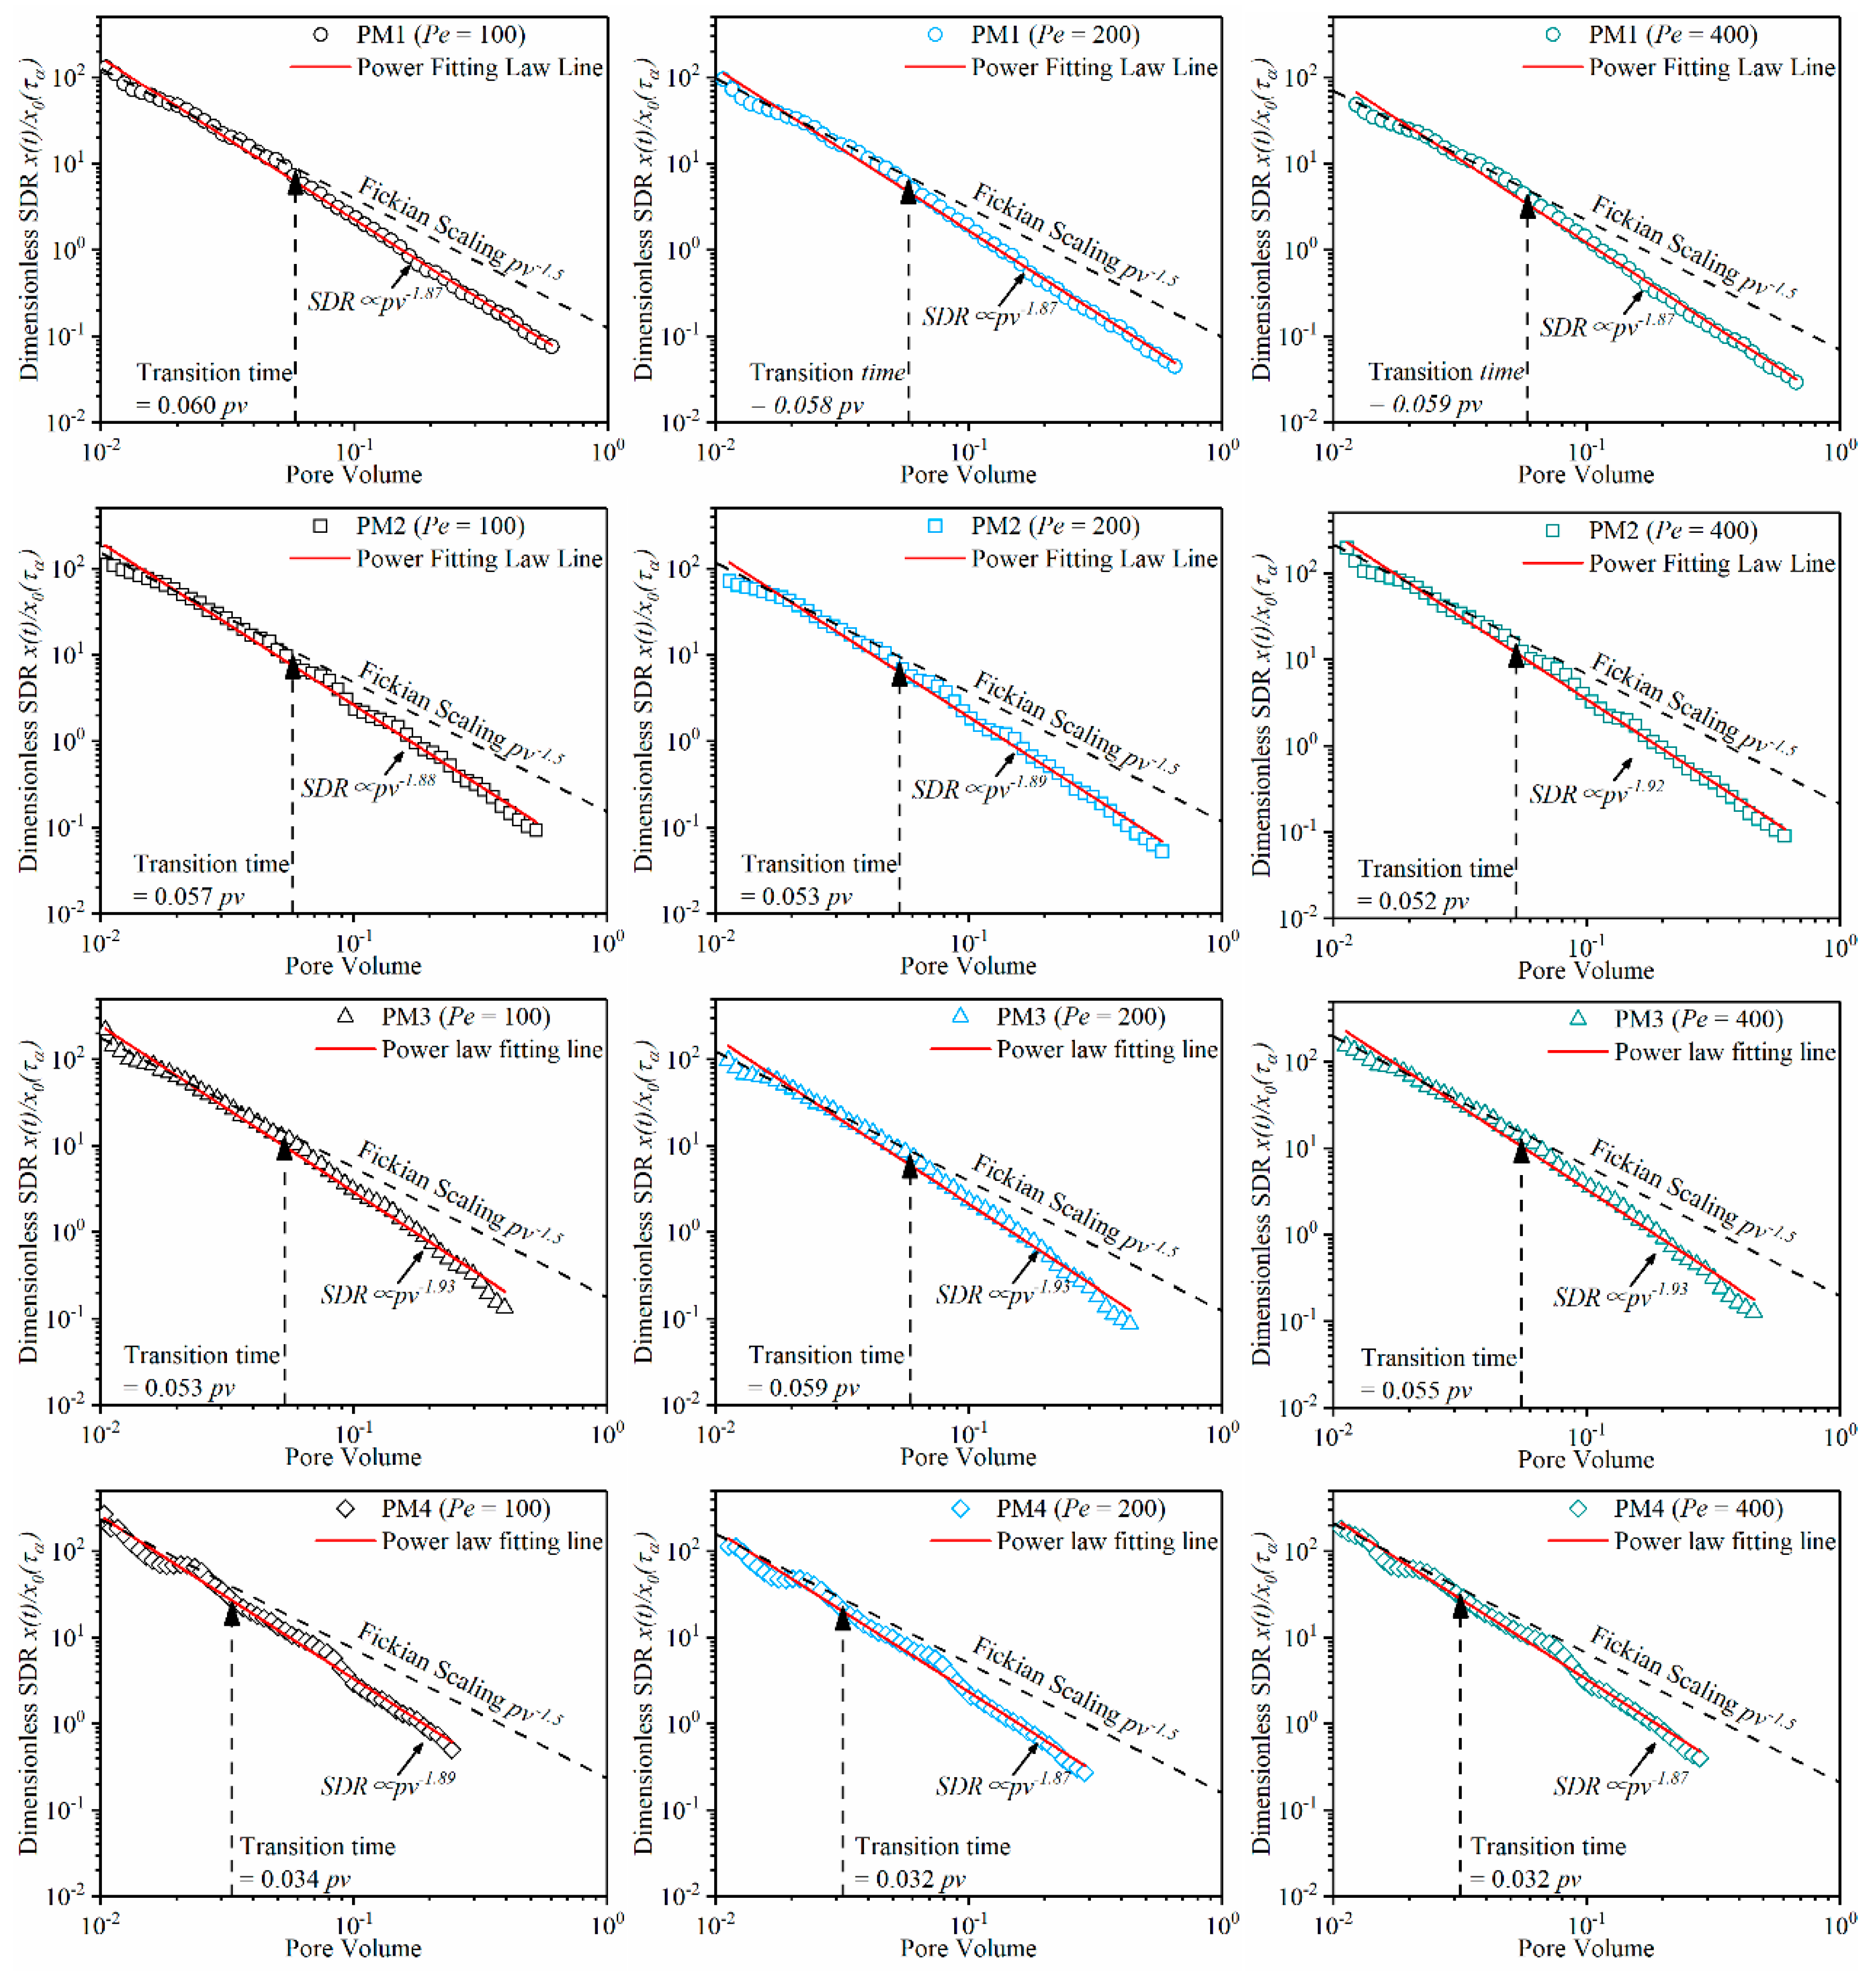
The global SDR was determined for the conservative solute transport in all porous media. Figure 6 shows the evolution of the global SDR in the porous media with the different pore space morphologies for the Pe = 100, 200, and 400. In Figure 6, the temporal SDR is normalized by . In all cases, the global SDR in general decreases with the Pv.
In the early stage (Pv < 0.05), the global SDR follows the Fickian scaling , as shown in Equation (15). As the Pv increases, the mixing behavior turns to be non-Fickian, which is caused by the fact that the transverse diffusion as new interfaces are created by the shearing of the plume. The transition time from the Fickian scaling to the non-Fickian scaling is important for judging the mixing process. It is found that the transition time is mainly controlled by the degree of the cementation of porous media. However, the Pe has little influence on the transition time. In general, the transition time for the weakly heterogeneous porous media (e.g., PM1) is greater than for highly heterogeneous porous media, as shown in Figure 6. The value of the transition time in PM1 under the case of Pe = 100 is nearly two times than in PM4. This reflects a better mixing process in the weakly heterogeneous porous media at the beginning. The result is consistent with the previous results of the dilution index.
Each SDR in Figure 6 was fitted by a power-law function of Pv. It is found that in all porous media, both the Pe and the cemented porous media have a significant influence on the temporal evolution of the SDR. For a given Pe, the exponent of the best-fitting power law decreases as the porosity of the porous media decreases. However, the exponent in PM4 increases slightly compared to that in PM3. As the Pe increases, for PM1–3, the exponent of the best-fitting power law decreases. In PM4 where the preferential flow was enhanced by the cemented solid grains, the slope of the global SDR increases with the Pe increase. This trend against the cases in PM1–3 indicates that the cementation of porous media has a significant influence on the temporal evolution of solute mixing process, which is consistent with the previous results reflected by the dilution index.
Furthermore, there is a fluctuation of the global SDR around the corresponding power-law fitting line for each porous media. For the highly heterogeneous porous media (e.g., PM4), the temporal evolution of the global SDR fluctuates more than in the other three cases (e.g., PM1–3). While the magnitude of this fluctuation is insensitive to the Pe. This suggests that both the narrowed pore space and the cemented solid grains, which results in the spatial velocity variability in the flow field and the geometry deformation of the front interface between solute and water, have a significant influence on the temporal evolution of the global SDR. Since the streamlines in the highly heterogeneous porous media are deformed and bent, the flow velocity variability is greater than in other cases. The flow velocity variability leads to stretching the plume and smearing out the concentration gradients. In addition, the velocity fluctuations create a potential chance for mixing by generating the disorder and large interfacial areas between the resident and invading water [35]. At the local area, the concentration gradients are smeared out by diffusion and transformed into effective mixing.
In addition, as shown in Figure 6, the exponent of each best-fitting power-law is less than −1.5, reflecting that the temporal mixing is non-Fickian. Therefore, using the one-dimensional analytical SDR will underpredict the true SDR [36], especially at the case of the high Pe or the highly heterogeneous porous media (e.g., PM4). In the non-Fickian regime, the slope of the global SDR reflects the dimensionality of the mixing process [37]. The result shows that the mixing in porous media after transition time is intermediate between the 1D and 2D behaviors.
4. Summary and Conclusions
In this study, in order to simulate the cementation of the porous media, PM1–4 were generated by increasing the radii of solid grains. The corresponding porosity of PM1–4 decreases from 0.45 to 0.30. The flow fields in PM1–4 were solved by using the continuity and the Navier–Stokes equations. The was introduced as a global measure to evaluate the spatial velocity variability of the flow field in PM1–4. It was found that the cemented porous media had a significant influence on the spatial velocity variability of the flow field. A network consisted of several preferential flow paths was found in PM1–4. The increased from 0.943 to 2.319 as the porosity of PM1–4 decreased from 0.45 to 0.30. The preferential flow in PM4 was enhanced since the cemented solid grains formed several groups of the solid grains.
The simulations of the conservative solute transport were performed in PM1–4 by considering the Pe = 100, 200, and 400. The temporal mixing behavior of conservative solute transport in PM1–4 was quantitively analyzed by two metrics, the dilution index and the SDR, respectively. Both the dilution index and the SDR results showed that the cemented porous media had a significant influence on the temporal mixing behavior of conservative solute. The preferential flow enhanced the mixing of the conservative solute but had a negative influence on the mixing of the solute plume when the cemented solid grains formed several groups of the solid grains and there were some stagnant regions where the fluid flow was almost immobile (e.g., PM4).
The global SDR results showed that both the Pe and the cemented porous media had a significant influence on the temporal evolution of the global SDR. For a given Pe, the exponent of the best-fitting power law decreased as the porosity of the porous media decreased. However, the exponent for PM4 increased slightly compared to that for PM3. As the Pe increased, for PM1–3, the exponent of the best-fitting power law decreased. In PM4, where the preferential flow was enhanced by the cemented solid grains, the slope of the global SDR increased as the Pe increased. Furthermore, compared to the scaling of the one-dimensional analytical solution of SDR, the global SDR results indicated that the temporal mixing behavior followed a Fickian scaling in the early stage (Pv < 0.05), while the mixing behavior turned to be non-Fickian in the late stage. In addition, it was found that the cemented porous media had a significant influence on the transition time from the Fickian scaling to the non-Fickian scaling.
Author Contributions
Z.D. and X.Z. wrote the manuscript. Z.C. and Y.Y. edited the figures. C.Z. edited the table. Z.D., X.Z. and C.W. revised the manuscript. Z.D. and X.Z. analyzed the data and performed the numerical experiments.
Funding
This research received no external funding.
Acknowledgments
The study is financially supported by the National Natural Science Foundation of China (Grant Nos. 41602239 and 41877171), the Natural Science Foundation of Jiangsu (Grant No. BK20160861), and the Fundamental Research Funds of the Central Universities (Grant No. 2019B16714).
Conflicts of Interest
The authors declare no conflict of interest.
References
- Sale, T.C.; Zimbron, J.A.; Dandy, D.S. Effects of reduced contaminant loading on downgradient water quality in an idealized two-layer granular porous media. J. Contam. Hydrol. 2008, 102, 72–85. [Google Scholar] [CrossRef] [PubMed]
- Bagalkot, N.; Kumar, G.S. Numerical modeling of two species radionuclide transport in a single fracturematrix system with variable fracture aperture. Geosci. J. 2016, 20, 627–638. [Google Scholar] [CrossRef]
- Song, X.; Hong, E.; Seagren, E.A. Laboratory-scale in situ bioremediation in heterogeneous porous media: Biokinetics-limited scenario. J. Contam. Hydrol. 2014, 158, 78–92. [Google Scholar] [CrossRef] [PubMed]
- Anna, P.; Jimenez-Martinez, J.; Tabuteau, H.; Turuban, R.; Le Borgne, T.; Derrien, M.; Meheust, Y. Mixing and reaction kinetics in porous media: An experimental pore scale quantification. Environ. Sci. Technol. 2014, 48, 508–516. [Google Scholar] [CrossRef] [PubMed]
- Soltanian, M.R.; Ritzi, R.W.; Dai, Z.; Huang, C.C. Reactive solute transport in physically and chemically heterogeneous porous media with multimodal reactive mineral facies: The lagrangian approach. Chemosphere 2015, 122, 235–244. [Google Scholar] [CrossRef] [PubMed]
- Dou, Z.; Chen, Z.; Zhou, Z.; Wang, J.; Huang, Y. Influence of eddies on conservative solute transport through a 2d single self-affine fracture. Int. J. Heat Mass Transf. 2018, 121, 597–606. [Google Scholar] [CrossRef]
- Dou, Z.; Zhou, Z.; Wang, J.; Huang, Y. Roughness scale dependence of the relationship between tracer longitudinal dispersion and peclet number in variable-aperture fractures. Hydrol. Process. 2018, 32, 1461–1475. [Google Scholar] [CrossRef]
- Shapiro, M.; Brenner, H. Dispersion of a chemically reactive solute in a spatially periodic model of a porous medium. Chem. Eng. Sci. 1988, 43, 551–571. [Google Scholar] [CrossRef]
- Pini, R.; Vandehey, N.T.; Druhan, J.; O’Neil, J.P.; Benson, S.M. Quantifying solute spreading and mixing in reservoir rocks using 3-d pet imaging. J. Fluid Mech. 2016, 796, 558–587. [Google Scholar] [CrossRef]
- Bear, J. Dynamics of Fluids in Porous Media; Courier Corporation: New York, NY, USA, 2013. [Google Scholar]
- Rolle, M.; Chiogna, G.; Hochstetler, D.L.; Kitanidis, P.K. On the importance of diffusion and compound-specific mixing for groundwater transport: An investigation from pore to field scale. J. Contam. Hydrol. 2013, 153, 51–68. [Google Scholar] [CrossRef]
- Swanson, R.D.; Binley, A.; Keating, K.; France, S.; Osterman, G.; Day-Lewis, F.D.; Singha, K. Anomalous solute transport in saturated porous media: Relating transport model parameters to electrical and nuclear magnetic resonance properties. Water Resour. Res. 2015, 51, 1264–1283. [Google Scholar] [CrossRef] [Green Version]
- Bijeljic, B.; Mostaghimi, P.; Blunt, M.J. Insights into non-fickian solute transport in carbonates. Water Resour. Res. 2013, 49, 2714–2728. [Google Scholar] [CrossRef]
- Fiori, A.; Janković, I.; Dagan, G. Modeling flow and transport in highly heterogeneous three-dimensional aquifers: Ergodicity, gaussianity, and anomalous behavior—2. Approximate semianalytical solution. Water Resour. Res. 2006, 42. [Google Scholar] [CrossRef]
- Neuman, S.P.; Tartakovsky, D.M. Perspective on theories of non-fickian transport in heterogeneous media. Adv. Water Resour. 2009, 32, 670–680. [Google Scholar] [CrossRef]
- Heidari, P.; Li, L. Solute transport in low-heterogeneity sandboxes: The role of correlation length and permeability variance. Water Resour. Res. 2014, 50, 8240–8264. [Google Scholar] [CrossRef]
- Hou, Y.; Jiang, J.; Wu, J. Anomalous solute transport in cemented porous media: Pore-scale simulations. Soil Sci. Soc. Am. J. 2018, 82, 10. [Google Scholar] [CrossRef]
- Edery, Y.; Guadagnini, A.; Scher, H.; Berkowitz, B. Origins of anomalous transport in heterogeneous media: Structural and dynamic controls. Water Resour. Res. 2014, 50, 1490–1505. [Google Scholar] [CrossRef]
- Voller, V.R. A direct simulation demonstrating the role of spacial heterogeneity in determining anomalous diffusive transport. Water Resour. Res. 2015, 51, 2119–2127. [Google Scholar] [CrossRef]
- Bijeljic, B.; Raeini, A.; Mostaghimi, P.; Blunt, M.J. Predictions of non-fickian solute transport in different classes of porous media using direct simulation on pore-scale images. Phys. Rev. E 2013, 87, 013011. [Google Scholar] [CrossRef]
- Gramling, C.M.; Harvey, C.F.; Meigs, L.C. Reactive transport in porous media: A comparison of model prediction with laboratory visualization. Environ. Sci. Technol. 2002, 36, 2508–2514. [Google Scholar] [CrossRef]
- Chiogna, G.; Cirpka, O.A.; Herrera, P.A. Helical flow and transient solute dilution in porous media. Transp. Porous Media 2015, 111, 591–603. [Google Scholar] [CrossRef]
- Rolle, M.; Hochstetler, D.; Chiogna, G.; Kitanidis, P.K.; Grathwohl, P. Experimental investigation and pore-scale modeling interpretation of compound-specific transverse dispersion in porous media. Transp. Porous Media 2012, 93, 347–362. [Google Scholar] [CrossRef]
- Barros, F.P.; Dentz, M.; Koch, J.; Nowak, W. Flow topology and scalar mixing in spatially heterogeneous flow fields. Geophys. Res. Lett. 2012, 39. [Google Scholar] [CrossRef]
- Le Borgne, T.; Dentz, M.; Villermaux, E. Stretching, coalescence, and mixing in porous media. Phys. Rev. Lett. 2013, 110, 204501. [Google Scholar] [CrossRef] [PubMed]
- Dou, Z.; Zhou, Z.-F.; Wang, J.-G. Three-dimensional analysis of spreading and mixing of miscible compound in heterogeneous variable-aperture fracture. Water Sci. Eng. 2016, 9, 293–299. [Google Scholar] [CrossRef]
- Rolle, M.; Eberhardt, C.; Chiogna, G.; Cirpka, O.A.; Grathwohl, P. Enhancement of dilution and transverse reactive mixing in porous media: Experiments and model-based interpretation. J. Contam. Hydrol. 2009, 110, 130–142. [Google Scholar] [CrossRef]
- Kitanidis, P.K. The concept of the dilution index. Water Resour. Res. 1994, 30, 2011–2026. [Google Scholar] [CrossRef]
- Kapoor, V.; Kitanidis, P.K. Concentration fluctuations and dilution in two-dimensionally periodic heterogeneous porous media. Transp. Porous Media 1996, 22, 91–119. [Google Scholar] [CrossRef]
- Cirpka, O.A. Choice of dispersion coefficients in reactive transport calculations on smoothed fields. J. Contam. Hydrol. 2002, 58, 261–282. [Google Scholar] [CrossRef]
- Molins, S.; Trebotich, D.; Steefel, C.I.; Shen, C. An investigation of the effect of pore scale flow on average geochemical reaction rates using direct numerical simulation. Water Resour. Res. 2012, 48. [Google Scholar] [CrossRef]
- Yang, A.; Miller, C.; Turcoliver, L. Simulation of correlated and uncorrelated packing of random size spheres. Phys. Rev. E. 1996, 53, 1516. [Google Scholar] [CrossRef]
- Pope, S.B.; Pope, S.B. Turbulent Flows; Cambridge University Press: Cambridge, UK, 2000. [Google Scholar]
- Rolle, M.; Kitanidis, P.K. Effects of compound-specific dilution on transient transport and solute breakthrough: A pore-scale analysis. Adv. Water Resour. 2014, 71, 186–199. [Google Scholar] [CrossRef]
- Dreuzy, J.R.; Carrera, J.; Dentz, M.; Le Borgne, T. Time evolution of mixing in heterogeneous porous media. Water Resour. Res. 2012, 48. [Google Scholar] [CrossRef] [Green Version]
- Dou, Z.; Sleep, B.; Mondal, P.; Guo, Q.; Wang, J.; Zhou, Z. Temporal mixing behavior of conservative solute transport through 2d self-affine fractures. Processes 2018, 6, 158. [Google Scholar] [CrossRef]
- Le Borgne, T.; Dentz, M.; Bolster, D.; Carrera, J.; de Dreuzy, J.-R.; Davy, P. Non-fickian mixing: Temporal evolution of the scalar dissipation rate in heterogeneous porous media. Adv. Water Resour. 2010, 33, 1468–1475. [Google Scholar] [CrossRef]
Figure 1.
The distribution of the generated solid grain in two-dimensional domain. The boundary conditions were applied for the solute transport simulation in all porous media.
Figure 1.
The distribution of the generated solid grain in two-dimensional domain. The boundary conditions were applied for the solute transport simulation in all porous media.

Figure 2.
The radius distribution of solid grains in PM1.

Figure 3.
Flow fields in four porous media with different characteristic of pore space. The local velocity plots at different cross-sections (x = 20 mm and x = 50 mm). The color code represents the computed pore-scale velocities at the case Peclet number (Pe) = 100. The velocity distribution of the cross-sections at a-a’, b-b’, c-c’, d-d’, e-e’, f-f’, g-g’, and h-h’ were shown in Figure 3a–h, respectively.

Figure 4.
The calculated dilution index for solute in the different degrees of heterogeneous pore-scale domains at the case of Pe = 100 (a–c), Pe = 200 (d–f) and Pe = 400 (g–i) respectively.
Figure 4.
The calculated dilution index for solute in the different degrees of heterogeneous pore-scale domains at the case of Pe = 100 (a–c), Pe = 200 (d–f) and Pe = 400 (g–i) respectively.


Figure 5.
The zoomed snapshots (Pv = 0.04, 0.055, 0.07 and 0.10) of local solute transport in the different heterogeneous porous media (PM1, PM4) for the Pe = 100 (a,b) and Pe = 400 (c,d).
Figure 5.
The zoomed snapshots (Pv = 0.04, 0.055, 0.07 and 0.10) of local solute transport in the different heterogeneous porous media (PM1, PM4) for the Pe = 100 (a,b) and Pe = 400 (c,d).

Figure 6.
Scalar dissipation rate estimated in different degree of heterogeneous pore-scale domains at the case Pe = 100, Pe = 200, and, Pe = 400 respectively.
Figure 6.
Scalar dissipation rate estimated in different degree of heterogeneous pore-scale domains at the case Pe = 100, Pe = 200, and, Pe = 400 respectively.


Table 1.
Properties of the cementation of PM1–4.
| Porous Media | Porosity | (mm) | (mm) | |||
|---|---|---|---|---|---|---|
| PM1 | 0.45 | 0.785 | 0 | 0 | 0.36355 | 1679 |
| PM2 | 0.40 | 0.818 | 0 | 0 | 0.29635 | 1679 |
| PM3 | 0.35 | 0.854 | 0 | 0 | 0.22507 | 1679 |
| PM4 | 0.30 | 0.888 | 154 | 4.62 | 0.23562 | 1112 |
Note: , the average radii of particles; , the number of cemented groups; , the average number of individual solid grains contained in a cemented group; , the average gap between two solid grains where solute plume pass through; , the number of gaps.
Table 2.
The properties of flow velocity distribution in PM1–4 under the Pe = 100, 200, and 400.
| Dimensionless Pe and Re | Porous Media | τa (s) | (-) | (m/s) | (-) | (m/s) | (m/s) |
|---|---|---|---|---|---|---|---|
| Pe = 100 Re = 0.0996 | PM1 | 24.622 | 0.943 | ||||
| PM2 | 26.776 | 1.098 | |||||
| PM3 | 29.155 | 1.506 | |||||
| PM4 | 31.530 | 2.319 | |||||
| Pe = 200 Re = 0.1992 | PM1 | 12.311 | 0.943 | ||||
| PM2 | 13.388 | 1.098 | |||||
| PM3 | 14.578 | 1.506 | |||||
| PM4 | 15.765 | 2.319 | |||||
| Pe = 400 Re = 0.3985 | PM1 | 6.1555 | 0.943 | ||||
| PM2 | 6.6940 | 1.098 | |||||
| PM3 | 7.2887 | 1.506 | |||||
| PM4 | 7.8825 | 2.319 |
Note: , the average velocity; , the maximum velocity.
Table 3.
The peak value of the dilution index in PM1–4 with Pe = 100, Pe = 200, and Pe = 400.
| Dimensionless Pe | The Peak Value of Dilution Index | |||
|---|---|---|---|---|
| PM1 | PM2 | PM3 | PM4 | |
| Pe = 100 | ||||
| Pe = 200 | ||||
| Pe = 400 | ||||
© 2019 by the authors. Licensee MDPI, Basel, Switzerland. This article is an open access article distributed under the terms and conditions of the Creative Commons Attribution (CC BY) license (http://creativecommons.org/licenses/by/4.0/).
Share and Cite
MDPI and ACS Style
Dou, Z.; Zhang, X.; Chen, Z.; Yang, Y.; Zhuang, C.; Wang, C. Effects of Cemented Porous Media on Temporal Mixing Behavior of Conservative Solute Transport. Water 2019, 11, 1204. https://doi.org/10.3390/w11061204
AMA Style
Dou Z, Zhang X, Chen Z, Yang Y, Zhuang C, Wang C. Effects of Cemented Porous Media on Temporal Mixing Behavior of Conservative Solute Transport. Water. 2019; 11(6):1204. https://doi.org/10.3390/w11061204
Chicago/Turabian StyleDou, Zhi, Xueyi Zhang, Zhou Chen, Yun Yang, Chao Zhuang, and Chenxi Wang. 2019. "Effects of Cemented Porous Media on Temporal Mixing Behavior of Conservative Solute Transport" Water 11, no. 6: 1204. https://doi.org/10.3390/w11061204
Note that from the first issue of 2016, this journal uses article numbers instead of page numbers. See further details here.