Review of the Quantitative Resilience Methods in Water Distribution Networks


1
Department of Construction Management, School of Economics and Management, Beijing Jiaotong University, Beijing 100044, China
2
Office of Water Programs, California State University, Sacramento, 6000 J Street, Sacramento, CA 95819-6025, USA
3
Institute of the Environment and Sustainability, University of California, Los Angeles, 619 Charles E. Young Dr. East, La Kretz Hall, Suite 300, Los Angeles, CA 90095-1496, USA
*
Author to whom correspondence should be addressed.
Water 2019, 11(6), 1189; https://doi.org/10.3390/w11061189
Submission received: 15 April 2019
/
Revised: 1 June 2019
/
Accepted: 3 June 2019
/
Published: 7 June 2019
(This article belongs to the Section Urban Water Management)
Abstract
:Water distribution networks (WDNs) are critical contributors to the social welfare, economic growth, and public health in cities. Under the uncertainties that are introduced owing to climate change, urban development, aging components, and interdependent infrastructure, the WDN performance must be evaluated using continuously innovative methods and data acquisition. Quantitative resilience assessments provide useful information for WDN operators and planners, enabling support systems that can withstand disasters, recover quickly from outages, and adapt to uncertain environments. This study reviews contemporary approaches for quantifying the resilience of WDNs. 1508 journal articles published from 1950 to 2018 are identified under systematic review guidelines. 137 references that focus on the quantitative resilience methods of WDN are classified as surrogate measures, simulation methods, network theory approaches, and fault detection and isolation approaches. This study identifies the resilience capability of the WDNs and describes the related terms of absorptive, restorative, and adaptive capabilities. It also discusses the metrics, research progresses, and limitations associated with each method. Finally, this study indicates the challenges associated with the quantification of WDNs that should be overcome for achieving improved resilience assessments in the future.
1. Introduction
Water distribution networks (WDNs) are critical infrastructure systems [1]. They supply water with sufficient pressure and flow to the points of consumption, ensuring social welfare, economic growth, and public health. WDNs are assembled using numerous components, including pipes and valves, which are connected in a large spatial accumulation, in a similar manner to other infrastructure such as power grids and transportation networks. In WDN models, for planning and analysis, the parameters, such as tanks, reservoirs, and end-users, are represented as nodes, and the pipes, pumps, and valves are represented as links.
WDNs are sensitive to failures and disturbances. The failure of one or more components in a WDN can adversely affect the system operations or cause a chain reaction of failures in other components. For example, the San Francisco earthquake in 1906 [2] destroyed three major pipes, rupturing thousands of smaller pipes and cutting off the water supply; this made the fire caused by the earthquake continue for three days, causing 800 deaths and property losses accounting to 400 million dollars. The Tangshan earthquake in 1976 [3] stopped the water supply for more than one week, whereas the Northridge earthquake in 1994 [4] destroyed 74 water main pipes, resulting in approximately 1200 leaks and stoppage of water supply for several weeks. The Kobe earthquake in 1995 [5] damaged more than 4000 incidents of damage to water pipes and cut off 1.2 million end users. Only one-third of the WDN was repaired after one week, and the complete period required for repair was two and a half months. The Wenchuan Earthquake in 2008 [6] affected 181 cities in the Sichuan Province and damaged 47,642.5 km of water pipes. Some cities (such as Dujiangyan and Mianzhu) remained deprived of their normal water supply for a year after the occurrence of this earthquake.
The emerging uncertainties have introduced new risks with respect to WDN operation and planning. The impacts of climate change, which are already being felt in the water systems in various communities, will become increasingly severe and intense in the future [7,8]. The WDN planners must re-evaluate the balance between water supply and demand under climate-change events such as increase in sea level, earthquakes, storms, and heatwaves [9]. Meanwhile, the WDNs in several industrialized counties and existing systems exhibit endogenous problems such as aging components, increasing their vulnerability to extreme events. Furthermore, the rapid development of cities has led to the high concentration of population in cities as well as the emergence of cities as financial hubs. The cascading failures caused by the closely associated interactive infrastructures can exacerbate the impact and destructiveness of disasters [10,11].
Improving the system performance and addressing new challenges have attracted the attention of system engineers, water utility managers, and operators [12,13,14,15,16]. To improve the performance and reduce the risk of the WDNs, the WDN designs are assessed by researchers based on their reliability, risk, vulnerability, and resilience.
Reliability and risk describe the failure conditions from a probabilistic perspective. The reliability of a WDN defines the probability of satisfying the flow and pressure requirements under a given condition at any given time [17]. Water planners commonly use reliability to reduce the risk of a system failure. Risk defines the probability of failure and can be understood as 1 minus the reliability [18].
Vulnerability describes the severe or serial consequences of a failure. Even a low-probability disturbance can result in severe consequences because few systems have sufficient redundancy to resist all possible failures in case of limited investment [19]. An example is the scale-free network concept considered in complex network research. Because a node in a scale-free network can accept any number of connections, it is extremely resistant to random failures but extremely vulnerable to targeted attacks. This robust yet fragile property of the scale-free networks [20,21]. has been verified using various infrastructural systems, including those in power grids [22], transportation networks [23], and WDNs [24,25,26].
Resilience determines the mechanism and time of recovery from a failure condition. Resilience was initially defined by ecologists [27] as the ability of the ecosystems to maintain their multispecies structure under a pressure scenario [28]. Further, engineering resilience is defined as the time required for the system to regain equilibrium after the occurrence of a disturbance event [29]. Critical infrastructure resilience defines the ability of a system to resist or prevent possible disasters, absorb losses, and return to normal conditions [30]. Water resource resilience assesses how quickly the system can return to a satisfactory state after the occurrence of failure [18]. In their report, the National Research Council of the United States defined resilience as “the ability to prepare and plan for, absorb, recover from, or more successfully adapt to actual or potential adverse events” [31]. Socio–ecological resilience extends the ecological resilience concept to the capacity to adapt to changes as well as the self-organizing capacity [32,33]. The principles, related concepts, characteristics, and measurements of resilience have been established in different research fields [34,35,36].
WDN resilience assists the designing and planning of WDNs that can effectively resist internal and external disturbances, quickly respond to disturbances, and adapt to uncertain future conditions. New methods and technologies are emerging in this field. WDN resilience, especially the initial and potential states before and after disturbances and their durations, can be measured using quantitative methods. The decision makers can then analyze and compare different resilience-enhancing strategies to ensure effective WDN operation. However, considerably less attention has been devoted to the resilience reviews of WDNs using quantitative methods. Li et al. [37] discussed important factors with respect to disinfectant residual stability, and Bello et al. [38] reviewed the mathematical models that resolve the management problems with respect to water infrastructure. Gupta et al. [39] provided a comprehensive analysis of the leak management techniques. Mala-Jetmarova et al. [40] systematically reviewed the formulation, method selection, and data post-processing of WDN optimization. Gheisi et al. [41] classified the mathematical methods of WDN reliability into three groups (i.e., analytic approach, systemic-holistic approach, and heuristic approach) by focusing on the failure methods. Xu [42] reported potential approaches for water-leakage control and their benefits in terms of environmental conservation. Shin et al. [11] reviewed quantitative approaches with respect to the water infrastructure systems, including the water resource and distribution systems.
To understand the quantitative research related to WDN resilience, this study surveys the literature on the quantification of resilience in water distribution networks. We identified 1508 journal articles published from 1950 to 2018 by following systematic review guidelines. Among these articles, 137 focused on the quantitative resilience methods of WDN. Thus, this study denotes three basic capabilities associated with the resilience of WDNs. The references are clustered into four major groups, and their metrics, research progresses, and limitations are discussed. Finally, this study proposes challenges that are encountered while quantifying the WDN resilience for obtaining improved resilience assessments in future work.
The remainder of this study is organized as follows: Section 2 presents the questions, search protocol, and analysis approach. Section 3 presents the filtering results and further clusters the references, and Section 4 discusses the quantitative resilience methods, i.e., the surrogate measures, simulation methods, network theory approaches, and fault detection and isolation (FDI) approaches. The surrogate measures focus on network redundancy with respect to energy and flexibility. Further, the simulation methods evaluate uncertainties with respect to the time, scenarios, and demand changes. The network theory approaches provide solutions on large-scale networks based on the graph theory or the complex network theory. The FDI approaches diagnose failures in terms of leakage and water quality. Section 5 offers directions for future assessments of WDN resilience in the context of resilience capabilities along with the challenges that may be encountered while using quantitative methods. Section 6 concludes this study.
2. Methods
We followed the guidelines of systematic review in the conservation and environmental sciences [43]. The steps in these guidelines are widely adopted in ecological science [44,45,46] and water systems [47,48,49].
2.1. Questions Definition
When surveying the existing literature on resilience in WDNs, we focused on the following questions:
- What are the capabilities of resilience in WDNs?
- What quantitative methods for determining WDN resilience were adopted in the existing studies?
- What are the advantages and disadvantages of the surveyed quantitative resilience methods?
- What are the challenges and gaps facing the future use of resilience methods in WDNs?
2.2. Search Protocol
Papers related to WDN resilience were searched in academic databases and publishers. The Web of Science database is among the most multidisciplinary reference search platforms. Publishers such as ScienceDirect, SpringerLink, and Taylor & Francis Journals Online were also searched. The paper type and search method were input as “journal article” and “topic search”, respectively. The search was not limited to geography or scale. The language was English, and the search time interval was 1950–2018.
The search protocol was set to (“resilien*”) AND (“water distribution*”). The asterisk ‘*’ in the search protocol indicates that the succeeding letter was not limited. For example, “resilien*” retrieved articles with either “resilience” or “resiliency” in their contents. These keywords limited the research scope of the papers to review.
2.3. Analysis
The search process yielded the possibly relevant references. We merged the reference records from the database and publishers, eliminating the duplicate items. The first filter was the field. References discussing water resources and civil engineering were included by reading their titles. These items were classified into qualitative and quantitative methods by reading the abstracts and keywords. Qualitative methods assess the WDN resilience without numerical descriptors [50], whereas quantitative methods require mathematical calculations. The remaining references were further filtered by WDN-related terms, excluding papers on water resource systems, rainwater, wastewater, irrigation, and desalination. The quantitative methods in WDN resilience were clustered by CiteSpace [51]. The clustering process of using CiteSpace was described as follows:
Step 1: Data collection.
Downloaded each bibliographic record from Web of Science and publishers, then saved them in the data files.
Step 2: Keyword co-occurrence network.
CiteSpace generated a merged network based on the corresponding time-sliced networks. The node type and term source in the CiteSpace setting were set to “keyword” and “title, abstract, author keywords, and keywords plus,” respectively.
The references were analyzed by pathfinder network scaling and pruning slice networks. Pathfinder network scaling is a link reduction technology [52,53]. It uses a triangle inequality test to recognize whether a link should be preserved or eliminated [54]. CiteSpace has two link reduction technologies, i.e., pathfinder network scaling and minimal spanning trees. Chen and Morris [55] demonstrated that pathfinder network scaling was superior than minimal spanning trees in maintaining the cohesiveness of the critical links.
Also, Citespace provides two pruning strategies to improve the clarity of critical nodes and links. Pruning slice networks prunes the network with individual time-sliced networks while pruning the merged network focuses on the synthesized network [56]. Pruning slice networks was used in the paper to capture the important links in each time interval.
Step 3: Clustering.
The clustering and automatic labeling [57] processes are introduced briefly. The cosine coefficients measure the co-citation similarities between references i and j [58]. It is the ratio of the number of times that they are cited together to the citation counts of i and j respectively. An optimization problem with cut function and cosine coefficients groups strongly connected nodes together and divides loosely connected ones separately [59,60,61]. The optimal cut then delivers to determine the number of clusters uniformly by the spectral clustering algorithm [59,60,61].
Cluster labels are characterized from noun phrases in each cluster. Keyword lists was chosen as the source. The algorithms for automatic ranking extracted terms in CiteSpace are tf*idf [62], log-likelihood ratio (LLR) tests [63], and mutual information [64]. LLR tests were used in the paper because they reflected the best cluster labels with high uniqueness and convergence [58,65]. LLR tests depend on the asymptotic distribution [63]. They access the goodness of fit of two statistical models with the ratio of their likelihoods. More information about the clustering process in CiteSpace can be found in [58].
Step 4: Classification.
The cluster labels were further filtered. Two filter criteria were defined to analysis the labels. The first filter criterion was that labels should focus on the quantitative methods. For example, labels described about the field were excluded. The second filter criterion was that labels were not a part of others. For example, if the quantitative method label #A belonged to label #B, then label #A combined into label #B. The cluster labels assigned to each reference was further confirmed by full-text reading. Also, each paper was required to address one or more of the key research questions in Section 2.1. Finally, the information pertinent to the proposed questions was extracted from the references.
3. Results
The initial search results yielded 1508 possible references. Among these, 803 references focused on water resources and civil engineering. The second filter identified 67 references using qualitative methods, including 48 case studies, nine interview-based studies, seven survey-based studies, and three discussions of theoretical framework. Finally, 137 references focused on quantitative resilience methods of WDNs.
3.1. Clustering of Quantitative Resilience Methods
The bibliographic record of the 130 quantitative references was downloaded from Web of Science, while for the other seven items information was downloaded from the publishers.
CiteSpace analyzed these records and generated the visualized network. There were 55 nodes and 121 links in the keyword co-occurrence network. The cluster analysis provided by CiteSpace detected the cluster labels. The six labels were water distribution system, surrogate measure, resilience index, simulation, FDI, and complex networks (Figure 1). Labels sorted in descending order by the number of member references, starting from the largest cluster #0 water distribution system to the smallest cluster #5 complex networks.
3.2. Classification of Quantitative Resilience Methods
We merged the six cluster labels into four groups according to the filter criteria. The top label was water distribution system, which presented the field but not quantitative resilience method. The other five labels marked the quantitative resilience methods. However, the resilience index belonged to the surrogate measures [66]. We combined it into the surrogate measures to enhance the clarity. WDN performance indicators offer information about the system capability. Some indicators require high computational cost. For this reason, researchers proposed indirect evaluation methods as surrogate measures [41,67,68,69]. One of the most employed surrogate measures is the resilience index [70,71].
Four labels emerged ultimately. The surrogate measures were the resilience index, modified resilience index, network resilience, flow entropy, and surplus energy factor. Network resilience improved the resilience index. Although it has the name of “network”, it belonged to the surrogate measures due to it rewarded reliable loops with surplus power [68]. The simulation method included a demand-driven analysis and a pressure-driven analysis. The network theory approaches included graph theory and complex network theory. The FDI approaches included hydraulic-based and water quality-based FDIs.
The existing quantitative methods on WDN resilience were then grouped and reviewed. There were 70 references on surrogate measures, 34 on simulation methods, 20 on network theory approaches, and 13 on FDI. The metrics, research progresses, and their limitations will be discussed later in the review.
3.3. Distribution by Year of Publication
Figure 2 shows the publication-year distribution of the 137 quantitative references. The number of publication items was relatively average before 2013, but trended upward after 2013 and peaked in 2016. This indicates an increasing dedication to quantitative resilience methods.
The distribution of annual publications differed for different methods, and among the classified types. A certain number of papers on surrogate measures were published each year, implying that surrogate measures were the most widely used approaches. Simulation methods were the second-most widely used methods, whereas FDI and network theory approaches appeared later. The network theory approaches trended upward after 2013, indicating their increasing application to WDN resilience evaluations.
4. Quantitative Resilience Methods
This subsection presents the three key capabilities of WDN resilience. It also discusses the resilience metrics, research progresses, and limitations of the classified methods.
4.1. Three Capabilities of WDN Resilience
A unified definition of WDN resilience appears to be lacking in the literature. Individual researchers have defined WDN resilience to fit their own research concerns and measurement approaches [72,73,74,75]. However, the diverse definitions share a few common characteristics. Xu and Kajikawa [34] statistically compared the critical terms of resilience in numerous fields by a natural language processing approach [76]. They found that “recovery” appeared more frequently than “stability”, “adaptability”, “transformability”, “vulnerability”, “robustness”, “resistance”, and “elasticity”, especially in water systems engineering. In resilience, recovery means the ability to bounce back from a failed or unsatisfactory state during a specific timescale. Given its interdisciplinary nature, resilience does not necessarily mean that the system recovers its previous state from a disturbed state. For example, in ecosystems, a state change is difficult or impossible to reverse. In this case, resilience must be contextualized for multiple stable states [77]. In this paper, resilience is discussed in the engineering context, in which equilibrium typically presents as a single static state [34]. WDNs can recover to the pre-disturbance equilibrium or guarantee effective water supply functions [78,79].
WDNs are resource-related infrastructure systems. In the planning and management of WDNs, resilience means a low impact of failures as well as failure resistance. The most important requirements are failure recovery and the provision of basic services. Resilience in WDNs is a systematic concept demanding long-term evaluation and urgent attention to the interdependency between the resources, social factors, and technology. Considering the resilience capabilities in various disciplines and water system applications [11,30,33,34,50,80,81], we define WDN resilience as the ability to absorb local failures, to quickly recover and maintain the essential service functions, and to adapt to long-term changes in the environment and uncertainty disturbances. In other words, the three major capabilities of resilience are absorptive capability, restorative capability, and adaptive capability. These capabilities are described below:
- Absorptive capability is the ability of a system to absorb local failures within an acceptable range and maintain its performance during such failures. The absorptive capacity can be evaluated in normal service and at the functional threshold. Two related states were identified: (1) the normal service state (the baseline of the WDN’s service); and (2) the functional threshold states of the WDN occurring at the maximum bearable disturbance. When the disturbance exceeds the threshold, the service performance degrades and the WDN cannot self-heal. To improve this capability, researchers have proposed the following strategies: (1) Strengthening the protection of the crucial components, making them resistant to random failures [73,82,83]; (2) strengthening the real-time monitoring and management of WDNs [84,85,86]; and (3) increasing the redundancy and flexibility of the system to improve its uncertainty absorbing capacity [67,87,88,89].
- Restorative capability defines the ability of a system to recover after service degradation. Restoration is judged complete when the system returns to its pre-disaster state, or satisfies the users’ needs after identification and repair of the failed component. Restorative capacity can be further divided into degree of recovery and recovery time. The degree of recovery expresses the final service performance of the WDN after adopting recovery strategies. This measure is limited by the repair budget (i.e., funds, repair materials, and other consumables) [90]. The recovery time refers to the period between service degradation and return to normal state. The recovery time depends on the amount of recovery resources, the adopted recovery strategies, and the recovery schedule [79]. Depending on the recovery degree and recovery time, the restorative capacity is further divisible into emergency recovery and post-disturbance rebuilding. Emergency recovery restores the basic service functions within a short time after a disturbance. Post-disturbance rebuilding slowly returns the system to its pre-disturbance state. Proposed improvement strategies for this capability include: (1) Designing an emergency response in management and organization [91,92]; (2) rapid identification of failure locations and service reduction; (3) effective isolation of failure sections [26,93,94]; (4) formulation of emergency strategies [73,83,95]; and (5) efficient allocation of recovery resources and repair of failed components [96].
- Adaptive capability is the long-term adaptability of the system to changing environments and disturbances. For example, historical rainfall data cannot accurately predict the probability of future high-intensity rainfall and floods under climate change. WDNs must adapt to uncertainties at different evaluation levels and in various scenarios. Proposed improvement strategies for this capability include: (1) Optimizing the components to adapt to natural disasters caused by climate change, such as earthquakes and floods [97,98,99,100]; (2) increasing the absorptive capacity of crucial components to resist targeted attacks and cascading failures in WDNs [24]; (3) strengthening the connection points of the interdependent infrastructure to reduce the number of large-scale cascading failures [99,101,102]; and (4) periodically identifying and updating the service status of aged WDNs components.
A system responding to disturbances such as disasters and climate change may exist in any of several possible states. In ecosystems, a system can change from one configuration to another qualitatively different configuration, implying multiple stable states [77]. Different from ecosystems, resilience in engineering systems is measured by the time between the disturbance and the return to normal functionality [29,34]. WDNs are a class of engineering systems that must recover their function to the pre-disturbance equilibrium. Figure 3 visualizes the temporal progression of the absorptive, restorative, and adaptive capabilities in WDN resilience, as described in the references [96,103,104]. A WDN system with high absorptive capability could resist local failures and small disturbances during daily operation in the period T0–T1. At time T1, operations were disrupted by an extreme event. At this time point, service failure reduced the level of service to below the predefined performance threshold [104]. The performance was minimal at T2. Restoration was then begun, and proceeded over two periods: emergency recovery during T2–T3, which improved the service performance but did not recover the normal state, and post-disturbance rebuilding during T3–T4, which fully restored the service performance (i.e., the post-disturbance state). Adaptive capability focuses on the long-term response capacity of the WDN under climate change or extreme events. The period after T4 represents the resilience enhancement strategy, implemented for uncertainty resistance to future extreme events.
To illustrate Figure 3, we borrow an example from Zhuang [83] and Buzna [105]. The performance of a WDN designed to absorb failures fluctuated between PNormal and PLoss after a pipe burst. The performance threshold at T1 was triggered by an extreme event such as an earthquake, or when a small disturbance evolved into large-scale failures. After several pipe bursts, the service performance dropped to PMin. During the T1–T2 period, the pressure reduced and the flow rate of the water delivered to customers decreased. A main pipe breakage would cut the water supply to a whole area. The reduced pressure caused hydraulic failures. Water utility managers invested their resources into quick and effective repair from T2 to T3, and the service performance bounced back to PLoss. During T3 and T4, the water utility managers rebuilt or optimized the destroyed WDN, and restored the performance to the pre-disturbance level PNormal. However, under new challenges such as climate change and increased water demand, WDNs must run more efficiently and stably than in the past. Long-term measures for demand-meeting and uncertainty adaptation could be implemented after T4.
4.2. Surrogate Measures
Surrogate measures are reliable agent-based methods that evaluate the surplus energy, redundancy, and flexibility of WDNs in network-redundancy analyses. Surrogate measures can be combined into single-objective or multi-objective optimizations. They have been extensively investigated and applied.
4.2.1. Metrics
The resilience index (RI) and flow entropy have been widely introduced in surrogate measures. The RI was first proposed by Todini [72] to describe the surplus head at each node. The total available power is the power dissipated in the pipes plus the power delivered to users. The RI is a global performance index, which cannot evaluate the resilience of each node. Prasad and Park [106] developed RI to network resilience considering the effect of redundancy. It evaluated the surplus energy and reliable loops. Jayaram and Srinivasan [107] defined the modified resilience index (MRI) as the ratio of surplus energy to the demand energy. Unlike the RI, the MRI can evaluate the resilience at individual nodes.
The flow entropy measures the redundancy and flexibility in WDN resilience evaluations [67,87,88,108,109,110,111,112]. Redundancy means that multiple supply paths are available in the network. When a specific supply path fails, the water is diverted through other supply paths to meet the requirements of the water demand node. Awumah et al. [113] first applied the entropy concept to WDN analysis. Tanyimboh and Templeman [108,112] further developed flow entropy in resilient WDN design.
4.2.2. Research Progresses
Surrogate measures have been improved, optimized and compared by various researchers. Creaco et al. [114] introduced a pressure-driven analysis of RIs that improves the estimation of leakage effects. To reduce the MRI, Jeong et al. [115] considered the increase in demand head with increasing elevation. They recalculated the elevation at each node to improve the result accuracy. A surrogate measure can also be combined into single-object or multi-object optimization. The multi-object optimization schemes of Zheng et al. [116], Wang et al. [117], Bi et al. [98], and Suribabu [118] maximize the resilience while minimizing the cost. Other researchers (Alvisi and Franchini [119], Di Nardo and Natale [120] and Campbell et al. [121]) combined surrogate measures with graph theory for water-loss detection and pressure management in district metered areas (DMAs). Meanwhile, Raad et al. [66], Baños et al. [71], Greco et al. [122], and Tanyimboh et al. [123] compared the performances of surrogate measures, mixed reliability index, flow entropy, network entropy, and the surplus energy factor.
4.2.3. Limitations
Surrogate measures are efficiently calculated and can be embedded in multi-objective optimization to ensure WDN resilience. They provide an effective strategy for scenario-based analyses and can integrate other modeling techniques to support resilient decision making. Surrogate measures belong to the class of deterministic models. The outcome of a deterministic model is precisely determined through the inputs and their interrelationships, with no room for random variation. In uncertainty-response evaluations, deterministic methods must be integrated with other methods. For example, Baños et al. [71] noted that surrogate measures do not consider the over-demand or the capability in delivering demand under uncertainty. Also, while surrogate measures ensure high resistance and absorptive capacity of failure, they do not consider the resource use of the WDNs during recovery from failure conditions.
4.3. Simulation Methods
Simulation methods handle various uncertainties such as time, multi-failure scenarios, and demand changes.
4.3.1. Metrics
Depending on their calculation process, simulation methods adopt either discrete [82,83,124,125,126,127,128,129,130,131,132,133,134,135,136,137,138] or continuous [79,90,96,103,129] metrics. Both types of methods capture the evolving water demand and water quality in the system, but differ in when the information is relayed (at time points or during time periods). Discrete metrics compute the resilience at discrete time points separated by an artificial time step that depends on the iteration process [14]. Hashimoto et al. [18] defined resilience as the average probability of recovery from failure during a time step. Zhuang et al. [83] defined availability as a measure of system resilience, obtained by summing the resilience at each node. They expressed node resilience as the ratio of total available demand to the total required demand during the time steps of system failure. On the contrary, continuous metrics compute the resilience during time periods. The performance of a WDN is expressed as the area under the performance curve over a certain period. Ouyang and Dueñas-Osorio [103] quantified the time-dependence resilience metric as the area ratio of the real performance curve along the time axis to the target performance curve along the time axis.
4.3.2. Research Progresses
Ouyang and Dueñas-Osorio [103] assessed the resilience performance of a WDN at the disaster prevention stage, the damage propagation stage, and the recovery stage. Zhao et al. [96] introduced this time-based resilience measure to two post-disaster rebuilding strategies, as part of identifying the recovery actions related to resilience. Their local rebuilding strategy focused on enhancing the components, such as extra-power support for pumps. They also evaluated the short-term emergency resilience assisted by recovery budgets and recovery resources [90]. Zhuang et al. [83] defined availability as a quantifiable metric of WDN resilience, namely, the fraction of demand supplied during disruptions. Cimellaro et al. [79] divided the control time surrounding a given extreme event into five periods: the normal operation period (baseline), the period immediately after the extreme event, the period before the first emergency, the transition period with partial service, and the normal operation period after the repair operations. These studies additionally modeled the evolution and dynamics of the WDN resilience.
Failure scenarios consider not only the damage caused by a single disaster such as an earthquake [97] or fire [130], but also multi-failure scenarios. The global resilience analysis developed by Diao et al. [73] tests a WDN’s responses to pipe failure, excess demand, and substance intrusion, and identifies the relationship between multi-failure modes and stress magnitude. Klise et al. [74] simulated the component damage (tank and pipe leaks and consequent pump failure) after an earthquake. They included post-earthquake fires because the water utilities require sufficient capacity to meet the firefighting demands and durations.
Changes in WDN demands are commonly calculated by demand-driven and pressure-driven approaches [128,131,132,133]. Demand-driven analysis provides reasonable and reliable calculation results under normal operation, when the node demands in WDNs are fully satisfied. However, when the available demands are less than the required demands (as in pressure reduction scenarios), demand-driven analysis yields inaccurate results. For this reason, researchers later developed pressure-driven analysis, which assumes pressure-dependent node demands. This analysis obtains a more realistic number of critical nodes and their pressure distribution [134]. Also, pressure-driven analysis effectively avoids a negative water pressure under failure conditions. The screening results of our search protocol yielded two open-source software packages developed for hydraulic and quality-assessment simulations.
EPANET is the primary open-source software for analyzing WDN operations. EPANET simulates the hydraulics and water quality of the WDN. Its extended-period analyses evaluate the future changes in WDNs. The Toolkit dynamic library of EPANET allows developers to customize the software to their specific needs. Although based on demand-driven analysis, EPANET can embed pressure-driven analysis for more accurate results [135,136].
Another open-source package, Water Network Tool for Resilience (WNTR), was introduced by Klise et al. [74]. This software simulates the topology, hydraulics, and water quality after multiple disasters (such as earthquakes, contamination incidents, and power outages). WNTR was developed to extend the capabilities of EPANET. It simulates disruptive incidents, provides multiple resilience enhancement strategies, and obtains the pressure and flow by a pressure-driven analysis. The EPANET and WNTR packages are compared in Table 1.
4.3.3. Limitations
Simulation methods obtain accurate results, and also identify the sensitive factors. The indicators emphasized as part of the analysis generate different system—performance outcomes. For instance, system simulations with pressure and demand indicators yield very different resilience evaluations. Moreover, the WDN performance under various threats—earthquakes, contamination, and extreme heat—can depend on the specific network structure and demands. Because WDNs can be more resilient to one failure condition than another, the resilience must be simulated under multiple failure conditions before optimizing the resilience operations.
Simulation methods for estimating WDN resilience face several challenges. First, these methods require complicated calculations requiring delicate design. Second, many parameters are involved in the simulation method. The combination of hydraulic parameters and failure modes significantly increases the computational costs. More detailed simulations provide accurate results but are very time-consuming. Therefore, large-scale WDNs should consider the acceptable degree of simulation accuracy within a reasonable simulation time. Finally, the choice of parameters (such as water demand factors) in the simulation needs further discussion, and the simulation results must be verified in calibrations of real WDNs.
4.4. Network Theory Approaches
The indicators of network theory approaches are obtained from graph theory or complex network theory. Network theory analyzes the connectivity by abstracting WDNs as node–link representations. Network theory approaches have attracted much attention because they can process large-scale WDNs.
4.4.1. Metrics
Resilience metrics in network methods are divided into two groups: network connectivity [75,119,121,137,138] and network redundancy [100,104,139,140,141]. Network connectivity was proposed for dividing DMAs [75,121,137]. The most widely used network-redundancy metrics are the link density and node degree from complex network theory [104,140,141,142,143], which focus on the network topology. Yazdani et al. [139] expressed the pressure and flow requirements in WDNs using the demand-based node degree.
4.4.2. Research Progresses
WDNs are typically represented as networks of nodes (i.e., reservoirs, tanks, and consumers) and links (i.e., pipes and valves). Whereas performance is often assessed using typical operational parameters, additional indices for design and performance evaluation can be derived from collections of network metrics, developed in the general study of network structure and function. Network theory approaches adopt the metrics of graph theory or complex network science, such as robustness, vulnerability, and network efficiency. Resilience enhancement strategies increase the network redundancy. Combining statistical structure measurements (link density, average node degree, network diameter, average path length, clustering coefficient, meshed-ness coefficient, central-point dominance, density of articulation points, and density of bridges) with spectral metrics (spectral gap, algebraic connectivity), Yazdani et al. [142] obtained useful information on WDN resilience in local sections and global expansions. Improving the redundancy is necessary for enhancing the resilience and import in low-cost but accurate analyses with limited-scale expansion strategies. To combine topology with the flow features in WDNs, Yazdani and Jeffrey [139] further developed the entropic degree metric, which considers both the connectivity and the flow passing through each pipe. Di Nardo et al. [140] provided a two-stage model that first evaluates the WDN topology, and then quantifies the resilience with a surrogate measure.
Another application developed through network theory approaches is network sectorization for DMAs. WDNs are usually partitioned by a two-step process. The first step is clustering, which aims to define the network subsets. Among the various clustering methods are breadth-first search [119], depth-first search [137], K-shortest paths [75], spectrum clustering algorithms [144,145], and multi-level-recursive algorithm [146]. The second step is division, which partitions the network by inserting flow meters or valves. Heuristic optimization techniques such as genetic algorithms [145,147] can minimize the economic investment while maximizing the hydraulic performance. Combined resilience metrics reflect the pressure and flow requirements.
4.4.3. Limitations
Network theory approaches based on topological structure provide quick and practical resilience results. However, WDNs include several non-topological characteristics that must be integrated into the network analysis, such as the demand factors, valve distribution, pipe length and diameter, aging factors, and contaminants. These WDN characteristics differ from the metrics of graph theory and network science. The calibration and comparison between network metrics and WDN characteristics need further discussion.
Topological disruptions not only lead to connection failures, but also indirectly cause variations in nodal pressure or water quality. These variations compromise the service performance and public health. However, topological measures describe only the network structure, and cannot reveal the network properties of the whole network. Resilience in WDNs depends on both the topological measures and the hydraulic properties along with the consumer demands. A realistic evaluation of WDN resilience must shift from purely topology-based methods or hydraulic analyses to a combined topological and hydraulic viewpoint [148]. An example is the two-tiered approach of Zarghami et al. [149], which measures the local and global redundancies by the cospanning edge betweenness and the entropy-based cospanning redundancy index, respectively. Meng et al. [104] studied the interplay between global resilience analysis and topological attributes. They pointed out that only the spatial and temporal scales were strongly influenced by some topological attributes. Metrics for topological attributes alone cannot support WDN resilience design. Farahmandfar and Piratla [150] compared the topology-based and flow-based methods in optimal rehabilitation schemes after an earthquake. They reported that the topology-based method reduced the computational time of the simulation (to 55% that of the flow-based method), but also reduced the serviceability of the rehabilitation (to approximately 80% that of the flow-based method).
Although topology-based methods usually lower the computational time, flow-based methods release more appropriate results, which is important for performance evaluations. The correlation between the topology-based metrics and flow-based metrics requires further discussion. Moreover, the usefulness of WDN resilience can be improved by targeting the function and level of the resilience. For instance, the resilience requirements depend on the country, region, city, population distribution, and industrial needs of the service. The fundamental process in WDN simulations is building the node–link representations and exploring the connectivity and redundancy of the network. More in-depth searching of resilience assessments that meet different user demands and varying requirements is warranted.
4.5. Fault Detection and Isolation (FDI) Approaches
FDI approaches, which detect and locate failures in WDNs, are crucial for improving the resilience of WDNs. FDI assists the monitoring and event identification by water utility staff.
4.5.1. Metrics
FDI approaches monitor the water hydraulics and quality in real time, usually by time-varying metrics. Pressure and flow are commonly used for leakage detection in water hydraulics [84,151,152], while water quality is commonly assessed by the volume of contaminated water consumption and the number of infected individuals in the population [85,153,154].
4.5.2. Research Progresses
FDI approaches are suitable for leakage detection and isolation. Pipe breaks or loose joints cause water losses by leakage, ultimately leading to WDN failure [155]. Leakage control is a main challenge for water utilities, as leakage imposes a heavy economic burden and negatively impacts on consumers [156]. Eliades and Polycarpou [84] formulated an automated fault-diagnosis framework that captures the structural changes (leakages) by Fourier analysis of the discretized DMA inflow signals. Based on the difference between the measured and estimated pressures, Pérez et al. [151,152] improved the fault isolation in WDNs by a residual fault-sensitivity analysis. Cuguerò-Escofet et al. [157] developed a validation and reconstruction method, using spatial and time-series models to guarantee the sensor data.
FDI approaches can also monitor contamination events in water-quality evaluations. The mathematical framework of Eliades and Polycarpou [85] diagnoses faults in the data of sensors placed in large-scale WDNs, treating the contaminants as measures to increase consumer protection. The authors also developed a real-time decision support system based on decision trees [153]. They isolated the contamination source area and evaluated its possible impact. Lambrou et al. [154] implemented a low-cost method that detects local water quality.
For monitoring both leakage and quality, the sensors must be optimally placed in the WDN. Hagos et al. [158] optimized the meter location by a binary integer program that maximizes the detection effectiveness. Using robust mixed-integer optimization and a robust greedy approximation, Sela and Amin [159] optimized the sensor input when some sensors were interrupted.
4.5.3. Limitations
WDNs have evolved into large-scale networks with interconnected components. FDI approaches, which handle the dynamics of structural and hydraulic uncertainties, propagation, and reaction [85], are compromised by budget constraints and sensor quality. High performance in model-based FDI requires the placement of numerous high-quality sensors, which may be prohibitively costly to water utilities. Some water utilities can afford only the measurement of standard quality indicators (such as pH and chlorine amount) by a small number of sensors. The cost–benefit optimization of sensor placement needs further attention. The tradeoff between the detection probability (DP) and the rate of false alarm (RF) must also be considered [158]. Especially, the DP should be maximized while simultaneously minimizing the RF and detection time.
5. Discussion
Water systems are built using available technologies to satisfy social demands, and are funded by public and private investments. Technological and managerial measures imposed on the systems reduce the failure risks. Under the emerging uncertainties of urban expansion, aging infrastructures, and climate change, today’s WDNs must be more resilient than those in the past. These uncertainties dramatically increase the performance standards and functionality complexity. Such new demands on WDN resilience presents new challenges to both engineering and social sciences.
To identify these new challenges, we revert to the three basic capabilities of WDN resilience, which are closely related to the quantitative resilience methods. The new challenges must be incorporated in the existing quantitative resilience methods and then measured by a matching solution design. The four groups of quantitative resilience methods exhibit distinctive characteristics in their selected models, formulations, and data processes. By understanding these new challenges, researchers and decision makers can choose the most suitable quantitative method for their purpose. However, solving the new challenges may require dual or multiple quantitative approaches, necessitating a combined or hybrid quantitative method. Recognizing these new challenges will help us utilize the characteristics of the various quantitative resilience methods, supplementing their limitations to realize comprehensive responses to new challenges. The new challenges, focus areas, and effects are summarized in Table 2.
5.1. Absorptive Capability
5.1.1. Targeted Failures
Random failures have been tackled in several studies [73,82,83]. However, infrastructure systems are both robust and fragile, as confirmed in complex network theory [20,21]. That is, infrastructure systems can resist random failures but are vulnerable to targeted failures, which may trigger large-scale cascading failures. Chemical/biological, cyber, and physical attacks are the main types of targeted failures [160]. Chemical/biological attacks threaten the water quality with life-threatening agents. Cyber-attacks target the information and data captured on the Supervisory Control and Data Acquisition system. Burns et al. [161] pointed out the high probability of physical attacks on targeted pipes, pumps, tanks, and other components in WDNs. Studies of WDN resilience should address these targeted failures in more depth to identify the critical components in WDNs.
5.1.2. Expert Knowledge
The most commonly used metrics in WDN resilience are the nodal pressure and water age, which represent the hydraulic efficiency and water quality, respectively. The effectiveness of each metric depends on its threshold, which judges whether a failure has occurred. For example, a high nodal pressure increases the maintenance costs and leakage risks [144], while a low nodal pressure leads to customer dissatisfaction. Meanwhile, aged water tends to harbor microbial growth that compromises the health of consumers [162]. Setting a threshold for each of these important measures is obviously important for assessing the system performance of a WDN, but such thresholds differ across countries, states, cities, and buildings [163]. For example, the nodal-pressure threshold is 120 psi in a 20-story building, and 42 psi in a 3-story building [164]. The threshold must also be adjusted for the operation conditions. For example, an old pipe may burst under high water pressure that would be easily withstood by a new pipe. The current nodal pressure is too low to meet the new demands of large factories and skyscrapers. Water quality can also decline in corroded pipes. Therefore, the threshold setting should be aided by site-specific and expert knowledge. Expert knowledge can be derived from two sources: WDN surveys that identify and analyze the consumers’ needs and responsibilities and establish a long-term user feedback mechanism, and analysis of the WDN threshold setting by invited experts. The latter is based on the demands inferred from the survey data, and from inspection and monitoring reports.
5.1.3. Multi-Scenario Coupled Analysis
WDNs are spatial networks with both geographical features and demand requirements. WDNs also change over short- and long-term timeframes. WDN operations adjust the network structure or replace the components to meet different social demands. Given the many current and future configurations across cities, single scenario analyses cannot fully reflect the dynamic nature of resilience. Increasing the resilience of one failure scenario may reduce the resilience of another failure scenario [73].
Multi-scenario coupled analysis is warranted under three conditions. Under the first condition, one or more closely timed extreme events trigger(s) secondary and even tertiary impacts. For example, an earthquake disables a large number of pipes, and the water supply cannot meet the demand. An earthquake can also cause post-earthquake fires, further increasing the burden on water. This situation, called the amplification effect of disasters, dramatically reduces the post-disturbance performance of WDNs.
The second condition requiring multi-scenario analysis is multiple failure types of a WDN. The typical WDN failure modes are structural failure modes (which disconnect part of the WDN) and functional (service performance) failures. Both failure modes must be evaluated in WDN resilience; focusing on either mode yields a non-comprehensive result. For example, graph theory and network analysis metrics can quantitatively estimate the resilience within a fast time, but (as shown in electric grid operations) the structural failure mode is inconsistent with the functional failure mode [165,166]. Therefore, the structural and functional failure modes should be correlated in WDN resilience studies. Functional failures in WDNs must usually be evaluated in hydraulic calculations, which provide the details of the demand changes and insights into the component design. The combined structural and functional failure modes can be investigated by treating WDNs as heterogeneous networks with supply nodes, transmitted nodes, and consumer nodes. Such a treatment would realistically distinguish the dynamic failure process.
The third condition requiring multi-scenario WDN analyses is interdependency between the failure modes. According to Diao et al. [73], increasing the resilience of a failure mode sometimes reduced the resilience of another failure mode. For example, water-conservation tanks can be accessed when pipe failure causes a supply shortage, thus satisfying the demand variation and improving the flexibility and capacity of the WDN. However, large tanks can negatively affect the WDN resilience by harboring contaminants. A contaminated tank will spread pollutants along the pipe and seriously reduce the resilience of contaminant intrusion. The correlations among and sensitivity of different failure modes and their impacts on WDN resilience should be considered.
5.2. Restorative Capability
5.2.1. Emergency Recovery
Emergency recovery focuses on maintaining the basic service and avoiding secondary disasters. The usual timeframe of emergency recovery is several days to several weeks. The short-term (days-to-weeks) resilience of post-disturbance WDN resilience has been relatively little studied. Emergency recovery is defined as the short-time improvement in service performance after a disaster. Although a system can be fully restored to its pre-disturbance level during a short time period, it is usually repaired to provide the necessary baseline services. Planning the emergency recovery capacity in a WDN will boost the WDN performance during a short timeframe and reduces the possibility of secondary disasters. Emergency recovery can be promoted by quickly and accurately identifying the scale and degree of the disaster. Emergency strategies are effective immediately and the emergency resources are actively allocated. For example, valves help to isolate the broken pipes. Large amounts of water are lost if the valves fail to close in time, reducing the service performance of other nodes, and possibly delaying the implementation of the emergency strategy.
Post-disturbance emergency recovery critically depends on the emergency strategy, emergency resources, and repair rate of the WDN. The numbers of resources (repair trucks, replacement pipes, manpower, and work hours) impose constraints on the recovery efforts. The repair rate evaluates the possibilities of speeding up the repair process. Efficient emergency strategies can be formulated, treating the emergency resources and required repair time as the input parameters, and the service performance recovery and disaster blocking effect as the output parameters. The emergency strategies can then be prioritized by their efficiency. The number of emergency resources depends on the availability of local budgets (funds, repair materials, and other consumables) and resources (human resources, and mechanical equipment resources such as repair trucks and replacement pipes) [90]. Accelerating the repair process will lower the impact of the disaster.
Time is important for evaluating the repair rate. The time is commonly represented by a time step, defined as the number of iterations in which the recovery process and the repaired components are recorded in each iteration. However, the time step in a model is only a substitute of the days, hours, minutes, and seconds that constitute real time. The actual time can be captured by combining the resource distribution in post-disturbance WDNs with the attributes of the emergency resources. The recovery rate can then be estimated in real-time.
5.2.2. Post-Disturbance Rebuilding
Following a disaster or significant reduction in performance, post-disturbance rebuilding aims to return the system operation to its normal conditions. For this purpose, it rehabilitates and enhances the performance of the original system over timeframes of months-to-years. Fundamentally, post-disturbance rebuilding restores the WDN performance to its pre-disturbance level. Based on the disturbance experience, further restoration enhances the critical components, redundancy, or multiplicity of sources. The resilience of post-disturbance rebuilding has four facets, as described below.
- ✧
- Optimization of spatialdistribution. The objective function of the multi-objective optimization model maximizes the WDN resilience while minimizing the engineering cost. Constraints on the structural and service function loss of the WDN are imposed under the disaster conditions. The optimal solution is solved by an intelligent optimization algorithm.
- ✧
- Redundancy of design. The WDN flexibility can be enhanced by increasing the redundancy or reducing the connection density of the critical components, and by rewiring branching sections as loop structures or a meshed grid structure.
- ✧
- Backup support system. A backup support system will prevent failure of the identified critical components. Support strategies include backup pumps and extra-power support systems that provide pumps with sufficient pressure. Specially designed valves can isolate substance intrusion.
- ✧
- Post-disturbance reconstruction. Severely damaged and unrepaired parts in WDNs can be reconstructed to maintain the water supply. Disaster data can reveal the optimal reconstruction locations that will reduce the impact of the next possible disaster.
Bruneau et al. [92] suggested four interrelated dimensions in promoting and evaluating post-disaster resilience: technology, organization, society, and economy. Evaluation along these four dimensions will obtain a comprehensive measure of WDN resilience. Analysis of any one dimension cannot clarify the WDN resilience, because the resilience dimensions are not necessarily positively correlated; some dimensions may be negatively related or unrelated to other dimensions. For example, Chang and Shinozuka [167] studied the rapidness property in WDNs. They found that WDNs in Memphis are not technically resistant to seven-degree earthquakes, but have adequate organization resilience. Therefore, the technological, organizational, social, and economic perspectives are all important in WDN resilience analysis. An online monitoring and early warning system with real-time control can identify failures quickly and accurately, and reduce the failure impact on the WDN performance. The local resilience [168] to water stress under post-disaster conditions requires a population, social and economic analysis. Behavior and government policies may adapt to the needed requirements under water stress. For example, under severe drought conditions, the authorities can adjust the water-supply scheme to provide water at certain hours instead of daylong, and instruct citizens to preserve water in bottles or bathtubs. Restricting the water-supply hours causes a sharp increase in demand during the water supply period; the corresponding drop in water pressure is followed by a series of changes.
The behavioral changes spurred by an outage or disaster also influence the WDN resilience. For example, the demand reduces when residents are evacuated or switch to bottled water consumption. Such behavioral uncertainty can cause dramatic changes in local demands, exacerbating the reduced service performance of the WDN. Pre- and post-outage planning and recovery strategies can help shape consumer behavior, and hence refine the incorporation of such uncertainties into WDN performance assessments.
5.3. Adaptive Capability
5.3.1. Effects of Climate Change
Under current climate trends, the frequency of extreme climate events such as droughts, floods, and heavy precipitation storms is expected to increase. Extreme events lie on the tail end of the event- probability distribution. The Intergovernmental Panel on Climate Change defines climate or weather extremes as “the occurrence of a value of a weather or climate variable above (or below) a threshold value near the upper (or lower) ends of the range of observed values of the variable” [8]. Sea level rises, earthquakes, floods, winds, storms and temperature extremes are examples of extreme events correlated with climate change.
Whereas leaking WDNs and other low-loss, high-probability failure events have gained much attention, high-loss low-probability failure events (which cause serious losses) have been relatively neglected by decision makers due to their low occurrence probability. However, as extreme events will become more common under today’s climate changes, they cannot be ignored in WDN resilience analysis. The modeling should consider the maximum loss scenario.
Furthermore, urban scales, urban populations, and urban functions must be dynamically adjusted to climate change. Urban development under climate change will increase the uncertainty in WDN resilience. For example, the coordinated development of Beijing, Tianjin, and Hebei requires an expansion of the single-city level WDN resilience analysis to region level, necessitating a hierarchical analysis of WDN resilience to urban development.
5.3.2. Coupled Society and Technology Analysis
WDNs belong to the class of technical systems. The design, construction and operation of a technical system depends on the investment response to social demands. WDNs can be treated as socio-technical systems containing technologies, policies, markets, consumers, culture, science, and knowledge. Policy and public attitudes can influence WDNs from the social side. Evaluation and enhancement strategies of WDN resilience should be analyzed not only from the technical perspective, but also from political, organizational, economic, social, and environmental perspectives. For example, models may show that WDN failures reduce the service performance, but do not reveal the changes on consumer’s behavior with water use. Such behavioral changes, along with climate changes such as heat waves, will further impact on the failure analysis.
Changes in social and technological elements cannot be fully separated [169]. Future research should focus on the uncertainties in consumer behavior and policy. The results will help policy makers to better understand WDN resilience and select strategies that meet both the technical and social demands.
5.3.3. Data Availability
The long-term data collection and data availability of WDNs is crucial. Virtual WDN models can be built from topological structure data, geographic information, operational status, leakage statistics, and emergency resources. This basic model can be improved into a WDN that satisfies consumer needs (its ultimate goal) by incorporating consumer data. Consumers’ demand and satisfaction data provide additional support for improving the WDN resilience. Data are also useful for calibrating the virtual model and improving its accuracy. For example, using the emergency-time record of investing resources to restore water services, researchers can calibrate the recovery rate in the resilience model. A calibrated model improves the accuracy and effectiveness of newly developed resilience improvement strategies.
Historical event data not only provides the past operation and expansion strategies, but also reveals the environmental, political, and economic changes in the WDN. Although similar to static systems in the short-term, WDNs dynamically adjust to changes in social demand. Therefore, evaluation of the current state alone is insufficient. Historical analysis establishes a firm foundation of WDN resilience.
5.3.4. Interdependency Infrastructures
In infrastructure systems, WDNs sit alongside power systems, communication systems and transportation systems. When failure in one system triggers failure in another system, the infrastructure systems are said to be interdependent.
Resilience evaluation in WDNs should consider the interdependency effect. For example, a heavy WDN leakage can cause a road closure. An interrupt in the power system can stop the WDN pumps. Several studies have evaluated and analyzed the interdependency in infrastructure systems. WDNs and other infrastructure systems are usually abstracted as node–link networks. More realistic operating details are required to add to these abstractions. Moreover, arresting cascading failures among the infrastructure systems is important for preventing large-scale failures
6. Conclusions
WDNs are one of the critical infrastructure systems. Failures in WDNs not only decrease system performance and deprive urban residents of a critical delivered resource, but they can also spread to other infrastructure systems. The desire to reduce the impact of failures and improving the response to failures has lent to increasing attention on methods to assess system resilience.
The aim of this paper was to provide a contemporary review of approaches to quantify resilience in WDNs. The systematic review guidelines were introduced to filter the references. CiteSpace was used to show the cluster tags with the information of titles, abstracts, author keywords, and keywords plus.
We classified the quantitative resilience methods into four groups according to CiteSpace cluster tags and reviews on modelling in infrastructure resilience and WDNs. By full-text reading, we first described the three basic capabilities in WDN resilience, i.e., absorptive capability, restorative capability, and adaptive capability. We then provided the metrics and the research progresses in surrogate measures, simulation methods, network theory approaches, and fault detection and isolation (FDI) approaches. The limitations of each types of methods were also summarized.
Today, uncertainties in WDN performance have evolved with the increasing complexity of the systems and the increasing performance standards, posing new challenges for quantitative WDN resilience studies. Facing these challenges is demanded in future works. The new challenges, focus areas, and effects were discussed in terms of the absorptive, restorative, and adaptive capabilities. Evaluating WDN resilience has attracted much interest in the past few decades, evolving into quick response to disturbance, long-term optimization, and multi-scenario and multi-stage coupled analyses in recent years.
Author Contributions
Conceptualization, Q.S. and E.P; methodology, Q.S. and H.J.L.; formal analysis, Q.S. and H.J.L.; writing—original draft preparation, Q.S.; writing—review and editing, E.P.
Funding
This research was funded by Beijing Social Sciences Foundation (grant number 18GLC070), National Natural Science Foundation of China (grant number 71501008), the Fundamental Research Funds for the Central Universities (grant number 2019JBW007), and China Scholarship Council (grant number 201707095080).
Acknowledgments
My thanks to the staff of the California Center for Sustainable Communities at the Institute of the Environment and Sustainability, UCLA for their support and assistance.
Conflicts of Interest
The authors declare no conflict of interest. The funders had no role in the design of the study; in the collection, analyses, or interpretation of data; in the writing of the manuscript, or in the decision to publish the results.
References
- Clinton, W.J. Executive Order 13010 on critical infrastructure protection. Fed. Regist. 1996, 61, 37347–37350. [Google Scholar]
- Ariman, T.; Muleski, G.E. A Review of the Response of Buried Pipelines under Seismic Excitations. Earthq. Eng. Struct. Dyn. 1981, 9, 133–152. [Google Scholar] [CrossRef]
- Xu, D.W. Earthquake Damage to Water Distribution Networks in Tangshan; Earthquake Press: Beijing, China, 1986. [Google Scholar]
- EERI. Northridge Earthquake of Januray 17, 1994: Reconnaissance Report; Earthquake Engineering Research Institute: Oakland, CA, USA, 1995; p. 11. [Google Scholar]
- Shirozu, T.; Yune, K.; Isoyama, R.; Iwamoto, T. Report on Damage to Water Distribution Pipes Caused by the 1995 Hyogoken-nanbu (Kobe) Earthquake. In Proceedings of the fourth Japan-U.S. workshop on earthquake resistant design of lifeline facilities and countermeasures for soil liquefaction, Buffalo, NY, USA, 11–13 June 1996; pp. 93–110. [Google Scholar]
- Li, H.; Xiao, S.; Huo, L. Damage investigation and analysis of engineering structures in the Wenchuan earthquake. J. Build. Struct. 2008, 4, 10–19. [Google Scholar]
- Woodruff, S.C.; Stults, M. Numerous strategies but limited implementation guidance in US local adaptation plans. Nat. Clim. Chang. 2016, 6, 796. [Google Scholar] [CrossRef]
- Murray, V.; Ebi, K.L. IPCC Special Report on Managing the Risks of Extreme Events and Disasters to Advance Climate Change Adaptation (SREX). J. Epidemiol. Commun. Health 2012, 66, 759–760. [Google Scholar] [CrossRef] [PubMed]
- Schellnhuber, H.J.; Hare, W.; Serdeczny, O.; Adams, S.; Coumou, D.; Frieler, K.; Martin, M.; Otto, I.M.; Perrette, M.; Robinson, A. Turn Down the Heat: Why a 4 C Warmer World Must Be Avoided; World Bank: Washington, DC, USA, 2012. [Google Scholar]
- Little, R.G. Controlling cascading failure: Understanding the vulnerabilities of interconnected infrastructures. J. Urban Technol. 2002, 9, 109–123. [Google Scholar] [CrossRef]
- Shin, S.; Lee, S.; Judi, D.R.; Parvania, M.; Goharian, E.; McPherson, T.; Burian, S.J. A Systematic Review of Quantitative Resilience Measures for Water Infrastructure Systems. Water 2018, 10, 164. [Google Scholar] [CrossRef]
- Jensen, H.A.; Jerez, D.J. A Stochastic Framework for Reliability and Sensitivity Analysis of Large Scale Water Distribution Networks. Reliab. Eng. Syst. Saf. 2018, 176, 80–92. [Google Scholar] [CrossRef]
- Rahmani, F.; Muhammed, K.; Behzadian, K.; Farmani, R. Optimal Operation of Water Distribution Systems Using a Graph Theory—Based Configuration of District Metered Areas. J. Water Res. Plan. Manag. 2018, 144, 4018042. [Google Scholar] [CrossRef]
- Dueñas-Osorio, L.; Vemuru, S.M. Cascading failures in complex infrastructure systems. Struct. Saf. 2009, 31, 157–167. [Google Scholar] [CrossRef]
- Tolson, B.A.; Maier, H.R.; Simpson, A.R.; Lence, B.J. Genetic Algorithms for Reliability-Based Optimization of Water Distribution Systems. J. Water Res. Plan. Manag. 2004, 130, 63–72. [Google Scholar] [CrossRef] [Green Version]
- Shafiqul, I.M.; Sadiq, R.; Rodriguez, M.J.; Najjaran, H.; Hoorfar, M. Reliability Assessment for Water Supply Systems under Uncertainties. J. Water Res. Plan. Manag. 2014, 140, 468–479. [Google Scholar] [CrossRef]
- Shinstine, D.S.; Ahmed, I.; Lansey, K.E. Reliability/Availability Analysis of Municipal Water Distribution Networks: Case Studies. J. Water Res. Plan. Manag. 2002, 128, 140–151. [Google Scholar] [CrossRef]
- Hashimoto, T.; Stedinger, J.R.; Loucks, D.P. Reliability, resiliency, and vulnerability criteria for water resource system performance evaluation. Water Resour. Res. 1982, 18, 14–20. [Google Scholar] [CrossRef] [Green Version]
- Holling, C.S. Myths of ecological stability: Resilience and the problem of failure. Stud. Crisis Manag. 1979, 97–109. [Google Scholar]
- Albert, R.; Jeong, H.; Barabási, A. Error and attack tolerance of complex networks. Nature 2000, 406, 378. [Google Scholar] [CrossRef] [PubMed]
- Lai, Y.; Motter, A.E. Cascade-based attacks on complex networks. Phys. Rev. E 2002, 66, 065102. [Google Scholar] [Green Version]
- Pagani, G.A.; Aiello, M. The Power Grid as a complex network: A survey. Phys. A Stat. Mech. Its Appl. 2013, 392, 2688–2700. [Google Scholar] [CrossRef] [Green Version]
- Soh, H.; Lim, S.; Zhang, T.; Fu, X.; Lee, G.K.K.; Hung, T.G.G.; Di, P.; Prakasam, S.; Wong, L. Weighted complex network analysis of travel routes on the Singapore public transportation system. Phys. A Stat. Mech. Its Appl. 2010, 389, 5852–5863. [Google Scholar] [CrossRef]
- Shuang, Q.; Zhang, M.; Yuan, Y. Node vulnerability of water distribution networks under cascading failures. Reliab. Eng. Syst. Saf. 2014, 124, 132–141. [Google Scholar] [CrossRef]
- Shuang, Q.; Zhang, M.; Yuan, Y. Performance and Reliability Analysis of Water Distribution Systems under Cascading Failures and the Identification of Crucial Pipes. PLoS ONE. 2014, 9, e88445. [Google Scholar] [CrossRef] [PubMed]
- Shuang, Q.; Liu, Y.; Tang, Y.; Liu, J.; Shuang, K. System Reliability Evaluation in Water Distribution Networks with the Impact of Valves Experiencing Cascading Failures. Water 2017, 9, 413. [Google Scholar] [CrossRef]
- Holling, C.S. Resilience and Stability of Ecological Systems. Annu. Rev. Ecol. Syst. 1973, 4, 1–23. [Google Scholar] [CrossRef] [Green Version]
- Gunderson, L.H. Panarchy: Understanding Transformations in Human and Natural Systems; Island Press: Washington, DC, USA, 2001. [Google Scholar]
- Holling, C.S. Engineering resilience versus ecological resilience. Eng. Ecol. Constr. 1996, 31, 32. [Google Scholar]
- Ouyang, M. Review on modeling and simulation of interdependent critical infrastructure systems. Reliab. Eng. Syst. Saf. 2014, 121, 43–60. [Google Scholar] [CrossRef]
- National Research Council. Disaster Resilience: A National Imperative; The National Academies Press: Washington, DC, USA, 2012. [Google Scholar]
- Carpenter, S.; Walker, B.; Anderies, J.M.; Abel, N. From Metaphor to Measurement: Resilience of What to What? Ecosystems 2001, 4, 765–781. [Google Scholar] [CrossRef]
- Biggs, R.; Schlüter, M.; Schoon, M.L. Principles for Building Resilience: Sustaining Ecosystem Services in Social-Ecological Systems; Cambridge University Press: Cambridge, UK, 2015. [Google Scholar] [CrossRef]
- Xu, L.; Kajikawa, Y. An integrated framework for resilience research: A systematic review based on citation network analysis. Sustain. Sci. 2018, 13, 235–254. [Google Scholar] [CrossRef]
- Baggio, J.A.; Brown, K.; Hellebrandt, D. Boundary object or bridging concept? A citation network analysis of resilience. Ecol. Soc. 2015, 20, 2. [Google Scholar] [CrossRef]
- Xu, L.; Marinova, D. Resilience thinking: A bibliometric analysis of socio-ecological research. Scientometrics 2013, 96, 911–927. [Google Scholar] [CrossRef]
- Li, R.; McDonald, A.J.; Sathasivan, A.; Khan, S. Disinfectant Residual Stability Leading to Disinfectant Decay and By-product Formation in Drinking Water Distribution Systems: A Systematic Review. Water Res. 2019, 153, 335–348. [Google Scholar] [CrossRef]
- Bello, O.; Abu-Mahfouz, A.; Hamam, Y.; Page, P.; Adedeji, K.; Piller, O. Solving Management Problems in Water Distribution Networks: A Survey of Approaches and Mathematical Models. Water 2019, 11, 562. [Google Scholar] [CrossRef]
- Gupta, A. A Selective Literature Review on Leak Management Techniques for Water Distribution System. Water Resour. Manag. 2018, 32, 3247–3269. [Google Scholar] [CrossRef]
- Mala-Jetmarova, H.; Sultanova, N.; Savic, D. Lost in Optimisation of Water Distribution Systems? A Literature Review of System Operation. Environ. Model. Softw. 2017, 93, 209–254. [Google Scholar] [CrossRef]
- Gheisi, A.; Forsyth, M.; Naser, B. Water Distribution Systems Reliability: A Review of Research Literature. J. Water Res. Plan. Manag. 2016, 142, 4016047. [Google Scholar] [CrossRef]
- Xu, Q.; Liu, R.; Chen, Q.; Li, R. Review on water leakage control in distribution networks and the associated environmental benefits. J. Environ. Sci. 2014, 26, 955–961. [Google Scholar] [CrossRef]
- Pullin, A.S.; Stewart, G.B. Guidelines for Systematic Review in Conservation and Environmental Management. Conserv. Biol. 2006, 20, 1647–1656. [Google Scholar] [CrossRef] [PubMed]
- Bowler, D.E.; Buyung-Ali, L.M.; Knight, T.M.; Pullin, A.S. A systematic review of evidence for the added benefits to health of exposure to natural environments. BMC Public Health 2010, 10, 456. [Google Scholar] [CrossRef] [PubMed]
- Gago, E.J.; Roldan, J.; Pacheco-Torres, R.; Ordóñez, J. The city and urban heat islands: A review of strategies to mitigate adverse effects. Renew. Sustain. Energy Rev. 2013, 25, 749–758. [Google Scholar] [CrossRef]
- Plummer, R.; Crona, B.; Armitage, D.; Olsson, P.; Teng, M.; Yudina, O. Adaptive Comanagement: A Systematic Review and Analysis. Ecol. Soc. 2012, 17, 11. [Google Scholar] [CrossRef]
- Plummer, R.; de Loë, R.; Armitage, D. A Systematic Review of Water Vulnerability Assessment Tools. Water Resour. Manag. 2012, 26, 4327–4346. [Google Scholar] [CrossRef] [Green Version]
- Padrón, R.S.; Gudmundsson, L.; Greve, P.; Seneviratne, S.I. Large-Scale Controls of the Surface Water Balance Over Land: Insights from a Systematic Review and Meta-Analysis. Water Resour. Res. 2017, 53, 9659–9678. [Google Scholar] [CrossRef]
- Quinteiro, P.; Ridoutt, B.G.; Arroja, L.; Dias, A.C. Identification of methodological challenges remaining in the assessment of a water scarcity footprint: A review. Int. J. Life Cycle Assess. 2018, 23, 164–180. [Google Scholar] [CrossRef]
- Hosseini, S.; Barker, K.; Ramirez-Marquez, J.E. A review of definitions and measures of system resilience. Reliab. Eng. Syst. Saf. 2016, 145, 47–61. [Google Scholar] [CrossRef]
- Chen, C. The CiteSpace Manual. 2014. Available online: http://cluster.ischool.drexel.edu/*cchen/citespace (accessed on 1 June 2019).
- Chen, C.; Paul, R.J. Visualizing a Knowledge Domain’s Intellectual Structure. Computer 2001, 34, 65–71. [Google Scholar] [CrossRef]
- Chen, C. Visualising Semantic Spaces and Author Co-Citation Networks in Digital Libraries. Inf. Process. Manag. 1999, 35, 401–420. [Google Scholar] [CrossRef]
- Schvaneveldt, R. Pathfinder Associative Networks: Studies in Knowledge Organization; Ablex Publishing Corporations: Norwood, NJ, USA, 1990. [Google Scholar]
- Chen, C.; Morris, S. Visualizing evolving networks: Minimum spanning trees versus Pathfinder networks. In Proceedings of the IEEE Symposium on Information Visualization, Seattle, WA, USA, 19–21 October 2003. [Google Scholar]
- Chen, C. Searching for intellectual turning points: Progressive knowledge domain visualization. Proc. Natl. Acad. Sci. USA 2004, 101 (Suppl. 1), 5303–5310. [Google Scholar] [CrossRef] [Green Version]
- Deerwester, S.; Dumais, S.T.; Landauer, T.K.; Furnas, G.W.; Harshman, R.A. Indexing by latent semantic analysis. J. Am. Soc. Inf. Sci. 1990, 41, 391–407. [Google Scholar] [CrossRef]
- Chen, C.; Ibekwe-Sanjuan, F.; Hou, J. The Structure and Dynamics of Co-Citation Clusters: A Multiple-Perspective Co-Citation Analysis. J. Am. Soc. Inf. Sci. Technol. 2010, 61, 1386–1409. [Google Scholar] [CrossRef]
- Luxburg, U.V. A Tutorial on Spectral Clustering. Stat. Comput. 2007, 17, 395–416. [Google Scholar] [CrossRef]
- Ng, A.Y.; Jordan, M.; Weiss, Y. On Spectral Clustering: Analysis and an algorithm. Adv. Neural Inf. Process. Syst. 2002, 14, 849–856. [Google Scholar]
- Shi, J.; Malik, J. Normalized Cuts and Image Segmentation. IEEE Trans. Pattern Anal. 2002, 22, 888–905. [Google Scholar]
- Salton, G.; Wong, A.; Yang, C.S. A vector-space model for information retrieval. Commun. ACM 1975, 18, 613–620. [Google Scholar] [CrossRef]
- Dunning, T. Accurate Methods for the Statistics of Surprise and Coincidence. Comput. Linguist. 1993, 19, 61–74. [Google Scholar]
- Witten, I.H.; Frank, E. Data Mining: Practical Machine Learning Tools and Techniques with Java Implementations; Morgan Kaufmann: San Francisco, CA, USA, 1999. [Google Scholar]
- Liang, H.; Zhang, S.; Su, Y. The structure and emerging trends of construction safety management research: A bibliometric review. Int. J. Occup. Saf. Ergon. 2018. [Google Scholar] [CrossRef] [PubMed]
- Raad, D.N.; Sinske, A.N.; van Vuuren, J.H. Comparison of four reliability surrogate measures for water distribution systems design. Water Resour. Res. 2010, 46, W05524. [Google Scholar] [CrossRef]
- Tanyimboh, T.T. Informational Entropy: A Failure Tolerance and Reliability Surrogate for Water Distribution Networks. Water Resour. Manag. 2017, 31, 3189–3204. [Google Scholar] [CrossRef]
- Gheisi, A.; Naser, G. Multistate Reliability of Water-Distribution Systems: Comparison of Surrogate Measures. J. Water Res. Plan. Manag. 2015, 141, 4015018. [Google Scholar] [CrossRef]
- Santonastaso, G.; Di Nardo, A.; di Natale, M.; Giudicianni, C.; Greco, R. Scaling-Laws of Flow Entropy with Topological Metrics of Water Distribution Networks. Entropy 2018, 20, 95. [Google Scholar] [CrossRef]
- Cimorelli, L.; Morlando, F.; Cozzolino, L.; D’Aniello, A.; Pianese, D. Comparison among Resilience and Entropy Index in the Optimal Rehabilitation of Water Distribution Networks under Limited-Budgets. Water Resour. Manag. 2018, 32, 3997–4011. [Google Scholar] [CrossRef]
- Baños, R.; Reca, J.; Martinez, J.; Gil, C.; Marquez, A.L. Resilience Indexes for Water Distribution Network Design: A Performance Analysis Under Demand Uncertainty. Water Resour. Manag. 2011, 25, 2351–2366. [Google Scholar] [CrossRef]
- Todini, E. Looped water distribution networks design using a resilience index based heuristic approach. Urban Water. 2000, 2, 115–122. [Google Scholar] [CrossRef]
- Diao, K.; Sweetapple, C.; Farmani, R.; Fu, G.; Ward, S.; Butler, D. Global resilience analysis of water distribution systems. Water Res. 2016, 106, 383–393. [Google Scholar] [CrossRef] [PubMed] [Green Version]
- Klise, K.A.; Bynum, M.; Moriarty, D.; Murray, R. A software framework for assessing the resilience of drinking water systems to disasters with an example earthquake case study. Environ. Model. Softw. 2017, 95, 420–431. [Google Scholar] [CrossRef] [PubMed]
- Herrera, M.; Abraham, E.; Stoianov, I. A Graph-Theoretic Framework for Assessing the Resilience of Sectorised Water Distribution Networks. Water Resour. Manag. 2016, 30, 1685–1699. [Google Scholar] [CrossRef] [Green Version]
- Kajikawa, Y.; Ohno, J.; Takeda, Y.; Matsushima, K.; Komiyama, H. Creating an academic landscape of sustainability science: An analysis of the citation network. Sustain. Sci. 2007, 2, 221. [Google Scholar] [CrossRef]
- Walker, B.; Holling, C.S.; Carpenter, S.R.; Kinzig, A. Resilience, Adaptability and Transformability in Social-ecological Systems. Ecol. Soc. 2004, 9, 5. [Google Scholar] [CrossRef]
- Cimellaro, G.P.; Reinhorn, A.M.; Bruneau, M. Framework for analytical quantification of disaster resilience. Eng. Struct. 2010, 32, 3639–3649. [Google Scholar] [CrossRef]
- Cimellaro, G.P.; Tinebra, A.; Renschler, C.; Fragiadakis, M. New Resilience Index for Urban Water Distribution Networks. J. Struct. Eng. 2016, 142, C40150148SI. [Google Scholar] [CrossRef]
- Zoppou, C. Review of urban storm water models. Environ. Model. Softw. 2001, 16, 195–231. [Google Scholar] [CrossRef]
- Quinlan, A.E.; Berbés-Blázquez, M.; Haider, L.J.; Peterson, G.D. Measuring and assessing resilience: Broadening understanding through multiple disciplinary perspectives. J. Appl. Ecol. 2016, 53, 677–687. [Google Scholar] [CrossRef]
- Nazif, S.; Karamouz, M. Algorithm for Assessment of Water Distribution System’s Readiness: Planning for Disasters. J. Water Resour. Plan. Manag. 2009, 135, 244–252. [Google Scholar] [CrossRef]
- Zhuang, B.; Lansey, K.; Kang, D. Resilience/Availability Analysis of Municipal Water Distribution System Incorporating Adaptive Pump Operation. J. Hydraul. Eng. 2013, 139, 527–537. [Google Scholar] [CrossRef]
- Eliades, D.G.; Polycarpou, M.M. Leakage fault detection in district metered areas of water distribution systems. J. Hydroinform. 2012, 14, 992–1005. [Google Scholar] [CrossRef] [Green Version]
- Eliades, D.G.; Polycarpou, M.M. A Fault Diagnosis and Security Framework for Water Systems. IEEE Trans. Control Syst. Technol. 2010, 18, 1254–1265. [Google Scholar] [CrossRef]
- Cugueró-Escofet, M.À.; Quevedo, J.; Alippi, C.; Roveri, M.; Puig, V.; García, D.; Trovò, F. Model- vs. data-based approaches applied to fault diagnosis in potable water supply networks. J. Hydroinform. 2016, 18, 831–850. [Google Scholar] [CrossRef] [Green Version]
- Tanyimboh, T.T.; Czajkowska, A.M. Joint Entropy Based Multi-Objective Evolutionary Optimization of Water Distribution Networks. Water Resour. Manag. 2018, 32, 2569–2584. [Google Scholar] [CrossRef] [Green Version]
- Tanyimboh, T.T.; Czajkowska, A. Self-Adaptive Solution-Space Reduction Algorithm for Multi-Objective Evolutionary Design Optimization of Water Distribution Networks. Water Resour. Manag. 2018, 32, 10. [Google Scholar] [CrossRef]
- Meirelles, G.; Brentan, B.; Izquierdo, J.; Ramos, H.; Luvizotto, E., Jr. Trunk Network Rehabilitation for Resilience Improvement and Energy Recovery in Water Distribution Networks. Water 2018, 10, 6936. [Google Scholar] [CrossRef]
- Zhao, X.; Cai, H.; Chen, Z.; Gong, H.; Feng, Q. Assessing urban lifeline systems immediately after seismic disaster based on emergency resilience. Struct. Infrastruct. Eng. 2016, 12, 1634–1649. [Google Scholar] [CrossRef]
- Chang, S.E.; McDaniels, T.; Fox, J.; Dhariwal, R.; Longstaff, H. Toward Disaster-Resilient Cities: Characterizing Resilience of Infrastructure Systems with Expert Judgments. Risk Anal. 2014, 34, 416–434. [Google Scholar] [CrossRef]
- Bruneau, M.; Chang, S.E.; Eguchi, R.T.; Lee, G.C.; O’Rourke, T.D.; Reinhorn, A.M.; Shinozuka, M.; Tierney, K.; Wallace, W.A.; von Winterfeldt, D. A Framework to Quantitatively Assess and Enhance the Seismic Resilience of Communities. Earthq. Spectra 2003, 19, 733–752. [Google Scholar] [CrossRef] [Green Version]
- Giustolisi, O.; Savic, D. Identification of segments and optimal isolation valve system design in water distribution networks. Urban Water J. 2010, 7, 1–15. [Google Scholar] [CrossRef]
- Jun, H.; Loganathan, G.V. Valve-Controlled Segments in Water Distribution Systems. J. Water Res. Plan. Manag. 2007, 133, 145–155. [Google Scholar] [CrossRef]
- Mugume, S.N.; Diao, K.; Astaraie-Imani, M.; Fu, G.; Farmani, R.; Butler, D. Enhancing resilience in urban water systems for future cities. Water Sci. Technol. Water Supply 2015, 15, 1343–1352. [Google Scholar] [CrossRef] [Green Version]
- Zhao, X.; Chen, Z.; Gong, H. Effects Comparison of Different Resilience Enhancing Strategies for Municipal Water Distribution Network: A Multidimensional Approach. Math. Probl. Eng. 2015, 2015, 438063. [Google Scholar] [CrossRef]
- Laucelli, D.; Giustolisi, O. Vulnerability Assessment of Water Distribution Networks under Seismic Actions. J. Water Res. Plan. Manag. 2015, 141, 040140826. [Google Scholar] [CrossRef]
- Bi, W.; Dandy, G.C.; Maier, H.R. Use of Domain Knowledge to Increase the Convergence Rate of Evolutionary Algorithms for Optimizing the Cost and Resilience of Water Distribution Systems. J. Water Res. Plan. Manag. 2016, 142. UNSP 040160279. [Google Scholar] [CrossRef]
- Duenas-Osorio, L.; Craig, J.I.; Goodno, B.J. Seismic response of critical interdependent networks. Earthq. Eng. Struct. Dyn. 2007, 36, 285–306. [Google Scholar] [CrossRef]
- Farahmandfar, Z.; Piratla, K.R.; Andrus, R.D. Resilience Evaluation of Water Supply Networks against Seismic Hazards. J. Pipeline Syst. Eng. 2017, 8, 1. [Google Scholar] [CrossRef]
- Mao, Q.; Li, N. Assessment of the impact of interdependencies on the resilience of networked critical infrastructure systems. Nat. Hazards 2018, 93, 315–337. [Google Scholar] [CrossRef]
- Zimmerman, R.; Zhu, Q.; de Leon, F.; Guo, Z. Conceptual Modeling Framework to Integrate Resilient and Interdependent Infrastructure in Extreme Weather. J. Infrastruct. Syst. 2017, 23, 040170344. [Google Scholar] [CrossRef]
- Ouyang, M.; Dueñas-Osorio, L. Time-dependent resilience assessment and improvement of urban infrastructure systems. Chaos 2012, 22, 33122. [Google Scholar] [CrossRef] [PubMed] [Green Version]
- Meng, F.; Fu, G.; Farmani, R.; Sweetapple, C.; Butler, D. Topological attributes of network resilience: A study in water distribution systems. Water Res. 2018, 143, 376–386. [Google Scholar] [CrossRef] [PubMed]
- Buzna, L.; Peters, K.; Ammoser, H.; Kühnert, C.; Helbing, D. Efficient Response to Cascading Disaster Spreading. Phys. Rev. E 2007, 75, 56107. [Google Scholar] [CrossRef] [PubMed]
- Prasad, T.D.; Park, N.S. Multiobjective genetic algorithms for design of water distribution networks. J. Water Resour. Plan. Manag. 2004, 130, 73–82. [Google Scholar] [CrossRef]
- Jayaram, N.; Srinivasan, K. Performance-based optimal design and rehabilitation of water distribution networks using life cycle costing. Water Resour. Res. 2008, 44, W014171. [Google Scholar] [CrossRef]
- Tanyimboh, T.T.; Templeman, A.B. Optimum Design of Flexible Water Distribution Networks. Civ. Eng. Syst. 1993, 10, 243–258. [Google Scholar] [CrossRef]
- Wu, W.; Maier, H.R.; Simpson, A.R. Surplus Power Factor as a Resilience Measure for Assessing Hydraulic Reliability in Water Transmission System Optimization. J. Water Resour. Plan. Manag. 2011, 137, 542–546. [Google Scholar] [CrossRef] [Green Version]
- Liu, H.; Savic, D.; Kapelan, Z.; Zhao, M.; Yuan, Y.; Zhao, H. A diameter-sensitive flow entropy method for reliability consideration in water distribution system design. Water Resour. Res. 2014, 50, 5597–5610. [Google Scholar] [CrossRef] [Green Version]
- Saleh, S.; Tanyimboh, T.T. Multi-Directional Maximum-Entropy Approach to the Evolutionary Design Optimization of Water Distribution Systems. Water Resour. Manag. 2016, 30, 1885–1901. [Google Scholar] [CrossRef] [Green Version]
- Tanyimboh, T.T.; Templeman, A.B. Calculating Maximum Entropy Flows in Networks. J. Oper. Res. Soc. 1993, 44, 383–396. [Google Scholar] [CrossRef]
- Awumah, K.; Goulter, I.; Bhatt, S.K. Entropy-Based Redundancy Measures in Water-Distribution Networks. J. Hydraul. Eng. 1991, 117, 595–614. [Google Scholar] [CrossRef]
- Creaco, E.; Franchini, M.; Todini, E. Generalized Resilience and Failure Indices for Use with Pressure-Driven Modeling and Leakage. J. Water Res. Plan. Manag. 2016, 142, 040160198. [Google Scholar] [CrossRef]
- Jeong, G.; Wicaksono, A.; Kang, D. Revisiting the Resilience Index for Water Distribution Networks. J. Water Res. Plan. Manag. 2017, 143. UNSP 040170358. [Google Scholar] [CrossRef]
- Zheng, F.; Simpson, A.R.; Zecchin, A.C. An efficient hybrid approach for multiobjective optimization of water distribution systems. Water Resour. Res. 2014, 50, 3650–3671. [Google Scholar] [CrossRef] [Green Version]
- Wang, Q.; Creaco, E.; Franchini, M.; Savic, D.; Kapelan, Z. Comparing Low and High-Level Hybrid Algorithms on the Two-Objective Optimal Design of Water Distribution Systems. Water Resour. Manag. 2015, 29, 1–16. [Google Scholar] [CrossRef]
- Suribabu, C.R. Resilience-based optimal design of water distribution network. Appl. Water Sci. 2017, 7, 4055–4066. [Google Scholar] [CrossRef]
- Alvisi, S.; Franchini, M. A heuristic procedure for the automatic creation of district metered areas in water distribution systems. Urban Water J. 2014, 11, 137–159. [Google Scholar] [CrossRef]
- Di Nardo, A.; Di Natale, M. A heuristic design support methodology based on graph theory for district metering of water supply networks. Eng. Optim. 2011, 43, 193–211. [Google Scholar] [CrossRef]
- Campbell, E.; Izquierdo, J.; Montalvo, I.; Perez-Garcia, R. A Novel Water Supply Network Sectorization Methodology Based on a Complete Economic Analysis, Including Uncertainties. Water 2016, 8, 1795. [Google Scholar] [CrossRef]
- Greco, R.; Di Nardo, A.; Santonastaso, G. Resilience and entropy as indices of robustness of water distribution networks. J. Hydroinform. 2012, 14, 761–771. [Google Scholar] [CrossRef] [Green Version]
- Tanyimboh, T.T.; Siew, C.; Saleh, S.; Czajkowska, A. Comparison of Surrogate Measures for the Reliability and Redundancy of Water Distribution Systems. Water Resour. Manag. 2016, 30, 3535–3552. [Google Scholar] [CrossRef] [Green Version]
- Tsai, F.T.C.; Katiyar, V.; Toy, D.; Goff, R.A. Conjunctive Management of Large-Scale Pressurized Water Distribution and Groundwater Systems in Semi-Arid Area with Parallel Genetic Algorithm. Water Resour. Manag. 2009, 23, 1497–1517. [Google Scholar] [CrossRef]
- Aydin, N.Y.; Mays, L.; Schmitt, T. Sustainability Assessment of Urban Water Distribution Systems. Water Resour. Manag. 2014, 28, 4373–4384. [Google Scholar] [CrossRef]
- Aydin, N.Y.; Mays, L.; Schmitt, T. Technical and Environmental Sustainability Assessment of Water Distribution Systems. Water Resour. Manag. 2014, 28, 4699–4713. [Google Scholar] [CrossRef]
- Jung, D.; Kang, D.; Kim, J.H.; Lansey, K. Robustness-Based Design of Water Distribution Systems. J. Water Res. Plan. Manag. 2014, 140, 0401403311. [Google Scholar] [CrossRef]
- Soltanjalili, M.; Bozorg-Haddad, O.; Marino, M.A. Operating Water Distribution Networks during Water Shortage Conditions Using Hedging and Intermittent Water Supply Concepts. J. Water Res. Plan. Manag. 2013, 139, 644–659. [Google Scholar] [CrossRef]
- Cimellaro, G.P.; Renschler, C.; Reinhorn, A.M.; Arendt, L. PEOPLES: A Framework for Evaluating Resilience. J. Struct. Eng. 2016, 142, 0401606310. [Google Scholar] [CrossRef]
- Bristow, E.C.; Brumbelow, K. Simulation to Aid Disaster Planning and Mitigation: Tools and Techniques for Water Distribution Managers and Emergency Planners. J. Water Res. Plan. Manag. 2013, 139, 376–386. [Google Scholar] [CrossRef]
- Jeong, H.S.; Qiao, J.H.; Abraham, D.M.; Lawley, M.; Richard, J.P.; Yih, Y. Minimizing the consequences of intentional attack on water infrastructure. Comput.-Aided Civ. Infrastruct. 2006, 21, 79–92. [Google Scholar] [CrossRef]
- Hayuti, M.H.; Burrows, R.; Naga, D. Modelling water distribution systems with deficient pressure. Proc. Inst. Civ. Eng.-Water Manag. 2007, 160, 215–224. [Google Scholar] [CrossRef]
- Bozorg-Haddad, O.; Hoseini-Ghafari, S.; Solgi, M.; Loaiciga, H.A. Intermittent Urban Water Supply with Protection of Consumers’ Welfare. J. Pipeline Syst. Eng. 2016, 7, 040160023. [Google Scholar] [CrossRef]
- Laucelli, D.; Berardi, L.; Giustolisi, O. Assessing climate change and asset deterioration impacts on water distribution networks: Demand-driven or pressure-driven network modeling? Environ. Model. Softw. 2012, 37, 206–216. [Google Scholar] [CrossRef]
- Giustolisi, O.; Walski, T.M. Demand Components in Water Distribution Network Analysis. J. Water Res. Plan. Manag. 2012, 138, 356–367. [Google Scholar] [CrossRef]
- Jun, L.; Guoping, Y. Iterative Methodology of Pressure-Dependent Demand Based on EPANET for Pressure-Deficient Water Distribution Analysis. J. Water Res. Plan. Manag. 2013, 139, 34–44. [Google Scholar] [CrossRef]
- Di Nardo, A.; Di Natale, M.; Santonastaso, G.F.; Tzatchkov, V.G.; Alcocer-Yamanaka, V.H. Water Network Sectorization Based on Graph Theory and Energy Performance Indices. J. Water Res. Plan. Manag. 2014, 140, 620–629. [Google Scholar] [CrossRef]
- Wright, R.; Stoianov, I.; Parpas, P.; Henderson, K.; King, J. Adaptive water distribution networks with dynamically reconfigurable topology. J. Hydroinform. 2014, 16, 1280–1301. [Google Scholar] [CrossRef]
- Yazdani, A.; Jeffrey, P. Water distribution system vulnerability analysis using weighted and directed network models. Water Resour. Res. 2012, 48, W06517. [Google Scholar] [CrossRef]
- Di Nardo, A.; Di Natale, M.; Giudicianni, C.; Greco, R.; Santonastaso, G.F. Complex network and fractal theory for the assessment of water distribution network resilience to pipe failures. Water Sci. Technol.-Water Supply 2018, 18, 767–777. [Google Scholar] [CrossRef]
- Di Nardo, A.; Giudicianni, C.; Greco, R.; Herrera, M.; Santonastaso, G.F. Applications of Graph Spectral Techniques to Water Distribution Network Management. Water 2018, 10, 451. [Google Scholar] [CrossRef]
- Yazdani, A.; Otoo, R.A.; Jeffrey, P. Resilience enhancing expansion strategies for water distribution systems: A network theory approach. Environ. Model. Softw. 2011, 26, 1574–1582. [Google Scholar] [CrossRef]
- Agathokleous, A.; Christodoulou, C.; Christodoulou, S.E. Topological Robustness and Vulnerability Assessment of Water Distribution Networks. Water Resour. Manag. 2017, 31, 4007–4021. [Google Scholar] [CrossRef]
- Sheng, N.; Jia, Y.; Xu, Z.; Ho, S.L.; Kan, C.W. A complex network based model for detecting isolated communities in water distribution networks. Chaos 2013, 23, 3323–3335. [Google Scholar] [CrossRef]
- Di Nardo, A.; Di Natale, M.; Giudicianni, C.; Greco, R.; Santonastaso, G.F. Weighted spectral clustering for water distribution network partitioning. Appl. Netw. Sci. 2017, 2, 19. [Google Scholar] [CrossRef]
- Di Nardo, A.; Di Natale, M.; Santonastaso, G.F.; Venticinque, S. An Automated Tool for Smart Water Network Partitioning. Water Resour. Manag. 2013, 27, 4493–4508. [Google Scholar] [CrossRef]
- Yazdi, J. Decomposition based Multi Objective Evolutionary Algorithms for Design of Large-Scale Water Distribution Networks. Water Resour. Manag. 2016, 30, 2749–2766. [Google Scholar] [CrossRef]
- Zarghami, S.A.; Gunawan, I.; Schultmann, F. Measuring robustness of water distribution networks using informational entropy. In Proceedings of the International Conference on Industrial Engineering and Operations Management, Bandung, Indonesia, 6–8 March 2018. [Google Scholar]
- Zarghami, S.A.; Gunawan, I.; Schultmann, F. Integrating entropy theory and cospanning tree technique for redundancy analysis of water distribution networks. Reliab. Eng. Syst. Saf. 2018, 176, 102–112. [Google Scholar] [CrossRef]
- Farahmandfar, Z.; Piratla, K.R. Comparative Evaluation of Topological and Flow-Based Seismic Resilience Metrics for Rehabilitation of Water Pipeline Systems. J. Pipeline Syst. Eng. 2018, 9, 1. [Google Scholar] [CrossRef]
- Pérez, R.; Sanz, G.; Puig, V.; Quevedo, J.; Cugueró-Escofet, M.À.; Nejjari, F.; Meseguer, J.; Cembrano, G.; Mirats-Tur, J.M.; Sarrate, R. Leak Localization in Water Networks: A Model-Based Methodology Using Pressure Sensors Applied to a Real Network in Barcelona [Applications of Control]. IEEE Control Syst. Mag. 2014, 34, 24–36. [Google Scholar] [Green Version]
- Pérez, R.; Puig, V.; Pascual, J.; Peralta, A.; Landeros, E.; Jordanas, L. Pressure sensor distribution for leak detection in Barcelona water distribution network. Water Sci. Technol. Water Supply 2009, 9, 715–721. [Google Scholar] [CrossRef]
- Eliades, D.G.; Polycarpou, M.M. Water Contamination Impact Evaluation and Source-Area Isolation Using Decision Trees. J. Water Res. Plan. Manag. 2012, 138, 562–570. [Google Scholar] [CrossRef]
- Lambrou, T.P.; Anastasiou, C.C.; Panayiotou, C.G.; Polycarpou, M.M. A Low-Cost Sensor Network for Real-Time Monitoring and Contamination Detection in Drinking Water Distribution Systems. IEEE Sens. J. 2014, 14, 2765–2772. [Google Scholar] [CrossRef]
- Farley, M. Leakage Management and Control: A Best Practice Training Manual; World Health Organization: Geneva, Switzerland, 2001. [Google Scholar]
- Lin, H.Y.; Lin, B.W.; Li, P.H.; Kao, J.J. The application of the cluster identification method for the detection of leakages in water distribution networks. Int. J. Environ. Sci. Technol. 2015, 12, 2687–2696. [Google Scholar] [CrossRef]
- Cugueró-Escofet, M.À.; García, D.; Quevedo, J.; Puig, V.; Espin, S.; Roquet, J. A methodology and a software tool for sensor data validation/reconstruction: Application to the Catalonia regional water network. Control Eng. Pract. 2016, 49, 159–172. [Google Scholar] [CrossRef]
- Hagos, M.; Jung, D.; Lansey, K.E. Optimal meter placement for pipe burst detection in water distribution systems. J. Hydroinform. 2016, 18, 741–756. [Google Scholar] [CrossRef] [Green Version]
- Sela, L.; Amin, S. Robust sensor placement for pipeline monitoring: Mixed integer and greedy optimization. Adv. Eng. Inf. 2018, 36, 55–63. [Google Scholar] [CrossRef]
- Haimes, Y.Y.; Matalas, N.C.; Lambert, J.H.; Jackson, B.A.; Fellows, J.F.R. Reducing Vulnerability of Water Supply Systems to Attack. J. Infrastruct. Syst. 1998, 4, 164–177. [Google Scholar] [CrossRef]
- Burns, N.B.; Cooper, C.A.; Dobbins, D.A.; Edwards, J.C.; Lampe, L.K. Security analysis and response for water utilities. In Urban Water Supply Handbook; Mays, L., Ed.; McGraw-Hill: New York, NY, USA, 2002; pp. 20.1–20.23. [Google Scholar]
- American Water Works Association. Effects of Water Age on Distribution System Water Quality; American Water Works Association: Denver, CO, USA, 2002. [Google Scholar]
- Sarbu, I.; Ostafe, G. Optimal design of urban water supply pipe networks. Urban Water J. 2016, 13, 521–535. [Google Scholar] [CrossRef]
- Everard, M.; Sharma, O.P.; Vishwakarma, V.K.; Khandal, D.; Sahu, Y.K.; Bhatnagar, R.; Singh, J.K.; Kumar, R.; Nawab, A.; Kumar, A.; et al. Assessing the feasibility of integrating ecosystem-based with engineered water resource governance and management for water security in semi-arid landscapes: A case study in the Banas catchment, Rajasthan, India. Sci. Total Environ. 2018, 612, 1249–1265. [Google Scholar] [CrossRef]
- Hines, P.; Cotilla-Sanchez, E.; Blumsack, S. Do topological models provide good information about electricity infrastructure vulnerability? Chaos 2010, 20, 0331223. [Google Scholar] [CrossRef]
- Ouyang, M. Comparisons of purely topological model, betweenness based model and direct current power flow model to analyze power grid vulnerability. Chaos 2013, 23, 0231142. [Google Scholar] [CrossRef]
- Chang, S.E.; Shinozuka, M. Measuring improvements in the disaster resilience of communities. Earthq. Spectra 2004, 20, 739–755. [Google Scholar] [CrossRef]
- Mehran, A.; Mazdiyasni, O.; AghaKouchak, A. A hybrid framework for assessing socioeconomic drought: Linking climate variability, local resilience, and demand. J. Geophys. Res. Atmos. 2015, 120, 7520–7533. [Google Scholar] [CrossRef]
- Chappin, É.J.L. Simulating Energy Transitions; Next Generation Infrastructures Foundation: Delft, The Netherlands, 2011; ISBN 9789079787302. [Google Scholar]
Figure 1.
The cluster labels visualized by CiteSpace.

Figure 2.
Distribution of filtered papers by year of publication.

Figure 3.
Temporal progress of absorptive, restorative, and adaptive capabilities in WDN resilience.
Figure 3.
Temporal progress of absorptive, restorative, and adaptive capabilities in WDN resilience.


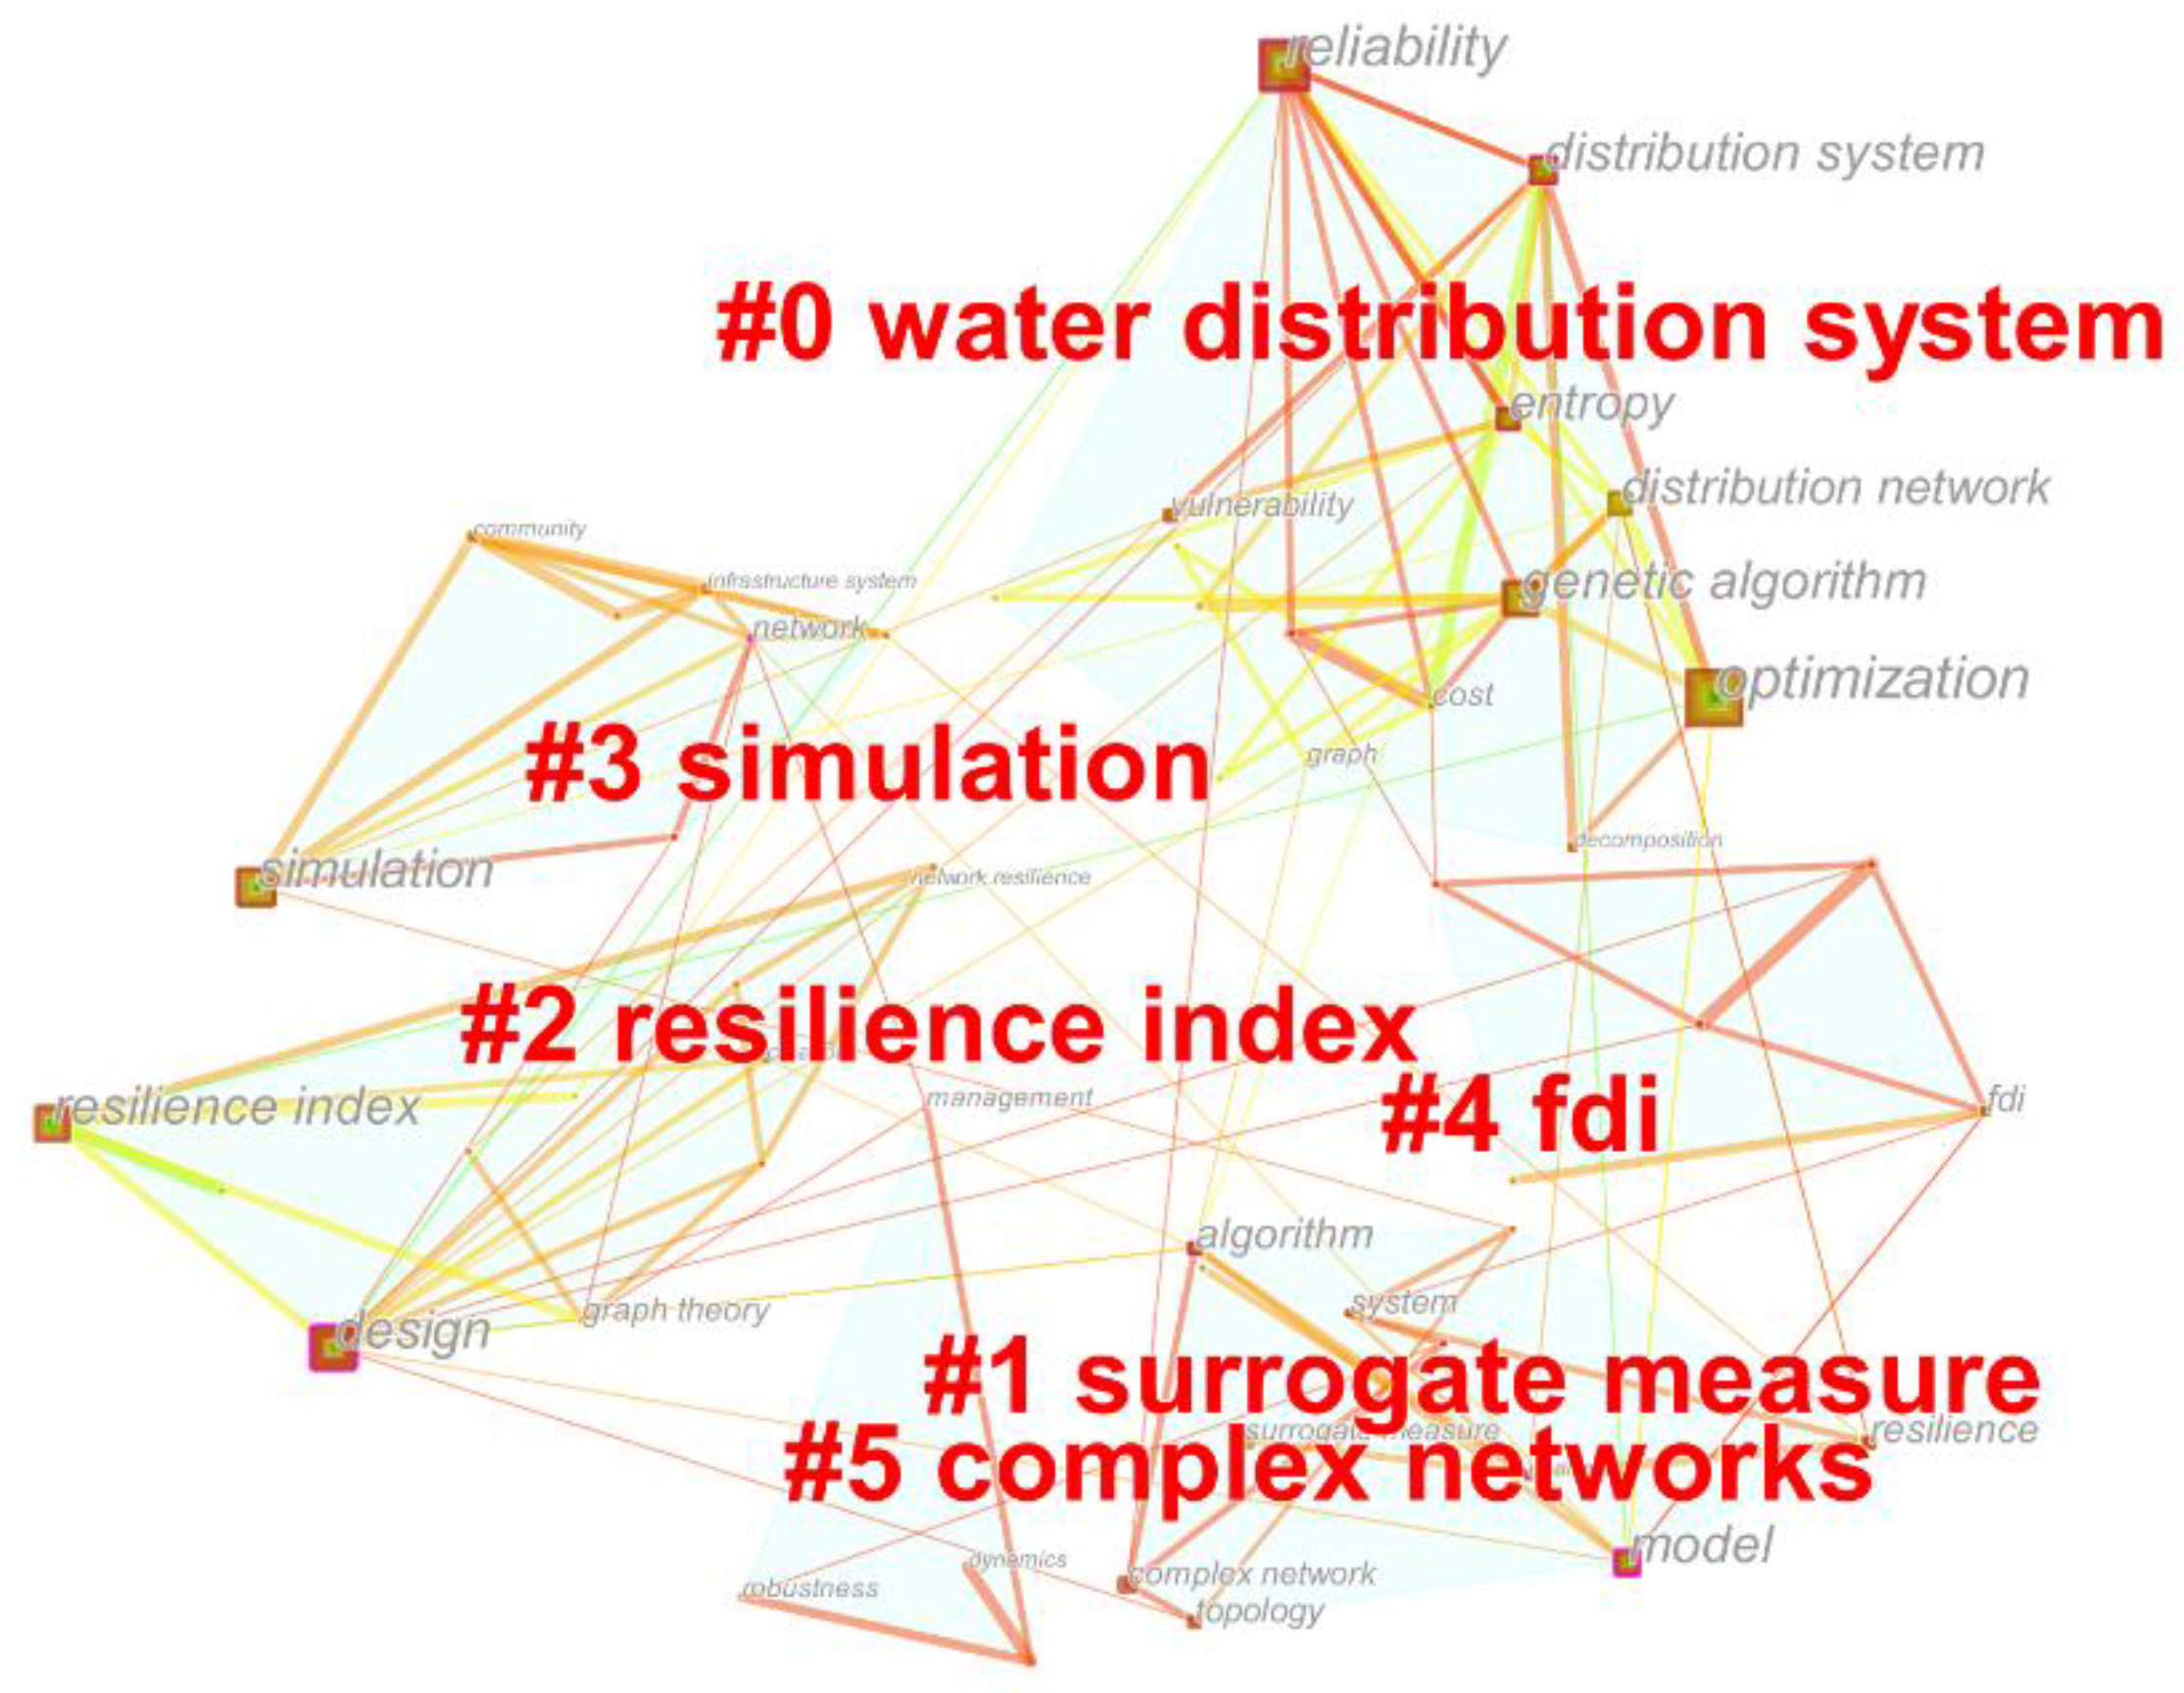
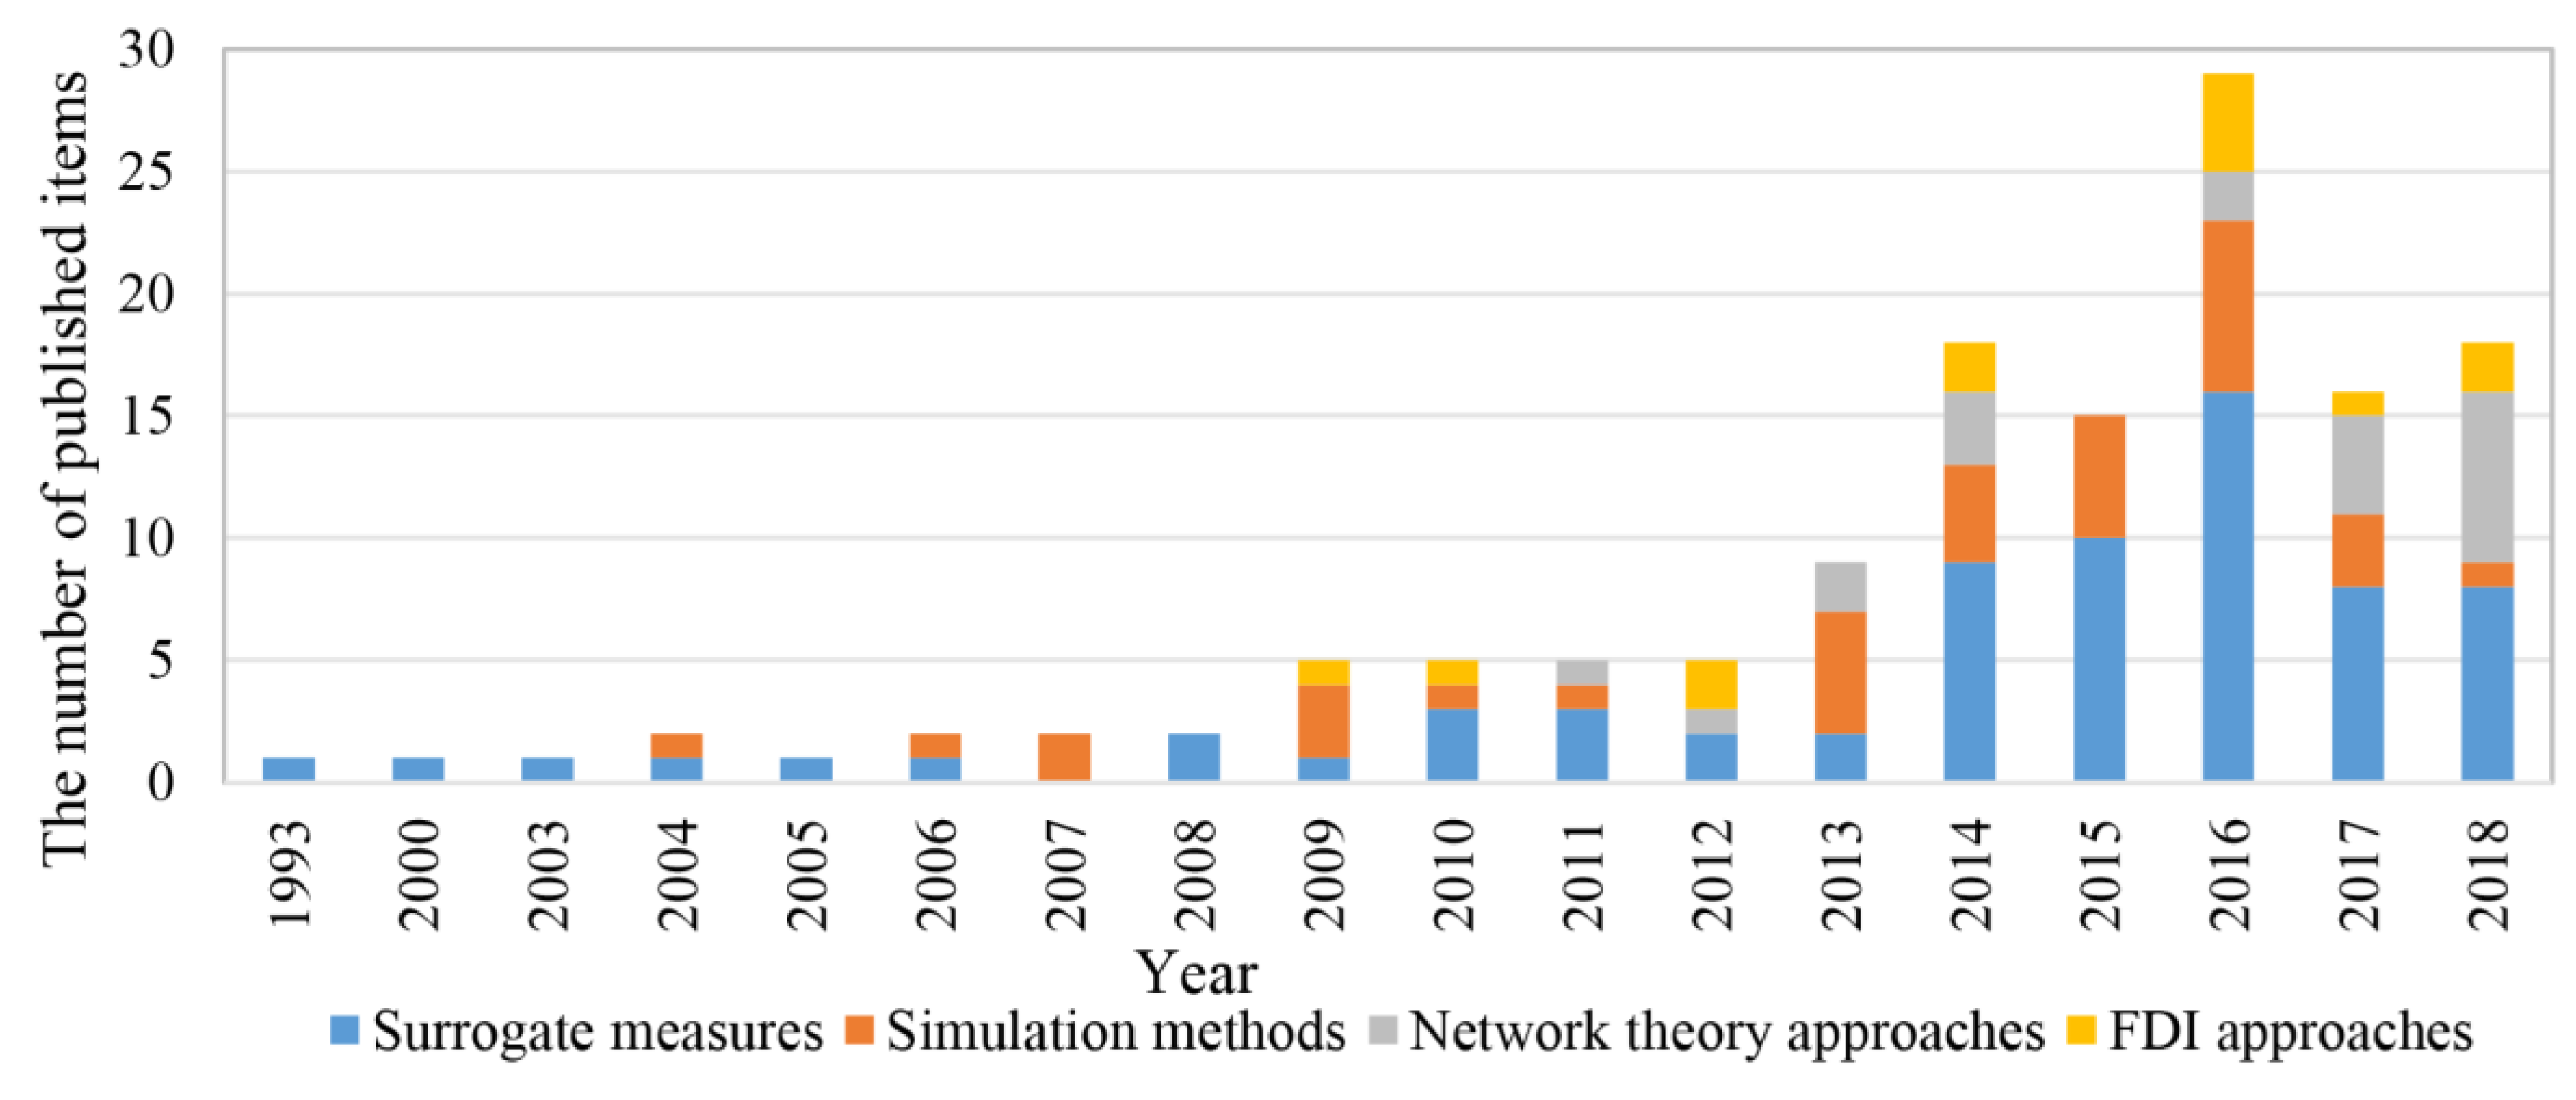
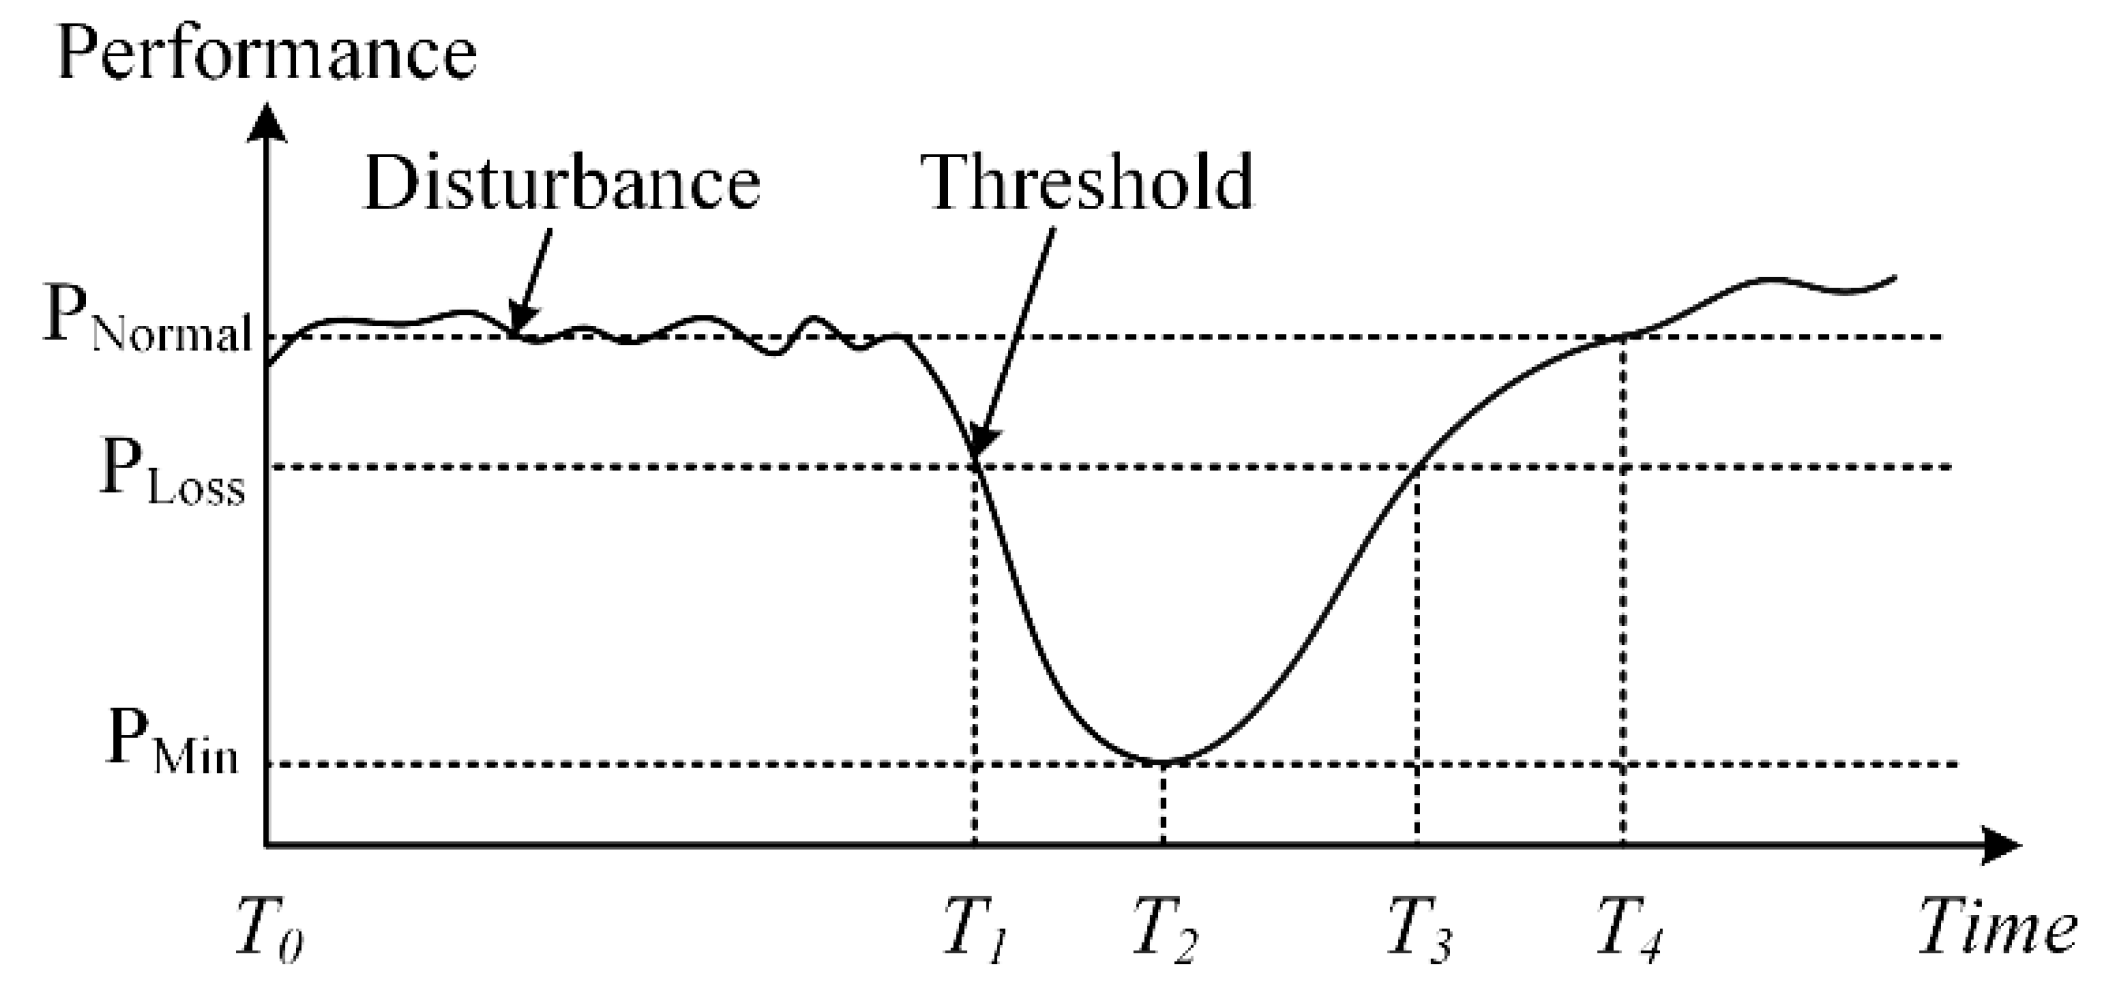
Table 1.
Comparison of EPANET and WNTR.
| Software | Generate Water Network Models | Modify Network Structure | Modify Network Operation | Simulate Network Hydraulics and Water Quality | Analyze Results and Generate Graphics | Time-Varying Demands | Add Disruptive Incidents | Add Response/Repair/Mitigation Strategies | Run Probabilistic Simulations | Compute Resilience | Hydraulic Simulation Method |
|---|---|---|---|---|---|---|---|---|---|---|---|
| EPANET | √ | √ | √ | √ | √ | √ | demand-driven | ||||
| WNTR | √ | √ | √ | √ | √ | √ | √ | √ | √ | √ | pressure-driven |
Table 2.
New challenges with resilience capability type.
| New Challenges | Focus Areas | Effects |
|---|---|---|
| Targeted failures | Absorptive capability |
|
| Expert knowledge | Absorptive capability |
|
| Multi-scenario coupled analysis | Absorptive capability |
|
| Emergency recovery | Restorative capability |
|
| Post-disturbance rebuilding | Restorative capability |
|
| Effects of climate change | Adaptive capability |
|
| Coupled analysis with society and technology | Adaptive capability |
|
| Data availability | Adaptive capability |
|
| Interdependency infrastructures | Adaptive capability |
|
© 2019 by the authors. Licensee MDPI, Basel, Switzerland. This article is an open access article distributed under the terms and conditions of the Creative Commons Attribution (CC BY) license (http://creativecommons.org/licenses/by/4.0/).
Share and Cite
MDPI and ACS Style
Shuang, Q.; Liu, H.J.; Porse, E. Review of the Quantitative Resilience Methods in Water Distribution Networks. Water 2019, 11, 1189. https://doi.org/10.3390/w11061189
AMA Style
Shuang Q, Liu HJ, Porse E. Review of the Quantitative Resilience Methods in Water Distribution Networks. Water. 2019; 11(6):1189. https://doi.org/10.3390/w11061189
Chicago/Turabian StyleShuang, Qing, Hui Jie Liu, and Erik Porse. 2019. "Review of the Quantitative Resilience Methods in Water Distribution Networks" Water 11, no. 6: 1189. https://doi.org/10.3390/w11061189
Note that from the first issue of 2016, this journal uses article numbers instead of page numbers. See further details here.