Effects of Bridge Piers on Flood Hazards: A Case Study on the Jialing River in China


State Key Laboratory of Eco-hydraulics in Northwest Arid Region, Xi’an University of Technology, Xi’an 710048, China
*
Author to whom correspondence should be addressed.
Water 2019, 11(6), 1181; https://doi.org/10.3390/w11061181
Submission received: 15 May 2019
/
Revised: 30 May 2019
/
Accepted: 3 June 2019
/
Published: 5 June 2019
(This article belongs to the Special Issue Water Related Disaster and Water Environment Management)
Abstract
:Bridge piers on river channels can cause obstacles for flood flow by reducing the cross-sectional area and inducing local eddy currents and high flow velocities, which may destroy hydraulic structures. A two-dimensional numerical model was used to investigate the effects of bridge piers on river flood hazards in the Jialing River, China. For the modeling, Mike 21 FM was used, which is an unstructured mesh and finite volume model that solves the shallow water equations. The numerical model was validated with collected historical flood traces, and sensitivity analyses identified the effects of the Manning coefficient and the dependence on the grid size. The influence of backwater effects on the flow field was analyzed by comparing numerical results with and without piers. The results showed that the most significant impacts were caused by the Fengxian Bridge. The maximum water level rise was about 1 m and the maximum velocity near this bridge decreased by 22.77% for a 10-year flood. We found that the top elevations of planned levees near the bridges must be increased by 0.15–0.36 m. The influence of bridge piers on the flood velocity field is more complex. These findings will help flood hazard management in this river and provides a reference for similar projects.
1. Introduction
River flooding is one of the most serious natural disasters in the world. Flash floods are destructive and cause serious damage to people’s lives and property. However, with the impact of climate change, extreme rainfalls are expected to occur more intensely [1], which will result in more serious floods [2,3]. In mountainous areas, roads and railways often have to cross rivers, and it is necessary to build bridges with piers to cross them. However, the presence of bridge piers will adversely affect river flooding. For example, they will lead to higher flood levels upstream, which can destroy dikes, threatening the safety of residents on both sides of the river. Additionally, eddy currents and high flow velocities near piers can cause local erosions of the bed. Evaluation of the impact of bridge piers on river floods is, therefore, of great importance for bridge design and for the management of flood risks.
In recent years, many one- and two-dimensional (1D, 2D) numerical models have been developed and applied to the investigation of river and urban floods [4,5,6,7,8,9,10,11,12,13,14]. For the 1D numerical model, Tomasz et al. [12] carried out an assessment of the impact of bridges on flood flow of the Warta River near Wronki in Poland using the HEC-RAS software package. Le Thi Viet Hoa et al. [15] applied the software HydroGis to investigate the effects of infrastructure on floods in the Mekong River Delta in Vietnam. Siregar [16] studied the flow impact of the Citarum Bridge structures in Indonesia using the HEC-RAS software. Petaccia and Natale (2013) developed a 1D numerical code (ORSADEM) for flood inundation modeling and applied this to a case study of the Brembo River in Italy [17]. The 1D numerical model is a widely used approach for studying river floods because of its low computational cost. However, to achieve satisfactory results, the use of 1D models requires a greater hydraulic skills than the use of a 2D model, as pointed out by Costabile et al. [18]. Costabile et al. found that the application of a 1D model is not trivial in rivers with skewed bridge crossings because of the uncertainty related to the narrowing induced by bridge piers within the cross-sections [19]. In recent years, with the development of the LiDAR and Graphics processing units (GPUs) techniques, 2D numerical models have been extensively investigated and applied to flood inundation [20,21]. Very accurate, inexpensive DEM data has been obtained easily by LiDAR, and the GPU technique significantly improved the computational efficiency of the numerical model and maked available very accurate numerical methods [10,22]. Meesuk et al. [23] demonstrated the accuracy of LiDAR data for a numerical flood model. Noh et al. [24] developed a hybrid parallel code for the 1D-2D-coupled urban flood modeling using DEM data by LiDAR with 1-m resolution. However, some complex flow features such as shock-type flow discontinuities, transcritical flows, as well as wetting and drying over irregular topography were induced, and therefore a robust numerical scheme was required to produce accurate and stable numerical solutions [25]. For an engineering application of the 2D numerical models, Costabile et al. developed 1D and 2D numerical models based on the shallow water equations and the two models were compared to analyze the effects of two bridges on the Crati and Corace rivers in Italy [26]. Geng and Wang developed a 2D numerical model based on the unstructured finite volume method for bridge pier flow [27]. Jiang and Wen carried out 2D numerical modeling for flood control evaluation of the Tongjiang River Bridge in China [28]. In general, 2D numerical models are expected to display more details of flow fields in the vicinity of bridge piers, which are very importance in determining the management of flood risks [29].
In this study, the impacts on flood flows of four bridges in the Jialing River were investigated with a 2D numerical model. Shallow water equations were solved using the finite volume method and an unstructured triangular mesh system. We focused on the backwater effects and velocity fields in the vicinity of piers.
The rest of this paper is structured as follows. The study areas and input data appear in Section 2, as well as, the numerical model, which includes the use of mesh generation, model parameters, and initial and boundary conditions, is developed, and a sensitivity analysis and model validation are discussed. In Section 3, the backwater effects of bridge piers and flow fields near the piers are investigated and these results are applied to discuss the effects of bridge piers on planning dikes. Some conclusions are drawn in Section 4.
2. Materials and Methods
2.1. Study Area
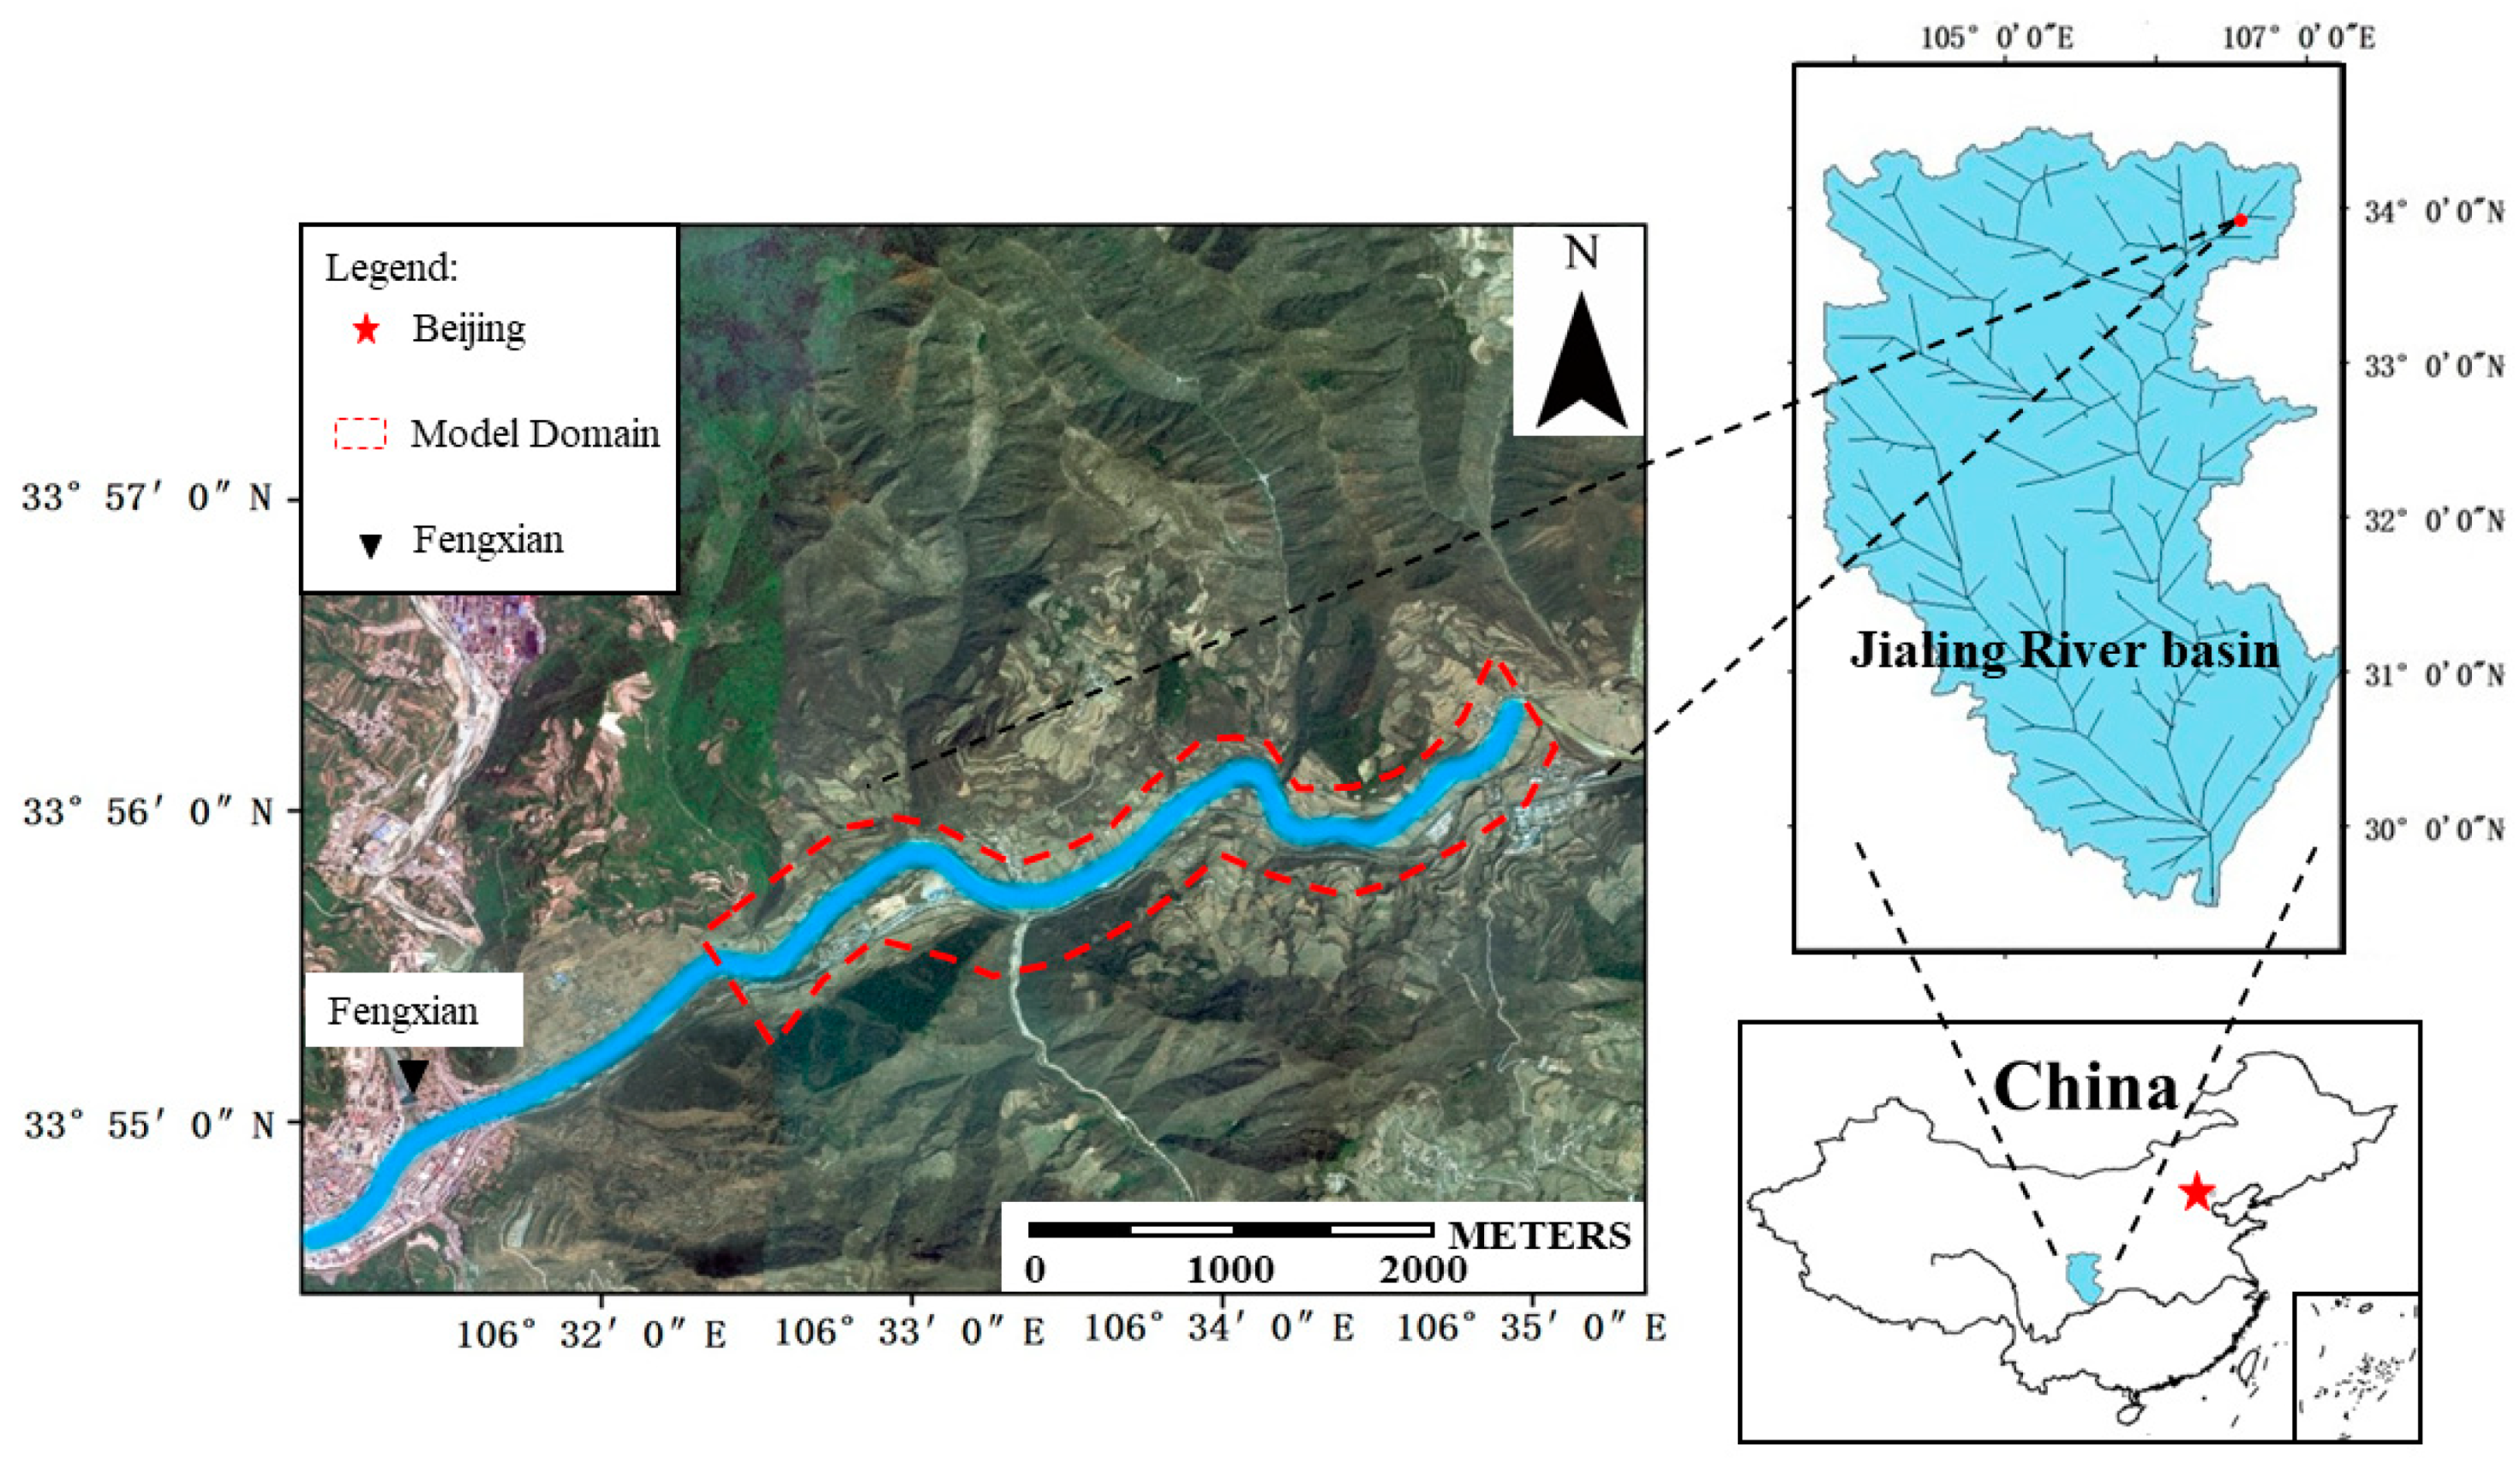
The project area is in the upper reach (Fengxian section) of the Jialing River, which is one of the main tributaries on the left bank of the Yangtze River (Figure 1). The main stream of the Jialing River (Fengxian section) is about 102 km long, the watershed area is 2531 km2, and the average bed slope of the river is 1.4%. This is a warm temperate mountain climate area with an annual average temperature of 11.4 °C, an average annual rainfall of 623.6 mm, a maximum rainfall of 939.3 mm (in 1958), and a minimum rainfall of 422.3 mm (in 1969). The precipitation from April to October (wet season) is on average 577.3 mm, which is 92% of the entire year’s precipitation. From November to March (dry season), the precipitation is on average 46.3 mm (8% of the entire year’s precipitation). The elevation on both sides of the Jialing River is in the range of 1400–1800 m, the relative height is 500–800 m with a steep slope of about 30–40 degree. Due to the narrow and steep river channel, the floods are of short durations and high peaks and most have a single peak. According to the statistics of the measured data, the floods in the upper reach of the Jialing River are mainly formed by high-intensity rain [30]. For example, the 1933 rainstorm, with a rainfall intensity of 73.6 mm/day, produced 500 m3/s peak flow at the upper reach and 970 m3/s peak flow in the lower reach, which is approximately a 10-year flood. Heavy rains generally occur from July to September.
The hydrological stations in the upper reaches of the Jialing River are the Fengzhou Station (106°38′ E, 33°58′ N), the Ciba Station (106°25′ E, 33°51′ N), and the Lueyang Station (106°08′ E, 33°20′ N), with catchment areas 688 km2, 2722 km2 and 19,206 km2, respectively. The maximum peak flow rate measured at Fengzhou Station was 972 m3/s (in 1990). The maximum peak flow rate measured at Ciba Station was 4670 m3/s (in 1981). The Lueyang Station’s maximum flood peak flow in 1981 reached 8630 m3/s.
This section of the Jialing River is meandering. The highway crosses the main stream of the Jialing River four times. The four bridges designed to allow this are the following: the Xizhuang Bridge, the Fengxian Bridge, the E Ramp Bridge, and the Jialing River Bridge. The length of the river from the Xizhuang Bridge to the Jialing River Bridge is 2230 m. The span of the bridge piers is not equal, and there is a span of 40 m in the main channel and 30 m on the bank. The lengths of the bridges are greater than 100 m, and the bridges are designed for a 100-year flood.
2.2. Model Description
The numerical model used in this study was the Mike 21 FM, developed by the Danish Hydraulic Institute (DHI), which uses a finite volume method and unstructured triangular mesh to solve the 2D shallow water equations [31]. The governing equations are given by
Equation of mass conservation:
Equation of momentum conservation:
where, is the total water depth; is the still water depth; denotes free surface elevation; p and q are the fluxes per unit width at x and y directions, respectively; g is gravitational acceleration; C is the Chézy coefficient which is determined by Manning’s formula; denotes density of the water; are the components of lateral shear stress (viscous friction, turbulent friction, and differential advection); and are the Coriolis forces at two horizontal directions(not covered in this study). x, y, are the spatial coordinates and t denotes time.
An approximate Riemann solver (Roe scheme) was used to calculate the convective fluxes at cell boundaries. Second-order spatial accuracy was achieved by employing a linear gradient reconstruction technique. A second-order total variation diminishing (TVD) slope limiter (the van-Leer limiter) was used to avoid numerical oscillations. A second-order Runge–Kutta method was used for time integration. More details about the numerical schemes of the model is found in the scientific documentation of the Mike 21 FM.
To ensure the stability of the model, the time step had to be selected such that the Courant–Friedrich–Levy (CFL) number was less than unity. For the shallow water equations in Cartesian coordinates, the CFL number is defined as:
where, h is the total water depth at the cell center; u and v are the depth averaged velocities in the x and y directions, respectively; g denotes gravitational acceleration; Δx and Δy are the mesh sizes in x and y directions, respectively, which are approximately the minimum side length for the triangular meshes; and Δt is the time step.
2.3. Mesh Generation and Model Parameters
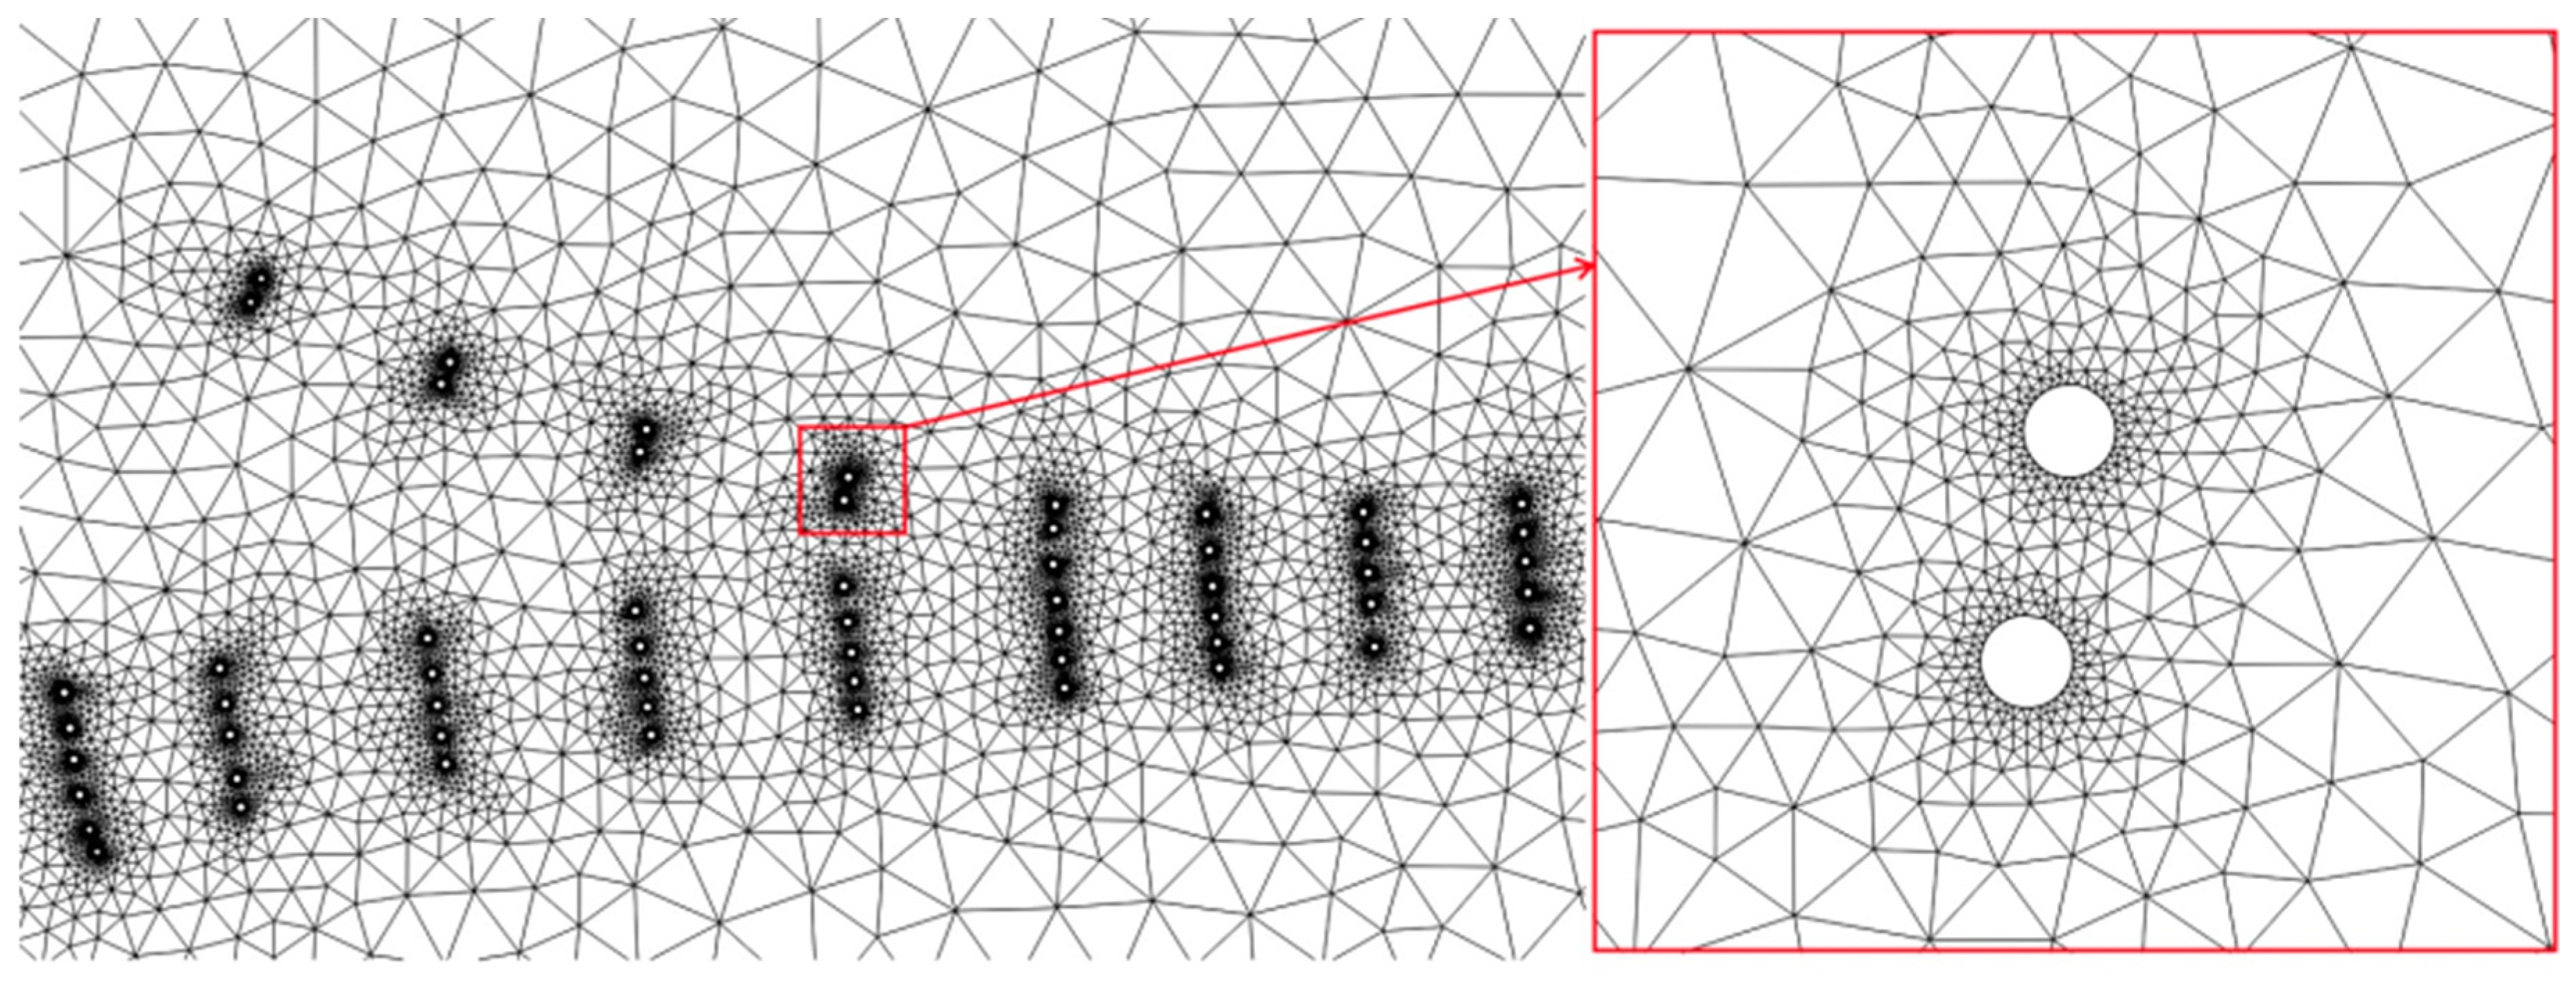
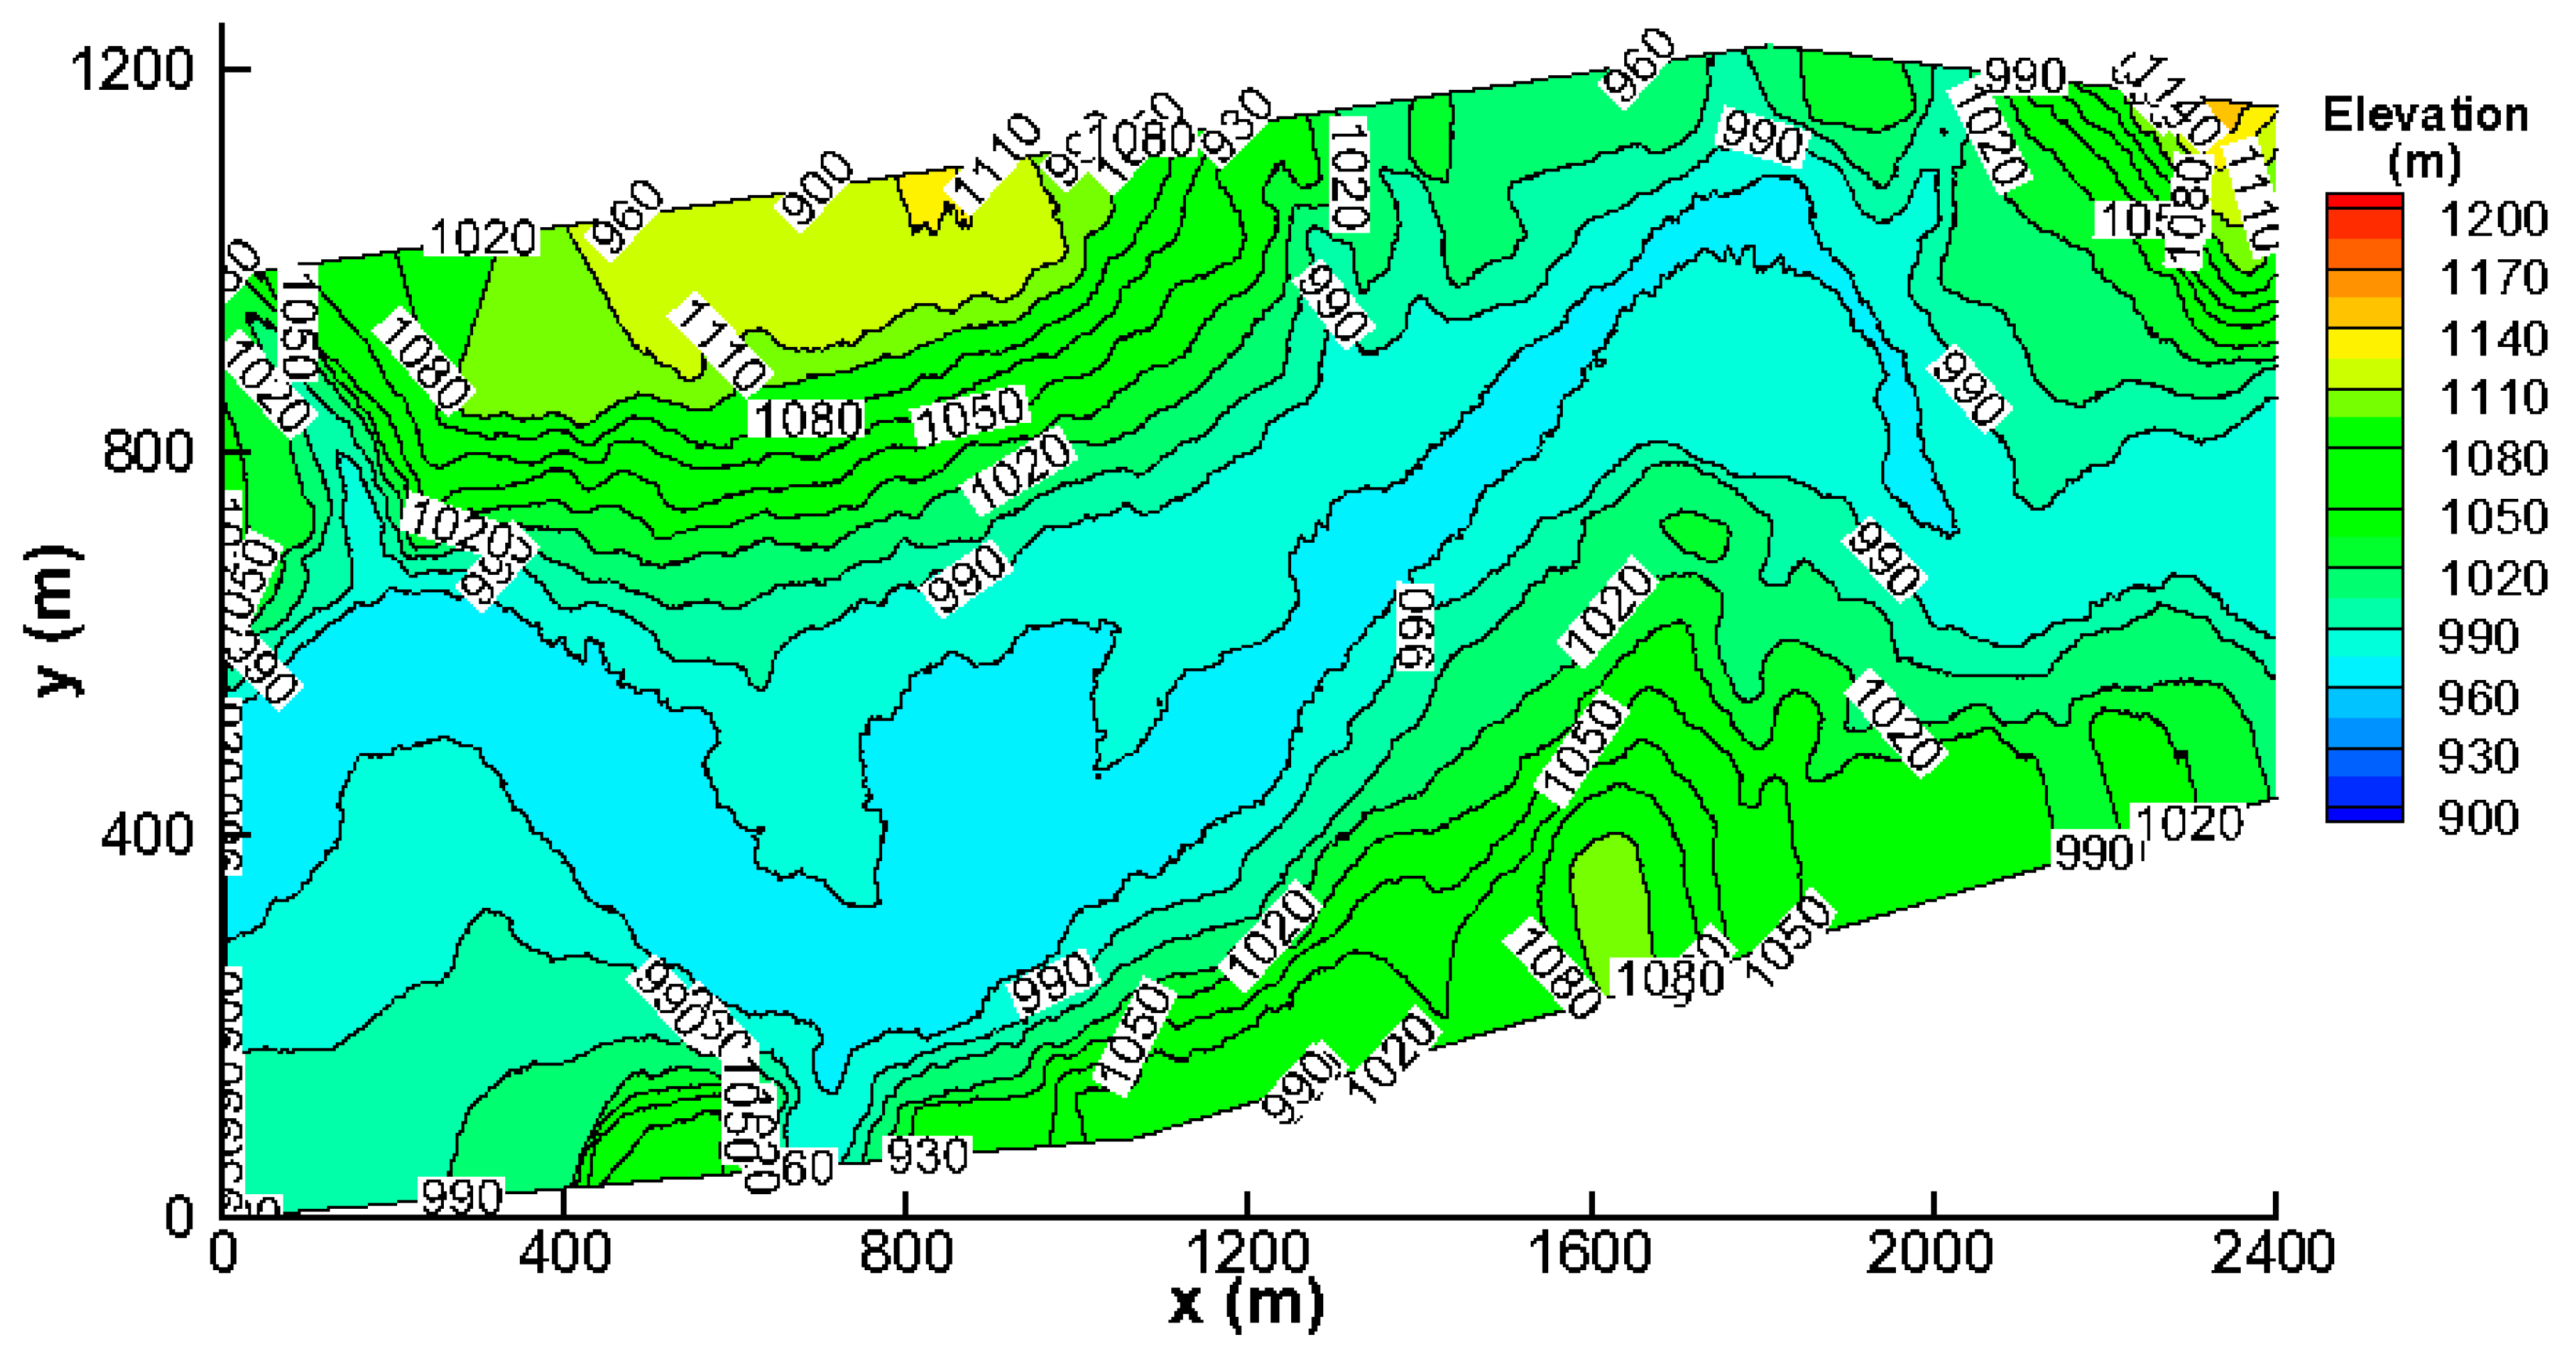
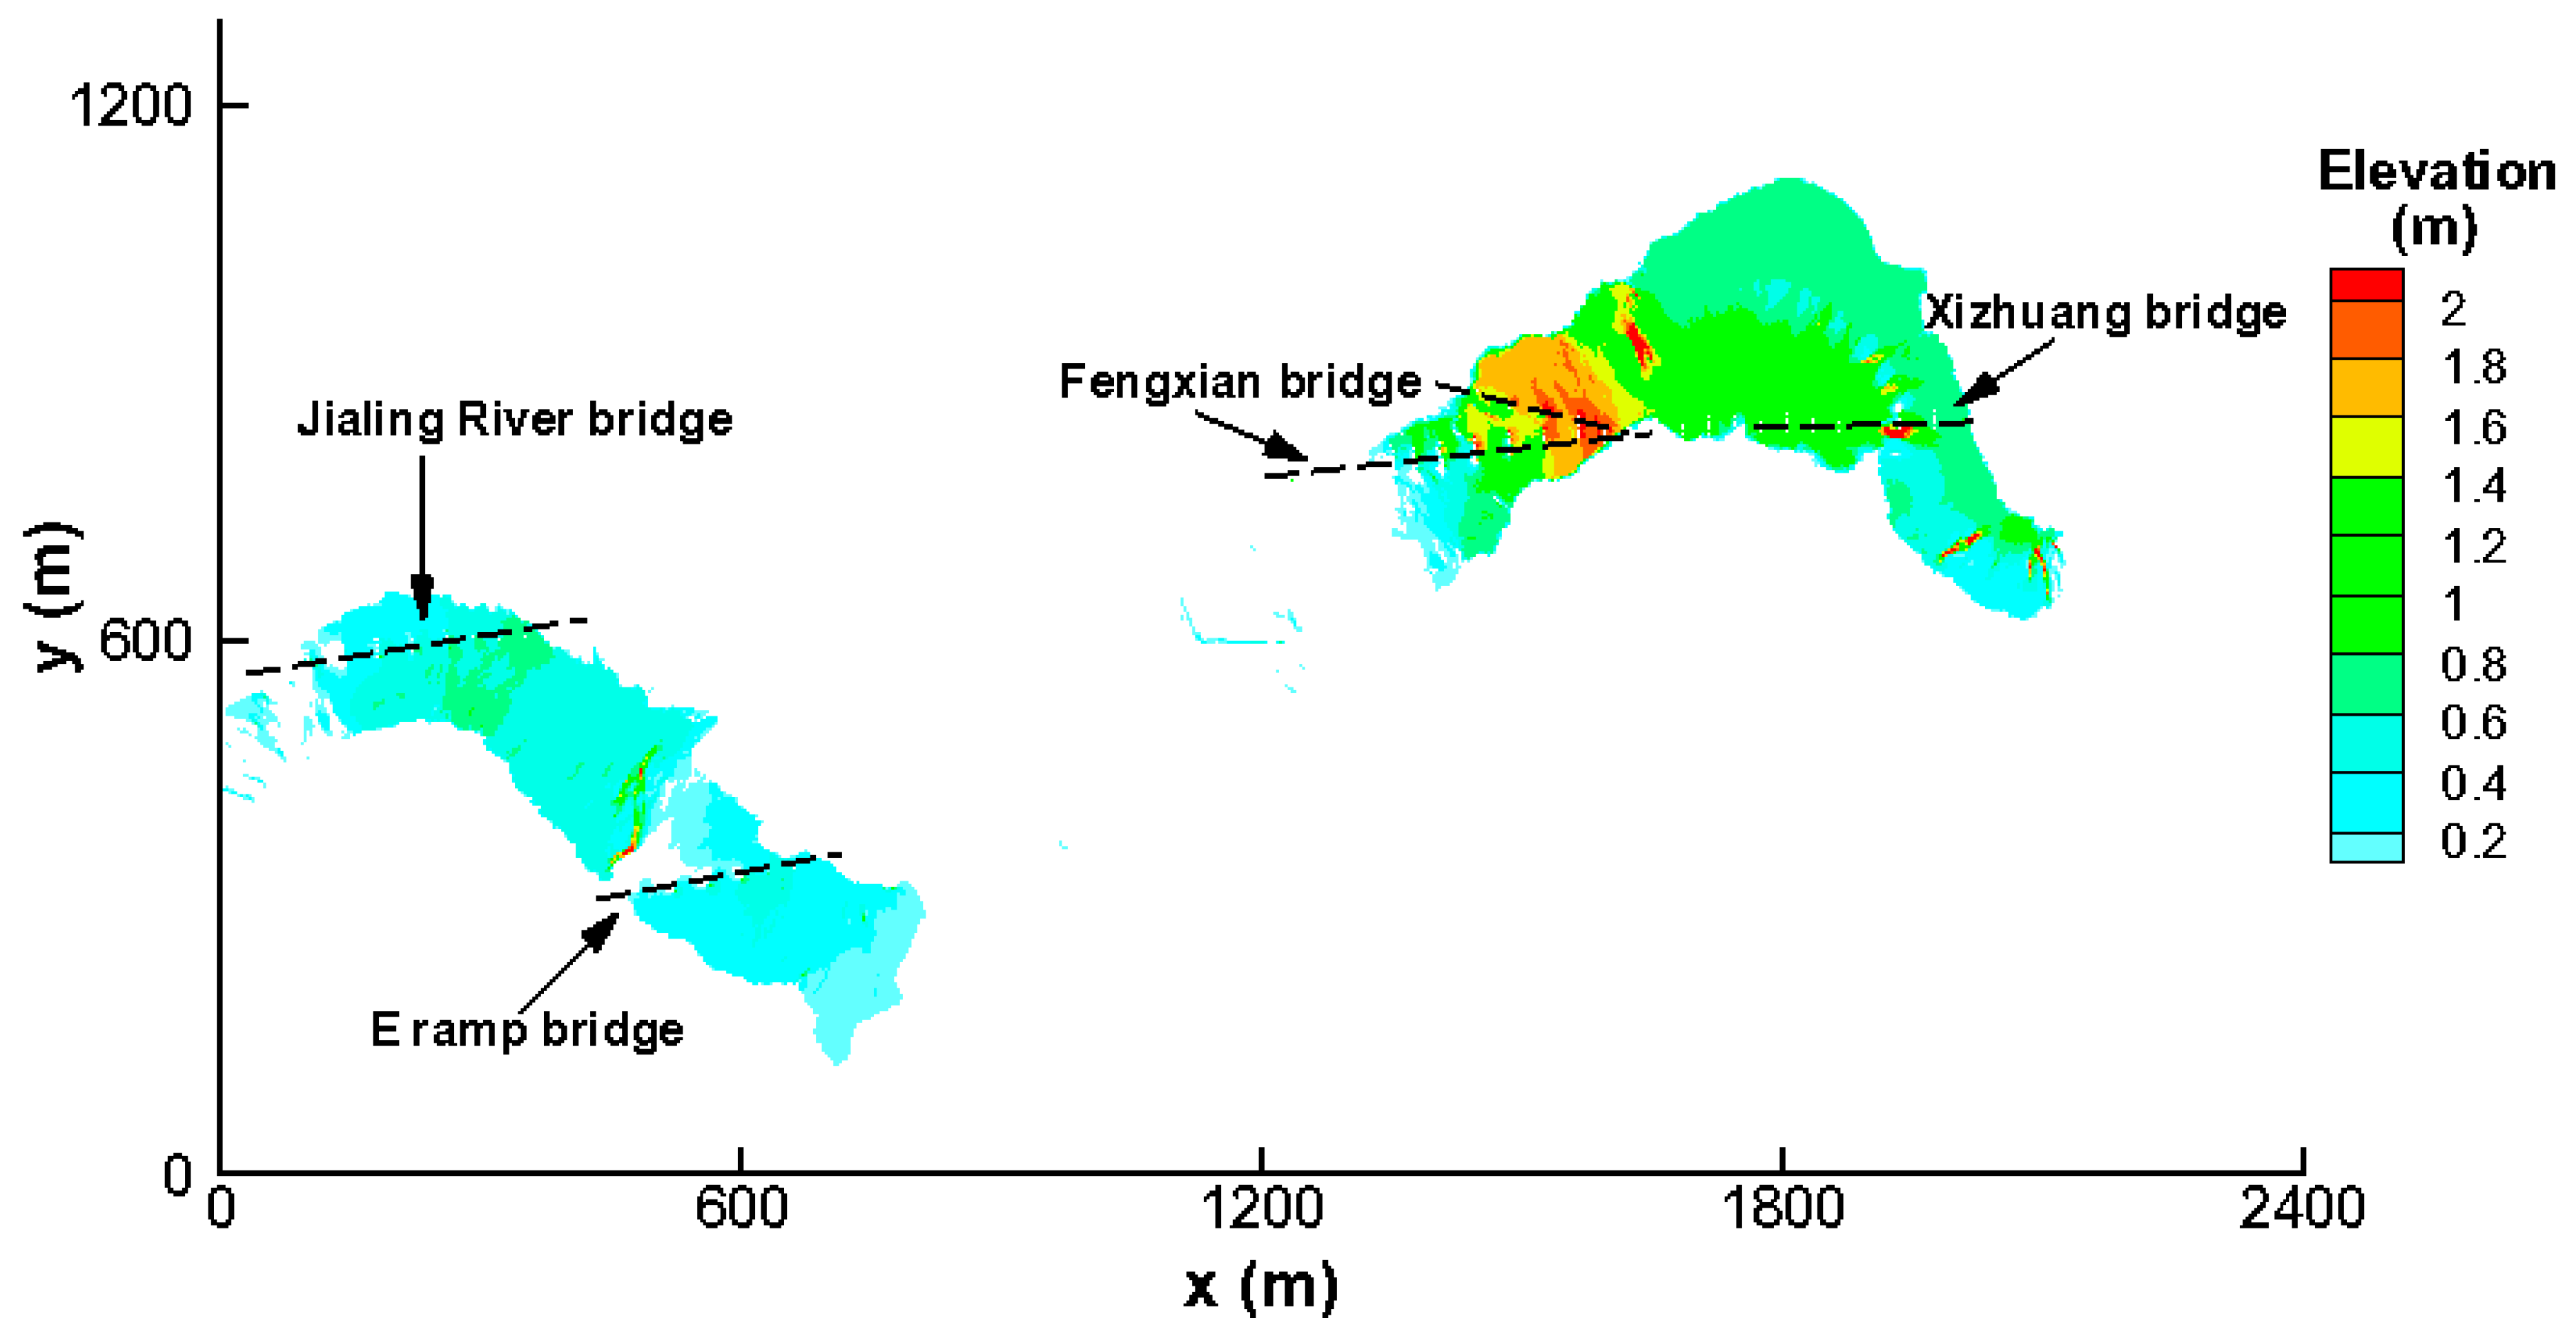
A high-quality mesh is vital for the numerical simulations. In this study, the computational mesh was generated using the mesh generator provided by Mike 21 FM software. The input data to the mesh generator included scatter topography data and a file where the boundary of the computational domain was listed. The mesh generator provided three parameters to ensure the quality of the generated mesh. These were the maximum element area, the smallest allowable angle, and the maximum number of nodes. In the following analysis, we chose a maximum element area of 50 m2, a smallest allowable angle of 29°, and a maximum number of nodes of 100,000. By using an unstructured mesh, the circular bridge piers with diameters of 2 m are directly described (i.e., solid wall conditions) (Figure 2). Two sets of meshes with and without piers were used to investigate the impacts of bridge piers on the flow fields. Mesh independence is analyzed in Section 2.4. The input topography for the study area is presented in Figure 3.
The Manning coefficient (n), which indicates the resistance of the channel bed, is an important parameter for flood simulations. At the two hydrological stations of Fengzhou and Ciba, when the average water depth is greater than 1.0 m, the roughness coefficient is between 0.03 and 0.038 m−1/3 s. In this study, a constant Manning coefficient (n = 0.038 m−1/3 s) was used in the entire study area for the sake of safety. A sensitivity analysis was also carried out to investigate the effects of the Manning coefficient on the computed results, as described in Section 2.4.
The boundary conditions at the upstream and downstream cross-sections had to be specified. At the upstream boundary, flood discharge was used. Two scenarios with 10-year and 100-year floods were used in this study. From hydrological analysis, the discharges in 10-year and 100-year floods were 824 and 2241 m³/s, respectively. At the downstream boundary, water levels were specified, and calculated using the Chézy formula with an assumption of uniform flow. In this paper, water levels at the downstream boundary were 963.79 m and 965.82 m for the 10-year and 100-year floods, respectively. Initial water levels were set to be the same as those at the downstream boundary. Initial velocities were set to zero.
2.4. Sensitivity Analysis
In this section, analyses of mesh independence and the sensitivity of the Manning coefficient on the numerical results are discussed.
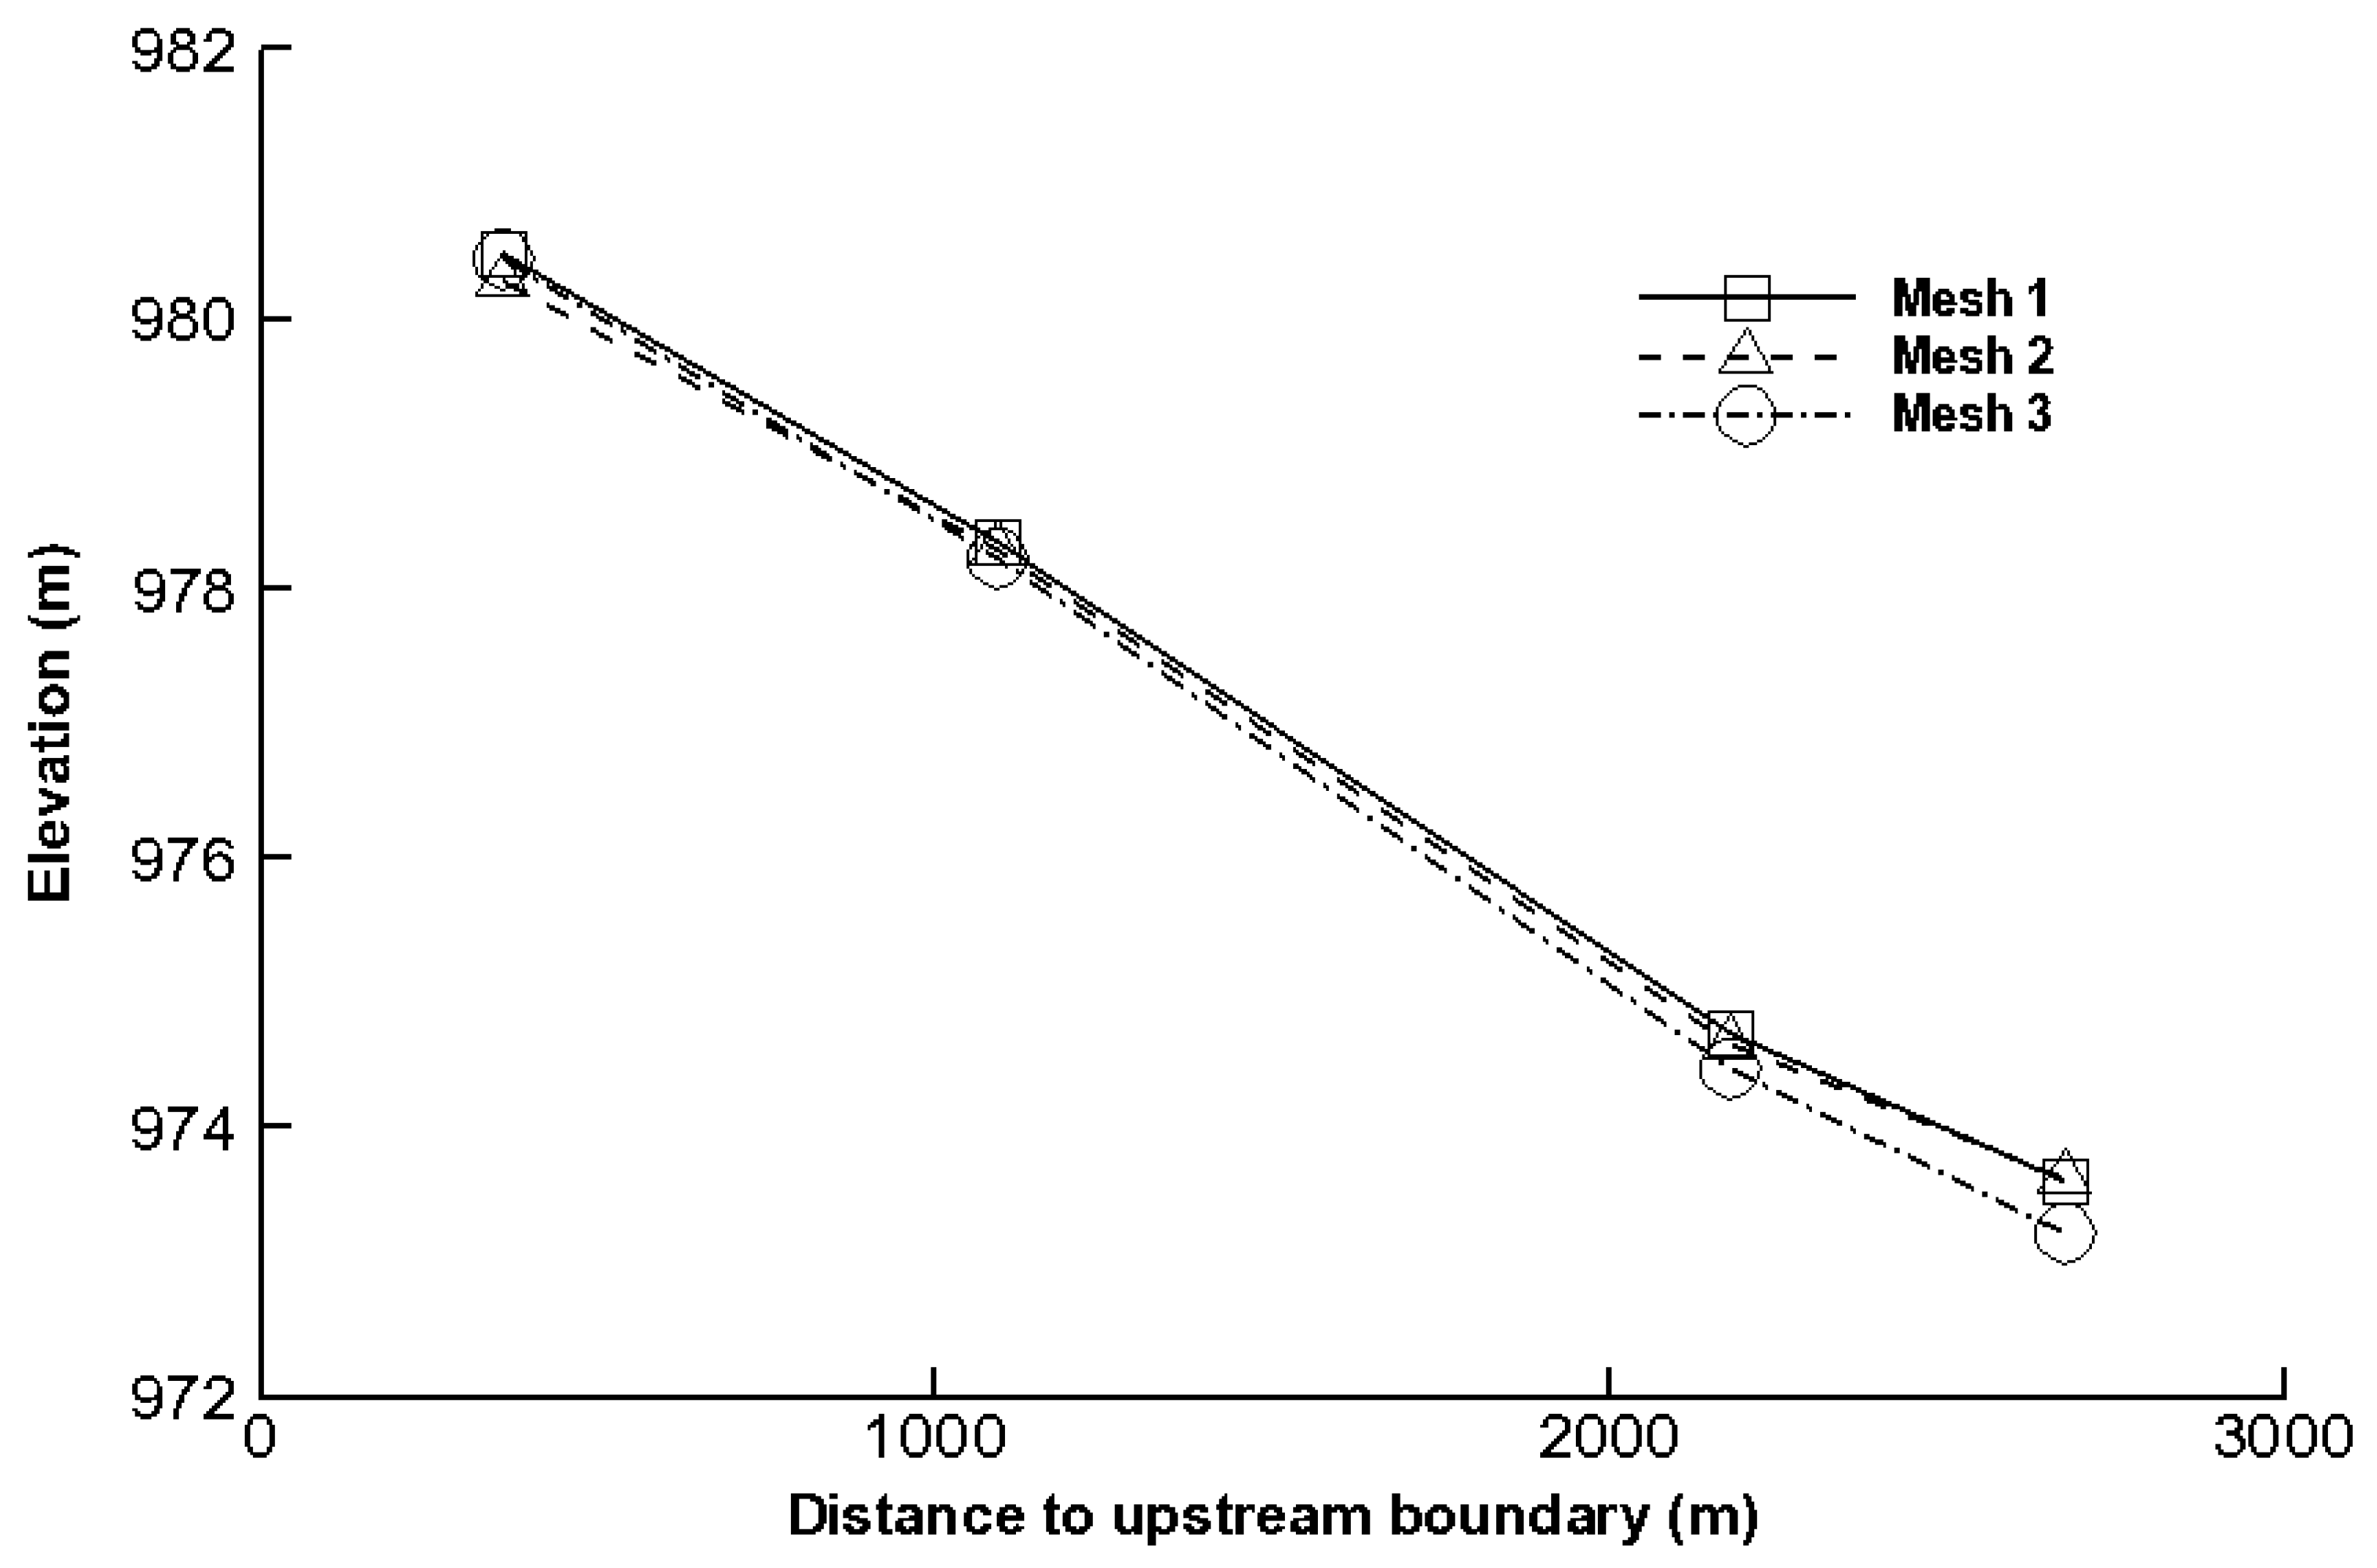
For the mesh independence analysis, three sets of meshes without piers (Table 1) were tested under 100-year flood conditions. The results are shown in Figure 4, which presents cross-sectional averaged water levels near the locations of the four bridges. The results for the three sets of meshes display slight differences. The maximum difference was 0.38 m, and mesh independence for this simulation was thus validated. In the following analysis, meshes with a maximum element area of 80 m3 and a smallest allowable angle of 29° were used for the simulations both with and without piers.
To check the effects of the Manning coefficient on the computed results, three different values were selected, n = 0.03, 0.035, and 0.038 m−1/3 s, and the results were compared under the 100-year flood condition. The computed water levels at four cross-sections near the bridges are presented in Figure 5. The results show that a smaller Manning coefficient resulted in a lower water level, as expected. The maximum difference for this test was 0.36 m. The effects of the Manning coefficient on the computed results are thus limited in this study.
2.5. Validation of the Numerical Model
Validation of the numerical model is important and necessary but difficult because field measured data during historical floods are rare. On 6 July 1990, a flood occurred in the Jialing River with a maximum flow of 972 m3/s measured at Fengzhou Station and 2750 m3/s measured at Ciba Station. The surveyed flood elevation at the cross-section, 1260 m from the upstream boundary, was 976.80 m. These data were used for validation of the numerical model. The corresponding flow discharge was 1440 m3/s, calculated by the interpolation of values from the Fengzhou Station and the Ciba Station. From our model, the computed water level at the cross-section under these flood conditions was 977.25 m, 0.45 m higher than the surveyed flood level. When comparing the effects of mesh resolution and the Manning coefficient, the difference between the computed and surveyed water levels is acceptable. Additionally, due to river bed evolution, the topography used in the numerical model may be different from the topography in 1990 and this may be the reason for the difference [32]. Generally, the numerical model developed was validated to be accurate enough for further study.
3. Results and Discussion
The planned levees along this reach are designed for 10-year floods and the four bridges are designed for 100-year floods. In this section, the numerical model was used to investigate the impacts of bridge piers on river flooding under 10-year and 100-year flood conditions. Numerical models with and without piers were used and compared for this purpose.
3.1. Backwater Effects of Bridge Piers
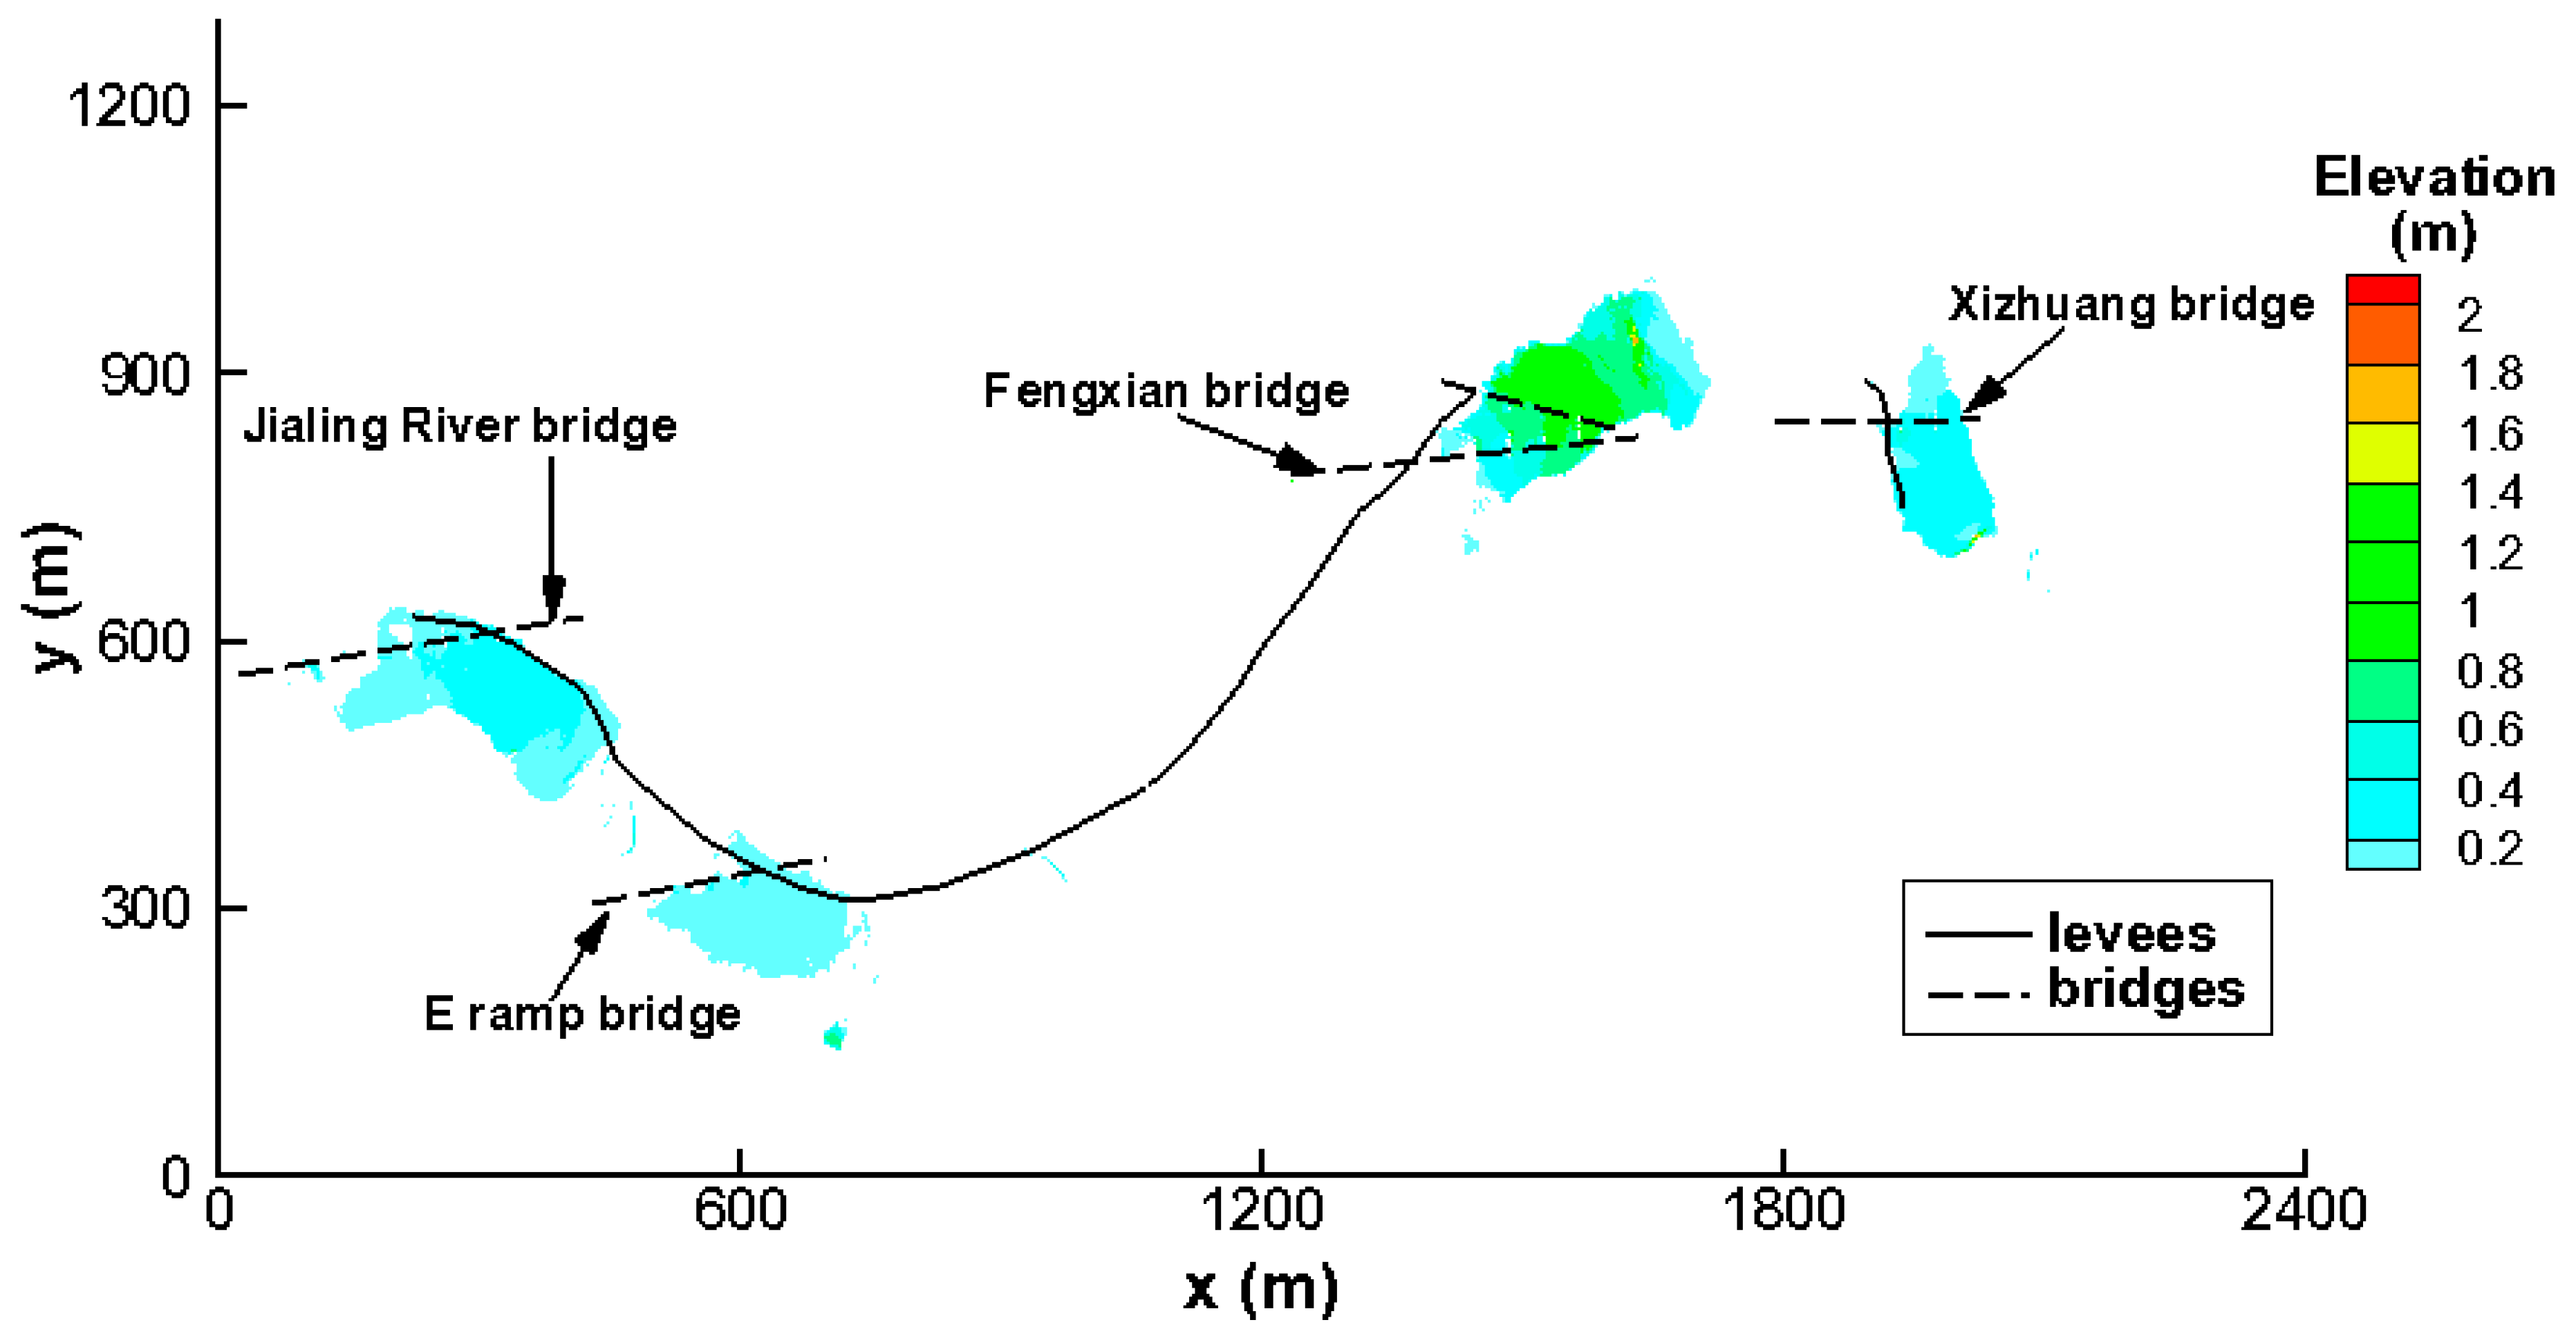
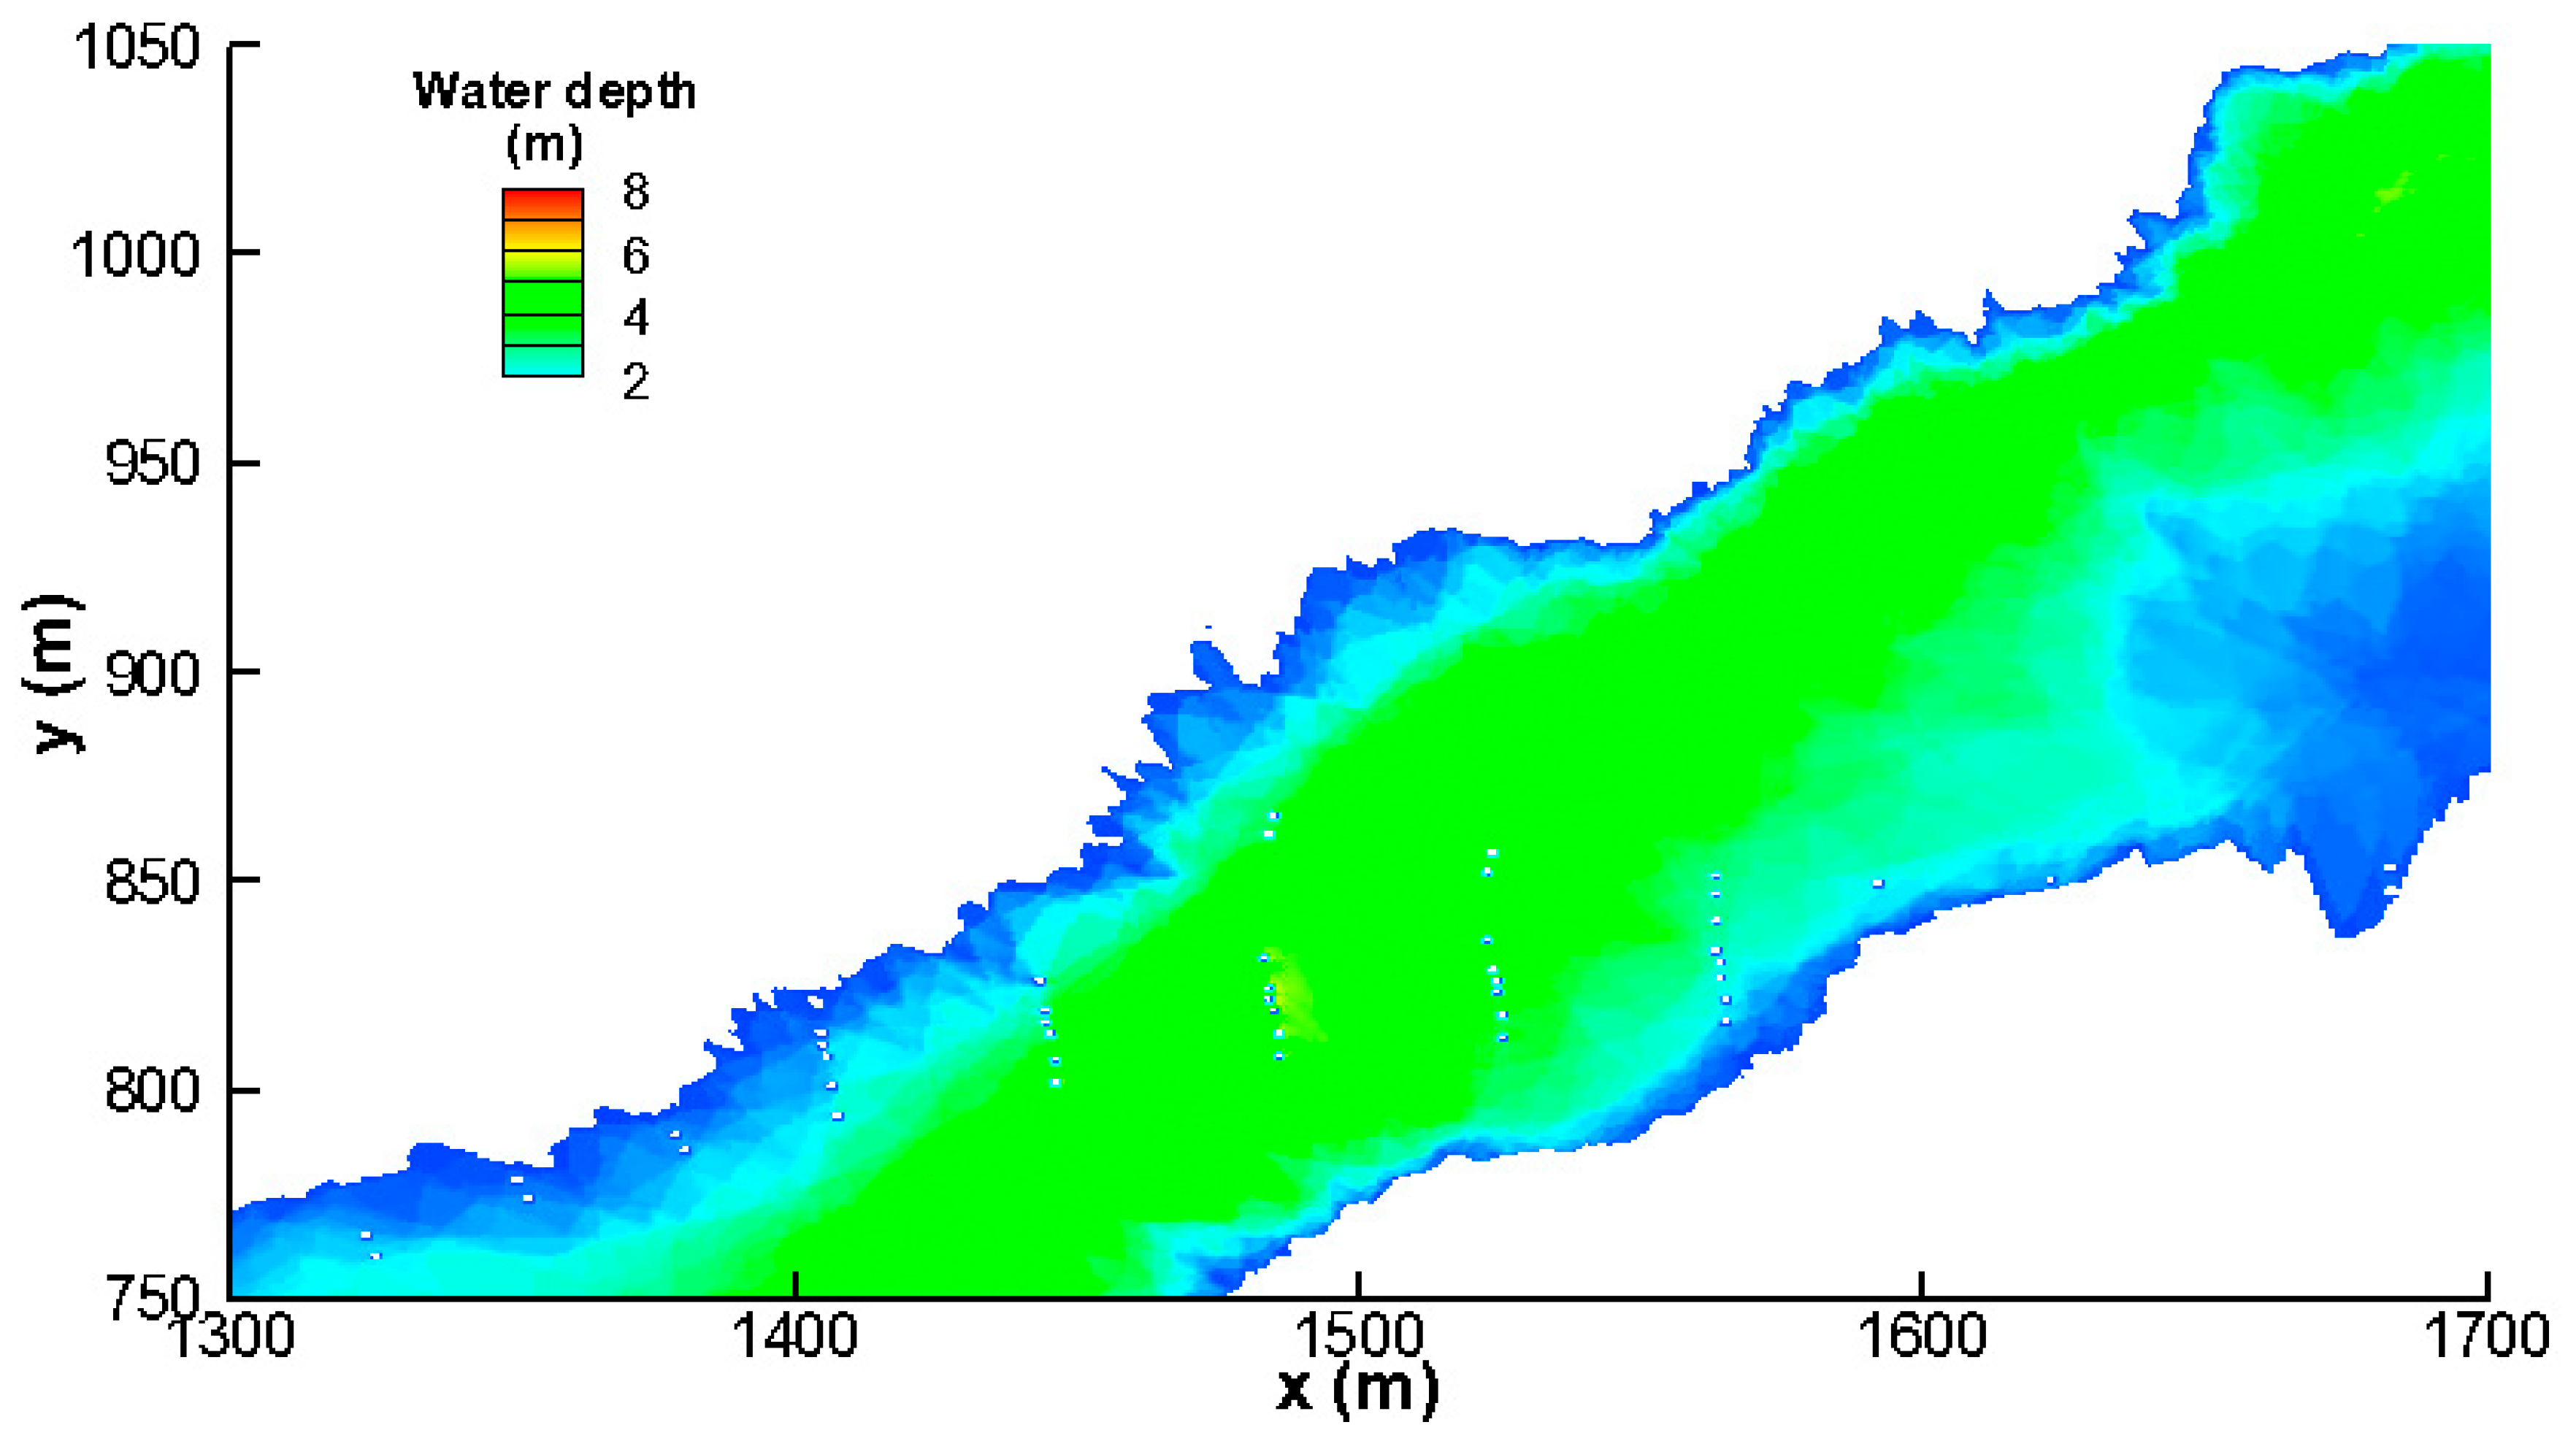
The differences in water levels with and without bridge piers under 10-year flood conditions were obtained by subtracting the water levels when there are no piers from the water levels when there are piers (Figure 6). Figure 6 shows that there were clear backwater effects due to the presence of bridge piers upstream of the Fengxian Bridge, and the maximum water level rise was about 1 m. Upstream of the three other bridges, slight differences (less than 0.5 m) were found. The backwater lengths of the four bridges were 160 m (Xizhuang Bridge), 270 m (Fengxian Bridge), 180 m (E Ramp Bridge), and 270 m (Jialing River Bridge) for a 10-year flood. The impact of the Fengxian Bridge on flooding was more serious than for the three other bridges. The results of statistical analysis showed that, under the conditions of a 10-year flood, 48 piers of the Fengxian Bridge were in the inundation area of the flood. The numbers of piers of the other three bridges in the flood inundation area were 28 (Jialing River Bridge), ten (E Ramp Bridge), and ten (Xizhuang Bridge). Figure 7 presents the distribution of computed water depth with piers near the Fengxian Bridge and the locations of the piers. This is the reason why the Fengxian Bridge had the greatest impact on flooding.
The results of the flood water level rise and the backwater length upstream of bridge piers are of great interest in the design of levees. The planned levees along the banks of this river reach have been designed for 10-year floods (Figure 6). Elevations at the top of the levees are determined by the designed flood levels, plus a 1 m freeboard. There must be proper accounting of the impact of bridge piers on the designed levees. Table 2 shows the comparisons between planned and computed levee elevations at cross-sections just upstream of the four bridges, where there is a maximum water level rise due to the presence of piers. It was observed that, near the four bridges, the top elevations of the planned levees are all less than the computed ones with piers. This means that the elevations of the planned levees have to be raised.
The differences in water levels in the river with and without bridges for the 100-year flood conditions, are presented in Figure 8. Significant water level rises, and a backwater phenomenon are observed upstream of the four bridges, especially at the Fengxian and the Jialing River bridges. The maximum water level rise was more than 2 m upstream of the Fengxian Bridge. Backwater lengths were increased up to 230 m (Xizhuang Bridge), 700 m (Fengxian Bridge), 290 m (E Ramp Bridge), and 600 m (Jiangling River Bridge) for the four bridges. Compared with the 10-year flood conditions, the increase in backwater length by bridge piers was limited, which is probably due to the meandering of this river. Similarly, statistical analysis showed that, under the conditions of a 100-year flood, the numbers of piers of the four bridges in the flood inundation area were 37 (Jialing River Bridge), 13 (E Ramp Bridge), 67 (Fengxian Bridge), and ten (Xizhuang Bridge). This explains why the impacts of water level rise are more serious near the Fengxian and Jialing River bridges. Furthermore, the impact on the transverse variations of the water level was computed at cross-sections just upstream of the Fengxian Bridge, which is 1090 m from the upstream boundary. The transverse water level slopes were 0.136% without bridges and 0.115% with bridges. This is negligible because the width of the cross-section is small (about 110 m).
In general, for both flood conditions, water level rise and backwater lengths due to the bridges were obvious, especially near the Fengxian and Jialing River bridges. These effects must be carefully taken into account when designing planned levees.
3.2. Effects on Flow Velocity Fields
Flow velocity fields during floods are also important because high velocity flow will cause the erosion of river beds and the destruction of banks and bridges. The velocity distribution and flow regime were analyzed under 10-year and 100-year flood conditions.
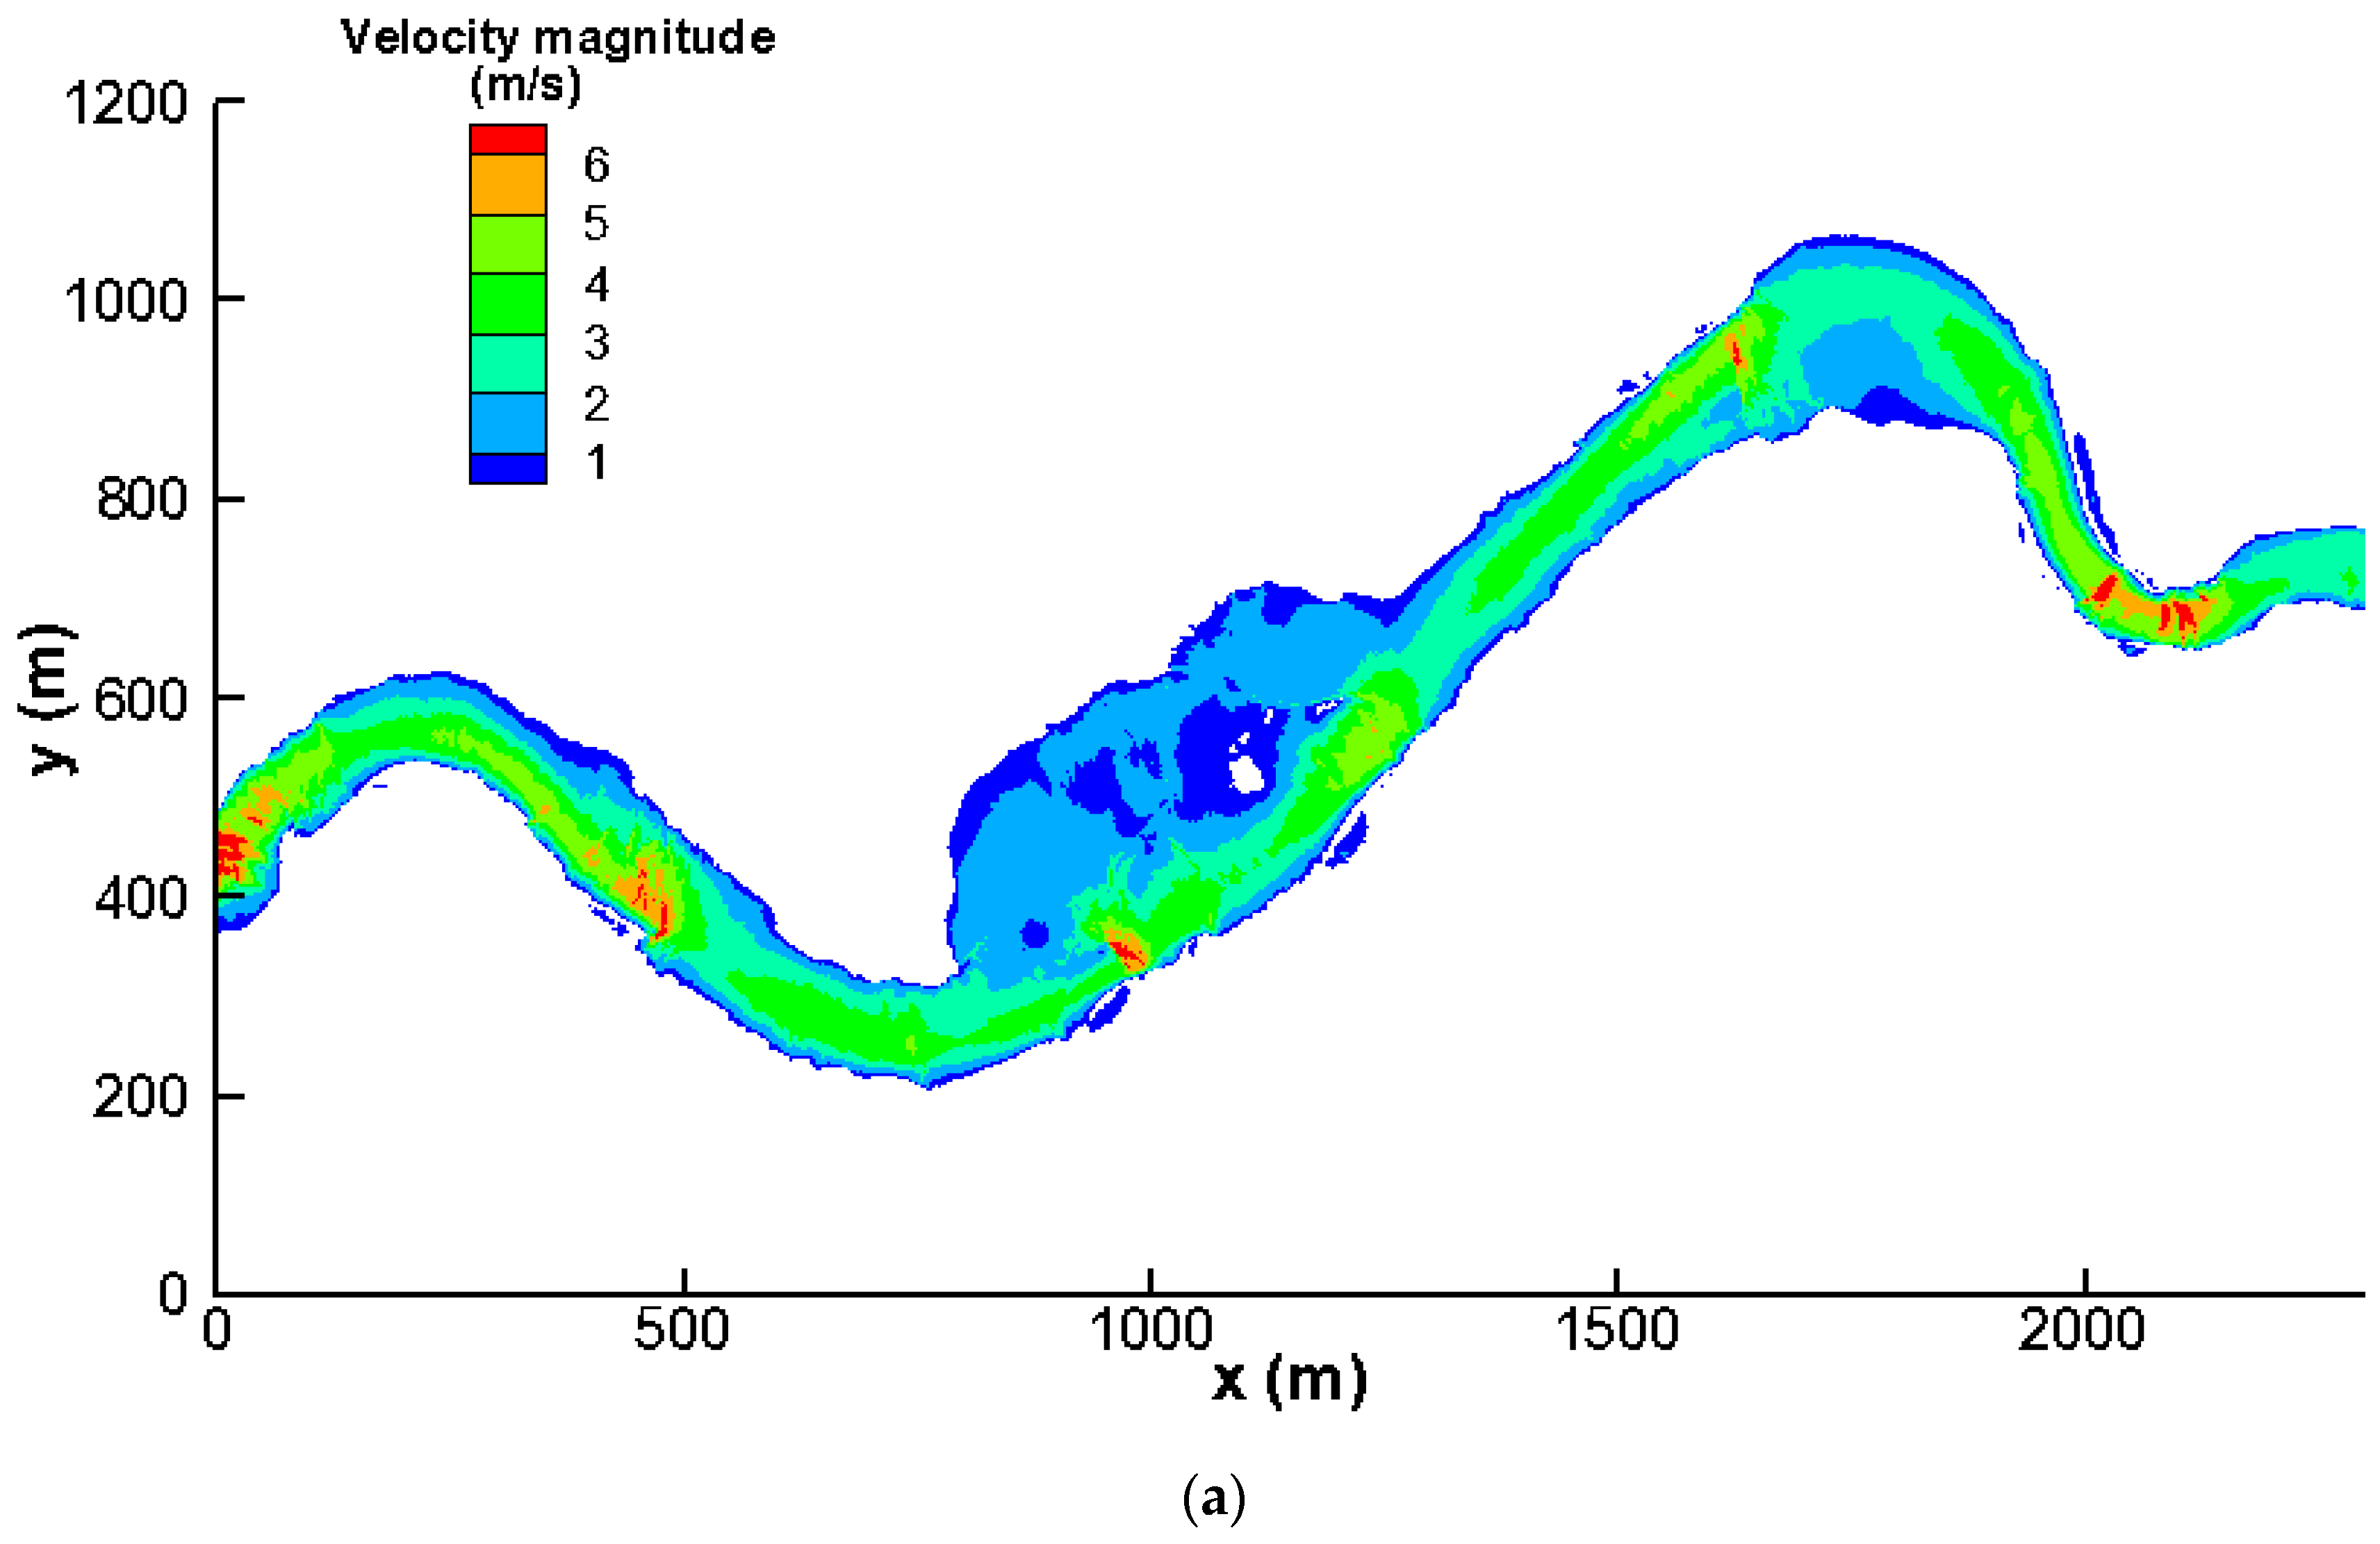
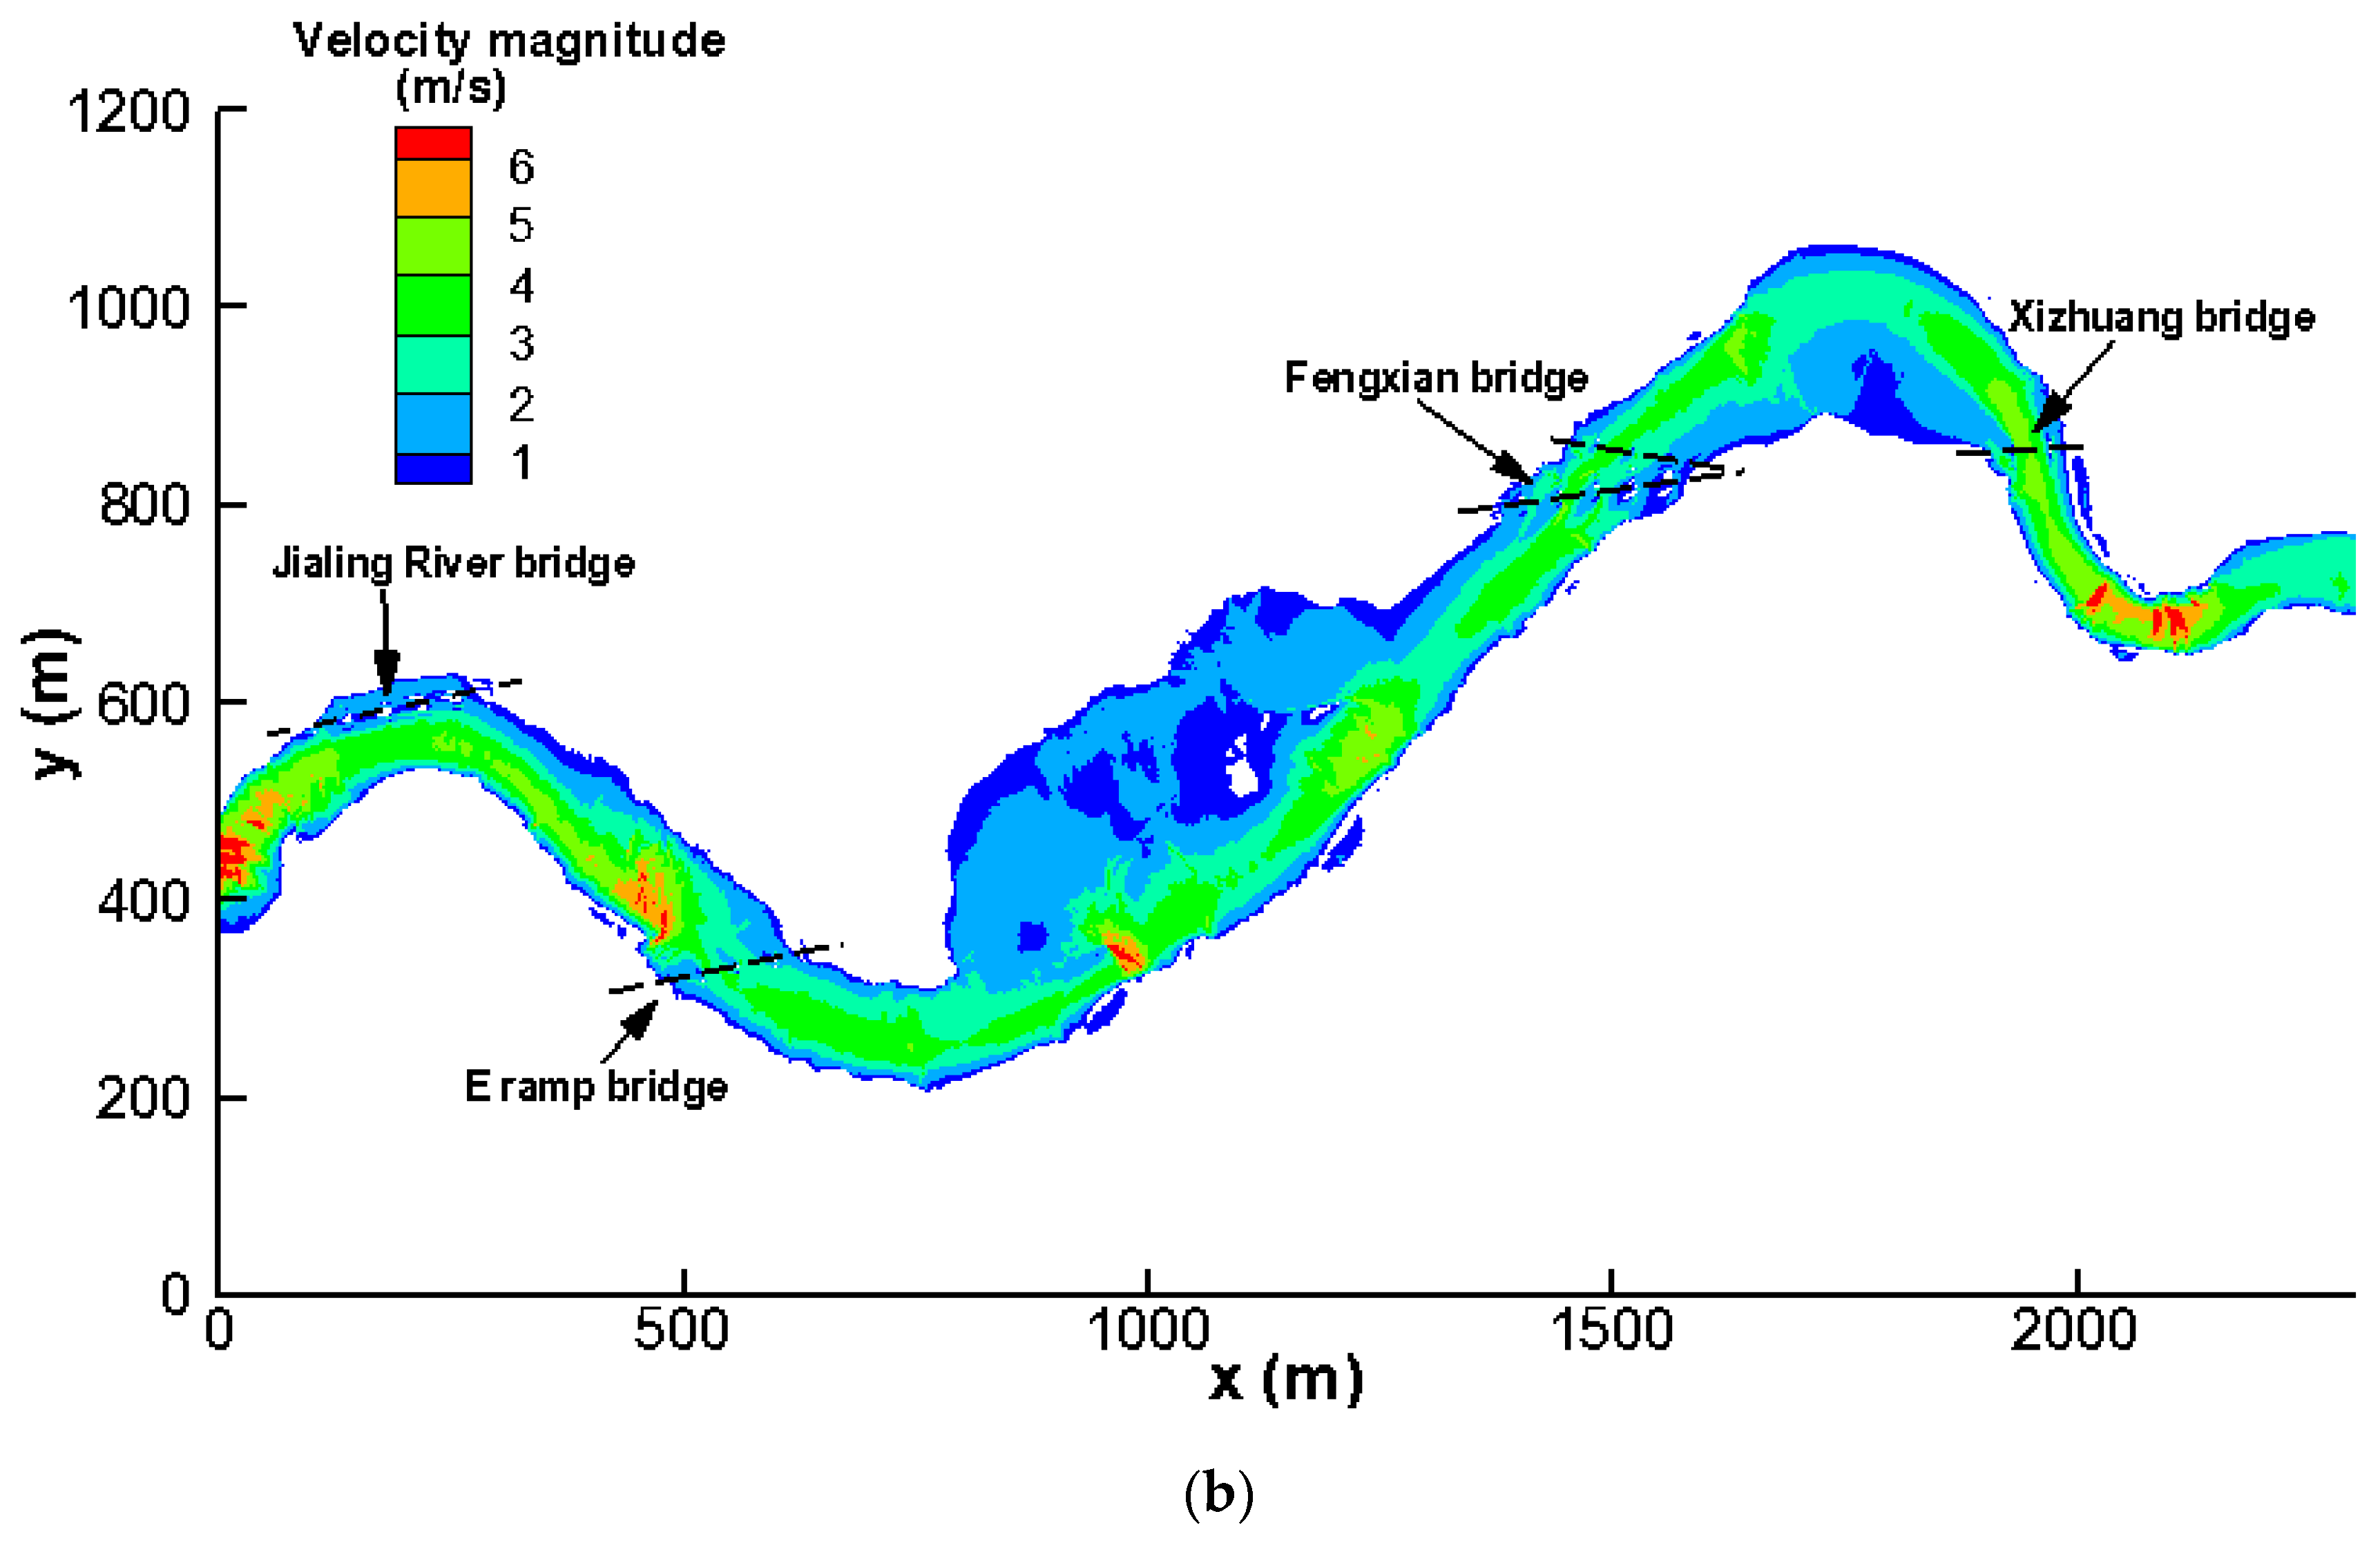
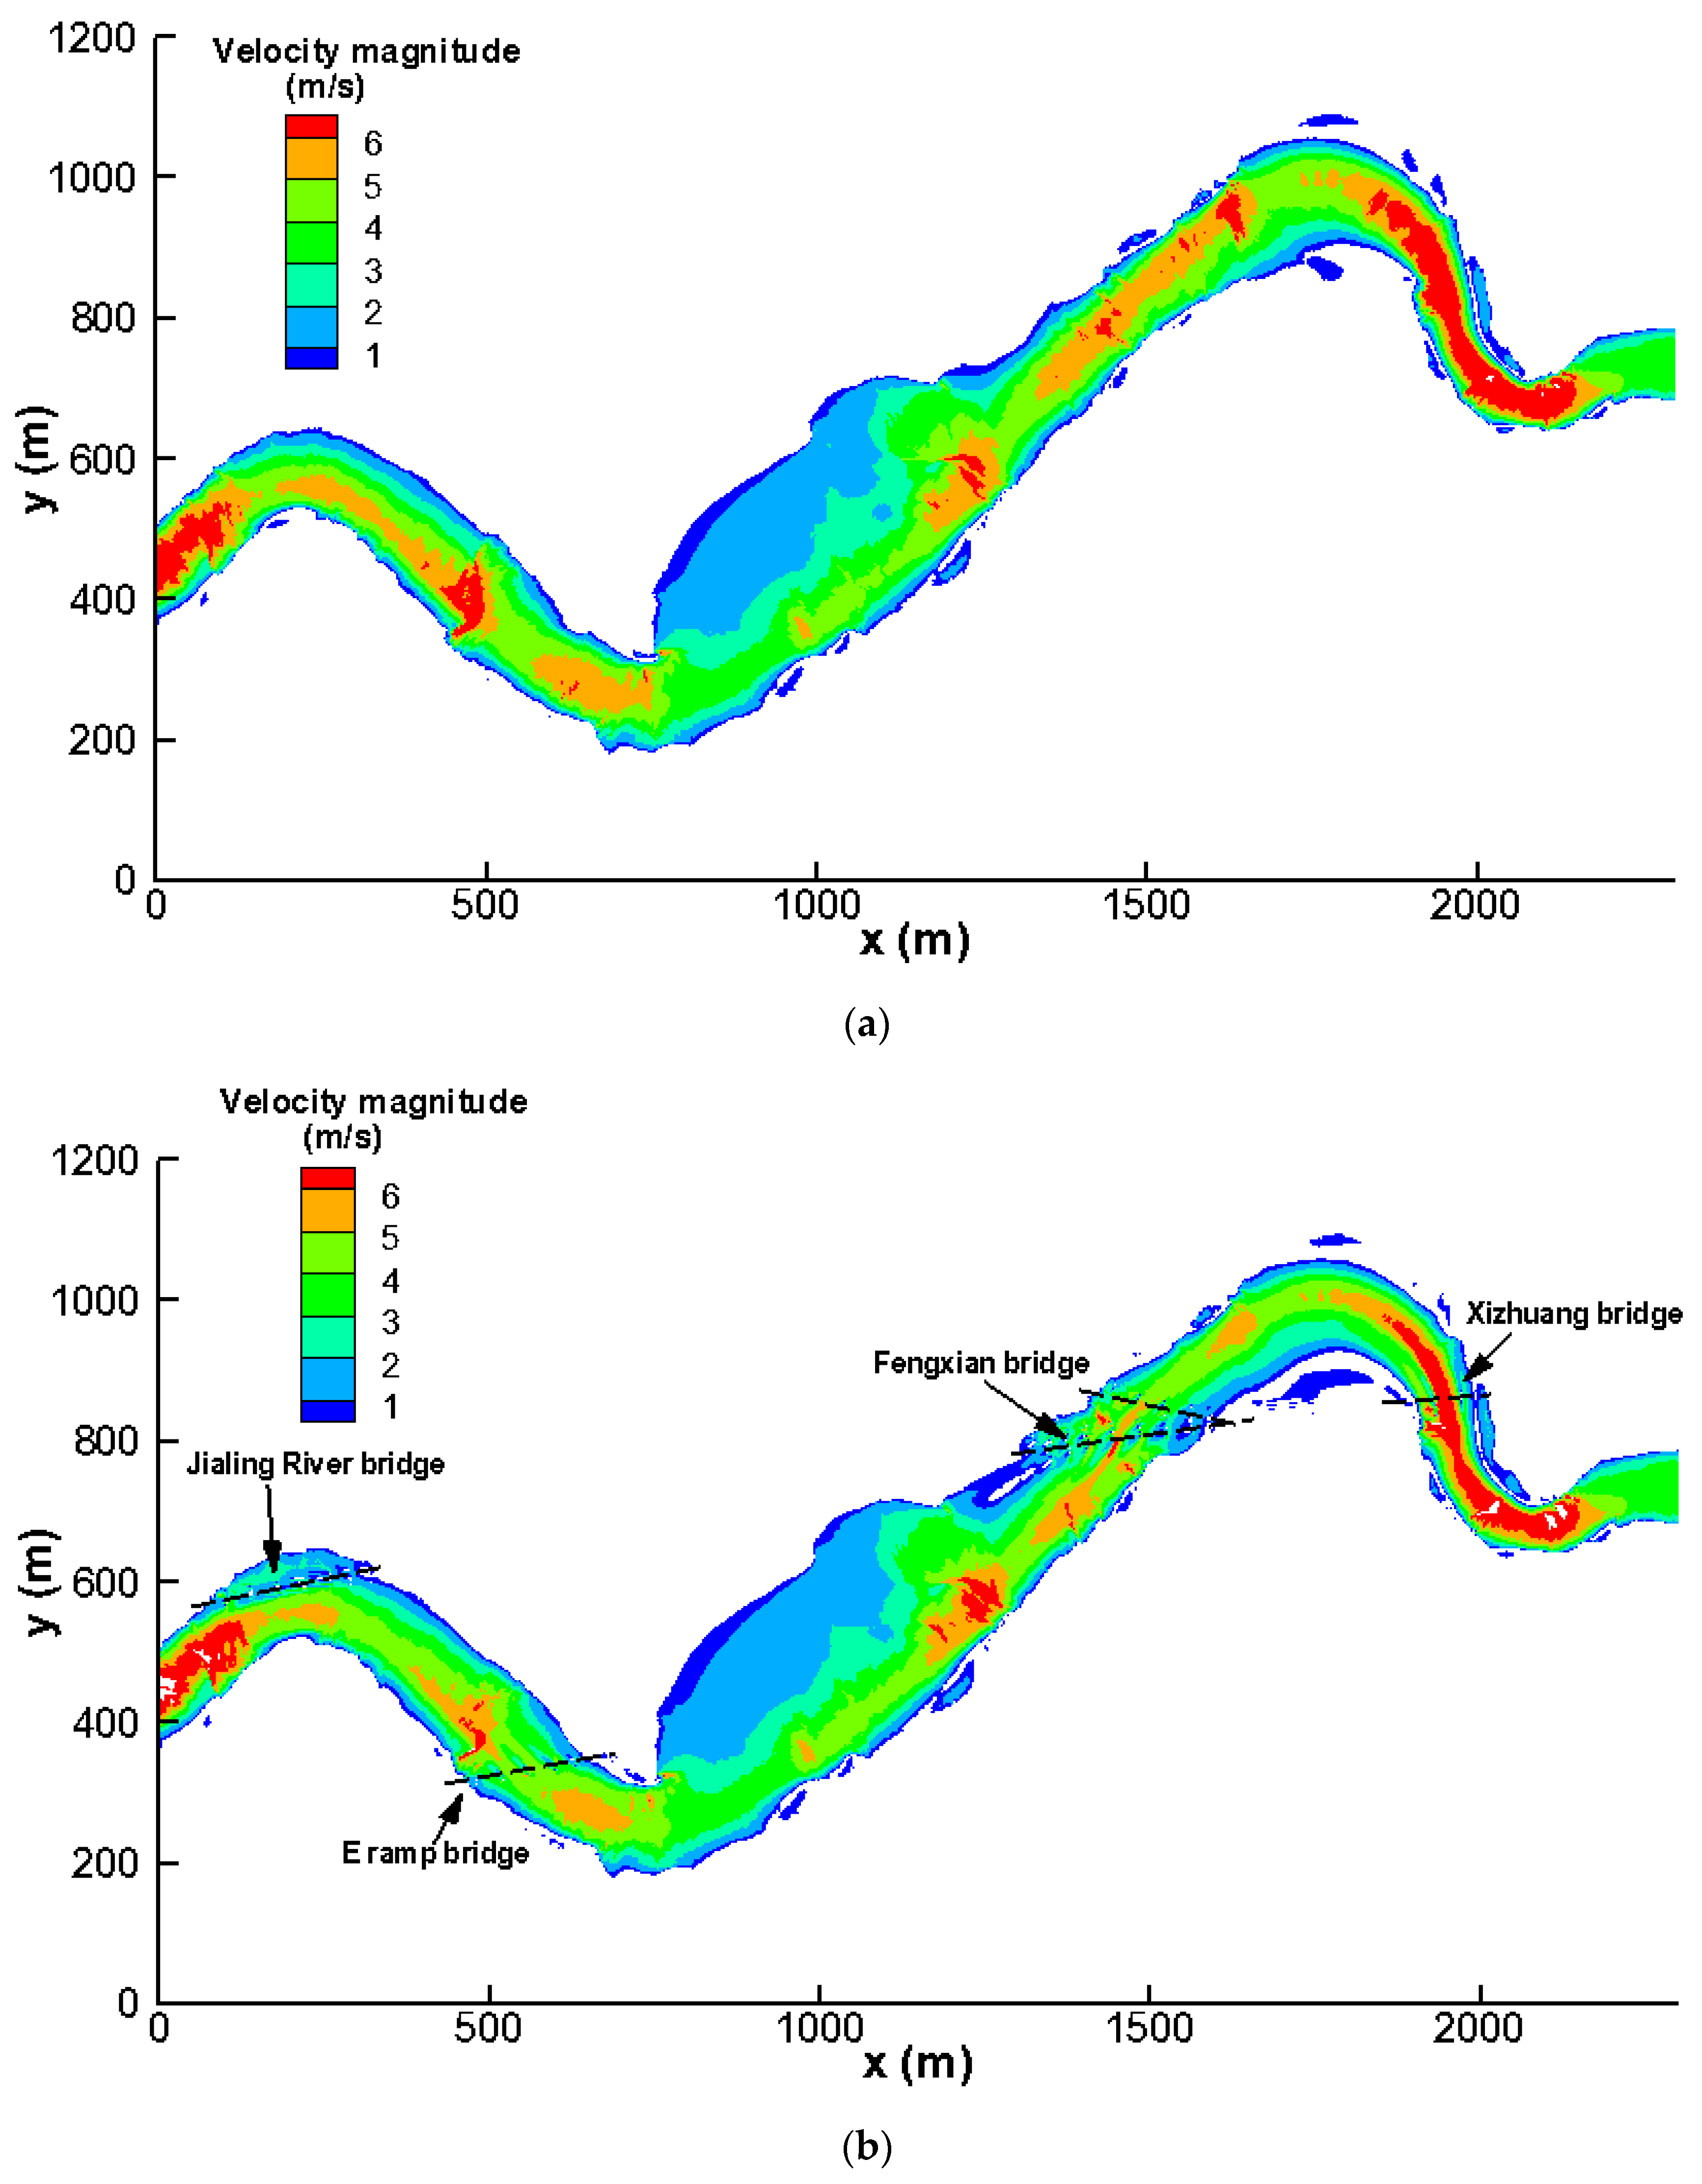
Figure 9 shows the velocity distributions with and without piers for 10-year flood conditions. Except in the vicinity of the Fengxian Bridge, the bridges have a minor impact on the maximum flow velocity distribution of the river. The maximum flow velocity for 10-year flood conditions was higher than 6 m/s. Upstream of the Fengxian Bridge, the maximum flow velocity during the flood was significantly reduced owing to the presence of the bridge piers.
Quantitative analysis indicated that the maximum flow velocities near the Jialing River Bridge were 5.81 and 5.93 m/s without and with piers, respectively, which is an increase of 2.07%. For the other three bridges, the maximum flow velocities were all reduced because of the presence of the bridges. For the E Ramp Bridge, the velocities were 6.91 and 6.86 m/s without and with bridges, respectively. For the Fengxian Bridge, the velocities were 6.45 and 4.99 m/s, respectively. For the Xizhuang Bridge, the velocities were 5.02 and 4.80 m/s, respectively. The ratios of the maximum velocity decrease were 0.81% for the E Ramp Bridge, 22.66% for the Fengxian Bridge, and 4.5% for the Xizhuang Bridge. From the layout of the Jialing River Bridge (Figure 9b), it is evident that the bridge is not across the river but on the outside of a river curve, which decreases the width of the cross-section. The flood flow was directed to the inside of the curvature, resulting in a slight increase in the maximum flow velocity. The other three bridges span the entire river channel, resulting in an increase in the water level of the river and a decrease in the maximum flow velocity. Generally, the impact of the E Ramp Bridge piers on flood velocity was the weakest and that of the Fengxian Bridge piers was the strongest. Near the Fengxian Bridge, the maximum flow velocity was reduced by 22.66%, which likely leads to sediment deposition in this section.
For 100-year flood conditions, a comparison of the flood velocity distributions without and with bridge piers is found in Figure 10. The maximum velocity distribution of the river was similar to that in 10-year flood conditions, but the flood velocity of the river increased with the increase in flood discharge, as expected. With bridge piers, the local velocity of the river was significantly reduced, especially upstream of the Fengxian Bridge. This was similar to the results from the 10-year flood conditions.
Quantitative analysis showed that the maximum flow velocities near the Jialing River Bridge still increased, and also that the decreases in the maximum velocities were induced near the other three bridges, similar to what occurred under the 10-year flood conditions. Near the Jialing River Bridge the maximum velocities were 7.77 and 8.39 m/s without and with piers, respectively, which represents an increase of 7.98%. The maximum velocities for the E Ramp Bridge were 8.40 and 8.07 m/s without and with piers, respectively. The maximum velocities for the Fengxian Bridge were 8.41 and 7.67 m/s, respectively. The maximum velocities for the Xizhuang Bridge were 8.77 and 8.83 m/s, respectively. The corresponding ratios of increase were −3.93% (E Ramp Bridge), −8.80% (Fengxian Bridge), and 0.68% (Xizhuang Bridge). Obvious influences on the flood velocity are caused by the Jialing River Bridge and the Fengxian Bridge because more piers were in the flood inundation area, as has been pointed out in the previous section. The increase in maximum flow velocity near the Jialing River Bridge induced the destruction of the bank and structures, but the decrease in the maximum flow velocity near the Fengxian Bridge also caused changes in the cross-sections after a long period.
4. Conclusions
To investigate the impact of four bridges on the flooding of the Jialing River in China, a 2D hydrodynamic model based on an unstructured mesh was developed, in which the TVD finite volume method was used to solve the 2D shallow water equations. The impacts of four bridges on flooding were analyzed by comparing results without and with bridge piers under the conditions of 10-year and 100-year floods. Backwater effects and flow velocity fields due to the presence of piers were analyzed in detail. The main conclusions are drawn as follows.
Sensitivity analysis showed that the maximum flood water level differences were 0.38 m for three different meshes and 0.36 m for the different Manning coefficients. The difference in the water level for validation was 0.45 m. This indicates that the numerical model developed in this study was acceptable because the differences were small and comparative.
For the backwater effects caused by bridge piers, under 10-year flood conditions, obvious water level rises were found upstream of the Fengxian Bridge; the maximum water level rise was about 1 m owing to the presence of this bridge. The extent of the maximum water level rise was much less for the other three bridges. For the planned levees near the bridges, the top elevations of the levees should be increased by 0.15–0.36 m. Under 100-year flood conditions, the water level rises were more significant upstream of the Fengxian and Jialing River bridges. The maximum value was higher than 2 m. The backwater lengths were also increased.
With respect to the effects on the flood flow field, it was found that the presence of the Jialing River Bridge caused the maximum flow velocity in its vicinity to increase, but the other three bridges could induce the maximum flow velocity in their vicinity to decrease. This was probably because the Jialing River Bridge is not across the river but on the outside of the river curvature. For both floods, significant effects of the Fengxian Bridge on the maximum flow velocity were obtained. These were increased by 22.66% and 8.80% for the 10-year and 100-year flood conditions, respectively. The effects caused by the Jialing River Bridge were less significant, with decreases of 2.07% and 7.98% for the 10-year and 100-year flood conditions, respectively. It is recommended that more emphasis should be placed on the protection measures near these two bridges.
The flow field structure near piers and the resulting sediment erosion are critical to the safety of bridges and are an issue of interest to engineers, and thus this subject deserves further study.
Author Contributions
W.W. and K.Z. collected topography and hydrological data; K.Z. and H.J. developed the numerical model and performed the simulation; W.W., J.Z., P.L., and Z.L. analyzed the results and drafted the manuscript; all authors contributed in reviewing and editing the manuscript.
Funding
This research was funded by the National Key R & D Program of China (2017YFC0504704; 41731289); the Scientific Research Program Funded by the National Natural Science Foundation of China (Grant Nos. 51609198; 11605136); the Natural Science Basic Research Plan in Shaanxi Province of China (Program No. 2017JQ5063); the Innovative Research Team of Institute of Water Resources and Hydro-electric Engineering, Xi’an University of Technology (2016ZZKT-14/104-451217015/104-451115004).
Acknowledgments
We thank Elaine Monaghan, BSc (Econ), from Liwen Bianji, Edanz Editing China (www.liwenbianji.cn/ac), for editing the English text of a draft of this manuscript.
Conflicts of Interest
The authors declare no conflict of interest.
References
- Luo, P.; Zhou, M.; Deng, H.; Lyu, J.; Cao, W.; Takara, K.; Nover, D.; Schladow, S.G. Impact of forest maintenance on water shortages: Hydrologic modeling and effects of climate change. Sci. Total Environ. 2018, 615, 1355–1363. [Google Scholar] [CrossRef] [PubMed]
- Davor, K.; Roger, A.F.; Michaela, B. Flood hazard assessment for extreme flood events. Nat. Hazards 2016, 84, 1569–1599. [Google Scholar] [Green Version]
- Beniston, M. Trends in joint quantiles of temperature and precipitation in Europe since 1901 and projected for 2100. Geophys. Res. Lett. 2009, 36. [Google Scholar] [CrossRef]
- Horritt, M.; Bates, P. Evaluation of 1D and 2D numerical models for predicting river flood inundation. J. Hydrol. 2002, 268, 87–99. [Google Scholar] [CrossRef]
- Merkuryeva, G.; Merkuryev, Y.; Sokolov, B.V.; Potryasaev, S.; Zelentsov, V.A.; Lektauers, A. Advanced river flood monitoring, modelling and forecasting. J. Comput. Sci. 2015, 10, 77–85. [Google Scholar] [CrossRef]
- Teng, J.; Jakeman, A.J.; Vaze, J.; Croke, B.F.; Dutta, D.; Kim, S. Flood inundation modelling: A review of methods, recent advances and uncertainty analysis. Environ. Model. Softw. 2017, 90, 201–216. [Google Scholar] [CrossRef]
- Kossi, K.; Jeffrey, N.; Mark, A.T.; Bernd, D. Modelling of flood hazard extent in data sparse areas: A case study of the Oti River basin, West Africa. J. Hydrol. Reg. Stud. 2017, 10, 122–132. [Google Scholar]
- Hou, J.; Wang, T.; Li, P.; Li, Z.; Zhang, X.; Zhao, J.; Hinkelmann, R. An implicit friction source term treatment for overland flow simulation using shallow water flow model. J. Hydrol. 2018, 564, 357–366. [Google Scholar] [CrossRef]
- Xia, X.L.; Liang, Q.H.; Ming, X.D.; Hou, J.M. An efficient and stable hydrodynamic model with novel source term discretization schemes for overland flow and flood simulations. Water Resour. Res. 2017, 53, 3730–3759. [Google Scholar] [CrossRef]
- Liu, Q.; Qin, Y.; Li, G.D. Fast simulation of large-scale floods based on GPU parallel computing. Water 2018, 10, 589. [Google Scholar] [CrossRef]
- Lee, E.; Kim, J.; Choo, Y.; Jo, D. Application of flood nomograph for flood forecasting in urban areas. Water 2018, 10, 53. [Google Scholar] [CrossRef]
- Tomasz, D.; Joanna, W.; Mariusz, S. Assessment of the impact of new investments on flood hazard-study case: the bridge on the Warta River near Wronki. Water 2015, 7, 5752–5767. [Google Scholar]
- Costabile, P.; Macchione, F. Enhancing river model set-up for 2-D dynamic flood modelling. Environ. Model. Softw. 2015, 67, 89–107. [Google Scholar] [CrossRef]
- Biglari, B.; Sturm, T.W. Numerical modeling of flow around bridge abutments in compound channel. J. Hydraul. Eng. 1998, 124, 156–164. [Google Scholar] [CrossRef]
- Hoa, L.T.; Shigeko, H.; Nhan, N.H.; Cong, T.T. Infrastructure effects on floods in the Mekong River Delta in Vietnam. Hydrol. Process. 2008, 22, 1359–1372. [Google Scholar] [CrossRef]
- Siregar, R.I. Hydraulic modeling of flow impact on bridge structures: A case study on Citarum bridge. IOP Conf. Ser. Mater. Sci. Eng. 2018, 309, 012015. [Google Scholar] [CrossRef]
- Petaccia, G.; Natale, E. ORSADEM: A one-dimensional shallow water code for flood inundation modelling. Irrig. Drain. 2013, 62, 29–40. [Google Scholar] [CrossRef]
- Costabile, P.; Macchione, F.; Natale, L.; Petaccia, G. Flood mapping using LIDAR DEM Limitations of the 1-D modeling highlighted by the 2-D approach. Nat. Hazards 2015, 77, 181–204. [Google Scholar] [CrossRef]
- Costabile, P.; Macchione, F.; Natale, L.; Petaccia, G.; Schleiss, A.J.; De Cesare, G.; Franca, M.J.; Pfister, M. Representing skewed bridge crossing on 1-D and 2D flood propagation models: Compared analysis in practical studies. In Proceedings of the 7th International Conference on Fluvial Hydraulics (River Flow), Lausanne, Switzerland, 3–5 September 2014. [Google Scholar]
- Gallegos, H.A.; Schubert, J.E.; Sanders, B.F. Two-dimensional, high-resolution modeling of urban dam-break flooding: A case study of Baldwin Hills, California. Adv. Water Resour. 2009, 32, 1323–1335. [Google Scholar] [CrossRef]
- Luo, P.; Mu, D.; Xue, H.; Thanh, N.; Kha, D.; Kaoru, T.; Daniel, N.; Groffrey, S. Flood inundation assessment for the Hanoi Central Area, Vietnam under historical and extreme rainfall conditions. Sci. Rep. 2018, 8, 12623. [Google Scholar] [CrossRef]
- Liang, Q.H.; Smith, L.S. A high-performance integrated hydrodynamic modelling system for urban flood simulations. J. Hydroinform. 2015, 17, 518–533. [Google Scholar] [CrossRef]
- Meesuk, V.; Vojinovic, Z.; Mynett, A.E.; Abdullah, A.F. Urban flood modelling combining top-view LiDAR data with ground-view SfM observations. Adv. Water Resour. 2015, 75, 105–117. [Google Scholar] [CrossRef]
- Noh, S.J.; Lee, J.H.; Lee, S.; Kawaike, K.; Seo, D.J. Hyper-resolution 1D-2D urban flood modelling using LiDAR data and hybrid parallelization. Environ. Model. Softw. 2018, 103, 131–145. [Google Scholar] [CrossRef]
- Hou, J.M.; Liang, Q.H.; Zhang, H.B.; Hinkelmann, R. An efficient unstructured MUSCL scheme for solving the 2D shallow water equations. Environ. Model. Softw. 2015, 66, 131–152. [Google Scholar] [CrossRef] [Green Version]
- Costabile, P.; Macchione, F.; Natale, L.; Petaccia, G. Comparison of scenarios with and without bridges and analysis of backwater effect in 1-D and 2-D river flood modeling. Comput. Model. Eng. Sci. 2015, 109, 181–204. [Google Scholar]
- Geng, Y.; Wang, Z.L. Two-dimensional unstructured finite volume model for bridge pier flow. Hydro-Sci. Eng. 2008, 4, 015. [Google Scholar]
- Jiang, Y.X.; Wen, C. Application of 2D flow mathematical model in flood control evaluation of Tongjiang River Bridge. J. Water Resour. Archit. Eng. 2012, 6, 028. (In Chinese) [Google Scholar]
- Luo, P.; He, B.; Takara, K.; Xiong, Y.; Nover, D.; Duan, W.; Fukushi, K. Historical assessment of Chinese and Japanese flood management policies and implications for managing future floods. Environ. Sci. Policy 2015, 48, 265–277. [Google Scholar] [Green Version]
- Li, T.S. Study on the Historic Flood in Jialing River Basin. J. Catastrophol. 2005, 20, 113–115. (In Chinese) [Google Scholar]
- Danish Hydraulic Institute. MIKE 21& MIKE 3 Flow Model FM Hydrodynamic and Transport Module: Scientific Documentation; Danish Hydraulic Institute: Hørsholm, Denmark, 2012. [Google Scholar]
- Zhang, B.; Ai, N.S.; Huang, Z.W.; Yi, C.B.; Qin, F.C. Meanders of the Jialing River in China: morphology and formation. Chin. Sci. Bull. 2008, 53, 267–281. [Google Scholar] [CrossRef]
Figure 1.
Location of project section of the Jialing River, China.

Figure 2.
Simulation mesh near Fengxian Bridge (circles denote bridge piers).

Figure 3.
Topography of the study area (x and y are local coordinates).

Figure 4.
Comparison of the water levels for different meshes.

Figure 5.
Comparison of the water levels for different values of the Manning coefficient, n.

Figure 6.
Differences in water levels with and without bridge piers for 10-year flood conditions.

Figure 7.
Distribution of water depth near the Fengxian Bridge for 10-year flood conditions (circles denote bridge piers).
Figure 7.
Distribution of water depth near the Fengxian Bridge for 10-year flood conditions (circles denote bridge piers).

Figure 8.
Differences in water levels with and without bridge piers for 100-year flood conditions.

Figure 9.
Distributions of the computed velocity magnitude for 10-year flood conditions. (a) Results without bridge piers, and (b) results with bridge piers.
Figure 9.
Distributions of the computed velocity magnitude for 10-year flood conditions. (a) Results without bridge piers, and (b) results with bridge piers.


Figure 10.
Distributions of the computed velocity magnitude for 100-year flood conditions. (a) Results without bridge piers, and (b) results with bridge piers.
Figure 10.
Distributions of the computed velocity magnitude for 100-year flood conditions. (a) Results without bridge piers, and (b) results with bridge piers.


Table 1.
Setup for the three sets of meshes.
| Mesh | Number of Elements | Smallest Allowable Angle | Maximum Element Area (m3) |
|---|---|---|---|
| 1 | 14,412 | 29° | 200 |
| 2 | 33,865 | 29° | 80 |
| 3 | 41,524 | 29° | 50 |
Table 2.
Comparisons of levee heights just upstream of the four bridges.
| Location | Distance to the Upstream Boundary (m) | Designed Elevations at the Top of Levees (m) | Computed (with Piers) Elevations at the Top of Levees (m) | Differences (m) |
|---|---|---|---|---|
| Xizhuang Bridge | 631 | 978.83 | 978.98 | −0.15 |
| Fengxian Bridge | 1220 | 976.64 | 976.97 | −0.33 |
| E Ramp Bridge | 2400 | 973.24 | 973.6 | −0.36 |
| Jialing River Bridge | 2856 | 971.03 | 971.38 | −0.35 |
© 2019 by the authors. Licensee MDPI, Basel, Switzerland. This article is an open access article distributed under the terms and conditions of the Creative Commons Attribution (CC BY) license (http://creativecommons.org/licenses/by/4.0/).
Share and Cite
MDPI and ACS Style
Wang, W.; Zhou, K.; Jing, H.; Zuo, J.; Li, P.; Li, Z. Effects of Bridge Piers on Flood Hazards: A Case Study on the Jialing River in China. Water 2019, 11, 1181. https://doi.org/10.3390/w11061181
AMA Style
Wang W, Zhou K, Jing H, Zuo J, Li P, Li Z. Effects of Bridge Piers on Flood Hazards: A Case Study on the Jialing River in China. Water. 2019; 11(6):1181. https://doi.org/10.3390/w11061181
Chicago/Turabian StyleWang, Wen, Kaibo Zhou, Haixiao Jing, Juanli Zuo, Peng Li, and Zhanbin Li. 2019. "Effects of Bridge Piers on Flood Hazards: A Case Study on the Jialing River in China" Water 11, no. 6: 1181. https://doi.org/10.3390/w11061181
Note that from the first issue of 2016, this journal uses article numbers instead of page numbers. See further details here.