A New Scenario-Based Framework for Conflict Resolution in Water Allocation in Transboundary Watersheds
by
 ,
,
Angela Gorgoglione
1,* ,
,
Magdalena Crisci
1,
Rafael H. Kayser
2,
Christian Chreties
1 and
Walter Collischonn
2 1
Department of Fluid Mechanics and Environmental Engineering (IMFIA), School of Engineering, Universidad de la República, Montevideo 11300, Uruguay
2
Institute of Hydraulic Research (IPH), Universidade Federal do Rio Grande do Sul (UFRGS), Porto Alegre 91501-970, Brazil
*
Author to whom correspondence should be addressed.
Water 2019, 11(6), 1174; https://doi.org/10.3390/w11061174
Submission received: 12 April 2019
/
Revised: 22 May 2019
/
Accepted: 4 June 2019
/
Published: 5 June 2019
(This article belongs to the Special Issue Integrated Water Resource System Modeling to Support Sustainable Water Management)
Abstract
:One of the main causes of water conflicts in transboundary watersheds all over the world is represented by the increasing water demand due to urban, industrial, and agricultural development. In this context, water scarcity plays a critical role since, during a drought period, water supply is not sufficient to cover the demand of all water uses. In this work, we have conceptualized and developed a new scenario-based framework able to improve the sustainability and equity of water allocation among two or more riparian countries. The proposed approach is in accordance with the United Nations Watercourses Convention. It considers a hydraulic/hydrologic model, a water-management model, and combines them with multi-criteria decision analysis (MCDA) and what if scenario analysis (WISA). The suggested framework was applied to the transboundary watershed of Cuareim/Quaraí river (Uruguay/Brazil) to tackle a real water-sharing conflict. It resulted in being very flexible in exploring various policy options and test and quantifying them with different scenarios to reach an objective and impartial decision in a water-sharing issue. This framework can effectively be applied to any other transboundary watershed to resolve any possible conflict related to water-allocation/water-management matter.
1. Introduction
Shared environmental resources can represent a source of cooperation or conflict among sharing countries. Transboundary rivers belong to these shared environmental resources [1]. Cooperation over shared water resources is essential for regional stability and economic growth. It can open new opportunities for riparian countries to sustainably develop their common water resources and assist decision makers and practitioners in reducing conflict and increase economic development [2]. Therefore, an equitable and reasonable sharing of these surface waters among riparian countries plays a crucial role in facilitating cooperation between those nations.
In the last decade, the problem represented by water scarcity is having a significant negative impact on a large part of the world’s population [3,4]. In particular, water demand increases due to the continuous population growth, industrial development, and intensive agricultural production. This, along with the impacts of climate change in the last years, represent two of the main factors responsible for water scarcity in most of the border crossing river catchments [2,5]. Clearly, when water resources are not enough to meet the water demand, it is difficult to allocate water resources in transboundary river basins. This leads to inevitable water-resource conflicts between the various administrative regions. The crucial problem of the international water-availability conflict is the lack of internationally-accepted allocation mechanisms for sharing water resources [6,7]. Concerning the allocation of internationally shared water resources, the central normative principle is the principle of equitable and reasonable utilization, which does not necessarily mean equal sharing of resources [8,9,10]. Several international conventions and rules have been adopted mentioning this principle; most notably the United Nations (UN) Convention on the “Law of the Non-Navigational Uses of International Watercourses” from 1997 [11]. According to the Article 6 of UN Watercourses Convention, utilization of an international watercourse in an equitable and reasonable manner requires considering all relevant factors and circumstances, including (a) geographic, hydrographic, hydrological, climatic, ecological and other factors of a natural character; (b) the social and economic needs of the watercourse states concerned; (c) the population dependent on the watercourse in each watercourse state; (d) the effects of the use or uses of the watercourses in one watercourse state on other watercourse States; (e) existing and potential uses of the watercourse; (f) conservation, protection, development and economy of use of the water resources of the watercourse and the costs of measures taken to that effect; (g) the availability of alternatives, of comparable value, to a particular planned or existing use.
Equity is usually seen as the key to international water resources allocation [6,12]. Despite several studies, there has not been a universal consensus on the meaning of equitable and reasonable utilization yet. Salman [13] highlighted that the management of transboundary river watersheds remains the most critical problem that has not been regulated by a global treaty yet. Numerical methods may be useful for defining the meaning of equitable and reasonable in specific cases. Zaag et al. [12] developed some analytical methods to re-allocate blue and green water resources based on equal division only, catchment area only, or basin population only, and applied these to the Orange, Nile, and Incomati rivers. However, very few factors mentioned in the UN Watercourse Convention were taken into account, increasing, therefore, the probability of non-acceptance from decision makers. Ahmadi et al. [14] developed a genetic algorithm-based multi-objective model for water allocation in the Aharchay watershed (Iran). The model provided recommended water quantity and quality for different sectors while maximizing agricultural production in the upstream area, mitigating the unemployment impacts of land use changes (social factor), and providing reliable water supply to the downstream area. In this work, the water quality was considered rather than the satisfaction of environmental water requirements. Anghileri et al. [15] developed a multi-criteria optimization model for conflict resolution between the hydropower production and the agricultural sector in the Alpine watershed (Italy). The objective functions of the model aimed to maximize hydropower production and minimize the shortage of irrigation demand. In this study, satisfying the environmental water supply was a substantial limitation, while the model allocated water to these competing sectors without taking into account the economic factor. It is clear that no universally-accepted numerical-methods that consider all the relevant factors and circumstances mentioned in Article 6 of the UN Watercourses Convention [11], including environmental, social, and economic aspects, are currently available. Based on these considerations, this work presents a universally-accepted scenario-based framework to support decision-makers in resolving any possible conflict related to water allocation in a transboundary watershed. This approach takes into account the UN Watercourses Convention [11] as essential factors for water allocation and it guarantees a “fair distribution” of water resources. In other words, it ensures equal access for the riparian countries to an adequate quantity of water necessary to sustain social needs (social equity) and maximize the economic need (economic efficiency), taking into account the environmental flow needed to preserve the environment (environmental sustainability). This framework was applied to the transboundary Cuareim/Quaraí watershed.
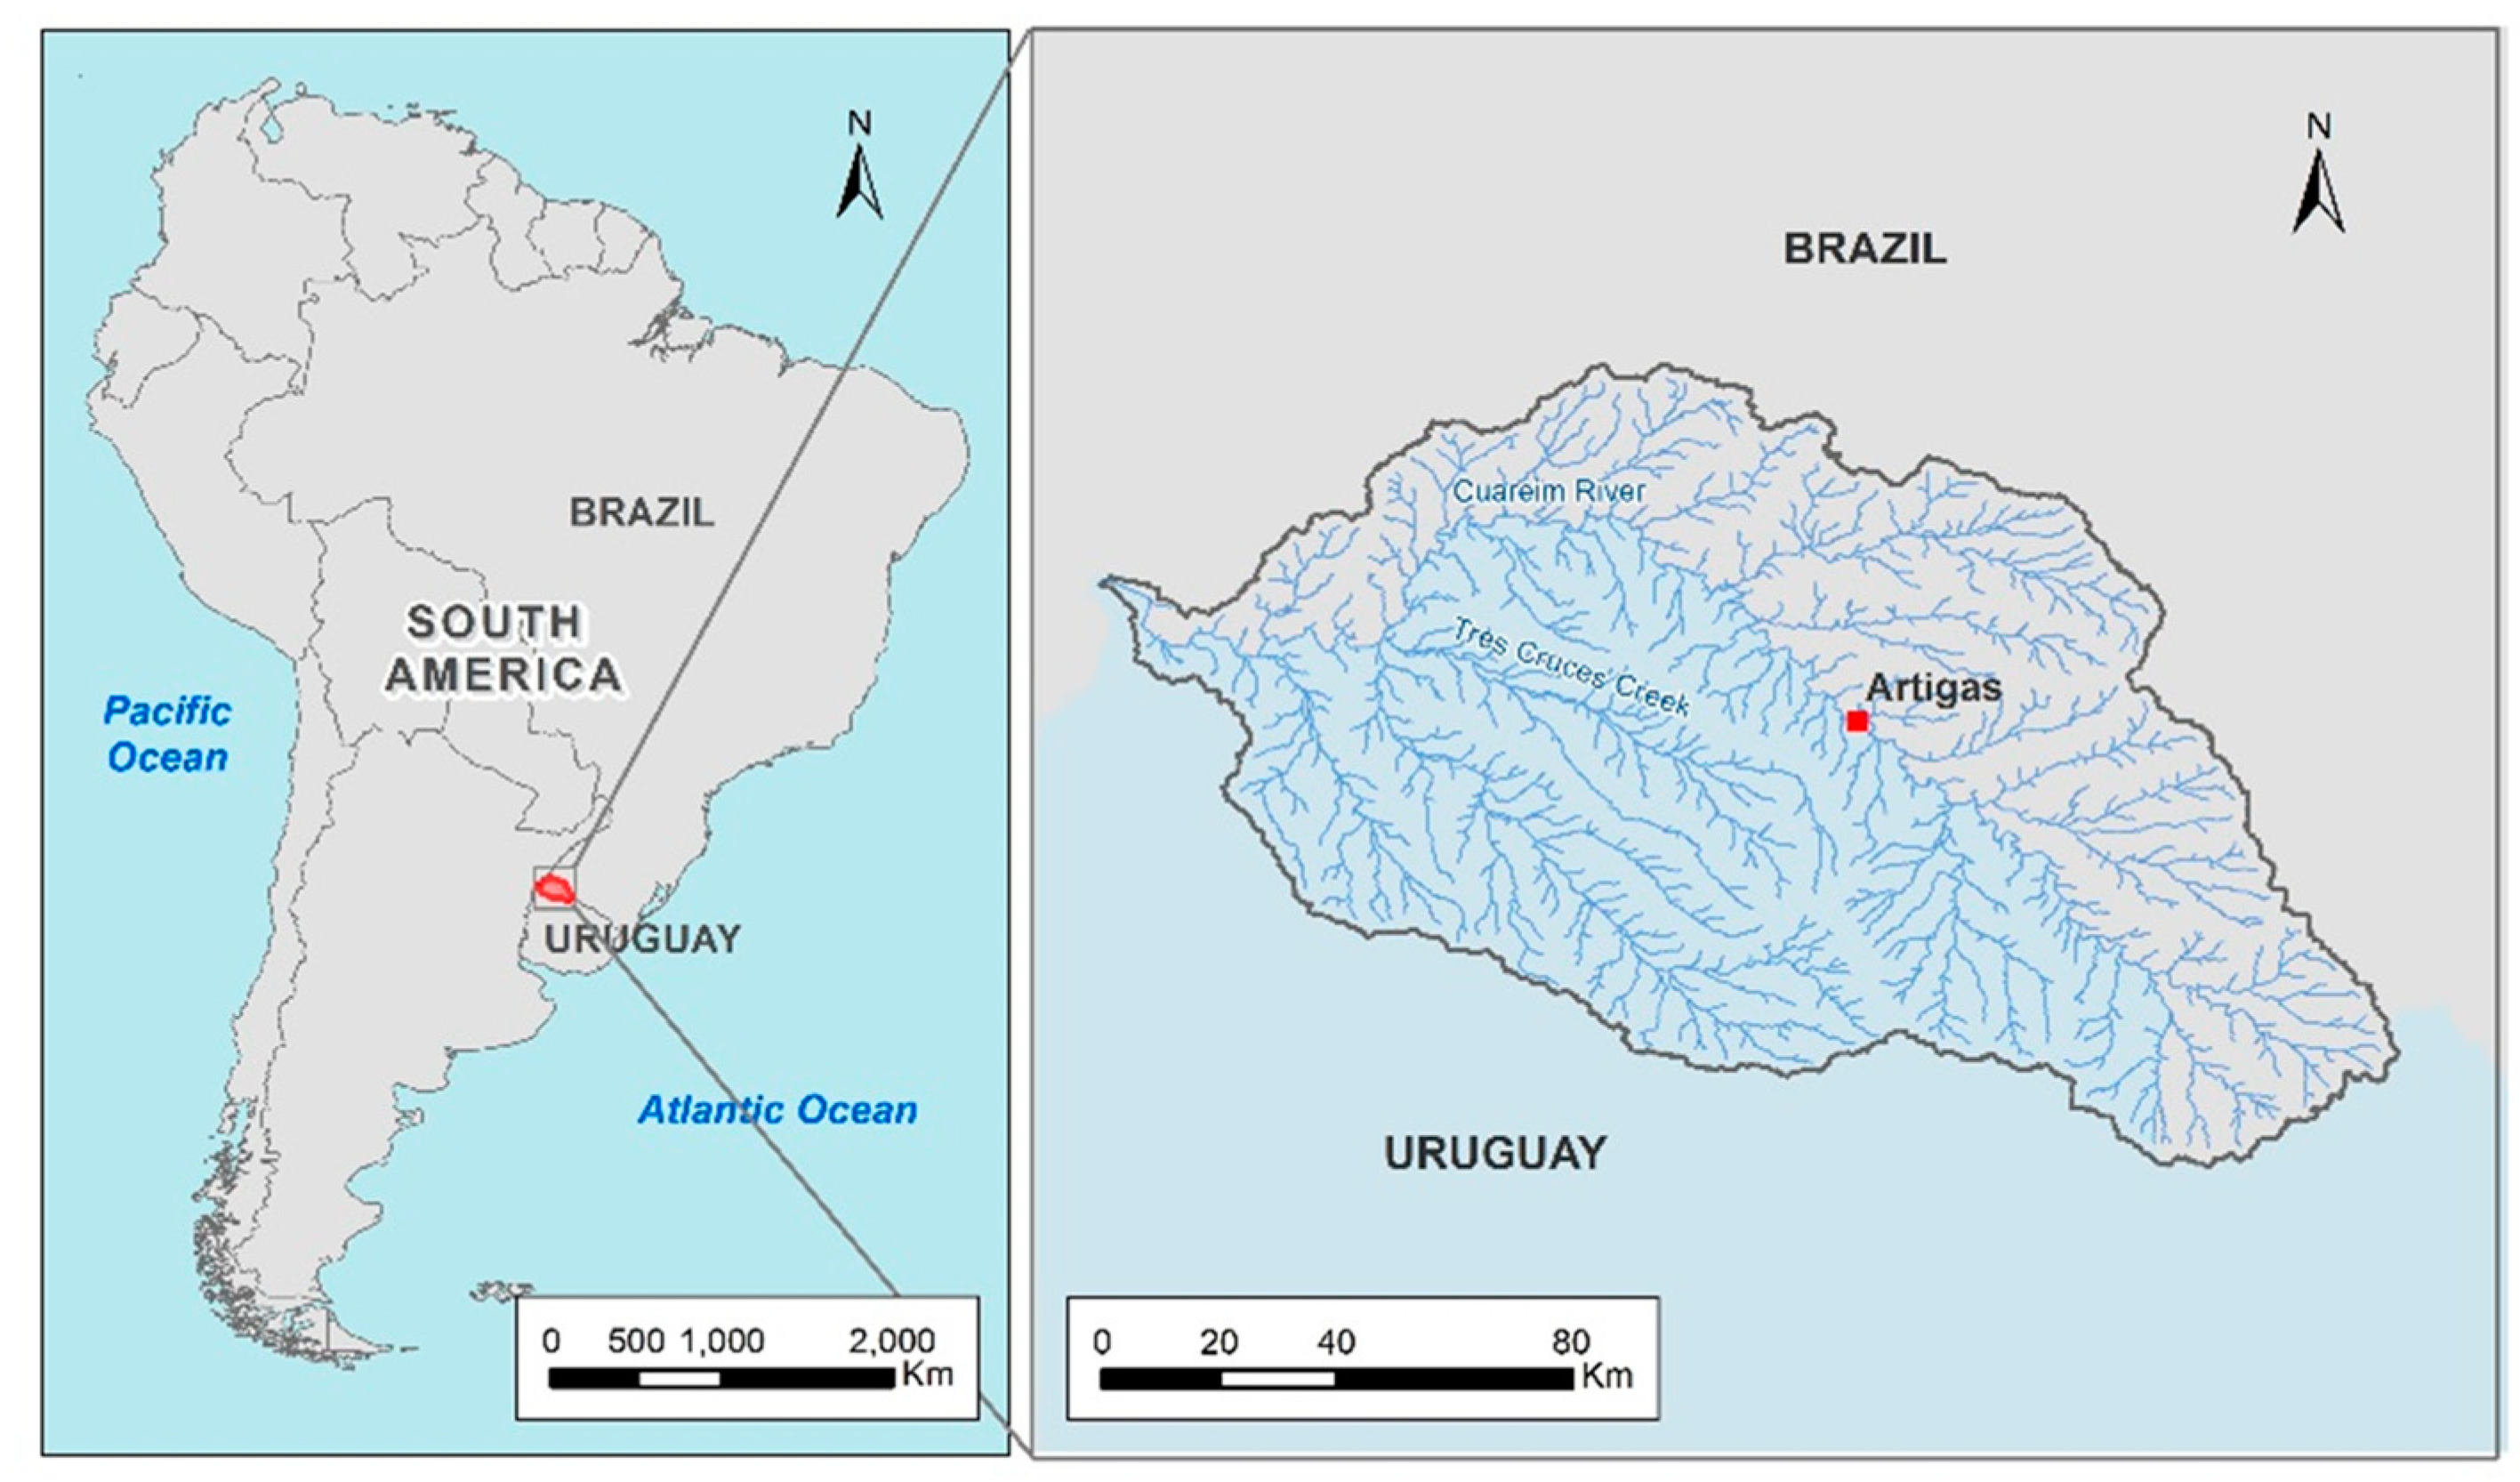
This is a transboundary watershed located on the north-eastern border of Uruguay and the south-western border of Brazil. The Cuareim/Quaraí river (Cuareim in Spanish, Quaraí in Portuguese) represents not only the geographical border but also one of the primary water sources for agriculture practices for these two riparian countries. In this area, drought periods are usually one of the main causes of conflict, due to the lack of a regional regulation or local agreement on the use of this shared water resource. In the context of the bi-national meeting that took place in Montevideo (Uruguay) on 22 February 2016, a water-sharing conflict emerged [16]. The issue referred to the decrease in the water volume for irrigation by Brazilian farmers downstream, due to the increase of the irrigation-water supply for Uruguayan farmers provided by reservoir construction. This water-allocation conflict was addressed and analyzed as a case study in this work.
In particular, the primary objectives of this study were to: (i) Implement and test an integrated water-management model, that takes into account all the possible agricultural water uses presented in the study area and is able to analyze the feasibility of new water licenses at any point in the basin; (ii) ranking the alternatives for water allocation from the most to the least equitable taking into account the economic, social, and environmental factors described in the UN Watercourse Convention; and (iii) analyze and quantify possible water-allocation scenarios with the aid of a what-if scenario analysis (WISA).
2. Materials and Methods
2.1. Study Approach
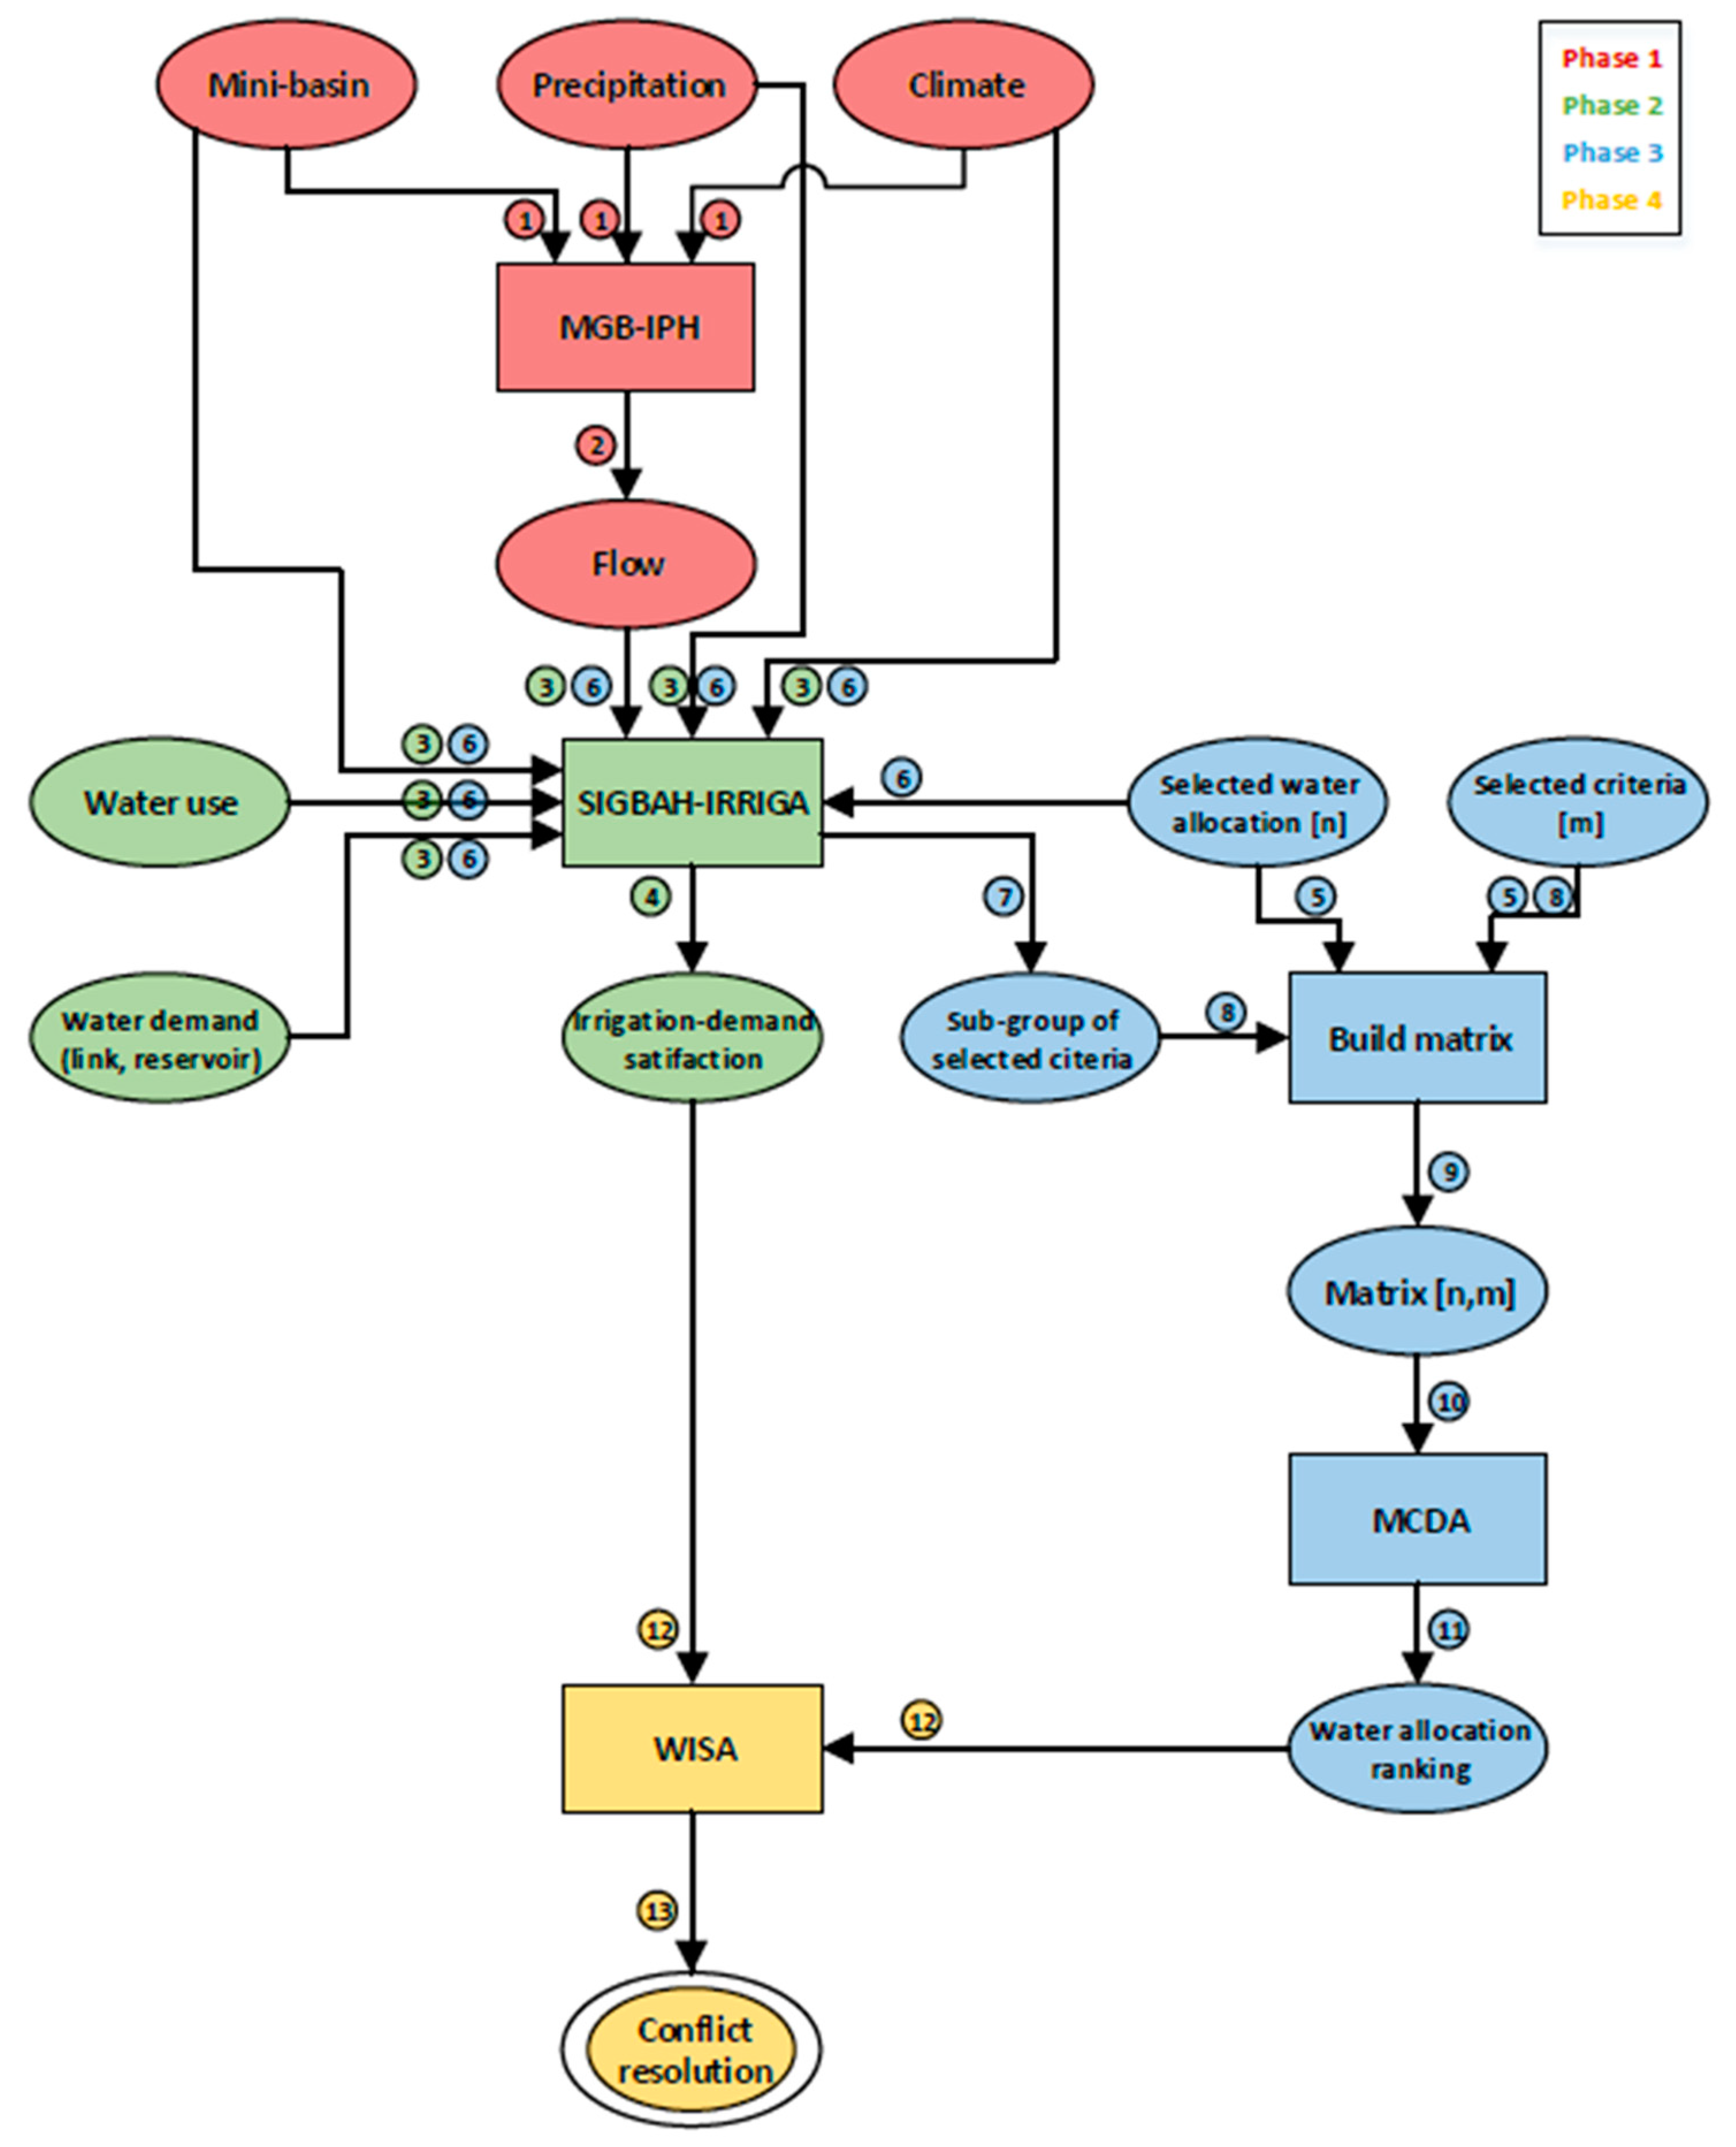
The new scenario-based framework is presented in Figure 1. It consists of four main phases and thirteen steps. Phase 1 includes the collection of the available data (Step 1) and the implementation, calibration, and validation of the hydraulic/hydrologic model. In particular, for our case study, we used the large-scale model (MGB-IPH) (a description of this model is presented in Section 2.4.1). Its main output, needed for our study, was the streamflow computation (Step 2). Phase 2 considers the implementation, calibration, and validation of a water-management model coupled with the hydraulic/hydrologic model developed in the previous phase (Step 3). The river basin management system-irrigation module (SiGBaH-Irriga) was chosen and implemented in our study area (a description of this model is presented in Section 2.5.1). The advantages of this model are twofold: (i) It is able to analyze the feasibility of new water licenses for direct water intakes and reservoirs at any point in the basin, and (ii) by considering all the possible agricultural water uses presented in the study area, it is able to improve water management in situations of water deficit (Step 4). In Phase 3, n possible optimal water allocations and m economic, social, and environmental factors were selected to build a matrix (n,m) that was the input of the multi-criteria decision analysis (MCDA). The calculation of a subset of the m factor values (m1) was straightforward, since they were part of the design parameters of the reservoirs, or they could be obtained from the catchment characteristics (Step 5). The remaining factor values (m2) were computed by running SiGBaH-Irriga n times (Steps 6, 7, and 8). The m1 and m2 factors are described in Section 3.2. The matrix obtained (n,m) (Step 9), where m = m1 ∪ m2 and m1 ∩ m2 = , was the input of the MCDA (Step 10). A ranking of the chosen water allocations was obtained from this analysis (Step 11). In Phase 4, the results obtained from MCDA were collected and used to create different scenarios to compare with a baseline (Scenario 0 or current situation, i.e., Step 4 output) with the aid of WISA in a geographic information system (GIS) environment (Step 12). The results of this entire process were further discussed and used to solve a real water-resource conflict in our transboundary basin (Step 13). For the sake of clarity, it is worth mentioning that, in Figure 1, the input/output are represented with a circle; the output of the entire framework with a double-circle; and the processes with a rectangle. Furthermore, all the arrows are characterized by a time-oriented enumeration.
2.2. Study Area
The Cuareim/Quaraí river represents the northern natural border between Uruguay and Brazil. It has a watershed with a surface equal to 14,800 km2. Fifty five percent of this area belongs to the Uruguayan side; the rest (45%) belongs to the Brazilian side (Figure 2). The main channel of the Cuareim/Quaraí river is 351 km long, and the difference in height between its source and its outlet is 326 m, with an average slope of 0.93 m/km. The upstream part of the basin, with the outlet located in the border cities of Artigas (Uruguay) and Quaraí (Brazil), is characterized by the steepest slopes (1.96 m/km) and a concentration-time equal to 28 h. These parameters were calculated in a GIS environment by using the ArcGIS software.
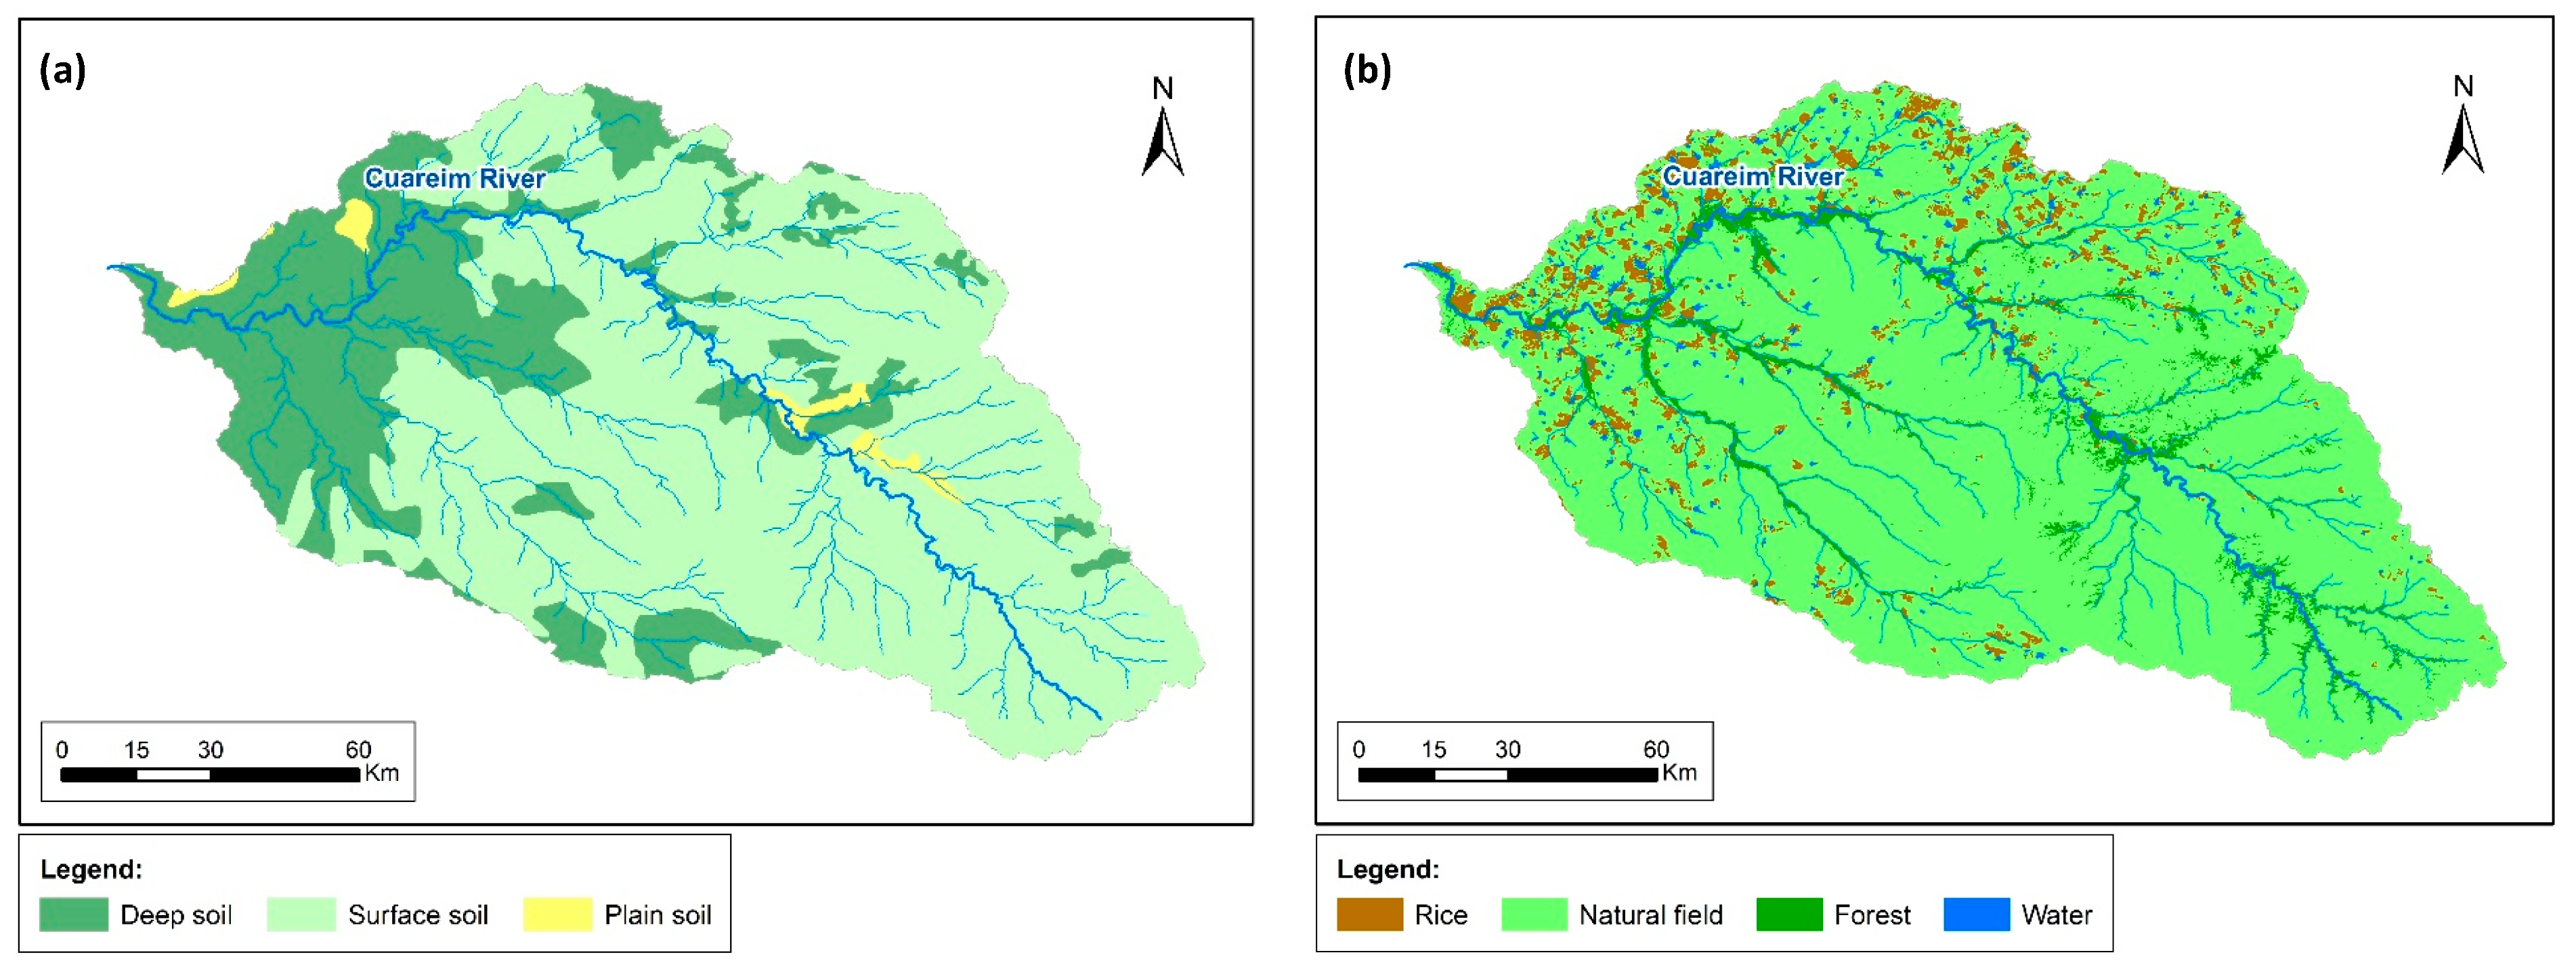
Most of the soils that characterize this watershed are located on a basaltic rock (Arapey Formation) with a wide range of thickness. On the basis of their depth, they can be classified into shallow soils (less than 40 cm thick) and deep soils (between 40 and 120 cm thick). The shallow soils are mainly located in the upstream part of the basin. The severe limitations in the development of pasture roots that characterize this type of soil cause significant difficulties in terms of agricultural and livestock utilization. While deep soils present better conditions for pasture and crop plantation, in particular, rice cultivation [17]. In fact, the primary water use of the basin is represented by rice irrigation through direct water intakes and small reservoirs.
Under the basaltic rock, the Guaraní aquifer system is located. It is a 1,090,000 km2 aquifer that covers part of Brazil (67.4%), Argentina (20.9%), Paraguay (8.0%), and Uruguay (3.7%). Being characterized by different thickness, its transmissivity varies from 5 m2/day to 500 m2/day. The exchange between surface water and groundwater is neglectable since it can be considered a confined aquifer for the study area.
It is worth mentioning that during drought periods, the water supply is not sufficient to cover the demand from all water uses (irrigation, population supply, environmental flow). This highlights the need to optimize the existing water resources in the entire basin and develop a water-management model able to analyze the feasibility of new water licenses at any point of the watershed and their possible consequences downstream in terms of volume of water available for agriculture and environmental flow [18].
2.3. Data Collection
For this study, four main groups of data were used: Meteorological data (precipitation and climate), hydrological data (streamflow), catchment characteristics (soil type and land use), agricultural water uses presented in the study watershed (direct intakes, reservoirs, and wells).
2.3.1. Precipitation and Climate
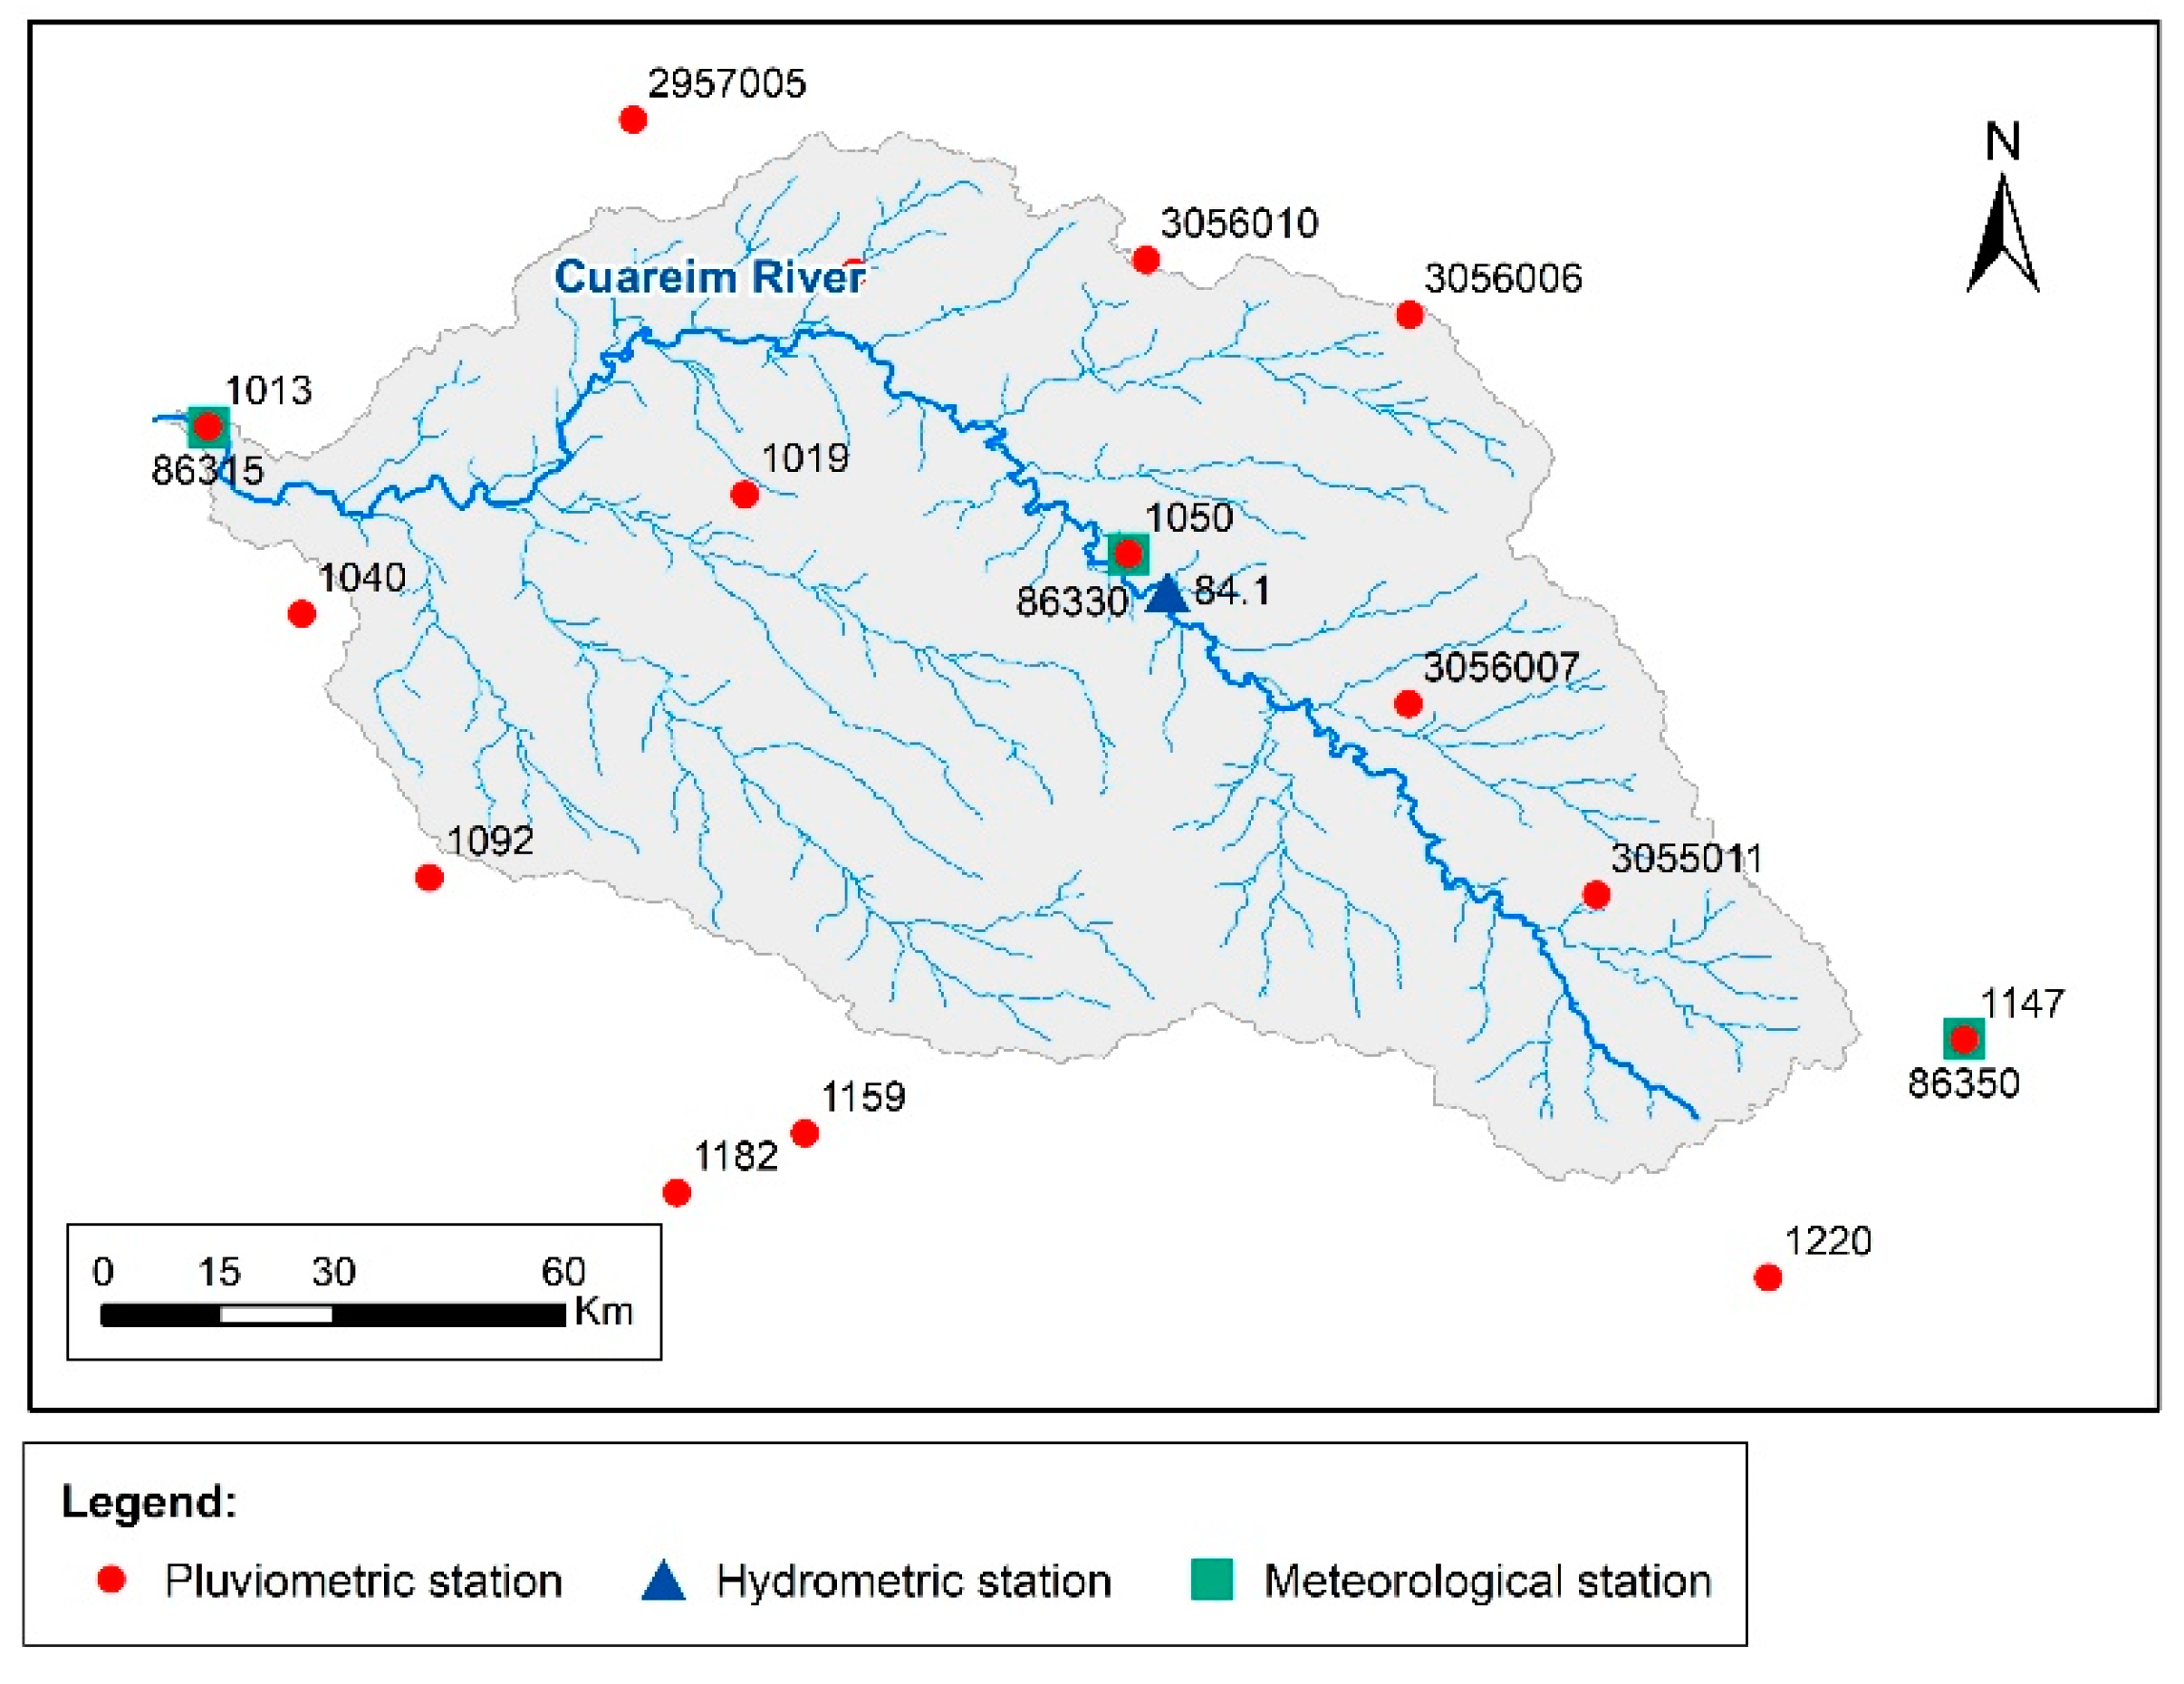
The daily precipitation data (for the period 1981–2013) from 15 stations belonging to the Uruguayan Institute of Meteorology (INUMET) and the National Water Agency (ANA) of Brazil was used in this study. The data quality was studied and analyzed evaluating the accumulated annual rainfall (double mass curve) and the number of days with missing data. Among the 15 stations, 3 were meteorological. The latter, apart from the precipitation, provided climate data, including average temperature (°C), average relative moisture (%), average wind speed (nodes), and solar radiation (h). In Figure 3, the location of the selected pluviometric and meteorological stations is shown.
2.3.2. Streamflow
The daily streamflow data (for the period 01/01/1981-03/31/2008) from a hydrometric station belonging to the Uruguayan National Water Board (DINAGUA) was used. It is located in Artigas city. The rating curves were analyzed to assure the quality of the data collected (further information in the Supplementary Materials SM-1). In Figure 3, the location of the hydrometric station is reported.
2.3.3. Soil Type
The information about the soil types with a scale 1:1,000,000, located in the Uruguayan area of the basin was obtained from the Updated Information Compendium of Soils of Uruguay maintained by the Ministry of Livestock, Agriculture, and Fisheries (MGAP) [19]. The information about the soil thickness with a scale of 1:750,000 located in the Brazilian area of the basin was obtained from the Soils of the Rio Grande do Sul State, maintained by Brazilian Agricultural Research Corporation (EMBRAPA) [20]. The soil maps of both countries were merged to obtain a unique soil map for the entire watershed that was able to classify the soils in deep, shallow and plain (Figure 4a). To each of these soil classes, a hydrological class was then associated by considering the structure and storage capacity of the soil type. The effective soil porosity was used for calculating the soil storage capacity.
2.3.4. Land Use
The characterization of the watershed land use is based on the classification of satellite images provided by the National Institute of Space Research of Brazil (INPE). The land-use categories identified are natural field, rice, afforestation, and water. In Figure 4b, this classification obtained for the year 2010 is represented. This was considered a representative classification for the entire period covered in this study.
2.3.5. Direct Water Intake
Water-license data recorded from DINAGUA (for Uruguay), the Department of Water Resources of the State of Rio Grande do Sul (DRH-RS, Brazil), and ANA (for Brazil) were collected. The Brazilian portion of the basin has shared management between a federal (ANA) and state authority (DRH-RS), since water intakes directly from the Cuareim/Quaraí river are ANA responsibility, while water intakes from the tributaries are DRH-RS responsibility. In Figure 5a, the location of all the water intakes recorded for the watershed is shown (harvest period 1987/1988–2014/2015). In Table 1, their characteristics are summarized. It is worth noting that the amount of Brazilian intakes is 2.4 times greater than the Uruguayan ones. The total water demand is equal to 35.27 m3/s.
2.3.6. Small Reservoir for Irrigation
The existing reservoirs are mainly small-scale land reservoirs, individually built by rice producers. Their inventory was made based on the information recorded from DINAGUA (Uruguay), DRH-RS (Brazil) and Information, Citizenship, and Environment (ICA, Brazil). The information collected in both countries was complemented with satellite information of the LANDSAT 5 TM image of 2015, from which all-existing reservoirs in the basin with a surface area greater than 10 ha were identified. For each of them, the maximum surface area (ASAT) was calculated, assuming that at the time of the image, the reservoirs were full (AMAX). Then, to estimate the maximum storage volume of these reservoirs, we used the available information about area-volume ratio obtained from the Uruguayan reservoirs. This information was useful to verify that the assumption ASAT ≅ AMAX was correct. In Figure 5b, the location of all the small dams included in the inventory is presented (harvest period 1987/1988–2014/2015). In Table 2, their characteristics are summarized.
2.3.7. Groundwater Extraction Well
The data about the Uruguayan extraction wells were collected from the National Directorate of Mining and Geology—Ministry of Industry, Mining and Geology (DINAMIGE), National Administration of Sanitary Works (OSE), Responsible Production Program, Ministry of Livestock, Agriculture and Fisheries (PPR MGAP) and Natural Resources and Development Program Irrigation, Ministry of Livestock Agriculture and Fisheries (PRENADER MGAP). The Brazilian information about extraction wells was provided from the Geological Service of Brazil (CPRM). In Figure 5c, the location of all the groundwater extraction wells is presented (harvest period 1987/1988–2014/2015).
The total volume of groundwater extraction for the entire watershed is 21.8 hm3 (Table 3). Assuming a constant extraction throughout the year, it corresponds to an average flow of 0.69 m3/s. This value is irrelevant if it is compared with the irrigation demands from the direct water intakes (Table 1). Nevertheless, these groundwater demands were included in the implementation of the water-management model.
2.4. Hydraulic/hydrologic Model
2.4.1. Brief Description of MGB-IPH
The large-scale MGB-IPH hydraulic/hydrologic model is a semi-distributed process-based model that used physical and conceptually-based equations to simulate continental hydrological cycles [21]. Each basin is divided, firstly, into small mini-basins, then, into hydrological response units (HRUs) defined from a combination of soil and land use/land cover type maps [22]. Energy budgets and vertical water are independently computed for each HRU in each mini-basin. Soil–water balance is computed considering only one soil layer, according to the following equation:
where W is the water storage in the soil layer (mm); P is the rainfall that reaches the soil (mm Δt−1); ET is the evapotranspiration from the soil (mm Δt−1); Dsup is the surface runoff (mm Δt−1); Dint is the subsurface flow (mm Δt−1); and Dbas is the percolation to groundwater reservoir (mm Δt−1). P is calculated by substracting, from the total precipitation, the amount of water intercepted by the vegetation in each time interval. ET is calculated from the Penman–Monteith equation, taking into account the atmospheric demand already satisfied with the evaporation of the intercepted amount of water [23]. Soil infiltration and runoff (Dsup) are calculated on the basis of the variable contributing area concept of the ARNO model [24]. Subsurface flow (Dint) is calculated using an equation similar to the Brooks and Corey unsaturated hydraulic conductivity equation [25]. Percolation from soil layer to groundwater (Dbas) was computed considering a simple linear relation between soil-water storage and maximum soil-water storage. Afterward, the flow generated within each unit-catchment was routed to the stream network using three linear reservoirs, one for each flow as mentioned earlier (base flow (Dsup), subsurface flow (Dint), and surface flow (Dbas)). The outflow of each unit-catchment (Q) was calculated as the sum of Qsup, Qint, and Qbas, and it was then routed to the drainage network considering the Muskingum–Cunge method. A description of the model parameters is reported in the Supplementary Materials (SM-2).
2.4.2. MGB Implementation and Performance
The first step in implementing the MGB-IPH model in the Cuareim/Quaraí watershed was to divide it in mini-catchments. We identified 402 mini-basins, characterized by an average area equal to 35 km2. Each mini-basin represents a model calculation cell. Eleven sub-basins were also identified. Each of them was then divided into HRUs considering the analytical combination of the land use and soil type. Nine HRUs were obtained from the combination of the three soil types (deep, superficial, and plain) and the three land uses (grassland, rice, and afforestation). The tenth HRU corresponded to the water–land use. In Figure 6, the HRUs identified for the entire watershed are represented. It is worth noting that in the upstream part of the catchment, the land use “natural field over superficial soil” is predominant. While the downstream area is characterized by deep soils and rice plantations.
As we mentioned in the MGB-IPH model description, four fixed parameters need to be calculated for each HRU: Albedo, leaf area index (LAI), the average height of the vegetation, and surface resistance. They strongly depend on the period of the year and the type of vegetation that characterizes each HRU. In our previous work [18], the monthly values computed for the four parameters for different types of vegetation can be found.
The development, calibration, and validation of a hydraulic/hydrologic model capable of predicting the quantity response of Cuareim/Quaraí watershed to a diverse set of inputs was an issue successfully tackled in our previous work [18]. In Table 4, the goodness-of-fit indicators used to evaluate the model performance are presented along with the numerical results of calibration and validation processes.
2.5. Water-Management Model
2.5.1. Brief Description and Implementation of SiGBaH-Irriga
The model design was based on the methodology of the water-management model described in Kayser et al. [28]. This model, SiGBaH-Irriga, is a decision-support system for water-resources management where weekly quantitative water balances are made [29]. As well as the MGB-IPH model, SiGBaH-Irriga is also based on the same discretization of the watershed in small units, called mini-basins. In the Supplementary Materials (SM-3), a general scheme of the water-balance components of rivers and reservoirs for a single mini-basin is presented.
SiGBaH-Irriga was coupled with MGB-IPH since it requires some data produced by this hydrologic model. It was already mentioned that SiGBaH-Irriga adopts the same MGB-IPH’s watershed discretization in mini-basins and their physical and topological characteristics. Furthermore, the series of weekly flows, as well as precipitation and evaporation data generated from MGB-IPH are automatically saved and available for the water-management model. The computational methodology adopted in this model is a cascade simulation that allows simulating each mini-basin starting from the ones located upstream. The locations corresponding to the direct intakes, reservoirs, and groundwater wells were placed in the model. In the case of direct intakes, the maximum authorized demand was set equal to the demand during the irrigation period. The groundwater wells were modeled as direct surface intakes with a water demand equal to the extraction volume authorized for the well, uniformly distributed through the year. The reservoirs were characterized by the maximum volume stored, reservoir surface, and maximum storage level. The planted area during the irrigation season is defined in the first week of October (immediately before the harvest period). Considering the water stored in all the reservoirs of the basin until the first days of October, the actual planted area is the sum of the single area that would be planted if the entire volume of the water stored in each reservoir would be used.
After a complete run for all time steps and mini-basins, the model then counts the number of failures as well as the volume of failures for the three types of existing users (direct water intake, groundwater extraction well, and reservoir). By the term “failure,” we mean a lack of satisfaction of the water demand. The main variables calculated at this step refer to the area actually planted exploiting the irrigation from direct water intakes and reservoirs. The equations for the definition of the harvested area from direct water intakes and reservoirs for the harvesting seasons (s) are defined as follows:
where and represent the harvested area per crop for each direct intake and for each reservoir respectively; and are the planted area per crop for each direct intake and reservoir respectively; and represent the not satisfied volume (“failure”) at each direct intake and reservoir; and total water demand in each direct intake and reservoir by volume unit. Equations (2) and (3) define the efficiency of water intakes and reservoirs respectively in economic terms. The closer the harvested area to the planted area, the higher the efficiency, the higher the economic income.
It is worth remarking that this model was previously developed and successfully implemented in the Santa Maria watershed (Brazil) [28]. Considering its promising results, we have implemented, calibrated and validated it for our study area. A detailed description of the model and its applications can be found in the literature [28,29,30,31].
To test the performance of SiGBaH-Irriga, the index of agreement (d) (Equation (4)) was used as metric [32]:
where for are reservoir-area simulations or predictions obtained from the model; for represent reservoir-area observations obtained from satellite images; is the mean of the observed values over the entire simulation period.
2.6. Data Analysis
2.6.1. Multi-Criteria Decision Analysis (MCDA)
MCDA allows decision makers to consider a full range of indicators in their decision process. Several software packages can be used to implement this analysis. In this study, methods referred to as PROMETHEE (Preference Ranking Organization Method for Enrichment Evaluations) and GAIA (Geometrical Analysis for Interactive Aid) were adopted [33].
In particular, PROMETHEE I (for partial ranking) and PROMETHEE II (for complete ranking) were used to build a valued outranking relation and exploit it.
When A of n alternatives (a1, a2, …, an) have to be ranked, and C of k criteria (c1, c2, …, ck) have to be minimized or maximized, we have a multi-criteria problem as follows:
To solve such a multi-criteria problem, the typical four steps that characterize these methods were tackled [34]:
- Defining a preference function per criterion. A preference function , associated with a criterion ci, denotes the preference of action a over action b. This step completely depends on the decision makers:
varies from 0 to 1 (0 for no preference or indifference, 1 for strict preference). Six different types of preference functions represented by specific shapes are proposed in the scientific literature [35,36].
- Choosing the weighting given to each criterion and calculating the multi-criteria preference index. Criteria that are more important for decision makers receive larger weights. Assuming wj as the weight of a criterion, the weights are then normalized as follows:
The intensity of preference of a over b is calculated with the multi-criteria preference index ():
- Calculating the leaving and entering flows. The positive (leaving) flow () shows how an alternative ai is outranking the other n − 1 alternatives. It is a global measurement of the strengths of action a:
The larger , the better the action.
The negative (entering) flow () measures how much the other n − 1 actions are preferred to action a. It is also a global measurement of the weaknesses of action a:
The smaller , the better the action.
- Calculating the net outranking flow. PROMETHEE II is used to evaluate a complete ranking calculated as a net flow () between the positive and the negative partial ones:
The advantage of the complete flow over the partials ones is that it takes into account and aggregates both the strengths and the weaknesses of the action into a single score. can be positive or negative. The larger , the better the action.
GAIA is a descriptive complement to the PROMETHEE methods, which makes use of the basic rules of principal component analysis (PCA). This analytical approach is capable of clustering similar data together while identifying relationships among variables/criteria. The GAIA plane corresponds to the projection of PROMETHEE II results on the first two orthogonal principal components (PC1 and PC2). Criteria or variables are then represented by vectors, whose length and orientation explain the importance of the variables. Vectors oriented in similar directions correspond to criteria that are in general agreement. The length of the variable vector shows the amount of important deviations observed. Thus, a variable with a larger deviation will have a longer vector than a variable with a small deviation. Further information on GAIA analysis as well as the algorithms behind the PCA technique and its applications can be found in the literature [37,38].
2.6.2. What If Scenario Analysis (WISA)
In this study, WISA was used to provide a dynamic and flexible way to evaluate policy or management options. This technique explores trajectories of change that diverge from present conditions, ultimately leading to alternative possible future states or events [39]. Scenarios are not predictions or forecasts; instead, they are probable and often-simplified descriptions of how the future may develop based on a consistent and coherent set of assumptions about driving forces and key relationships [40,41]. WISA is a technique that enables an exploration of potential impacts, risks, benefits, and management opportunities stemming from a variety of possible future conditions. In this study, WISA was used to understand, assess, and analyze any possible future situation created by the need to increase the irrigation water supply. This is accomplished by coupling this technique with the results obtained from the hydraulic/hydrologic model, water-management model, and MCDA. This combination helped to fill the gap between research and decision making, illuminating how new water licenses will affect hydrologic services in the entire watershed, and allowing decision-makers to prepare for this adequately. In this study, a three-step process was addressed:
- Scenario definition. In this first step, researchers collaborated with decision makers to identify the key factors driving the system, determine which one of them evaluate in the scenario analysis, and detect the characteristics that differentiate the various scenarios.
- Scenario construction. In this second phase, researchers and decision makers defined scenarios quantitatively and qualitatively. Quantitative approaches can provide greater accuracy and reliability, and allow defining the effects of alternative strategies or changes in assumptions. Qualitative approaches can capture aspects that cannot be quantified, such as human motivations, behavior, and values [42].
- Scenario analysis and assessment. In this last phase, scenario outcomes were examined and compared to the baseline condition. The results obtained were then presented to decision makers with maps, tables, and graphs depicting patterns of change in various end-points for each scenario compared to the baseline.
2.7. Criteria Selection
To take into account all the factors and circumstances listed in the UN Watercourses Convention [11], ten criteria that consider environmental and socio-economical aspects were chosen. These selected criteria are briefly defined below:
- Dam length (DL) (m): Horizontal distance from the right abutment to the left abutment of the dam.
- Lake area (LA) (ha): The maximum surface of the artificial lake (reservoir level) that the new reservoir would create.
- Soil suitability (SS) (%): Suitability of the soil to the rice cultivation. It depends on edaphic characteristics (texture, organic matter, structure, and soil resistance) and physiographic characteristics (slope, altitude, presence of flood presence).
- Distance to the rice field area (DRF) (km): Conduit length from the dam to the rice field area. The longest DRF, the higher the water loss, and the higher the construction cost.
- Irrigable area (IA) (ha): One-third of the area suitable to the rice cultivation that can be irrigated by gravity, without any need of pumping (one third is based on the national Law N° 15.239 [43]).
- Lake area-stored volume ratio (LA/V) (ha/hm3): The ratio of maximum artificial lake surface (reservoir level) over maximum stored volume.
- Stored volume-basin area ratio (V/A) (hm3/km2): The ratio of maximum stored volume over the watershed area.
- Influence on direct downstream intakes (I_DI) (%): The difference between the irrigation water-demand satisfaction calculated with and without the possible water allocation, computed with Equations (1) and (2) for the downstream direct water intakes.
- Downstream reservoir efficiency (E_DW) (%): Impact to downstream reservoirs, calculated with Eq. (1) and (2) for the reservoir users.
- Flow duration curve (Q90) (future with current scenario) (%): Comparison of the Q90 variation with and without the new reservoir to evaluate the impact of the reservoir on the natural hydrological regime.
It is worth remarking that the Criteria 1–7 belong to the sub-set m1 of the m factors explained in Section 2.1, whose calculation was straightforward, since they were part of the design parameters of the reservoirs, or they could be obtained from the catchment characteristics (Step 5 in Figure 1). The remaining factors 8–10 belong to the sub-set m2, whose values were computed by running SiGBaH-Irriga ten times since ten are the possible water allocations previously identified.
It is worth noting that more criteria could be defined; however, selected indicators should reflect the main characteristics of the problem identified in the study area, and they should be computable with the available data. It is also clear that these indicators are used to measure the performance of decision options; therefore, they should be relevant to the decision maker’s objectives [44].
3. Results and Discussion
3.1. Water-Management Simulations
The performance of the water-management model was analyzed taking into account its capacity to represent the volume or the area evolution of each reservoir in the basin, as well as the evolution of rice-cultivated areas at catchment scale during the years.
Three parameters were identified for the calibration of the water-management model:
- Average irrigation supply: Average water volume required to irrigate 1 ha of rice in one harvest period. This volume includes the irrigation demand of the crop, as well as the water losses in the transport from the dam until the cultivated area.
- Planted-area risk: Extra area cultivated, taking into account the probable precipitation that may occur during the irrigation period. This area is added to the one corresponding to the volume of water stored in the reservoir.
- Water-application return: A surplus of the irrigation-water volume that is not used by the plant and flows into the stream network of the watershed.
The values of these parameters obtained from the calibration and their range of variation are presented in Table 5. The range of variation considered for each parameter was defined considering respectively the actual daily water use for irrigation (information obtained from the interview of local farmers and agronomists); the cultural factor based on the willingness to risk to plant more area than the one calculated in the first week of October, hoping in a rainy summer (information obtained from the interview of local farmers); field monitoring and calculation [45].
The calibration process was conducted by comparing the measured planted area, obtained from the Rice Institute of Rio Grande (IRGA, Brazil) and the Rice Cultivators Association (ACA, Uruguay), with the simulated one for all the small reservoirs and water intakes (Brazilian and Uruguayan). The graphical results of this comparison are shown in Figure 7.
Working within the established range, and comparing the simulations with the measurements, the calibration was performed until a good fit was obtained. Agreement between the measured and simulated planted area for almost all simulations was overall very satisfactory. It is worth remarking that the observed volume for direct intakes is the maximum volume authorized, which is not always the volume actually used. This uncertainty in the input parameters justifies the not perfect match between simulations and observations. Therefore, if the observed data in Figure 7 range within the green bars, the agreement between observations and simulations can be considered satisfactory.
The validation process was conducted by comparing the simulated reservoir area with the measured/estimated one, obtained from satellite images. The simulated surface for each reservoir was obtained by combining the simulated volume in each week of the water balance and the volume/area curves obtained from each reservoir. In Figure 8, a graphical and numerical/statistical comparison between the simulated and measured reservoir area is shown.
The results of the validation process were very satisfactory. It was found that more than 50% of the reservoirs were characterized by , and 80% of the reservoirs were characterized by .
The novelty of this modeling approach is represented not only from the possibility to analyze the effect on existing users of a new possible authorization to use the resource in the basin (direct intake or reservoir), but also because it allows to analyze the effectiveness of fulfilling the water demand of any particular water intake or reservoir.
3.2. Multi-Criteria Decision Analysis
An MCDA was conducted for ranking reservoir-site alternatives from the most to the least equitable and reasonable, considering the economic, social, and environmental factors listed in the UN Watercourses Convention [11].
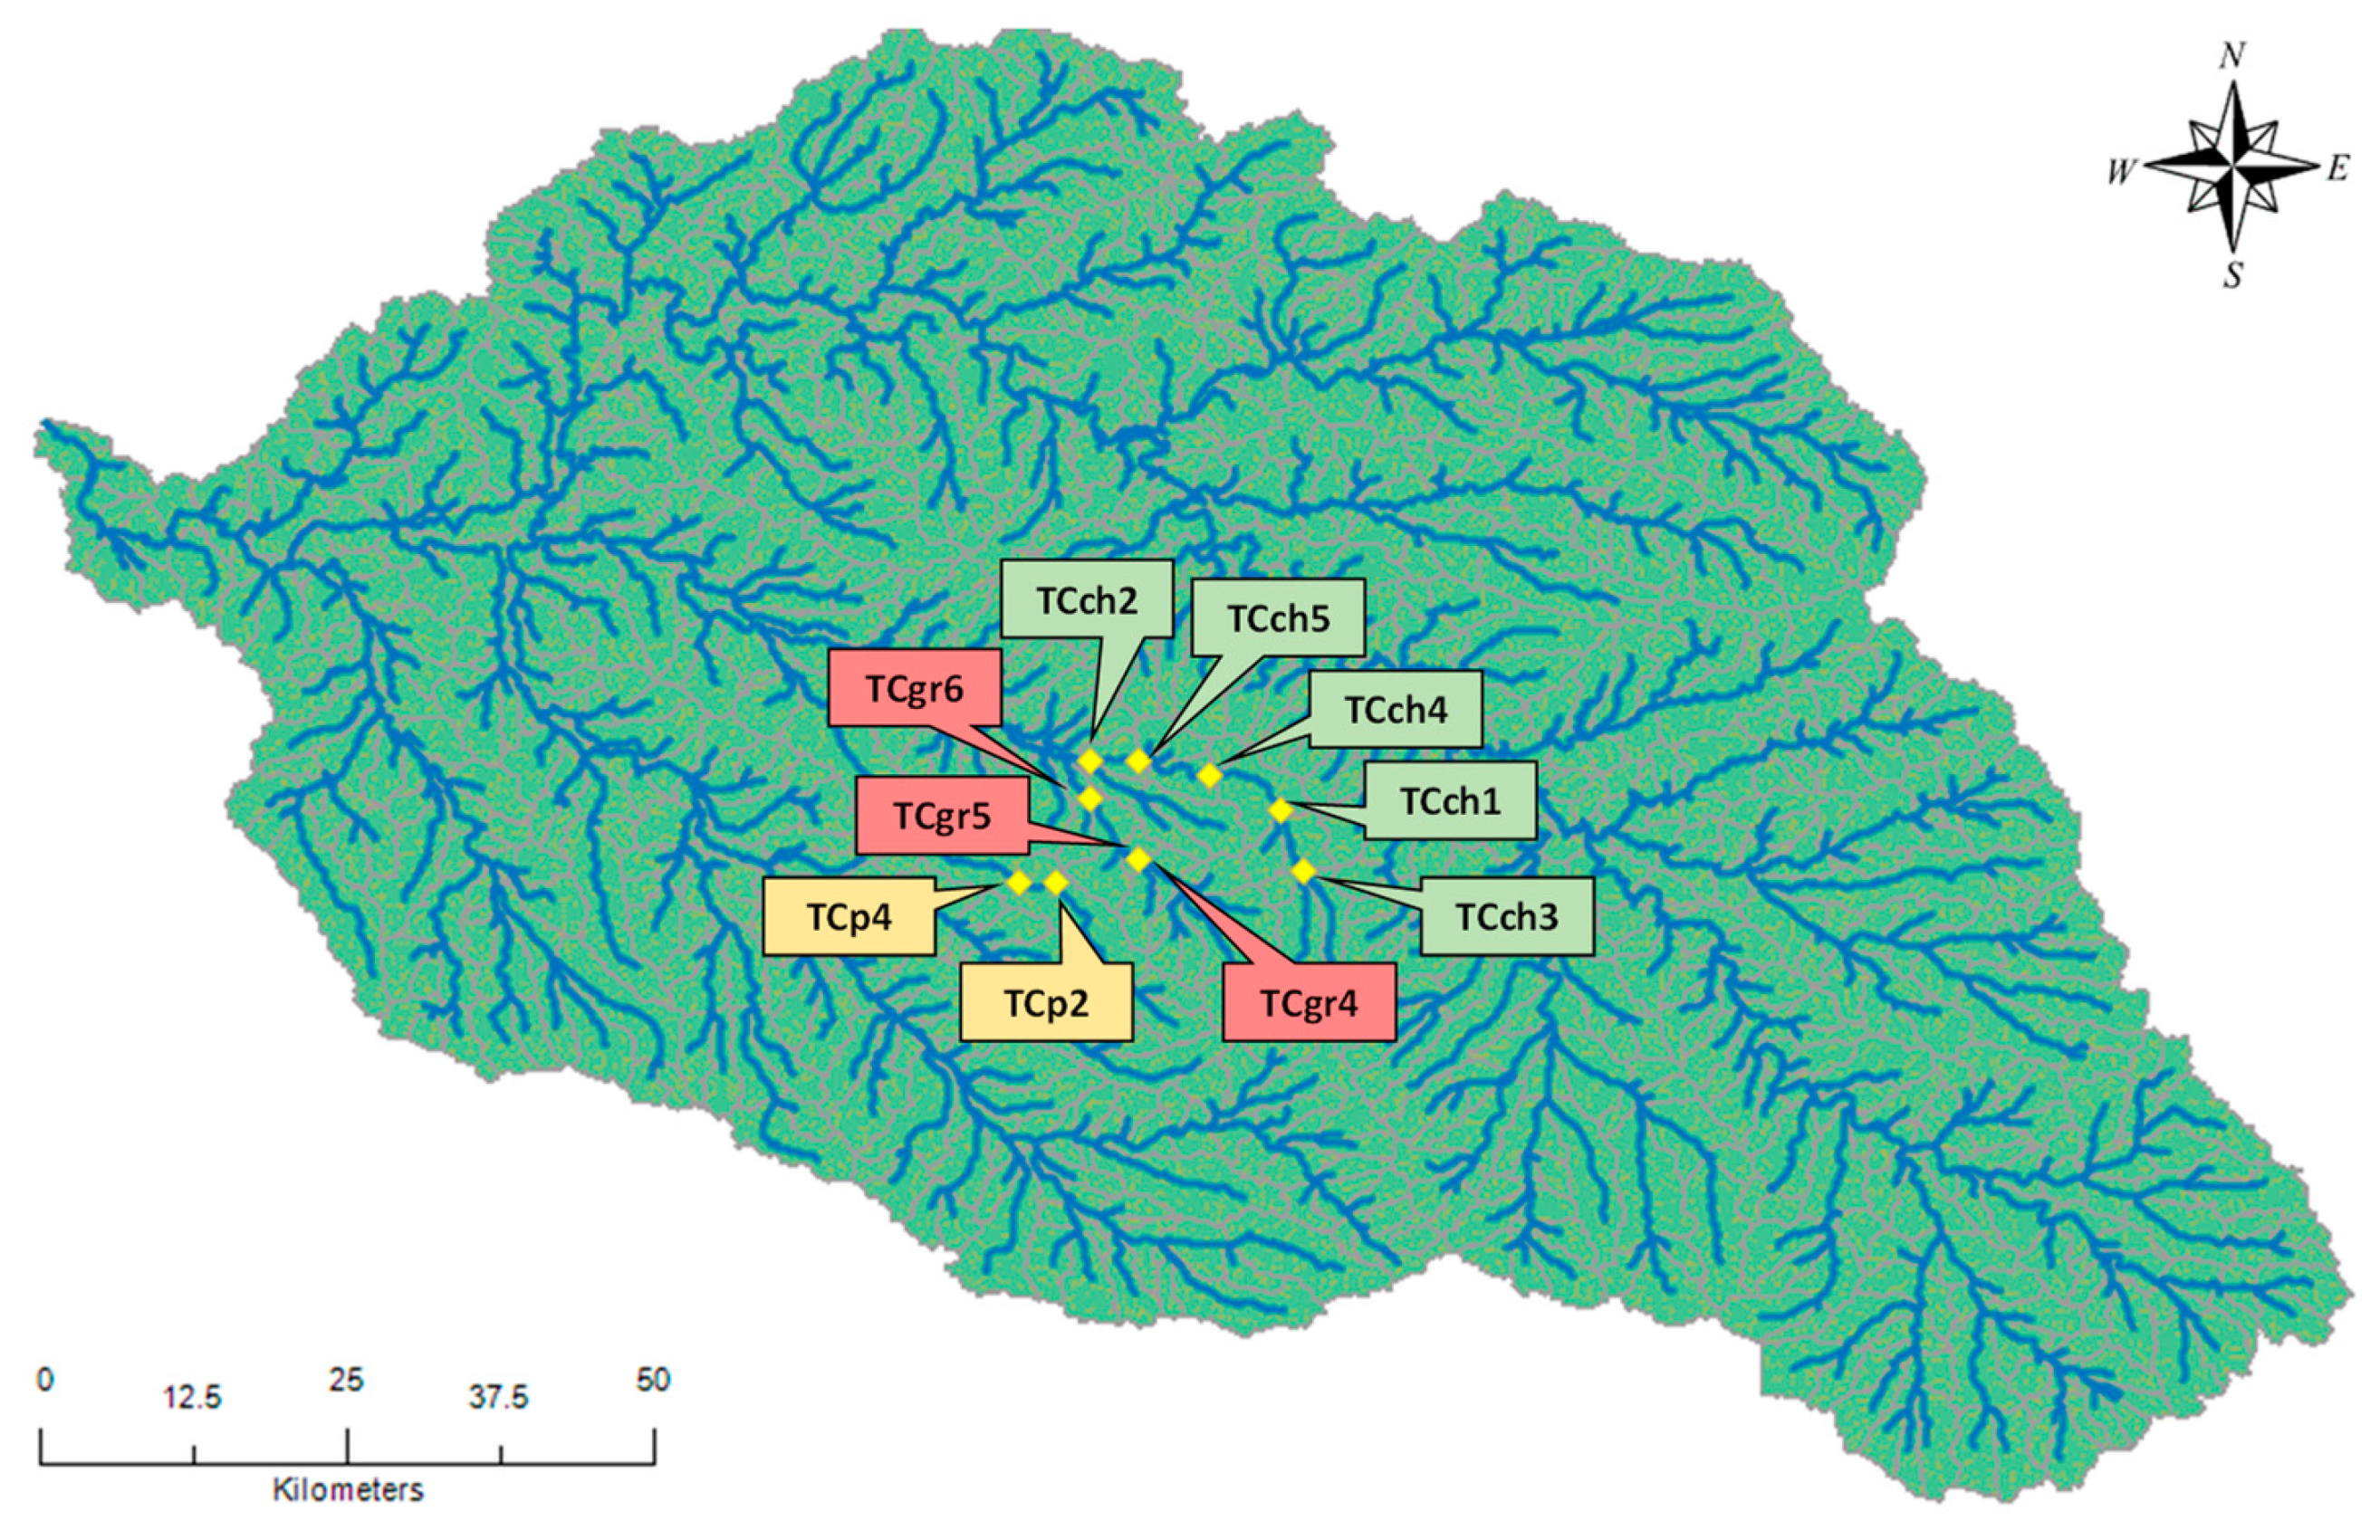
As mentioned in Section 2.2, the downstream part of the Cuareim/Quaraí watershed is more suitable for rice cultivation than the rest of the basin, due to its slope and soil type. To analyze the real water-sharing conflict raised during the bi-national meeting in 2016 [16], the Uruguayan side was chosen for possible future water allocations. In particular, among all the sub-basins, the Tres Cruces (TC) one was considered the most suitable for building reservoirs [46]. In this subcatchment, all the possible areas that may generate a reservoir able to irrigate a planted surface greater than 1000 ha were considered. On the basis of this, ten possible sites were identified and used in the MCDA (Figure 9). It is worth noting that these reservoirs are different from the previous small reservoirs (Figure 5b) since they may be of interest of a group of farmers, of the region, even of the country if they are considered as part of a strategic plan for the watershed development.
In Table 6, we show where each factor of the UN Watercourses Convention [11] is taken into account in the new framework developed in this study. In Phase 2, water use and water demand were part of the input data of the water-management model, while irrigation-demand satisfaction was the output (Figure 1). In Phase 3, the ten criteria mentioned above were listed.
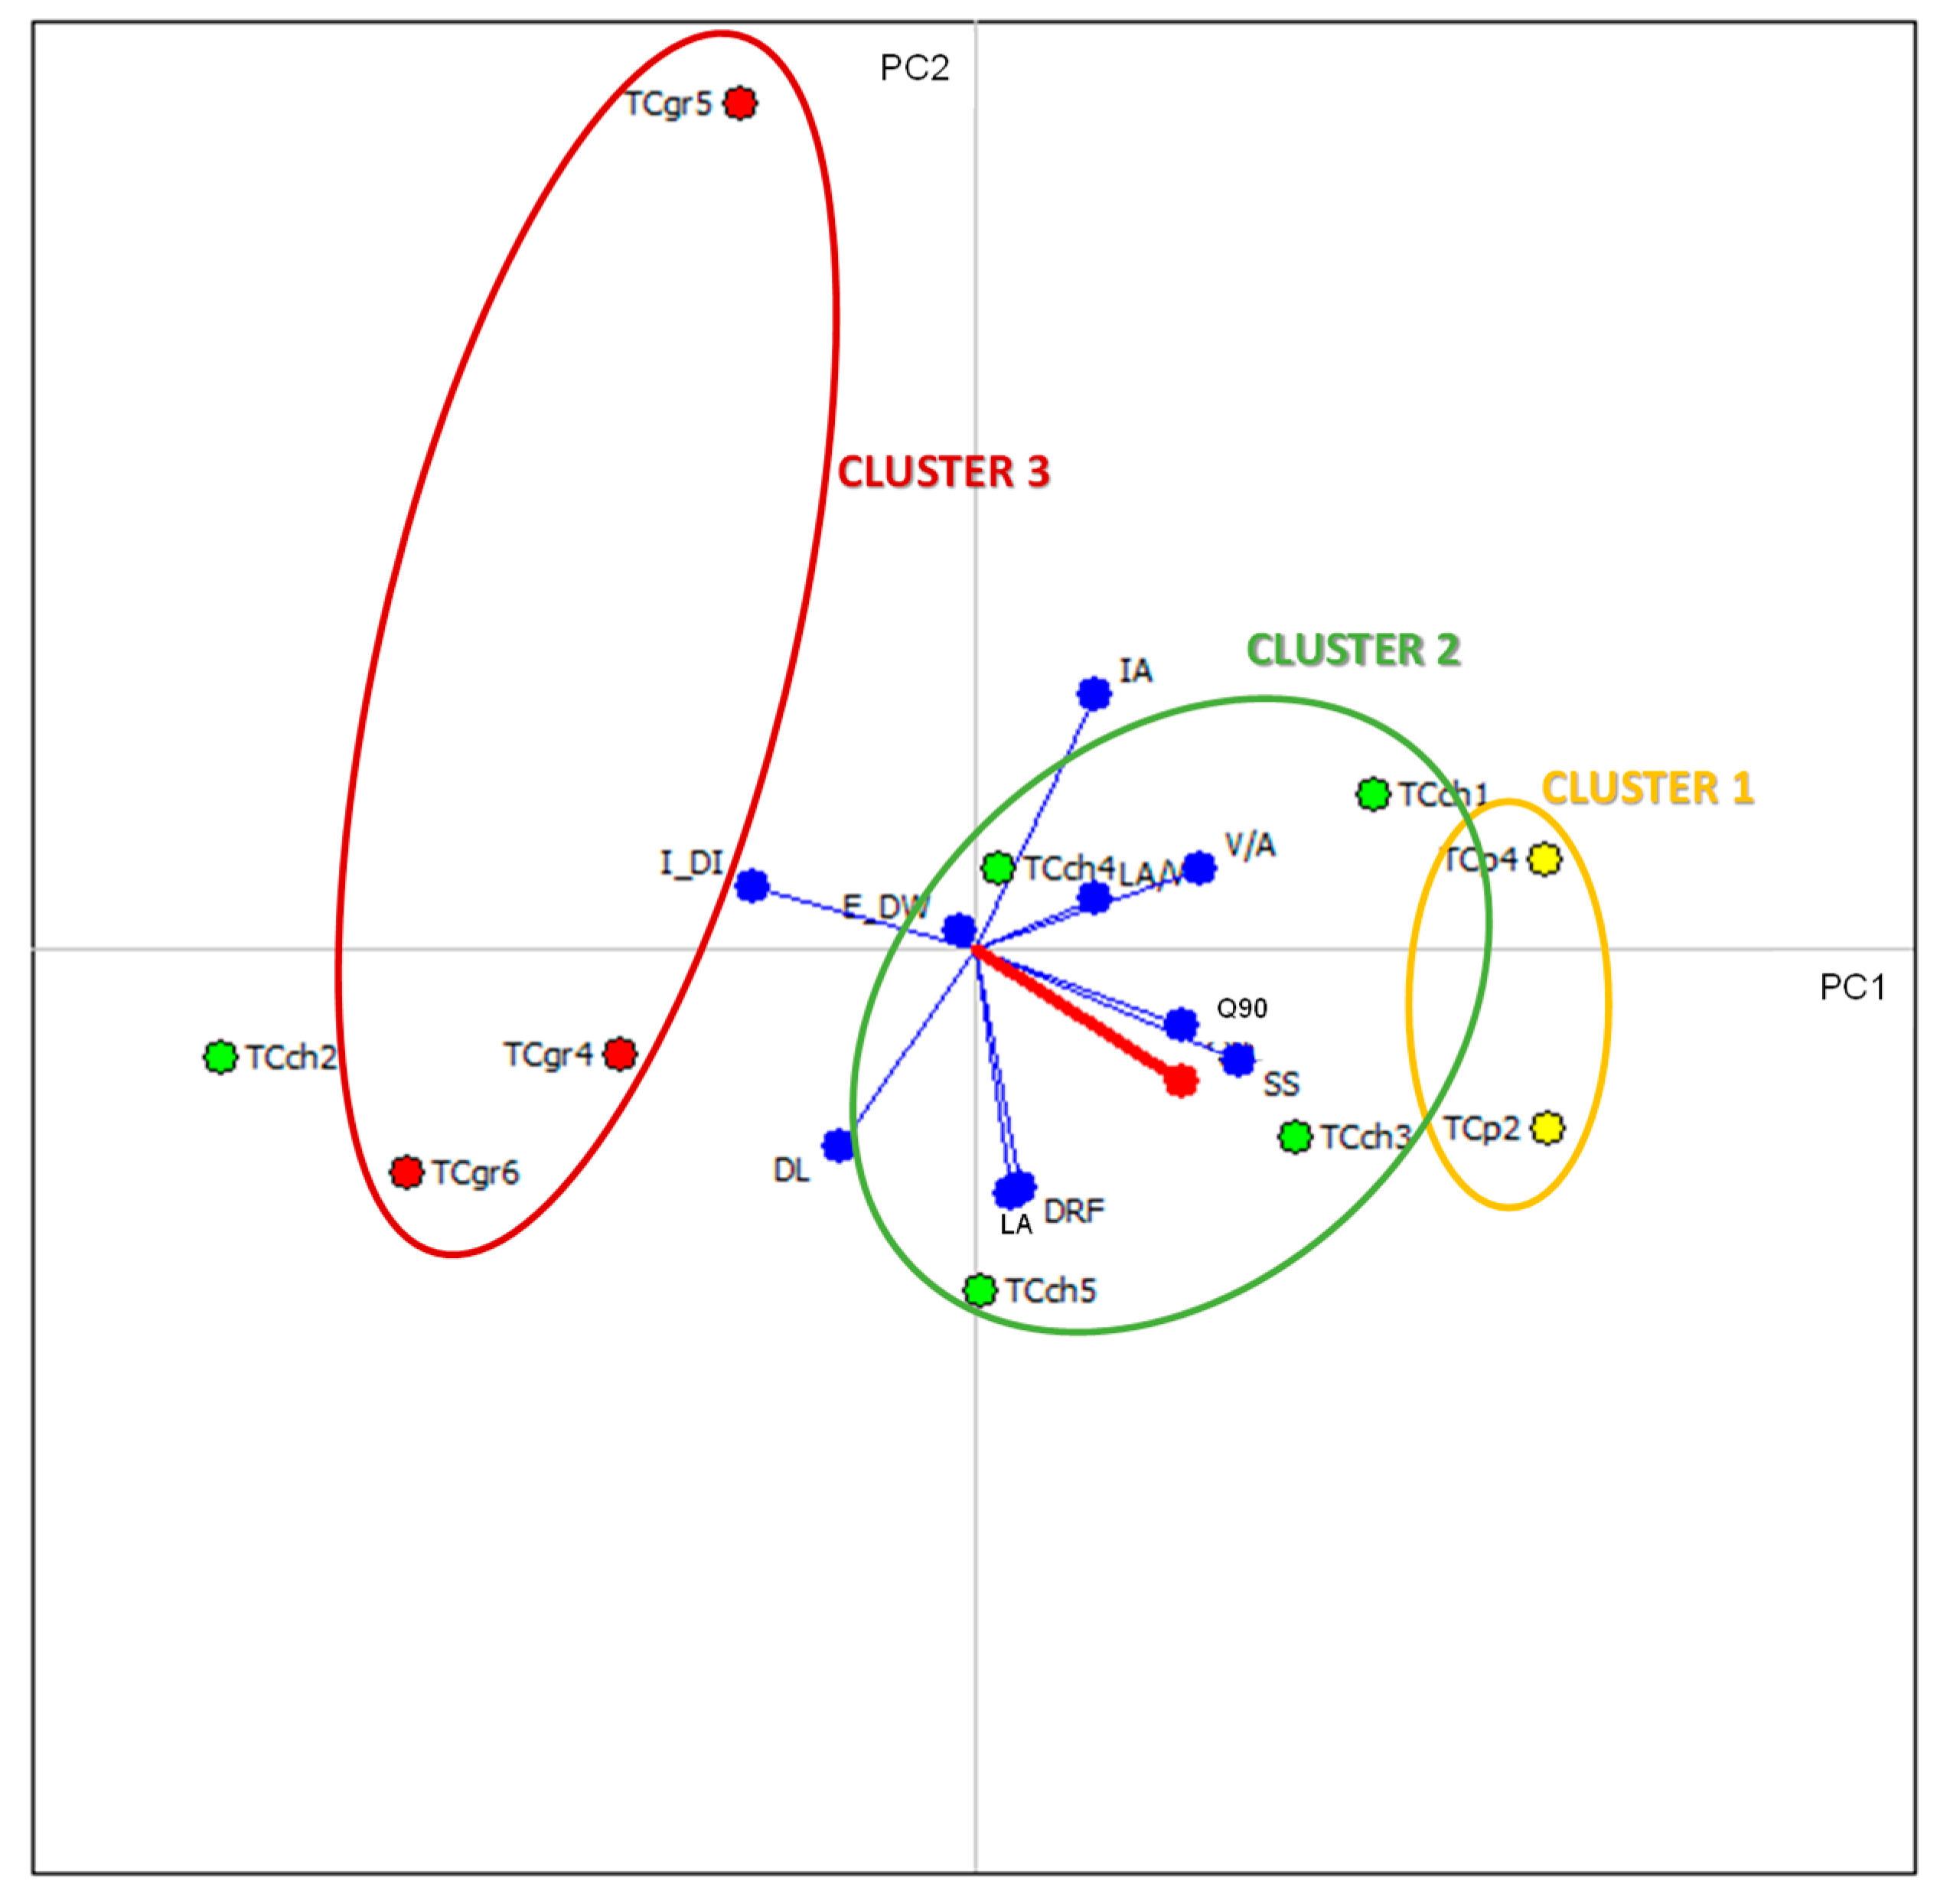
A data matrix (10 × 10) was the input for the MCDA. In particular, PROMETHEE and GAIA methods were used. GAIA was primarily adopted as a visualization tool for assessing the influence that each factor has in the analysis. PROMETHEE was used to rank the sites from the best to worst in terms of the socio-economic and environmental factors listed above.
Seventy-nine percent of the total variance of the data matrix was accounted for the GAIA analysis, which indicates that more than three-quarters of the available information was included in the GAIA analysis (Figure 10). The scores plot summarizes the similarities of the objects and their behavior in the two components. In Figure 10, except for TCch2, three clusters can be identified. They include the possible sites of the three main channels selected for water allocations (TCp, TCch, and TCgr). TCch2 represents an atypical reservoir since the biggest basin area and one of the smallest stored water volumes characterize it; therefore, it is not an efficient reservoir from the irrigation point of view.
The loadings plot analyzes the role of all the variables in the two PCs chosen, their correlations, and their importance in the system. In the loadings plot represented in Figure 10, most of the criteria are characterized by vectors with similar length, e.g., with similar importance. E_DW is the least significant factor, considering its length. This outcome is confirmed from the fact that dams are never located in the mainstream of the Cuareim/Quaraí river; therefore, the construction of a possible reservoir on the mainstream can only slightly affect them. It is worth noting that GAIA incorporates a decision axis (pi), represented with a thick red vector in Figure 10. When pi is long, the most preferred objects are oriented in its direction and furthest from the point of interception of PC1 and PC2 axes. In our case, I_DI, SS, and Q90 are the criteria with major influence. These three variables alone cover the factors (a), (b), (c), (d), and (f) of the UN Watercourses Convention, which represent the factors covered by the entire Phase 3 of the proposed scenario-based framework (Table 4). This information has particular importance for data-scarce transboundary-basins, where it is not possible to compute the ten criteria previously selected. In those cases, the primary objective of this work can still be accomplished. This makes our new scenario-based approach universally-accepted.
PROMETHEE was used to rank the possible sites based on the ten selected criteria. The user is required by the PROMETHEE method to maximize or minimize each criterion, e.g., declaring whether the higher values of a variable (maximized) or the lower one (minimized) are preferred. In this study, DL, LA, SS, DRF, LA/V, I_DI, and Q90 were minimized, while the remaining factors (IA and V/A) were maximized, and the same weight was assigned to all of them so that no variable was favored over the other. The preference function chosen for all the variables was the linear function. Taking into account GAIA outcomes, E_DW was excluded from PROMETHEE analysis. In Table 7, the results of PROMETHEE I and PROMETHEE II are summarized.
The PROMETHEE outcome not only confirms the three clusters previously identified with GAIA, but also shows the intersection between Cluster 1 (yellow dots in PROMETHEE) and Cluster 2 (green dots in PROMETHEE) in the water allocation ranking. TCch sites can be among the best and the least equitable and reasonable reservoir locations. The more downstream the site is located, the least suitable for water storage it is. TCch1, TCch3, in particular, and TCp group are the best places for possible future reservoir construction, taking into account the ten selected socio-economic and environmental criteria. Whereas the group TCgr represents the most detrimental place. This rank confirmed the atypical behavior of TCch2. In fact, as mentioned above, it is characterized by the biggest basin area and one of the smallest stored water volume. Therefore, it is not an efficient reservoir from the irrigation point of view. It is noteworthy that the difference between TCch2 and TCgr5 (last two rankings) is very few. Therefore, based on each specific case study, a particular best and least allocation strategy can be chosen by decision makers.
3.3. WISA
In the context of the bi-national (Uruguay/Brazil) meeting in 2016, a water-sharing conflict arose [16]. The issue referred to decreases in the water volume for irrigation by Brazilian farmers downstream due to the increase in the irrigation water supply for Uruguayan farmers provided by reservoirs construction. With the aim at resolving this conflict, two scenarios were defined to analyze the selection of the best location strategy in terms of the socio-economic and environmental factors considered in this study, and quantify the benefits of this choice. In Table 8, a description of the two scenarios is reported.
Scenario 0 represents the current water-management situation in the Cuareim/Quaraì watershed. This scenario was used as the baseline condition. Based on the outcomes obtained from the MCDA, Scenario 1 considers the implementation of a reservoir in TCch1, that represents the most equitable and reasonable reservoir site. These two scenarios were implemented in a GIS environment and run with SiGBaH-Irriga for the period 1991–2015 (15 years). To analyze the real water-sharing conflict raised during the bi-national meeting in 2016 [16], in Table 9, the efficiency of all the direct intakes located downstream the new reservoir located in TCch1 is reported. The values are ordered on the basis of the water intake position (from upstream to downstream). The efficiency reduction obtained with S1 is also calculated (column S0–S1 in Table 9).
It is noteworthy that the efficiency of the three water intakes (71, 72, and 73) located immediately downstream, the reservoir located in TCch1 is increased after the reservoir installation. This is justified from the fact that an environmental flow equal to 0.047 m3/s is considered all year long. Therefore, in this way, a minimum amount of flow is guaranteed even during the hot and dry seasons. Furthermore, the maximum efficiency reduction is equal to 0.33% for Brazilian water intake (#31). This means that in 15 years (the entire simulation periods), the farmer #31 (considering a single water intake associated to a single or a small group of farmers) lost 0.33 ha of harvested area. It is possible to state that 1 ha of rice allows a net income of approximately US$ 1100 considering the amount or rice cultivated in 1 ha, the cost for packaging the rice, and the cost to produce 1 ha of rice harvested in the basin. Based on this, the farmer #31 lost approximately US$ 360 per planted hectare in 15 years.
Thus, with this methodology, we were able to satisfy the need of Uruguayan farmers of having more water sources during the dry season without critically compromising the efficiency of the existing water resources of the Brazilian farmers. This new approach, not only considered socio-economical aspects, but also took into account the environmental ones by guaranteeing a constant environmental flow all year long. The Cuareim/Quaraí watershed case study was used as an application of the scenario-based framework proposed in this work, confirming that this new approach is very flexible and can be applied to any transboundary watershed to resolve water-sharing issues among riparian countries for reasonable and equitable water allocation.
4. Conclusions
A new universally-accepted scenario-based framework was proposed in this study. It is a useful tool for managing the existing water resources and is able to resolve possible conflicts related to water allocation in any transboundary watershed. This new approach takes into account the UN Watercourses Convention, as essential factors for water allocation.
The framework developed in this study was applied to the Cuareim/Quaraí catchment, located on the north-eastern border of Uruguay and the south-western border of Brazil, where a water-sharing conflict emerged in 2016. The issue referred to decreases in the water volume for irrigation by Brazilian farmers downstream due to the increase in the irrigation water supply for Uruguayan farmers provided by reservoirs construction.
SiGBaH-Irriga was successfully calibrated and validated in the study watershed (80% of the reservoirs were characterized by ). The novelty of this modeling approach is represented not only from the possibility to analyze the effect on existing users of a new possible authorization to use the resource in the basin (direct intake or reservoir), but also because it allows to analyze the effectiveness of fulfilling the water demand of any particular water intake or reservoir. Ten criteria that take into account all the factors and circumstances listed in the UN Watercourses Convention were selected and used to run the MCDA. GAIA was primarily used for assessing the influence that each factor had in the analysis. I_DI, SS, and Q90 were the criteria with major influence. These three variables alone cover the factors (a), (b), (c), (d), and (f) of the UN Watercourses Convention. They represent the factors covered by the entire Phase 3 of the proposed framework. This aspect is very important for those catchments characterized by data scarcity, where it is not possible calculating the ten criteria selected. In those cases, the primary objective of supporting decision makers in resolving water allocation conflict in a transboundary watershed can still be accomplished. This makes our new scenario-based approach universally-accepted. PROMETHEE was used to rank the possible water-storage sites from the best to the least equitable and reasonable. TCch1 resulted to be the best and it was considered in the scenario analysis. In particular, two scenarios were defined: Scenario 0 represents the current water-management situation (baseline condition), and Scenario 1 considers a reservoir built in TCch1. Calculating the efficiency of all the direct intakes located downstream of the new reservoir, it was found that the maximum efficiency reduction of Brazilian water intakes is equal to 0.33% over a period of 15 years. This percentage represents the economic loss derived from the reduction of harvested area, and it is approximately equal to US$ 363. Furthermore, the guarantee of a constant environmental flow all year long, allowed an efficiency increment of three water intakes that are clearly characterized by a “no flow” condition during the dry season.
This study indicates that water allocation strategies and related water-management actions, along with long-term policies, are the primary tools to preserve economic efficiency, social equitability, and environmental integrity in watershed-scale water allocation. Furthermore, the new scenario-based framework developed in this study is a powerful universally-accepted tool able to aid engineers and decision makers to objectively and rationally select among several alternatives the best water allocation for a specific case study.
5. Software Availability
Hydraulic/hydrologic model. Modelo de Grandes Bacias (MGB-IPH) is freely downloadable [47]. MGB-IPH was first developed in 2011 and has undergone several major upgrades since then. In this study, we used the Version 2.0 (MGB 2). MGB 2 is designed to run with Microsoft Windows, and the programming language is FORTRAN. It is a plug-in of the GIS Map Window, Version 4.8.6.
Water-management model. Sistema de Gerenciamento de Bacias Hidrográficas–Módulo de Irrigação (SiGBaH-Irriga) is freely downloadable [48]. SiGBaH-Irriga was first developed in 2016 and has undergone several main upgrades since then. In this study, we adopted the Brazilian Version 1.0 (SiGBaH-Irriga 1). The development of SiGBaH-Irriga 1 was pursued under an agreement between IPH and IMFIA. SiGBaH-Irriga 1 is designed to run with Microsoft Windows. It is a plug-in of the GIS Map Window, Version 4.8.6.
Supplementary Materials
The following are available online at https://www.mdpi.com/2073-4441/11/6/1174/s1, SM-1: Rating-curve analysis; SM-2: MGB-IPH parameters; SM-3: Water-balance components in SiGBaH-Irriga.
Author Contributions
Research design and conceptualization, A.G.; Methodology, A.G.; Field data resources, M.C. and R.H.K.; Data analysis, A.G.; Framework development, A.G.; Visualization, A.G.; Model development, M.C. and R.H.K.; Software, R.H.K. and W.C.; Funding acquisition, C.C. and W.C.; Project administration, C.C. and W.C.; Supervision, C.C. and W.C.; Writing original draft, A.G.; Writing, reviewing, and editing, A.G., M.C., C.C. and W.C. All authors have read and approved the final manuscript.
Funding
This research was supported by the General Secretariat of the Organization of American States (GS/OAS) under contract number PO 386064 with C.C. and W.C. as PIs.
Acknowledgments
The authors would like to thank Alejandra de Vera and Alberto Castro Casales from the College of Engineering (FIng), Universidad de la República (UdelaR) for their insights on the flow chart visualization.
Conflicts of Interest
The authors declare that there are no conflicts of interest regarding the publication of this paper.
References
- Mianabadi, H.; Sheikhmohammady, M.; Mostert, E.; Giesen, N. Application of the ordered weighted averaging (OWA) method to the Caspian Sea conflict. Stoch. Environ. Res. Risk Assess. 2014, 28, 1359–1372. [Google Scholar] [CrossRef]
- Degefu, D.M.; He, W.; Yuan, L.; Zhao, J.H. Water allocation in transboundary river basins under water scarcity: A cooperative bargaining approach. Water Resour. Manag. 2016, 30, 4451–4466. [Google Scholar] [CrossRef]
- Mekonnen, M.M.; Hoekstra, A.Y. Four billion people facing severe water scarcity. Sci. Adv. 2016, 2, e1500323. [Google Scholar] [CrossRef] [PubMed]
- Saz-Salazar, S.; García-Rubio, M.A.; González-Gómez, F.; Picazo-Tadeo, A.J. Managing water resources under conditions of scarcity: On consumers’ willingness to pay for improving water supply infrastructure. Water Resour. Manag. 2016, 30, 1723–1738. [Google Scholar] [CrossRef]
- Ansink, E.; Harold, H. The economics of transboundary river management. In Handbook of Water Economics; Dinar, A., Schwabe, K., Eds.; Edward Elgar: Cheltenham, UK, 2015; pp. 434–469. [Google Scholar]
- Wolf, A.T. Criteria for equitable allocations: The heart of international water conflict. Nat. Resour. Forum 1999, 23, 3–30. [Google Scholar] [CrossRef]
- Fu, J.; Zhong, P.-A.; Zhu, F.; Chen, J.; Wu, Y.-N.; Xu, B. Water resources allocation in transboundary river based on asymmetric Nash–Harsanyi leader–follower game model. Water 2018, 10, 270. [Google Scholar] [CrossRef]
- Correia, F.N.; Da Silva, J.E. International framework for the management of transboundary water resources. Water Int. 1999, 24, 86–94. [Google Scholar] [CrossRef]
- Rahaman, M.M. Principles of transboundary water resources management and water-related agreements in Central Asia: An analysis. Int. J. Water Resour. Dev. 2012, 28, 475–491. [Google Scholar] [CrossRef]
- Mianabadi, H.; Mostert, E.; Zarghamim, M.; Giesen, N. A new bankruptcy method for conflict resolution in water resources allocation. J. Environ. Manag. 2014, 144, 152–159. [Google Scholar] [CrossRef]
- UN Watercourses Convention. Convention on the Law of the Non-Navigational Uses of International Watercourses; Adopted on 21 May 1997; United Nations: New York, NY, USA.
- Zaag, P.; Van der Seyam, I.; Savenije, H. Towards measurable criteria for the equitable sharing of international water resources. Water Policy 2002, 4, 19–32. [Google Scholar] [CrossRef]
- Salman, S.M. The Helsinki rules, the UN watercourses convention and the Berlin rules: Perspectives on international water law. Int. J. Water Resour. Dev. 2007, 23, 625–640. [Google Scholar] [CrossRef]
- Ahmadi, A.; Karamouz, M.; Moridi, A.; Han, D. Integrated planning of land use and water allocation on a watershed scale considering social and water quality issues. J. Water Resour. Plan. Manag. 2012, 138, 671–681. [Google Scholar] [CrossRef]
- Anghileri, D.; Castelletti, A.; Pianosi, F.; Soncini-Sessa, R.; Weber, E. Optimizing watershed management by coordinated operation of storing facilities. J. Water Resour. Plan. Manag. 2013, 139, 492–500. [Google Scholar] [CrossRef]
- Programa Marco. Pilot Project. Conflict Resolution over the Use of Water in the Cuareim/Quaraí River Basin; Organización de Estados Americanos (OAE): Buenos Aires, Argentina, December 2016. [Google Scholar]
- Chreties, C.; Kyser, R.; Crisci, M.; Gorgoglione, A.; Collischonn, W. Hydrologic models as a support of water resources management in the bi-national Cuareim/Quaraí watershed. In Proceedings of the XXVIII Congreso Latinoamericano de Hidráulica, Buenos Aires, Argentina, 18–21 September 2018. (In Spanish). [Google Scholar]
- Crisci, M.; Chreties, C.; Silveira, L. Continuous hydrological simulation in the Cuareim river basin with the MGB-IPH model. Innotec 2015, 10, 40–48. (In Spanish) [Google Scholar]
- MGAP. Carta de Reconocimiento de Suelos del Uruguay, Tomo III. Apéndice: Descripciones, Datos Físicos y Químicos de los Suelos Dominantes; Dirección de Suelos y Fertilizantes: Montevideo, Uruguay, 1979. [Google Scholar]
- Streck, V.; Kampf, N.; Klamt, E. Solos Do Rio Grande Do Sul; UFRGS: Porto Alegre, Brazil, 2002. [Google Scholar]
- Monteiro Pontes, P.R.; Fan, F.A.; Fleischmann, A.S.; Dias de Paiva, R.C.; Buarque, D.C.; Siqueira, V.A.; Jardim, P.F.; Sorribas, M.V.; Collischonn, W. MGB-IPH model for hydrological and hydraulic simulation of large floodplain river systems coupled with open source GIS. Environ. Model. Softw. 2017, 94, 1–20. [Google Scholar] [CrossRef]
- Haghnegahdar, A.; Tolson, B.A.; Craig, J.R.; Paya, K.T. Assessing the performance of a semi-distributed hydrological model under various watershed discretization schemes. Hydrol. Process. 2015, 29, 4018–4031. [Google Scholar] [CrossRef]
- Monteith, J.L. Evaporation and surface temperature. Q. J. R. Meteorol. Soc. 1981, 107, 1–27. [Google Scholar] [CrossRef]
- Todini, E. The ARNO rainfall-runoff model. J. Hydrol. 1996, 175, 339–382. [Google Scholar] [CrossRef]
- Rawls, W.J.; Ahuja, L.R.; Brakensiek, D.L.; Shirmohammadi, A. Infiltration and soil water movement. In Handbook of Hydrology; Maidment, B.D., Ed.; McGraw-Hill: New York, NY, USA, 1993; Chapter 5.1-5. [Google Scholar]
- Allasia, D.G.; Da Silva, B.C.; Collischonn, W.; Tucci, C.E.M. Large basin simulation experience in South America. In Proceedings of the Symposium S7 Held during the Seventh IAHS Scientific Assembly, Foz do Iguaçu, Brazil, 3–9 April 2005; IAHS Publ.: Wallingford, UK, 2006; Volume 303. [Google Scholar]
- Collischonn, W.; Allasia, D.G.; Da Silva, B.C.; Tucci, C.E.M. The MGB-IPH model for large-scale rainfall–runoff modelling. Hydrol. Sci. J. 2007, 52, 878–895. [Google Scholar] [CrossRef]
- Kayser, R.H.B.; Chreties, C.; Crisci, M.; Collischonn, W. Estimation of the interannual production of irrigated crop in a watershed from hydrological modeling. In Proceedings of the XXII Simpósio Brasileiro de Recursos Hídricos, Florianópolis, Brazil, 26 November–1 December 2017. (In Portuguese). [Google Scholar]
- Kayser, R.H.B.; Collischonn, W. Integrating generic decision support system for water resources management into an open source GIS. In Proceedings of the XX Simpósio Brasileiro de Recursos Hídricos, Bento Gonçalves, Brazil, 17–22 November 2013. (In Portuguese). [Google Scholar]
- Kayser, R.H.B.; Collischonn, B.; Collischonn, W. Management of shared basins: A case study in the Quaraí river basin. In Proceedings of the XXI Simpósio Brasileiro de Recursos Hídricos, Brasilia, Brazil, 22–27 November 2015. (In Portuguese). [Google Scholar]
- Collischonn, W.; Silveira, A.; Kayser, R. Sistema de Gerenciamento de Bacias Hidrográficas-Irrigation module: SiGBaH-Irriga. Technical Manual: Model Description. Framework Program for the Sustainable Management of Water Resources in the Plata Basin. Pilot project Cuareim—Quaraí. 2016. Available online: https://drive.google.com/file/d/0B1CDpnDPA5HMUnJBMHNrVjE4a1E/view (accessed on 4 June 2019). (In Portuguese).
- Willmott, C.J. On the validation of models. Phys. Geogr. 2013, 2, 184–194. [Google Scholar] [CrossRef]
- Mareschal, B.; De Smet, Y. Visual PROMETHEE: Developments of the PROMETHEE and GAIA multicriteria decision aid methods. In Proceedings of the 2009 IEEE International Conference on Industrial Engineering and Engineering Management (IEEM), Hong Kong, China, 8–11 December 2009. [Google Scholar]
- Brans, J.P.; Vincke, P.; Mareschal, B. How to select and how to rank projects: The Promethee method. Eur. J. Oper. Res. 1986, 24, 228–238. [Google Scholar] [CrossRef]
- Brans, J.P.; Mareschal, B. PROMETHEE methods. In Multiple Criteria Decision Analysis: State of the Art Survey; FIgueria, J., Greco, S., Ehrgott, M., Eds.; Springer Science + Business Media, Inc.: Boston, MA, USA, 2005; pp. 21–36. [Google Scholar]
- Behzadian, M.; Kazemzadh, R.B.; Albadvi, A.; Aghdasi, D.M. PROMETHEE: A comprehensive literature review on methodologies and applications. Eur. J. Oper. Res. 2010, 200, 198–215. [Google Scholar] [CrossRef]
- Kokot, S.; Phuong, T.D. Elemental content of Vietnamese rice, Part 2, Multivariate data analysis. Analyst 1998, 124, 561–569. [Google Scholar] [CrossRef]
- Gorgoglione, A.; Bombardelli, F.A.; Pitton, B.J.L.; Oki, L.R.; Haver, D.L.; Young, T.M. Role of Sediments in Insecticide Runoff from Urban Surfaces: Analysis and Modeling. Int. J. Environ. Res. Public Health 2018, 15, 1464. [Google Scholar] [CrossRef]
- Duinker, P.N.; Greig, L.A. Scenario analysis in environmental impact assessment: Improving explorations of the future. Environ. Impact Assess. Rev. 2007, 27, 206–219. [Google Scholar] [CrossRef]
- Van den Berg, L.M.; Veeneklaas, F.R. Scenario building: Art, craft or just a fashionable whim? In Scenario Studies for the Rural Environment; Schoute, J.F.T., Finke, P.A., Veeneklaas, F.R., Wolfert, H.P., Eds.; Kluwer Academic Publishers: Dordrecht, The Netherlands, 1995; pp. 11–13. [Google Scholar]
- Volkery, A.; Ribeiro, T.; Henrichs, T.; Hoogeveen, Y. Your vision or my model? Lessons from participatory land use scenario development on a European scale. Syst. Pract. Action Res. 2008, 21, 459–477. [Google Scholar] [CrossRef]
- Liu, Y.; Mahmoud, M.; Hartmann, H.; Stewart, S.; Wagener, T.; Semmens, D.; Stewart, R.; Gupta, H.; Dominguez, D.; Hulse, D.; et al. Chapter Nine Formal Scenario Development for Environmental Impact Assessment Studies. In Environmental Modelling, Software, and Decision Support; Jakeman, A., Voinov, A., Rizzolli, A., Chen, S., Eds.; Elsevier Science: New York, NY, USA, 2008; pp. 145–162. ISBN 9780080568867. [Google Scholar]
- Law Nº 15.239 “Use and Conservation of Soils and Waters”. Available online: https://legislativo.parlamento.gub.uy/temporales/leytemp2319502.htm (accessed on 16 May 2019).
- Cetinkaya, C.P.; Gunacti, M.C. Multi-criteria analysis of water allocation scenarios in a water scarce basin. Water Resour. Manag. 2018, 32, 2867–2884. [Google Scholar] [CrossRef]
- Failache, N.; de Izaguirre, P. Water Return Monitoring in a Rice Field Area in the Cuareim Basin; Department of Fluid Mechanics and Environmental Engineering (IMFIA), School of Engineering, Universidad de la República: Montevideo, Uruguay, 2008. [Google Scholar]
- Crisci, M.; Fernández, M.; Trambauer, P.; Terra, R. Regional gravity irrigation system for the production of rice-pastures in the Tres Cruces river basin. In Proceedings of the XXIV Congreso Latinoamericano de Hidráulica, Punta del Este, Uruguay, 21–25 November 2010. (In Spanish). [Google Scholar]
- MGB-IPH. Available online: https://www.ufrgs.br/hge/mgb/downloads/ (accessed on 6 January 2019).
- SiGBaH-Irriga. Available online: https://www.ufrgs.br/hge/projetos/projetos-concluidos/projeto-piloto-demonstrativo-quaraicuareim/sigbah-irriga/ (accessed on 6 January 2019).
Figure 1.
Conceptualization of the scenario-based framework for conflict resolution in water allocation. (Symbols used: A circle represents the input/output; a double circle symbolizes the output of the entire framework; a rectangle represents the process).
Figure 1.
Conceptualization of the scenario-based framework for conflict resolution in water allocation. (Symbols used: A circle represents the input/output; a double circle symbolizes the output of the entire framework; a rectangle represents the process).

Figure 2.
Cuareim/Quaraí transboundary watershed.

Figure 3.
Location of pluviometric (red dots), hydrometric (blue triangle), and meteorological stations (green squares).
Figure 3.
Location of pluviometric (red dots), hydrometric (blue triangle), and meteorological stations (green squares).

Figure 4.
(a) Soil thickness, and (b) land-use categories in the study watershed.

Figure 5.
Location of (a) direct water intakes (b) small reservoirs, and (c) groundwater extraction wells in the Cuareim/Quaraí watershed.
Figure 5.
Location of (a) direct water intakes (b) small reservoirs, and (c) groundwater extraction wells in the Cuareim/Quaraí watershed.

Figure 6.
Hydrological response units (HRUs) defined for implementing the large-scale (MGB-IPH) model in the Cuareim/Quaraí watershed.
Figure 6.
Hydrological response units (HRUs) defined for implementing the large-scale (MGB-IPH) model in the Cuareim/Quaraí watershed.

Figure 7.
Comparison between the observed (black line) and simulated cultivated area related to reservoirs (blue bars) and direct water intakes (green bars) for the Cuareim/Quaraí watershed.
Figure 7.
Comparison between the observed (black line) and simulated cultivated area related to reservoirs (blue bars) and direct water intakes (green bars) for the Cuareim/Quaraí watershed.

Figure 8.
Comparison between the simulated reservoir area (blue line) and the observed one (orange dots) obtained from satellite images, for two reservoirs ((a) lat = −30.018, long = −56.526; and (b) lat = −30.044, long = −56.549).
Figure 8.
Comparison between the simulated reservoir area (blue line) and the observed one (orange dots) obtained from satellite images, for two reservoirs ((a) lat = −30.018, long = −56.526; and (b) lat = −30.044, long = −56.549).

Figure 9.
The selected ten possible sites for building reservoir in the Uruguayan side of the transboundary watershed.
Figure 9.
The selected ten possible sites for building reservoir in the Uruguayan side of the transboundary watershed.

Figure 10.
Geometrical Analysis for Interactive Aid (GAIA) analysis for assessing the influence of each factor (79% explained variance with the first two PCs).
Figure 10.
Geometrical Analysis for Interactive Aid (GAIA) analysis for assessing the influence of each factor (79% explained variance with the first two PCs).


Table 1.
Number and total demand for water intakes in the Cuareim/Quaraí basin.
| Country | Institution | Number of Water Intakes | Total Demand (m3/s) |
|---|---|---|---|
| Brazil | ANA, DRH-RS | 76 | 24.24 |
| Uruguay | DINAGUA | 32 | 11.03 |
| Total | ANA, DRH-RS, DINAGUA | 108 | 35.27 |
Table 2.
Number and total demand for reservoirs in the Cuareim/Quaraí basin.
| Country | Institution | Number of Reservoirs | Volume (hm3) |
|---|---|---|---|
| Uruguay | DINAGUA | 81 | 276.1 |
| Brazil | DRH-RS, ICA | 148 | 481.7 |
| Total | DINAGUA, DRH-RS, ICA | 229 | 757.8 |
Table 3.
Number and total demand for groundwater extraction well in the Cuareim/Quaraí basin.
| Country | Institution | Number of Groundwater Well | Volume (hm3) |
|---|---|---|---|
| Uruguay | DINAMIGE, OSE, MGAP | 472 | 15.1 |
| Brazil | CPRM | 175 | 6.7 |
| Total | DINAMIGE, OSE, MGAP, CPRM | 647 | 21.8 |
Table 4.
Numerical comparison between simulated and measured total runoff.
| Goodness-of-Fit Indicator | Calibration (2001–2004) | Validation (2005–2007) | Total Period (2001–2007) |
|---|---|---|---|
| R2 (-) | 0.89 | 0.89 | 0.88 |
| NSE (-) | 0.80 | 0.79 | 0.77 |
| ΔV (%) | 4.10 | −6.51 | 4.42 |
Table 5.
Parameters used for the calibration of the water-management model.
| Parameter | Range of Variation | Value Chosen | |
|---|---|---|---|
| Brazil | Uruguay | ||
| Average irrigation supply (m3/ha) | 10,000–14,500 | 12,000 | 14,500 |
| Planted-area risk (%) | 0–30 | 20 | 0 |
| Water-application return (%) | 0–30 | 0 | 20 |
Table 6.
United Nations (UN) Watercourses Convention factors [11] taken into account in the new framework.
Table 6.
United Nations (UN) Watercourses Convention factors [11] taken into account in the new framework.
| Article 6, UN Watercourse Convention’s Factors | ||||||||||
|---|---|---|---|---|---|---|---|---|---|---|
| (a) | (b) | (c) | (d) | (e) | (f) | (g) | ||||
| Natural/Environ. Factors | Social/Economic Needs | Population | Effects of The Uses | Existing and Potential Uses | Protection Watercour. | Availability of Alternatives | ||||
| New Scenario-Based Framework | Phase 1 | MGB-IPH model | √ | |||||||
| Phase 2 | Water use (SiGBaH-Irriga input) | √ | √ | √ | ||||||
| Water demand (SiGBaH-Irriga input) | √ | √ | √ | |||||||
| Irrigation-demand satisf. (SiGBaH-Irriga output) | √ | √ | √ | √ | ||||||
| Phase 3 | m1 criteria | DL | √ | |||||||
| LA | √ | √ | ||||||||
| SS | √ | |||||||||
| DRF | √ | |||||||||
| IA | √ | |||||||||
| LA/V | √ | √ | ||||||||
| V/A | √ | √ | ||||||||
| m2 criteria | I_DI | √ | √ | √ | √ | |||||
| E_DW | √ | √ | √ | √ | ||||||
| Q90 | √ | √ | ||||||||
| Phase 4 | WISA analysis | √ | √ | √ | √ | √ | ||||
Table 7.
Preference Ranking Organization Method for Enrichment Evaluations (PROMETHEE) ranking of the possible reservoir sites from the most equitable and reasonable to the least one (the colors are the same used in Figure 10 to represent the three clusters).
Table 7.
Preference Ranking Organization Method for Enrichment Evaluations (PROMETHEE) ranking of the possible reservoir sites from the most equitable and reasonable to the least one (the colors are the same used in Figure 10 to represent the three clusters).
| Rank | Action | ф | φ+ | φ− | |
|---|---|---|---|---|---|
| 1 | TCch1 |  | 0.2281 | 0.2794 | 0.0512 |
| 2 | TCch3 | | 0.1462 | 0.2098 | 0.0636 |
| 3 | TCp4 |  | 0.1249 | 0.2454 | 0.1204 |
| 4 | TCp2 | | 0.1127 | 0.2580 | 0.1453 |
| 5 | TCch5 | | 0.0484 | 0.1901 | 0.1417 |
| 6 | TCch4 | | −0.0373 | 0.1126 | 0.1500 |
| 7 | TCgr6 |  | −0.0697 | 0.1709 | 0.2406 |
| 8 | TCgr4 | | −0.0868 | 0.1109 | 0.1977 |
| 9 | TCch2 | | −0.2064 | 0.1538 | 0.3601 |
| 10 | TCgr5 | | −0.2602 | 0.1322 | 0.3923 |
Table 8.
Description of the two chosen scenarios.
| Scenario | Description |
|---|---|
| S0 | Baseline condition (current situation) |
| S1 | Water allocation in TCch1 (reservoir) |
Table 9.
Efficiency of water intakes (%) and comparison of the two selected scenarios.
| ID Water Intake | Country | S0 | S1 | S0–S1 |
|---|---|---|---|---|
| 73 | UY | 99.547 | 100.000 | −0.453 |
| 71 | UY | 94.054 | 96.239 | −2.185 |
| 72 | UY | 97.361 | 97.379 | −0.018 |
| 49 | UY | 93.714 | 93.589 | 0.125 |
| 29 | BR | 83.814 | 83.555 | 0.259 |
| 51 | UY | 83.625 | 83.365 | 0.261 |
| 30 | BR | 83.814 | 83.555 | 0.259 |
| 31 | BR | 74.922 | 74.588 | 0.334 |
| 32 | BR | 91.191 | 91.188 | 0.002 |
| 50 | UY | 91.121 | 91.119 | 0.002 |
| 33 | BR | 91.191 | 91.188 | 0.002 |
| 34 | BR | 91.191 | 91.188 | 0.002 |
| 36 | BR | 79.852 | 79.845 | 0.007 |
© 2019 by the authors. Licensee MDPI, Basel, Switzerland. This article is an open access article distributed under the terms and conditions of the Creative Commons Attribution (CC BY) license (http://creativecommons.org/licenses/by/4.0/).
Share and Cite
MDPI and ACS Style
Gorgoglione, A.; Crisci, M.; Kayser, R.H.; Chreties, C.; Collischonn, W. A New Scenario-Based Framework for Conflict Resolution in Water Allocation in Transboundary Watersheds. Water 2019, 11, 1174. https://doi.org/10.3390/w11061174
AMA Style
Gorgoglione A, Crisci M, Kayser RH, Chreties C, Collischonn W. A New Scenario-Based Framework for Conflict Resolution in Water Allocation in Transboundary Watersheds. Water. 2019; 11(6):1174. https://doi.org/10.3390/w11061174
Chicago/Turabian StyleGorgoglione, Angela, Magdalena Crisci, Rafael H. Kayser, Christian Chreties, and Walter Collischonn. 2019. "A New Scenario-Based Framework for Conflict Resolution in Water Allocation in Transboundary Watersheds" Water 11, no. 6: 1174. https://doi.org/10.3390/w11061174
Note that from the first issue of 2016, this journal uses article numbers instead of page numbers. See further details here.