Extreme Precipitation in China in Response to Emission Reductions under the Paris Agreement


Key Laboratory of Land Surface Pattern and Simulation, Institute of Geographic Sciences and Natural Resources Research, Chinese Academy of Sciences, Beijing 100101, China
*
Author to whom correspondence should be addressed.
Water 2019, 11(6), 1167; https://doi.org/10.3390/w11061167
Submission received: 21 May 2019
/
Revised: 30 May 2019
/
Accepted: 31 May 2019
/
Published: 4 June 2019
(This article belongs to the Special Issue Statistical Analysis and Stochastic Modelling of Hydrological Extremes)
Abstract
:To avoid more severe impacts from climate change, countries worldwide pledged to implement intended nationally determined contributions (INDCs) for emission reductions (as part of the Paris Agreement). However, it remains unclear what the resulting precipitation change in terms of regional extremes would be in response to the INDC scenarios. Here, we analyzed China’s extreme precipitation response of the next few decades to the updated INDC scenarios within the framework of the Paris Agreement. Our results indicate increases in the intensity and frequency of extreme precipitation (compared with the current level) in most regions in China. The maximum consecutive five-day precipitation over China is projected to increase ~16%, and the number of heavy precipitation days will increase as much as ~20% in some areas. The probability distributions of extreme precipitation events become wider, resulting in the occurrence of more record-breaking heavy precipitation in the future. We further considered the impacts of precipitation-related extremes and found that the projected population exposure to heavy precipitation events will significantly increase in almost all Chinese regions. For example, for heavy precipitation events that exceed the 20 year baseline return value, the population exposure over China increases from 5.7% (5.1–6.0%) to 15.9% (14.2–16.4%) in the INDC-pledge scenario compared with the present-day level. Limiting the warming to lower levels (e.g., 1.5 °C or 2.0 °C) would reduce the population exposure to heavy precipitation, thereby avoiding impacts associated with more intense precipitation events. These results contribute to an improved understanding of the future risk of climate extremes, which is paramount for the design of mitigation and adaptation policies in China.
1. Introduction
In recent decades, a large number of climate extremes related to precipitation have been observed in conjunction with global warming, for example, flood events in the entire Yangtze River Basin in 1998 [1] and the heaviest rainfall in Beijing in 2012 [2], which caused great damages. Variations in the temperature, atmospheric moisture, precipitation, and atmospheric circulation have been observed; meanwhile, the moisture-holding capacity has been increasing at a rate of ~7%/°C with increasing temperature, which further alters the precipitation extremes as well as the hydrological cycle [3,4]. However, the changes of the water cycle projected for the future, including prominent regional and seasonal differences in response to climate change, are far more complex than projected temperature changes [5]. Precipitation-related extremes are among the most relevant consequences of a warmer climate. Therefore, it is crucial to more accurately project future precipitation extremes at regional scales. In China, agriculture heavily depends on the hydrological cycle; a variety of precipitation changes may affect different regions of China because of the diverse climate types. So, regional assessments of extreme heavy precipitation risks and impacts that could be avoided by limiting the warming to a lower level are critical for the design of adaptation and mitigation policies.
In the Paris Agreement, a goal was set to keep the mean global warming well below 2.0 °C above the preindustrial level and make efforts to limit the warming to 1.5 °C [6,7]. To achieve this goal, countries participating in the Paris Agreement submitted national mitigation plans in the form of Intended Nationally Determined Contributions (INDC). A total of 192 countries have reported their respective INDC mitigation targets to the United Nations, as of Dec. 2018. The bottom-up approach in using national efforts reflecting the willingness of each country to reduce their emissions is easier to implement because it avoids the divergence of different countries from the distribution quota [8].
Future emissions are the key factors in determining the climate impacts of the next few decades. Recently, researchers have paid increased attention to changes in the extreme precipitation at the 1.5 °C and 2.0 °C warming levels and the benefits of limiting the global warming to 1.5 °C rather than 2.0 °C [9,10,11,12]. A preliminary synthesis is included in Chapter III of the Intergovernmental Panel on Climate Change (IPCC) 1.5 °C report [13]. However, these studies are based on idealized emission pathways to reach the 1.5 °C and 2 °C global warming targets [14,15,16] that are hard to achieve. Some studies have also focused on the mean global warming response to INDC emission reduction. For example, Rogelj et al. [15] and CAT [16] evaluated the impact of INDC emission reduction commitments on mean global warming. The “Emissions Gap Report” released by UNEP [17] evaluated the gap between INDC emissions and the 2 °C target. There is still a lack of evaluations of the potential changes in regional precipitation and extreme events under INDC emission pledges. Therefore, the risks associated with future changes in the extreme precipitation are still unclear.
In this study, we analyzed China’s extreme precipitation response of the next few decades to emission reductions based on the INDC under the Paris Agreement using an ensemble of state-of-the-art global climate models from the Fifth Coupled Climate Model Intercomparison Project (CMIP5). We further explored the exposure to extreme precipitation events under the INDC emission scenarios by considering the potential socioeconomic impacts of future climate change. The results of the 1.5 °C/2.0 °C scenario are shown as reference.
2. Data and Methods
2.1. Emission Scenarios
We used two categories of emission scenarios: (1) the 1.5 °C and 2.0 °C target scenarios under the Paris Agreement and (2) the INDC scenarios. The 1.5 °C/2.0 °C target scenarios were derived from the AR5 (Fifth Assessment Report) and 1.5 °C special report of the IPCC, respectively [18,19]. The INDC scenarios are based on emissions data submitted by 192 countries according to the Paris Agreement. The INDC dataset is continuously updated and can be obtained from the United Nations Framework Convention on Climate Change (UNFCCC) website [20]. The emission targets reported by different countries include a range of absolute emission targets to those relative to a base year level or emission reduction targets relative to a baseline emission scenario. We analyzed and extracted the emission targets of each country.
Simulations of future emissions based on 28 socioeconomic models were used to extend the INDC scenarios to the end of this century. Several key features (the rate of decarbonization, carbon capture, storage technology (CCS), energy structure improvement, and time to carbon neutralization) were considered. In this study, we considered many possible interpretations of “INDC mitigation actions” based on the IPCC AR5 Scenario Database (https://secure.iiasa.ac.at/web-apps/ene/AR5DB/). We used scenarios that conform to the 2030 GHG emission levels, which are in agreement with the INDC (50–56 Gt CO2eq/year) scenarios. Considering future difficulties and uncertainties with respect to carbon removal technology, we used a conservative approach regarding the future availability of negative emission technologies and scenarios based on which CCS > 15 Gt CO2eq/year was eliminated. The emission pathways were classified into six groups based on several key characteristics (e.g., the emission targets for specific years, renewable energy structure, and amount of CCS), as shown in Text S1 and Figure S1. In this study, we focused on Groups III and IV, which represent the INDC “continued action” scenario, and compared the results with that of the 1.5 °C/2.0 °C target scenario.
Subsequently, we evaluated the global mean warming level under INDC “continued action” scenarios. Based on the 78 climate sensitivity experiments from the earth system models (ESMs) ensemble of CMIP5 [21], we assessed the possible corresponding global mean temperature rise [22,23]; we also integrated several other studies (temperature rise levels for some pathways have been provided) [14,15,17,23]. After a comprehensive assessment, we determined 2.9~3.3 °C (median 3.1 °C) as the most likely range of temperature increase for the “continued action” pathways of INDCs.
2.2. Data Description
To better project precipitation extremes, 14 state-of-art CMIP5 GCMs were adopted in this study [21]. The model details are provided in Text S2. For further analyses, all model data were interpolated to a common 1° × 1° horizontal grid using a bilinear interpolation method. The ability of these CMIP5 models to simulate precipitation extremes was assessed using a daily gridded observation dataset CN05.1 (0.5° × 0.5°) established by the China Meteorological Administration, which was obtained at 2416 observation stations and covers the period of 1961–2013 [24]. The assessment results show the validation of these models for simulations of precipitation. It has been widely used in many studies of precipitation extremes across China [25,26].
To estimate the space pattern of precipitation change, we used a time-slice approach [10,27,28] where the spatial state at a specific warming point related to (or 1.5 °C, 2.0 °C) was separately derived from decadal time slices with the respective mean warming for each model. For the detailed analysis process, please refer to Text S3, Figures S2 and S3. The multi-model ensemble (MME) was calculated based on equal weights.
The period of 1985–2005 is referred to as the present-day period. The preindustrial period in this study is 1861–1900.
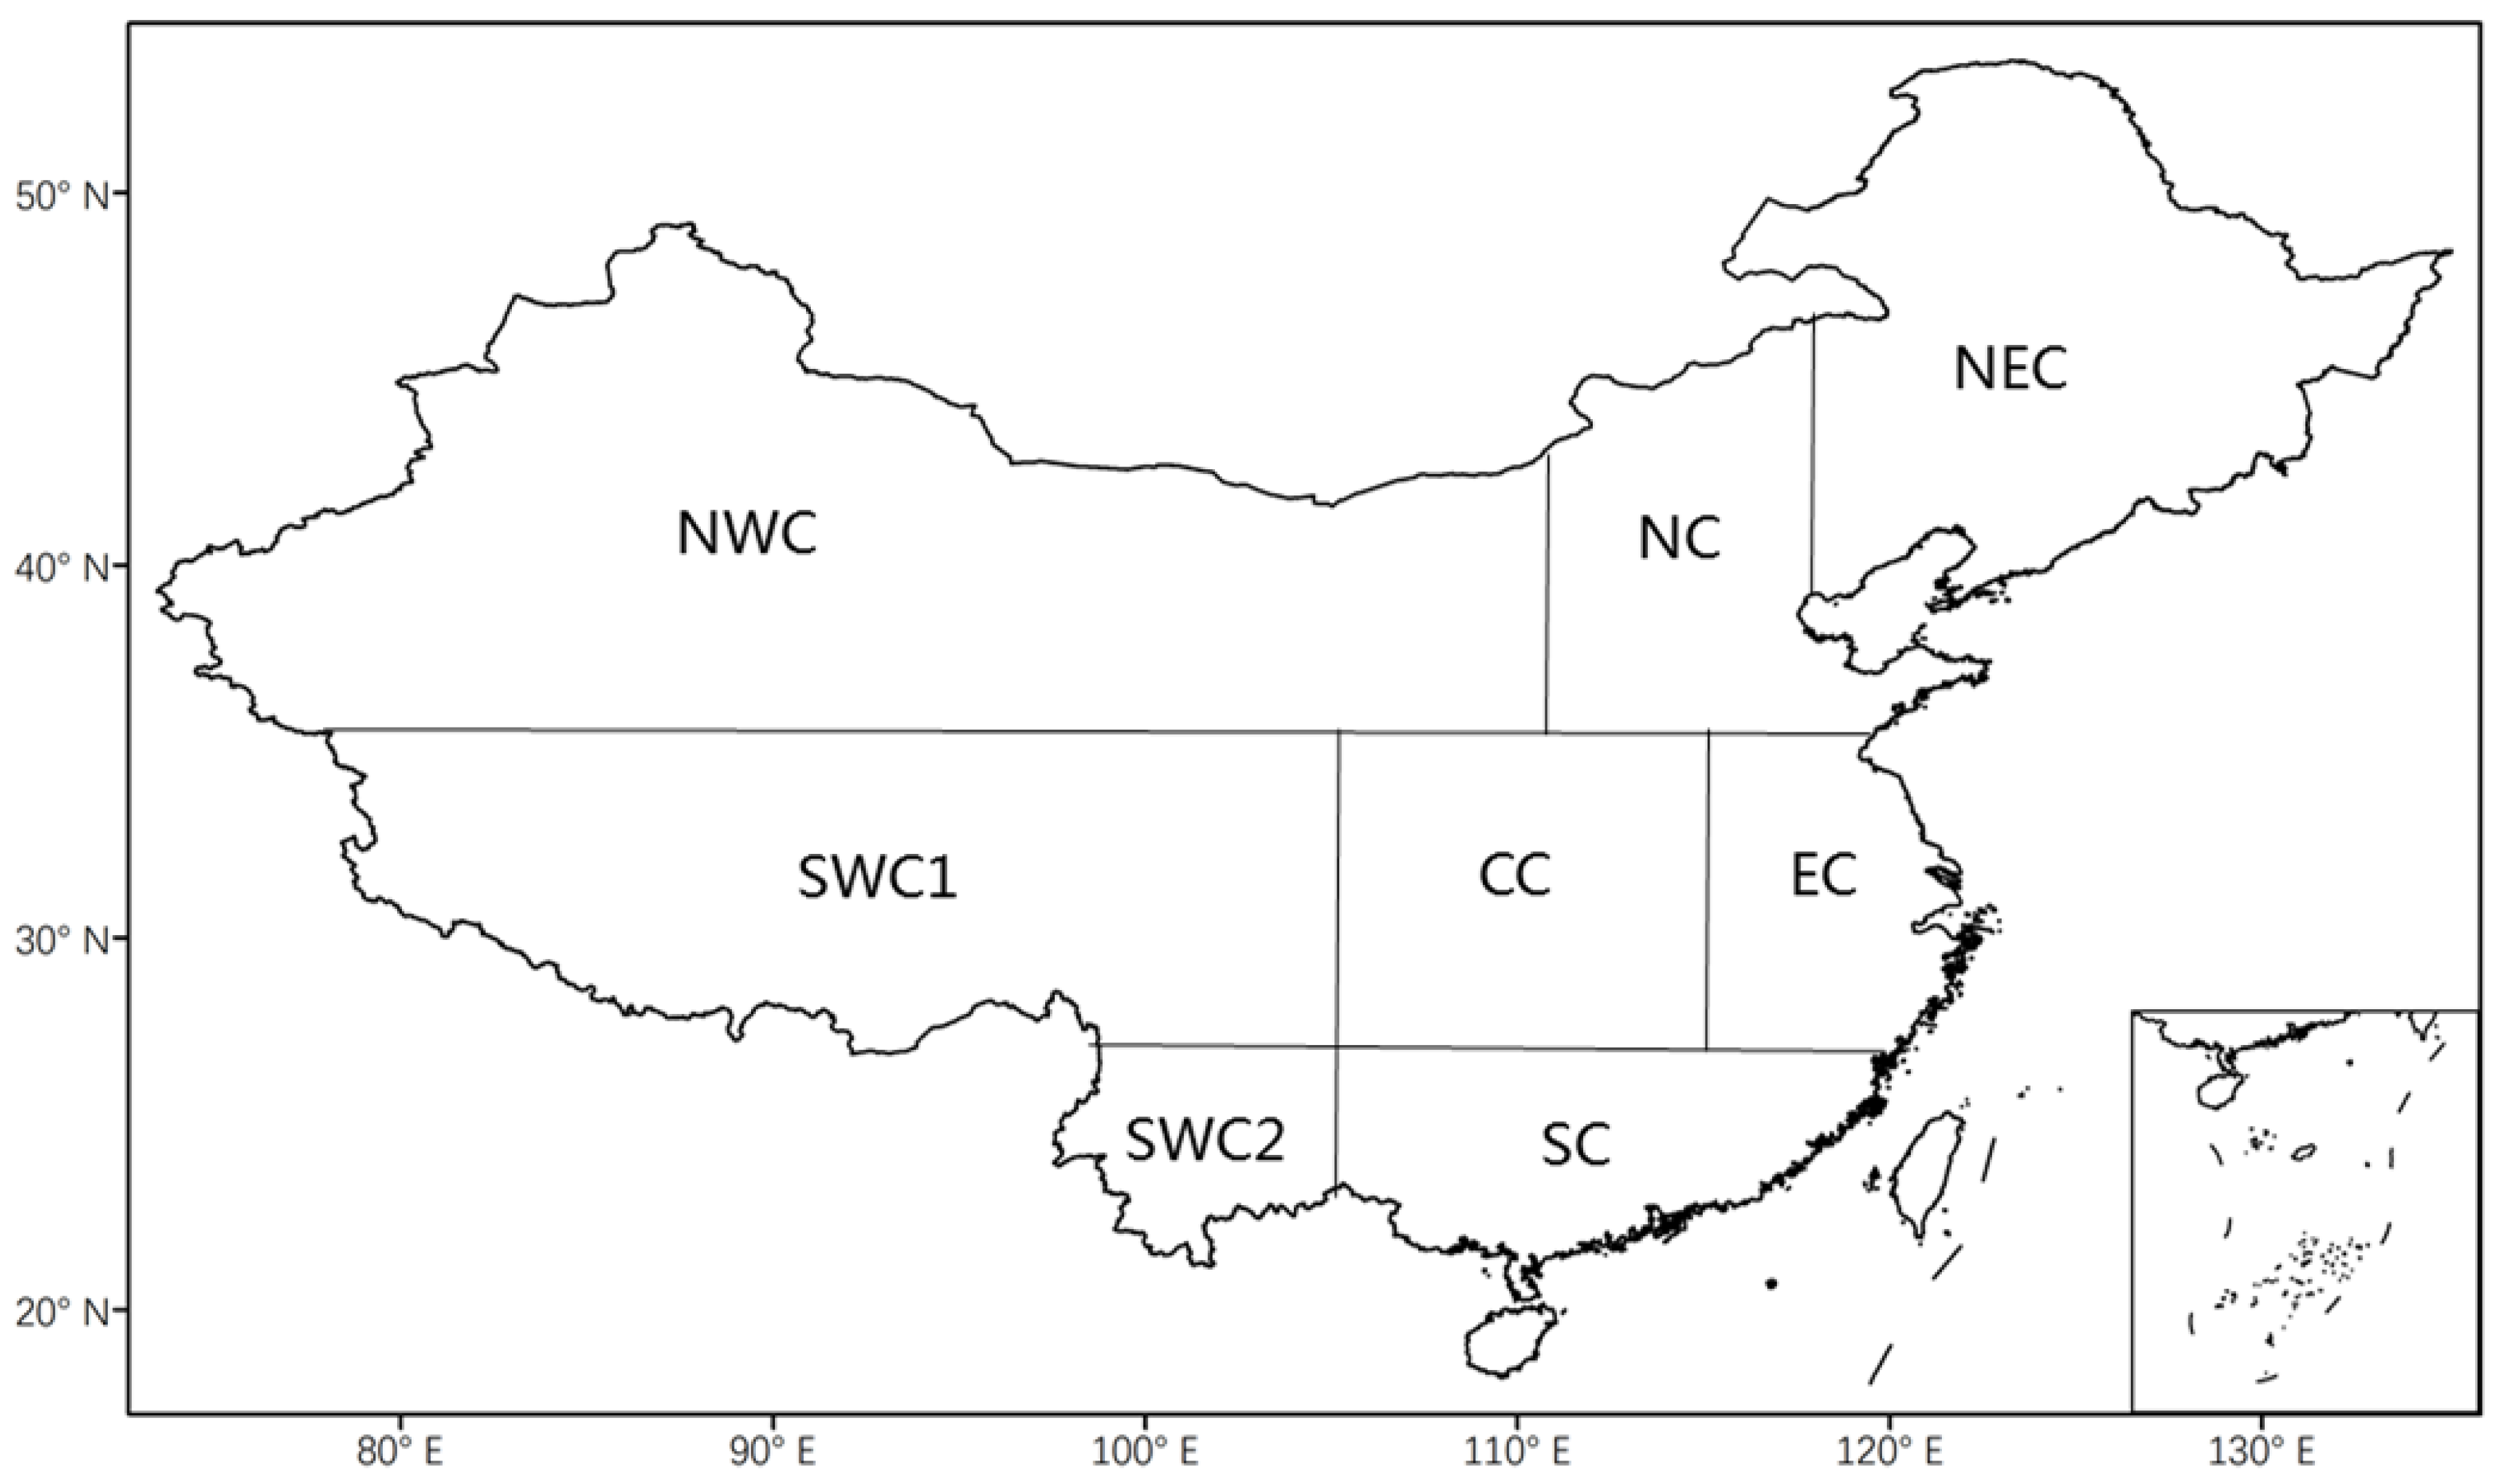
Climate extremes are largely affected by distinct topography. To investigate the characteristics of future regional changes in the precipitation extremes, the country has been divided into eight subregions based on geographical conditions and climatic features (Figure 1). Detailed information regarding these eight subregions is provided in Text S4.
2.3. Extreme Precipitation Indices
It is difficult to provide a universally valid definition of extreme precipitation because of the diversity of climates worldwide. In general, the indices established by the Expert Team on Climate Change Detection and Indices (ETCCDI) are adopted in most studies of global precipitation extremes and the extreme events can be defined using either relative or absolute thresholds [29]. Here, two precipitation indices recommended by the ETCCDI, that is, Rx5day and SDII, which have been widely used in many studies, have been selected to represent the intensities of precipitation extremes. In China, the precipitation can be divided into the following five categories: trace rain (0.1–1.0 mm/day), light rain (1.0–10 mm/day), medium rain (10–25 mm/day), large rain (25–50 mm/day), and heavy rain (≥50 mm/day); these categories have been widely used in previous research in the country [30,31]. Heavy and severe rainstorms in China are traditionally defined as events with daily precipitation values larger than 25, 50, or 100 mm [32]. In this study, the absolute threshold of 25 mm/day was chosen to define a precipitation extreme. The R25 represents the cumulative number of days during which the daily precipitation exceeds the 25 mm threshold.
Thus, three extreme precipitation indices have been adopted in this study to investigate the changes in the frequency and intensity of heavy rainfall in China. The detailed definitions of these indices are provided in Table 1. The evaluation of 14 CMIP5 models based on these indices is summarized in Text S2.
To quantitatively express the occurrence probability of extreme events, we used the following risk ratio (RR):
where is the probability of reaching a specific present-day intensity (5% is used in this paper), is the corresponding probability of reaching this temperature intensity in future scenarios, and indicates an increased risk of extreme events.
The Wilcoxon rank sum test was applied to identify if there is a statistical significance of differences between two warming levels based on multi-model results. We further assessed the signal-to-noise ratio (SNR), expressed as the significance of the change compared with the internal variability.
2.4. Exposure and Avoided Impacts
Extreme events that substantially deviate from their climatology can result in the greatest losses. Climate change risks are determined based on the hazards, vulnerability, and exposure of the human society and natural ecosystems according to IPCC reports [33]. Climate extreme indices (e.g., Rx5day) are used to characterize the hazard intensity. For further analyses, we defined dangerous extreme events as those exceeding specific return values (RV) compared with the 1961–2005 baseline and quantified the changes in the exposure to dangerous extreme precipitation under different scenarios.
We fitted a generalized extreme value (GEV) distribution to the RX5day in 1961–2005 on the native grids of each model using the method of maximum likelihood [34]. The cumulative distribution function of GEV is given by
where μ is the location parameter, σ is the (positive) scale parameter, and ξ is the shape parameter. These parameters are estimated by the method of maximum likelihood. Considering that the noise in changing patterns of extreme precipitation stems from sampling, the GEV parameter estimates of the extreme precipitation are smoothed spatially. This is done by smoothing the estimated GEV parameters at each grid point by its eight surrounding neighbors [35]. Then, the return values (RV) are obtained by inverting the fitted GEV distributions derived from the smoothed parameters. The different level RVs from the baseline are derived on the native grid points for each model. Finally, exposures to these dangerous extremes under different scenarios are estimated, and the area (population) that experiences RX5day events exceeding the threshold for danger is aggregated spatially to represent the total area (population) exposed. Population exposure is estimated on the population distribution projected under different socioeconomic development scenarios of Shared Socioeconomic Pathways (SSPs) [36]. The vulnerability of socioeconomical systems is not discussed in this study, thus the results of exposure only reflect the risk of physical climate change.
In addition, we investigated the avoided impacts at different levels of warming, which correspond to different mitigation policies. The impacts in terms of exposure induced by warming are quantified using the 1985–2005 present-day levels:
where E stands for the exposure and the subscript k indicates different warming levels based on different scenarios (1.5 °C, 2.0 °C, and INDC). Thus, the impacts avoided by less warming can be derived as the difference between the impacts at the two levels.
3. Results
3.1. Changes in the Extreme Precipitation Indices
We first evaluated the model performance; while the general features of the observed temperature indices were reasonably reproduced by the model, moderate biases were evident (Text S5, Figures S4 and S5).
The changes in the three annual extreme precipitation indices over China and eight subregions (Text S4) until the end of the century exhibit contrasting patterns in terms of the signal strength and robustness (Figure 2 for Rx5day, Figure 3 for R25, and Figure 4 for SDII). The national averages and relative differences between the various sets of scenarios are shown in Figure 5. These results reveal similar increases for all indices and indicate that heavier precipitation will be more frequent and intense when higher warming thresholds are crossed.
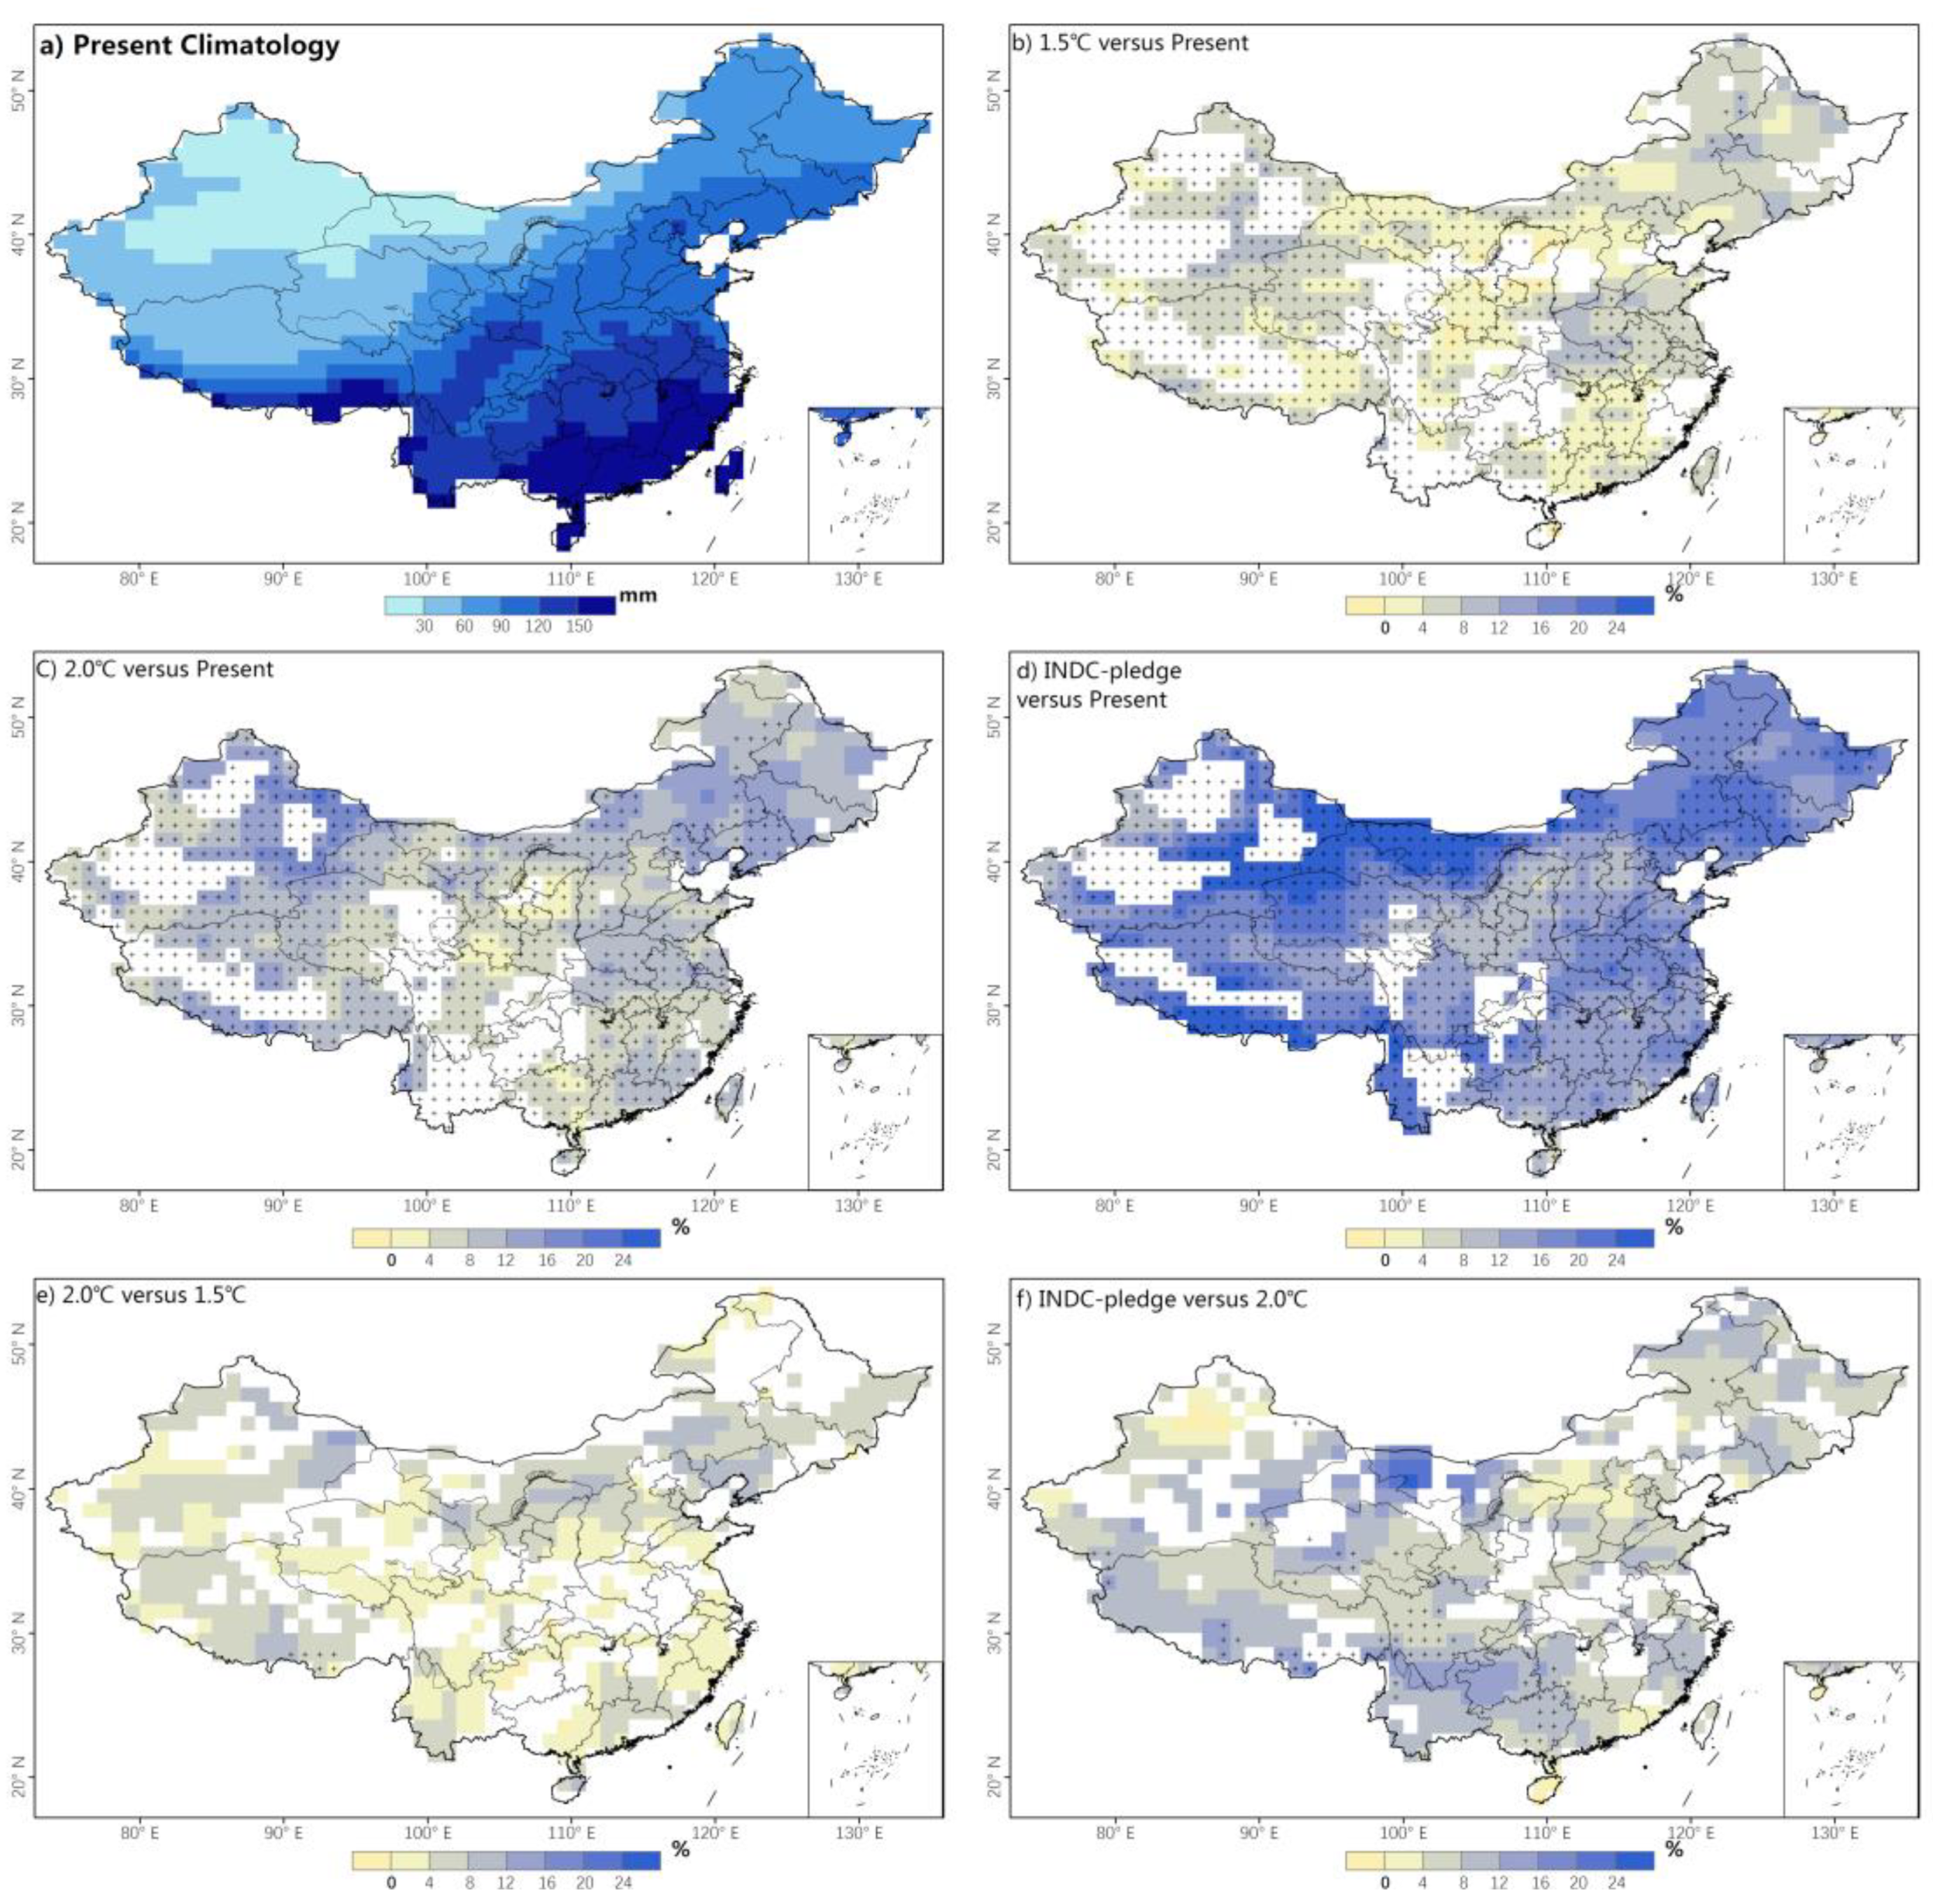
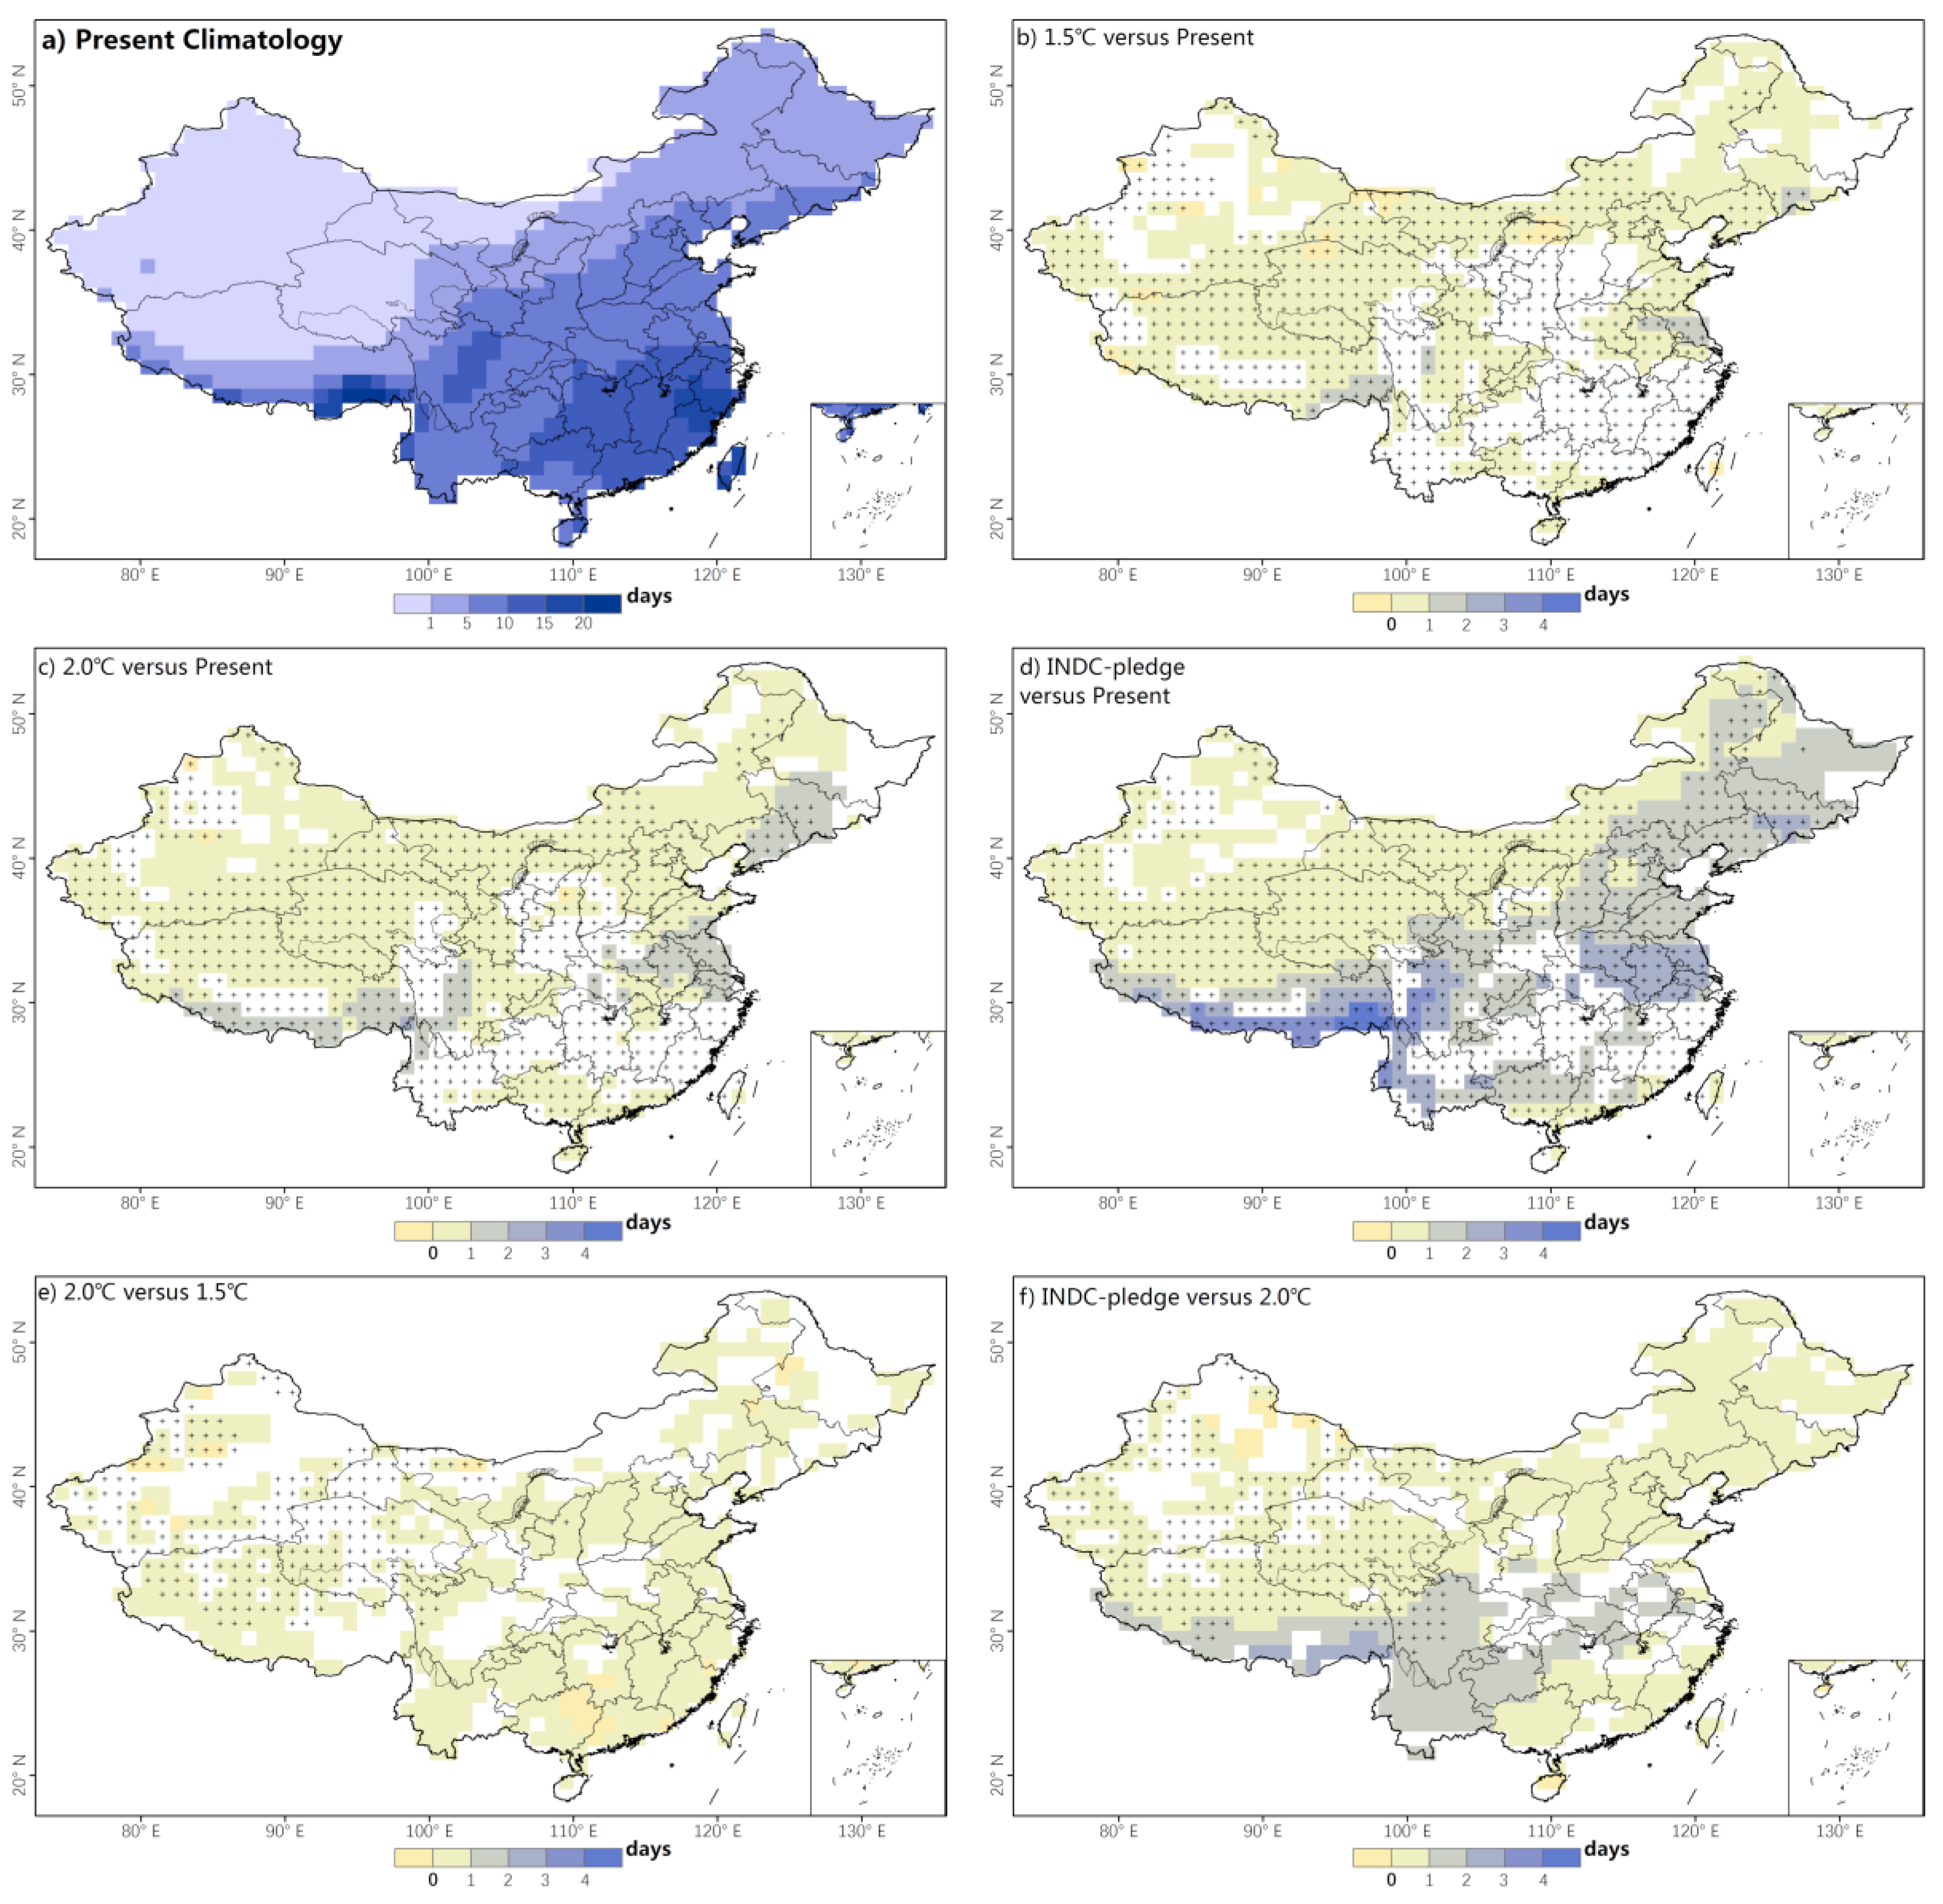
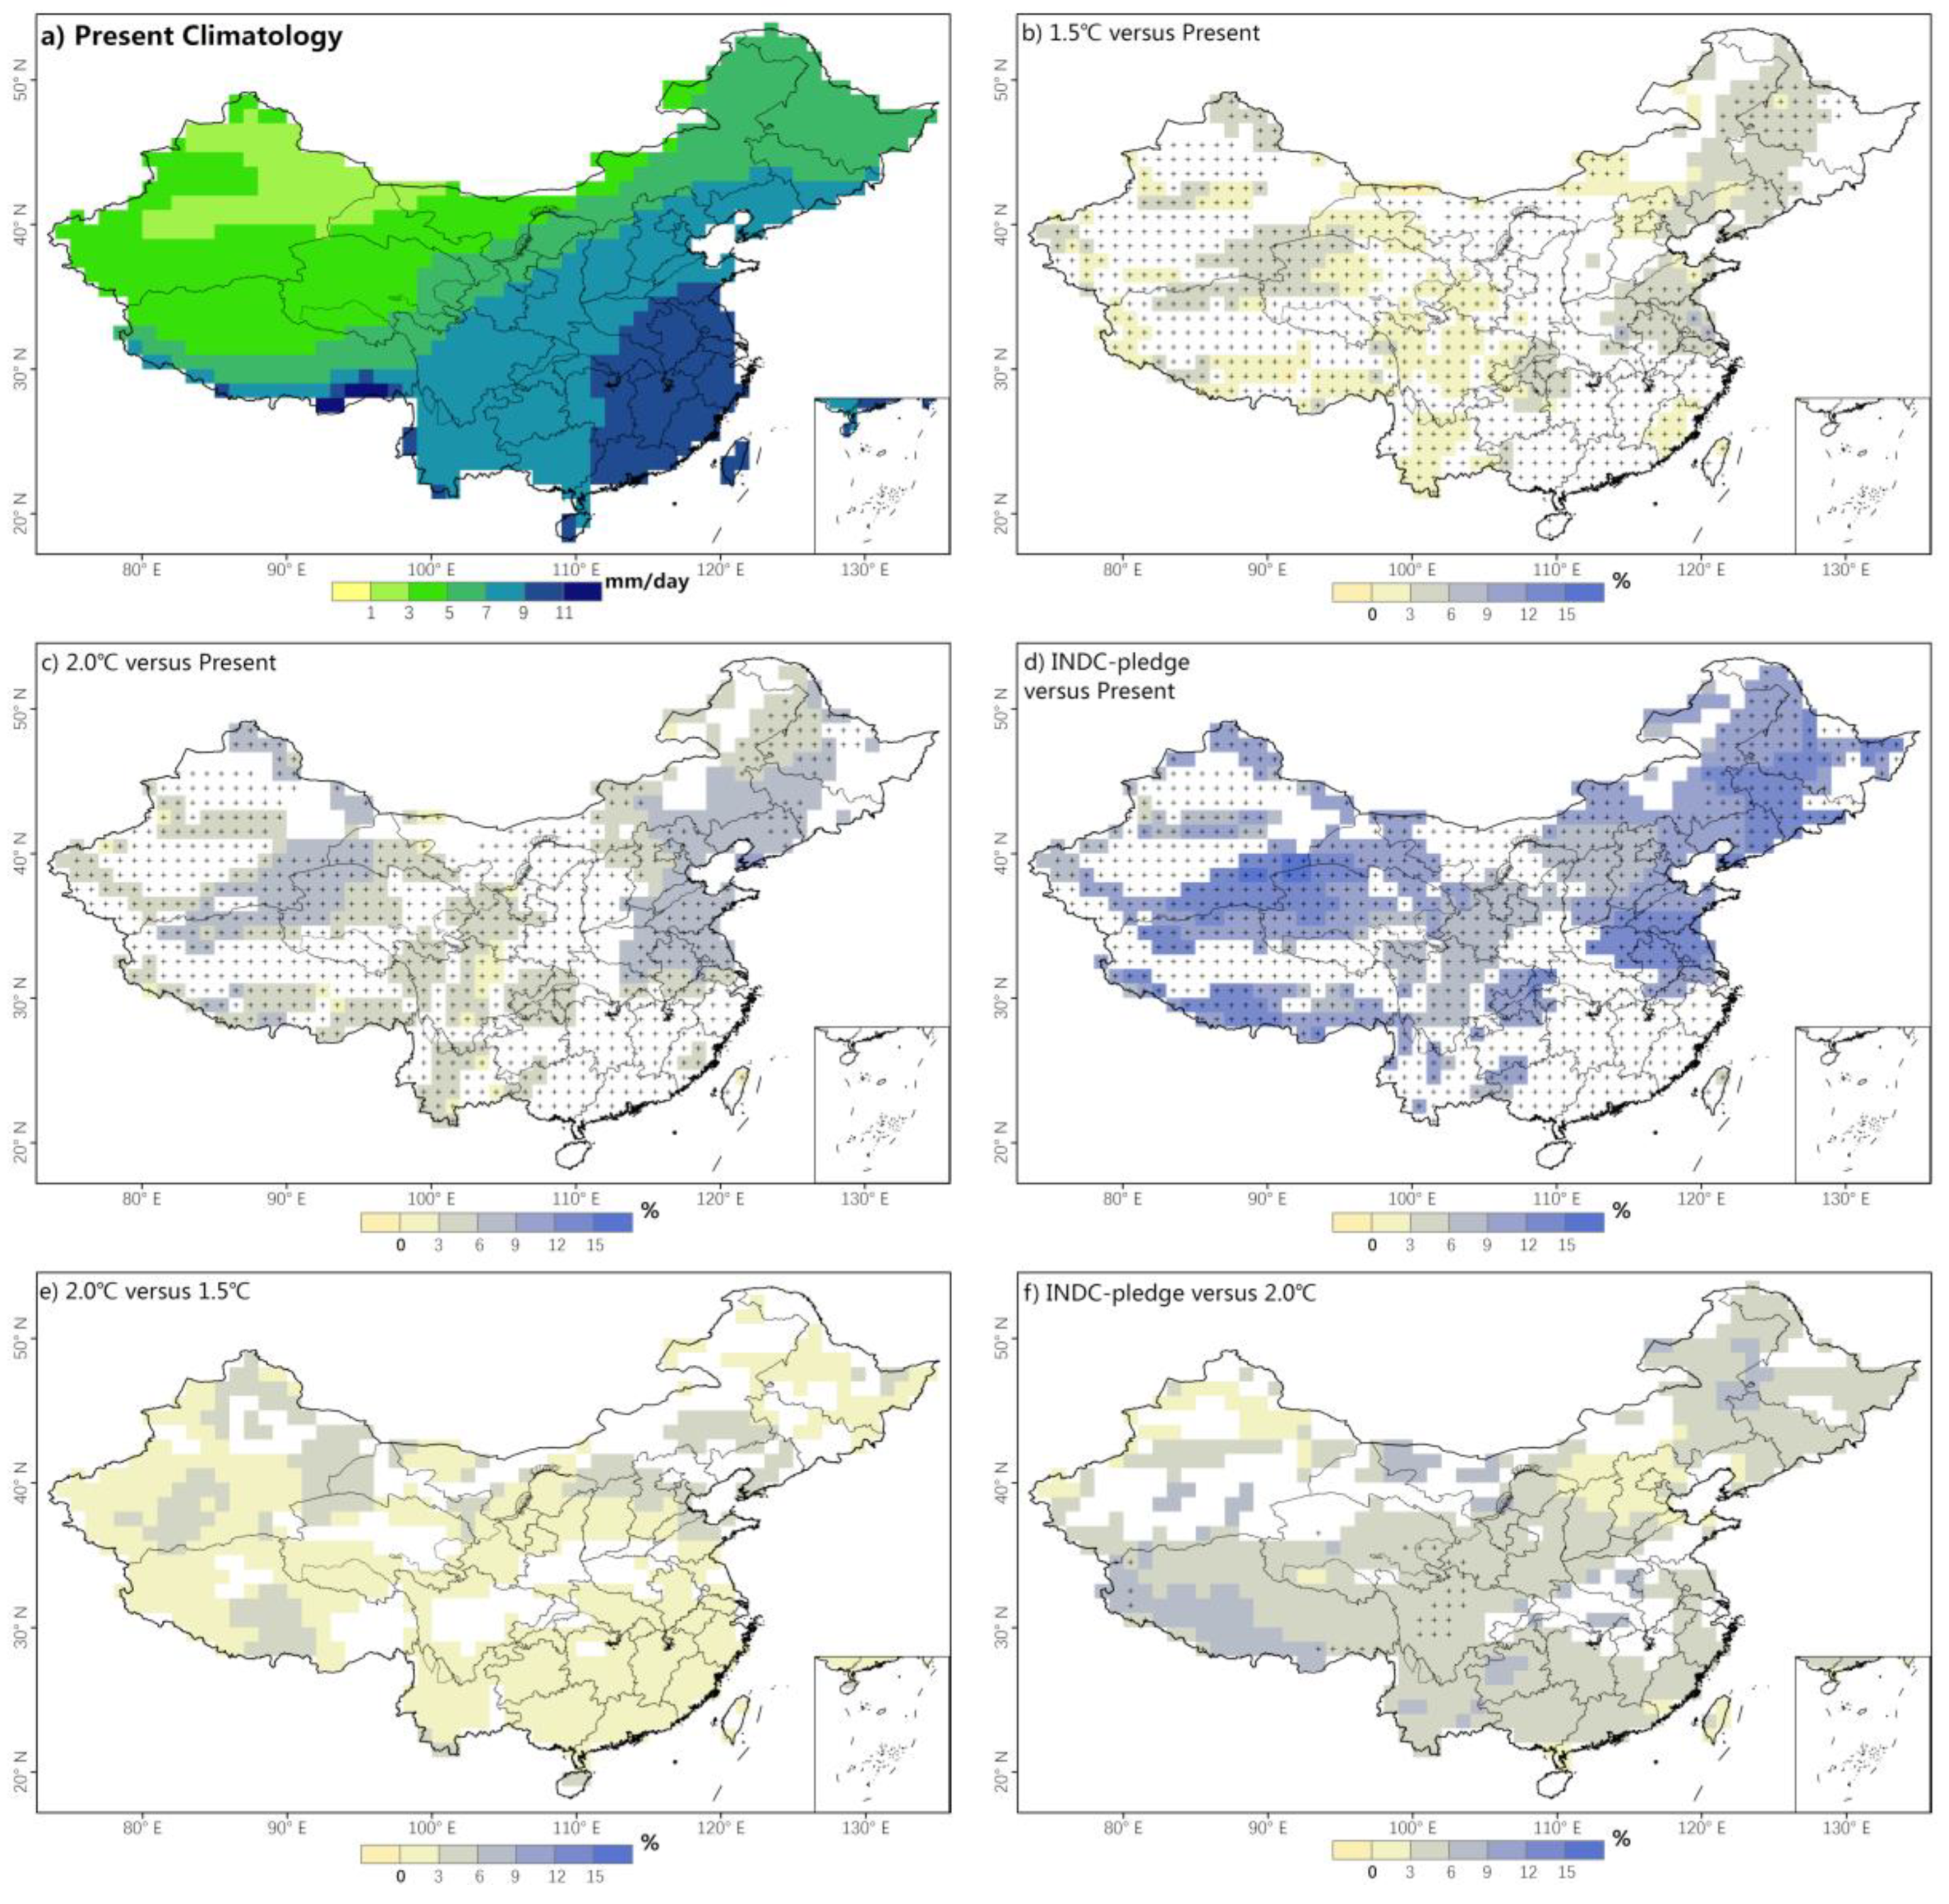
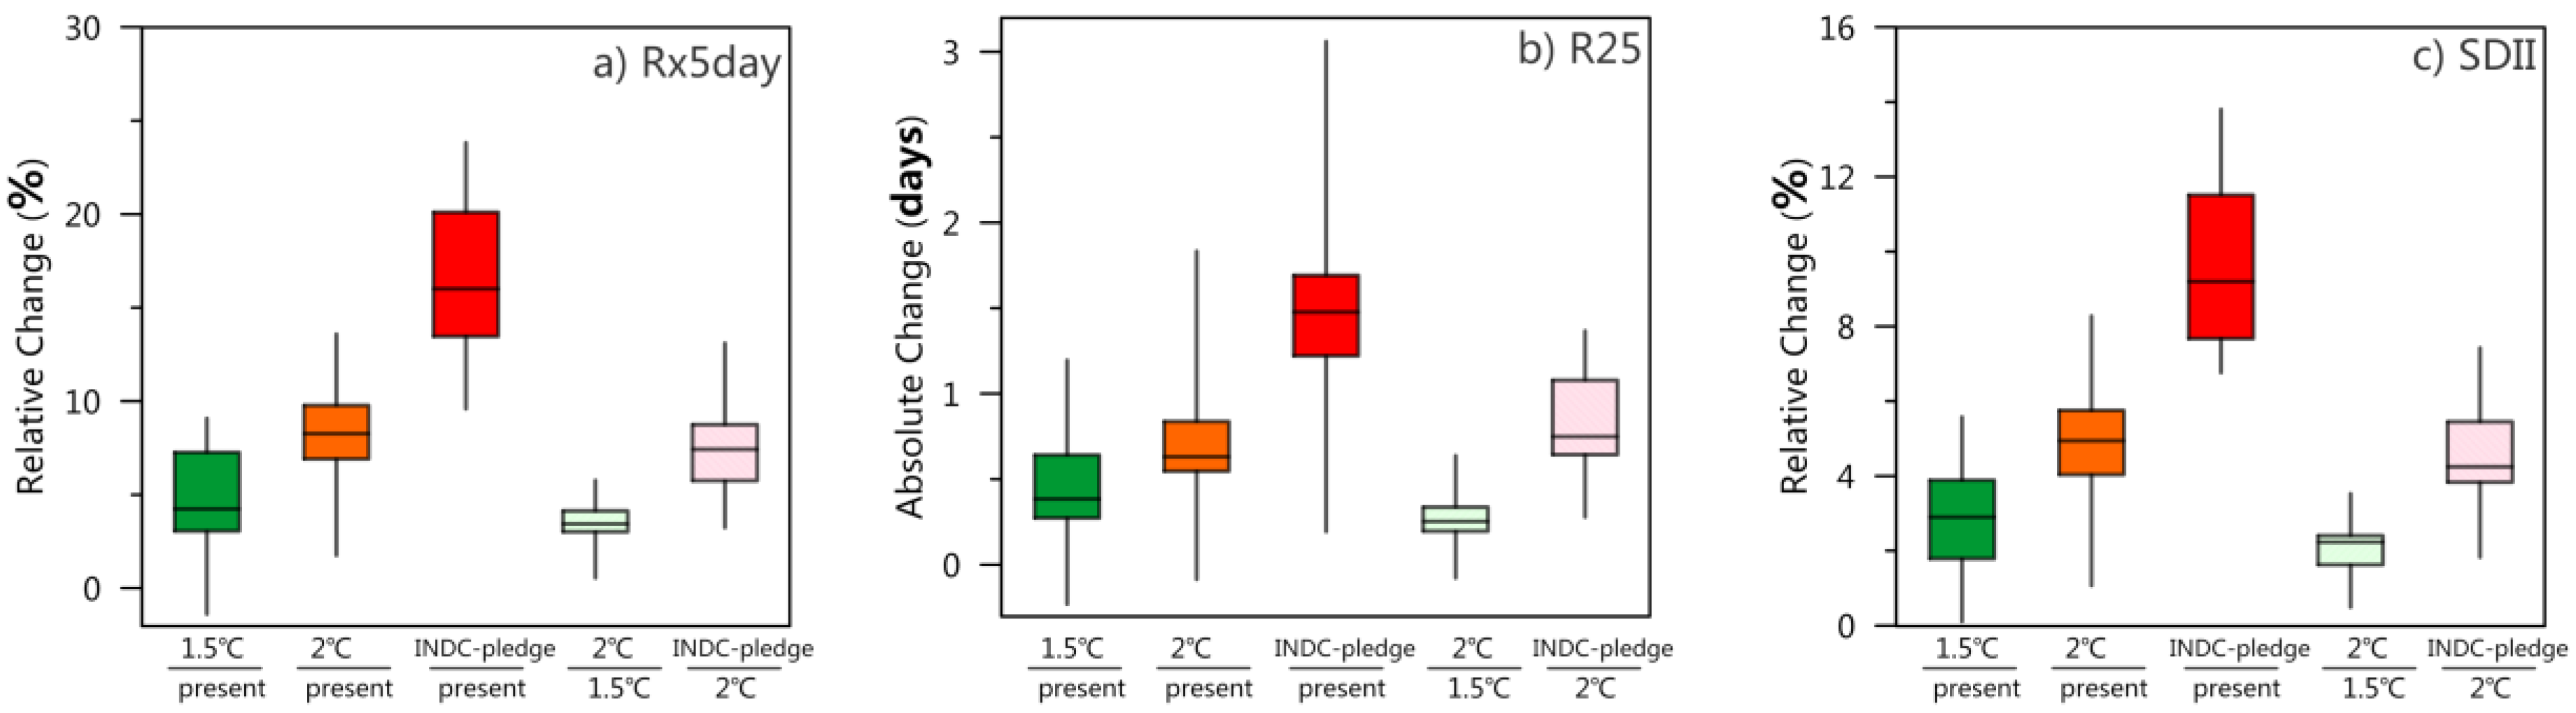
The intensity and frequency of extreme precipitation consistently increase in most regions of China, but the magnitudes of the changes are widespread across different subregions and models. Specifically, the Rx5day over China will increase by 4.2% (3.1–7.3%; range of the 25–75% confidence interval) in the 1.5 °C scenario, by 8.3% (6.9–9.8%) in the 2.0 °C scenario, and by 16.0% (13.5–20.1%) in the INDC-pledge scenario compared with the present-day baseline. The spatial patterns of changes of the SDII index are similar, but the magnitudes are smaller. Hotspots, that is, locations in which the increase in the intensity of extreme precipitation is the most prominent, are observed in the Huang–Huai River Valley, Northeast China, and northern and southern periphery of the Tibetan Plateau. In terms of the increase in the frequency of heavy precipitation, the R25 indices in the southeastern periphery of the Tibetan Plateau and Yangtze–Huai River Valley are projected to exhibit the greatest rates (for example, under the INDC, the increase in the R25 in those areas is ~3–4 days compared with the present-day level), while the vast eastern monsoon region of China will experience slight increases in the number of heavy precipitation days. The daily precipitation in arid areas in western China hardly exceeds 25 mm.
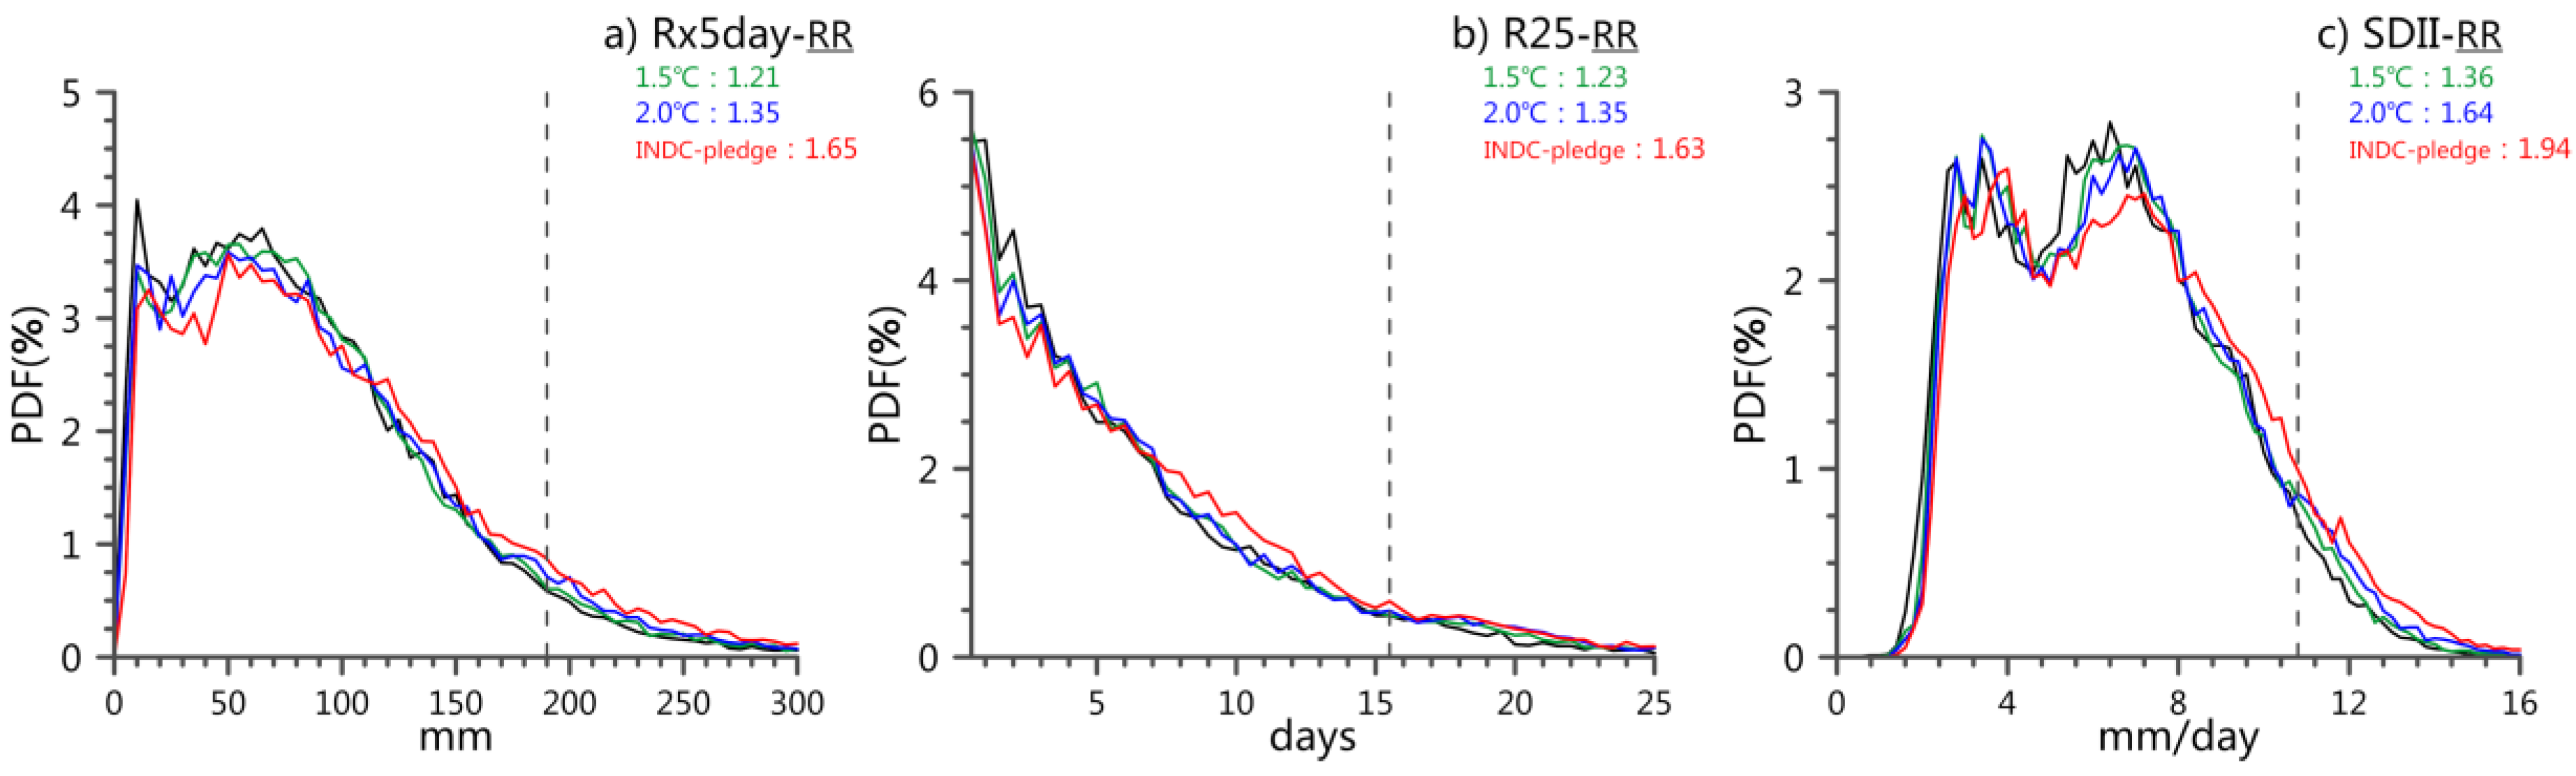
The change of the extreme precipitation indices can be shown more intuitively in probability density (frequency distribution) diagrams (Figure 6). The probability density curves of three extreme precipitation indices over China only slightly change, indicating insignificant changes in the mean value of extreme precipitation associated with global warming. However, the shape of the curves becomes wider, suggesting increases in the standard deviations of the three indices. In particular, the probability of record-breaking heavy precipitation occurring in China increases, despite a relatively small rise in the mean value. The RR shows a stronger increase with global warming, which confirms the above-mentioned proposition. Note that the s in the East Asian Monsoon Region are significantly larger than the national average (Figures S9–S11).
The uncertainties related to the projected precipitation extremes were quantified using the coefficient of variation () between the models. Figure S12 shows that the spatial pattern of under different scenarios is similar. Compared with other regions, the value is much larger in the South China, Xinjiang Autonomous Region, and the southeastern edge of the Tibetan Plateau. It’s noticed that is only a quantification of climate model uncertainty.
3.2. Changes in the Exposure to Precipitation-Related Extremes
To further analyze the possible impact of future precipitation-related extremes, we defined dangerous extreme events as those exceeding the 10 and 20 year RVs compared with the present-day baseline (1961–2005) The 10 and 20 year thresholds represent different levels of danger. Here, we only show the population exposure estimated from the projected population for 2100 under the SSP2 scenario [36]. The results of the population exposures based on projections under other SSP scenarios are qualitatively similar. The evolution of the exposure (especially population-weighted density of the exposure) depending on the warming levels indicates the probability of the human system being impacted by these dangerous extremes.
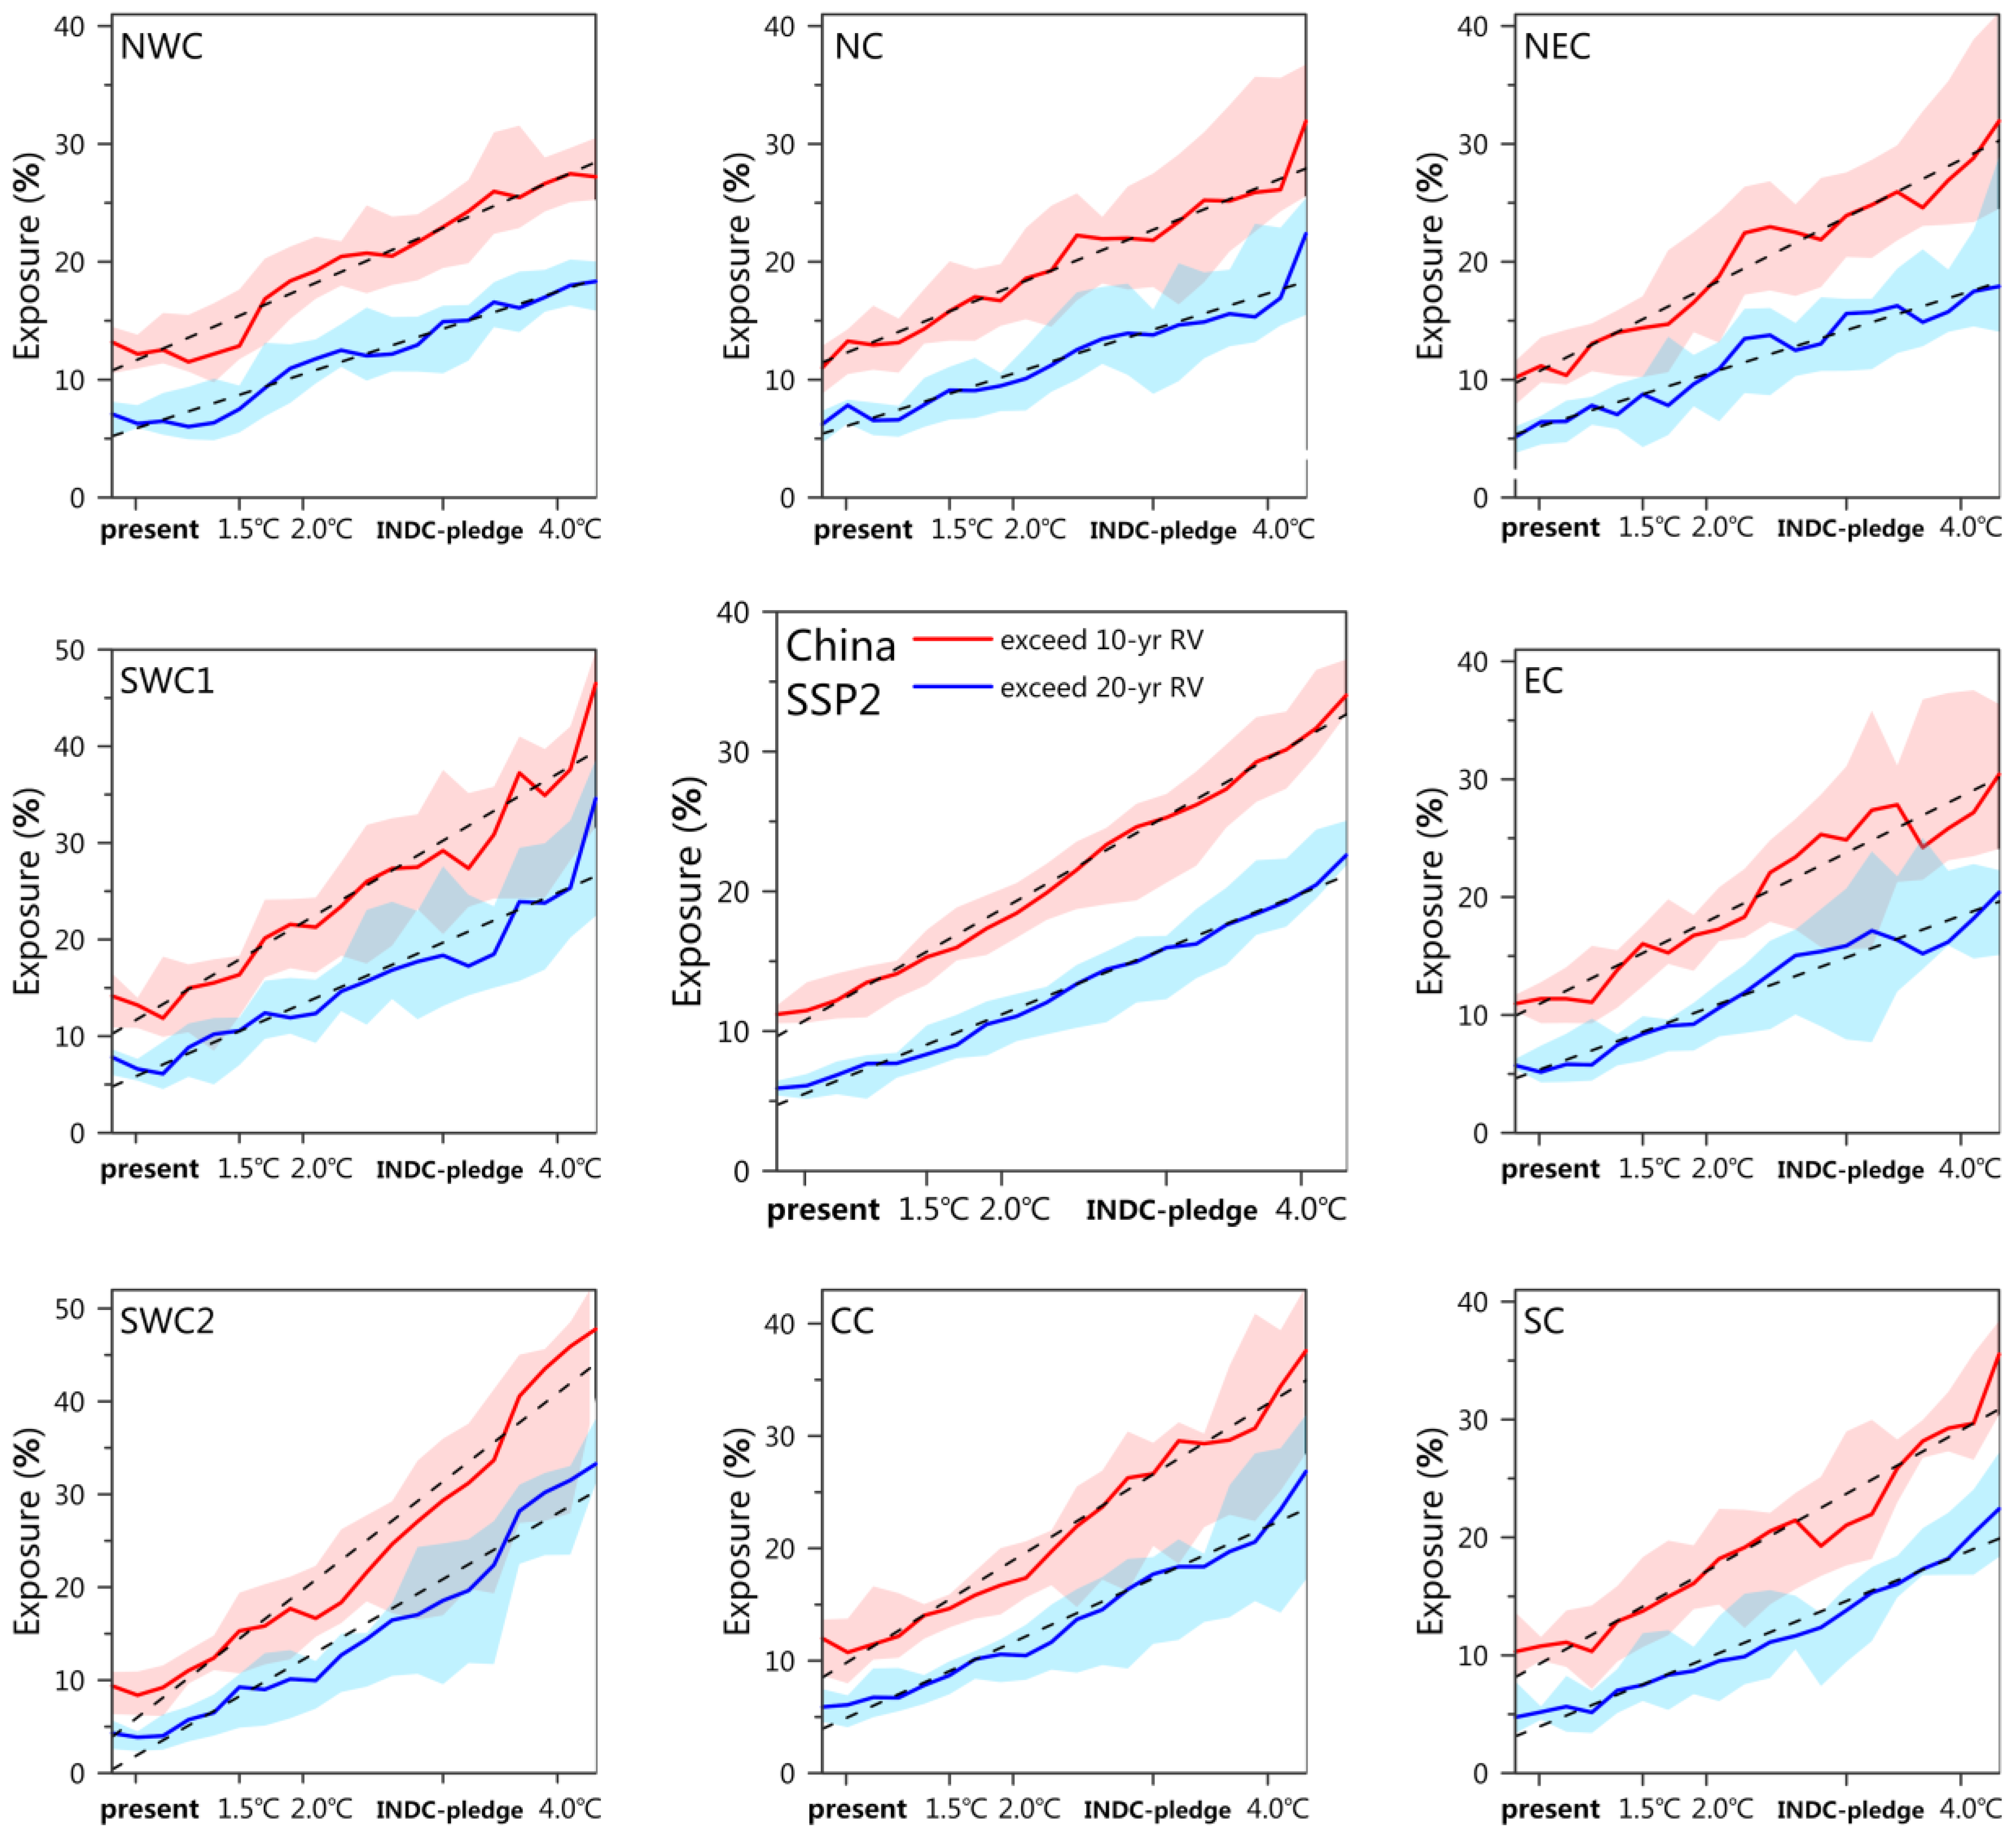
China and its subregions will be exposed to these events of different RV increases consistently with global warming, and record-breaking events will be more frequent (Figure 7). For example, for heavy precipitation events that exceed the 20 year baseline RV, the population exposure over China increases by 5.7% (5.1–6.0%) to 8.4% (7.5–9.5%) in the 1.5 °C scenario, by 10.6% (8.7–11.2%) in the 2.0 °C scenario, and by 15.9% (14.2–16.4%) in the INDC-pledge scenario compared with the present-day level. An approximately linear increase in the exposure to mean global warming can be observed in all regions, although the degrees of approximation to linear equations varies among the eight subregions (Figure 7). Population exposures in the Tibetan Plateau and Southwest China (SWC1 and 2) are notably higher than in other regions; however, the exposure in those two subregions shows a greater intermodel variability.
3.3. Impacts Avoided in Low-Warming Scenarios
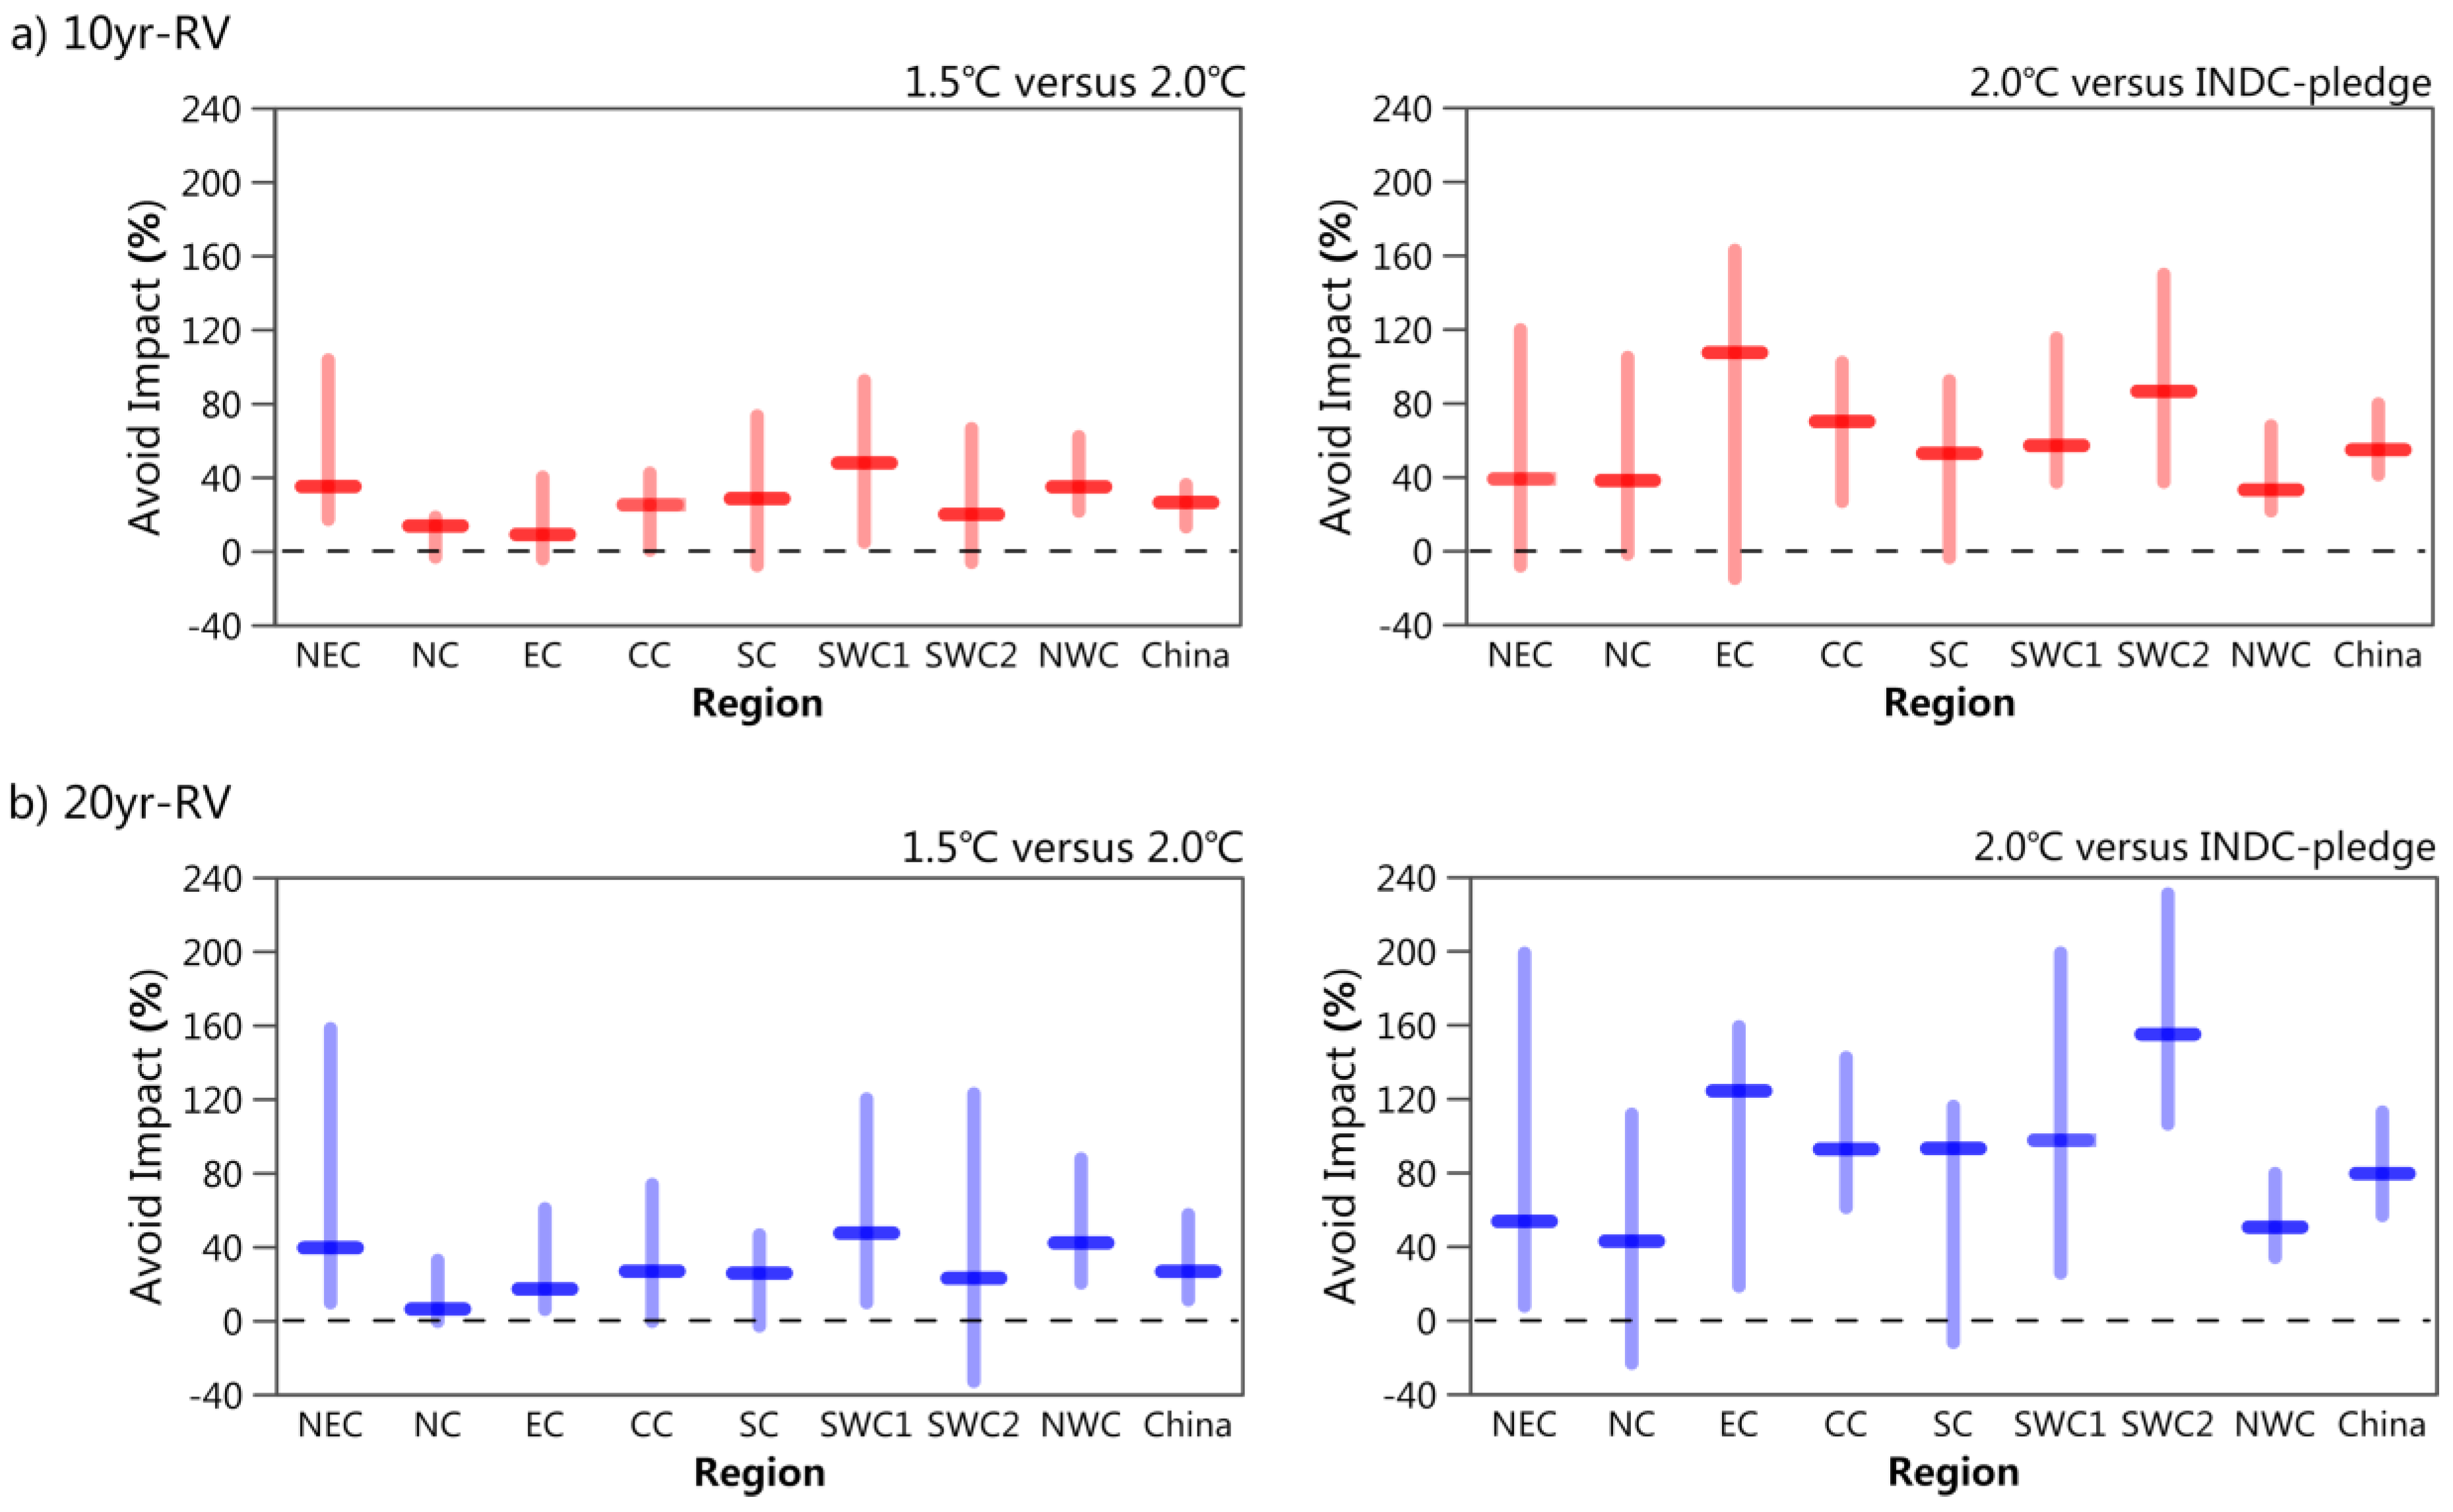
If the warming is limited to a lower level, China is projected to benefit from robust reductions in the population exposure to dangerous extremes (Figure 8). Across China, the population exposures based on heavy precipitation events that exceed the 10 year baseline RV will increase to 138% (111–160%) in the 1.5 °C scenario, 165% (147–179%) in the 2.0 °C scenario, and 217% (199–238%) in the INDC-pledge scenario compared with the present-day level. Thus, the median values of the avoided impacts (expressed in units of present-day exposure) are estimated to be 27% (14–36%; 1.5 °C versus 2.0 °C) and 55% (41–80%; 2.0 °C versus INDC-pledge), respectively. The avoided impacts of the 2.0 °C versus INDC-pledge scenarios are greater than those of the 1.5 °C versus 2.0 °C scenarios, indicating that further efforts to increase the emission reduction based on the INDC-pledge will lead to more benefits.
Note that the avoided impacts are more remarkable for more intense extremes. For example, for heavy rainfall events exceeding the 20 year baseline RV, 27% (12–58%; 1.5 °C versus 2.0 °C) and 80% (57–113%; 2.0 °C versus INDC-pledge) of the population exposure could be reduced by less warming, respectively. More than half of the subregions would experience such a robust avoidance of impacts, although the magnitudes would differ.
Under low-warming scenarios, almost all regions in China will face less risk (exposure) of heavy precipitation. Here, we only considered the fractional population exposure under SSPs. If the absolute population growth is exceeding expectations, the avoided impacts will be larger.
4. Discussion
The response of global warming to actual emission reductions based on the Paris Agreement is of ongoing interest. Most of the existing research is based on RCP or 1.5 °C/2.0° C scenarios, such as Xu et al. (2017) [37], Dosio and Fischer Erich (2017) [9], Schleussner et al. (2016) [10] and Zhang et al. (2018) [12]. However, these scenarios do not consider current mitigation commitments negotiated by worldwide governments. Our approach is based on self-determined emission reduction commitments established during climate negotiations as the starting point to assess the future climate response.
Our results indicate that climate warming under the INDC scenarios is projected to greatly exceed the long-term Paris Agreement goal of stabilizing the global mean temperature above the 2 °C or 1.5 °C level, which is consistent with previously published studies [15,22,23]. Furthermore, we quantified regional climate change in response to INDC pledges. Based on our results, the regional precipitation extremes in China under the INDC scenarios are projected to show great increases in intensity and frequency compared with the current level. The differences in the exposure to extreme events between different scenarios are higher than that of the mean state. If the global emissions are further reduced to achieve the ambitious temperature target, the benefits on the regional exposure to heavy precipitation may be more pronounced than those based on the mean state of precipitation. We focus not only on the assessment of extreme climate impacts under INDC scenarios, but also on the extreme climate impacts at 1.5 °C. Our results for the 1.5 °C scenario are consistent with those reported in Chapter III of the IPCC 1.5 °C report [13].
We also observed a nearly linear relationship between the regional extreme precipitation and global mean warming, which is consistent with the results of [38]. Linking global warming targets to regional consequences, such as changing climate extremes, would benefit political decision-making with respect to climate negotiations and adaptation. However, linear relationships are only meaningful if associated projection uncertainties are kept within reasonable bounds. Some changes in the climate system may be abrupt due to tipping points [39]. Therefore, the limitations of this approach need to be determined.
It is known that the ability of the model to simulate extreme precipitation indices is lower than the ability to simulate extreme temperature indices [40]. The ability of GCMs to simulate features of extreme precipitation is closely related to the ability of the models to simulate atmospheric circulation such as the Northwest Pacific Subtropical High (NPSH) and East Asian Westerly Jet [41,42,43]. Moreover, the simulation bias between the GCMs and observation is attributed to the low resolution of GCMs. Regional climate models (RCMs) have finer resolutions and thus can better capture the characteristics of extreme precipitation on a regional scale. For example, the RCM can effectively remove the false strong precipitation center simulated by the GCM along the southeastern edge of the Tibetan Plateau [25]. Thus, an experimental design for INDC emission pledges based on RCMs is needed to better project the changes in extreme precipitation at smaller regional scales in China and provide decision-makers with more precise information.
5. Conclusions
By using fully coupled simulations from 14 CMIP5 models and their ensemble, we analyzed the changes in the extreme precipitation over China under global INDC scenarios and compared the results with those of the 1.5 °C/2.0 °C warming targets. The main findings are as follows:
- With the enhancement of global warming, the intensity and frequency of extreme precipitation will gradually increase in most regions in China. Changes in the Rx5day are more prominent than those of SDII, while the spatial patterns are similar. The number of days during which the daily precipitation exceeds 25 mm (i.e., R25) increases in the monsoon area in eastern China. The probability distributions of extreme precipitation events are projected to become wider, resulting in the occurrence of more record-breaking heavy precipitation in China in the future despite the relatively small rise in the mean value.
- The population exposure to dangerous (e.g., exceeding the 20-year RV) extreme precipitation events in China is projected to consistently increase because of climate change, following an approximately linear trend. Less warming would reduce the population exposure to once-in 20 years extreme rainfall events by 27% (12–58%; 1.5 °C versus 2.0 °C) and 57% (80–113%; 2.0 °C versus INDC), respectively. Our results improve the understanding of future risks associated with extreme precipitation, which is critical for the design of mitigation and adaptation policies in China, which is home to more than 1.4 billion people.
Supplementary Materials
Supplementary information is available in the online version of the paper. The following are available online at https://www.mdpi.com/2073-4441/11/6/1167/s1. Figure S1: Future emission pathways analyzed in this example. The black vertical line represents the range of conditional and unconditional INDC pledges in 2030; thin lines in different colors show the selected emission pathways clustered into the six groups. The range of the 1.5 °C and 2 °C pathways are plotted for reference in grey and orange shaded areas, respectively [4,8,9]. The estimates of current warming above the pre-industrial level (ΔT) for each scenario group are labelled on the right (uncertainty range of 33–66% and median in brackets). Figure S2: Time series of global mean annual temperature changes relative to the baseline climatology of the pre-industrial (1861–1900), as derived from individual GCMs under RCP8.5 (thin line in different colors). Multi-model ensemble with 21 year running mean (black bold line and shade) is also shown on the graph. The horizontal dashed lines indicate a given warming target. Figure S3: Median years projected by the 14 CMIP5 models for three global warming targets (, 1.5 °C, and 2.0 °C) under the RCP8.5 scenario. Table S2: Details of eight subregions in China [10]. Figure S4: Observed (blue line) and simulated (black line and shade, multi-model median and interquartile range, respectively) time series of three extreme precipitation indices from 1961 to 2005. linear trends of observation (dotted line in red) and multi-model median (dotted line in yellow) are shown in the same graph. Yellow cross denotes the linear trend passed the 95% confidence level. Figure S5: Spatial distribution of extreme precipitation indices for Rx5day (unit: days), SDII (unit: mm day−1), and R25 (unit: days) during the period of present (1985–2005). Column 1: observation; Column 2: MME; Column 3: bias (model ensemble simulation minus observation). Figure S6: Regional average differences among different scenarios in the annual Rx5day in China and its eight subregions, based on the multi-model mean ensemble. Boxes (Whiskers) indicate the 25th and 75th percentiles (maximum and minimum) of 14 climate models, and the horizontal lines represent the multi-model median. Scenarios are the same as Figure 5, with corresponding colors. The differences between different sets of scenarios are labelled on the x-axis. The first three bars show differences for each scenario (1.5 °C, 2.0 °C, and INDC-pledge) relative to the present-day baseline scenario, and the last two bars show differences between the 1.5 °C and 2.0 °C scenarios and INDC scenario relative to the 2.0 °C scenario, as labelled. Eight subregions (labelled on the top left corner) are defined in Text S4. Figure S7: Corresponds to Figure S6, but for R25. The national average of R25 (the central sub-figure), does not include NWC. Figure S8: Corresponds to Figure S6, but for SDII. Figure S9: Frequency distributions of extreme precipitation indices Rx5day over China and its eight subregions. Black lines indicate the results during 1985–2005. Green, blue, and red lines indicate the results during the 1.5 °C, 2.0 °C, and warming periods, respectively. The dashed lines indicate the 5% extreme values for the baseline period 1985–2005. Risk ratios (RRs) for three scenarios labeled on the top-right (including medians and interquartile ranges). Figure S10: Corresponds to Figure S9, but for R25. Zero values of R25 are omitted. Figure S11: Corresponds to Figure S9, but for SDII. Figure S12: Spatial distribution of the intermodel coefficient of variations of three extreme precipitation indices simulated by the 14 CMIP5 models for scenarios of present, 1.5 °C, 2.0 °C, and INDC-pledge. Figure S13: Three extreme precipitation indices over China (regional average) simulated by 14 individual CMIP5 models (in different color lines), with corresponding global mean warming. Figure S14: Multi-model ensemble areal exposure to heavy rainfall of different return values (RVs). Corresponds to Figure 7 but for areal exposure. Corresponds to this figure; calculation results of individual models refer to Figures S17 and S18. Figure S15: Population exposure to heavy precipitation events of 10 year RV at corresponding warming levels over Asia and eight subregions (labelled in top left corner), based on results of individual models (line in different colors). Figure S16: Corresponds to Figure S15, but for population exposure to heavy precipitation events of 20 year RV. Figure S17: Areal exposure to heavy precipitation events of 10 year RV at corresponding warming levels over Asia and eight subregions (labelled in top left corner), based on results of individual models (line in different colors). Figure S18: Corresponds to Figure S17 but for population precipitation events of 20 year RV. Figure S19: Corresponds to Figure 8 but for areal exposure. Table S1: Details of the 14 CMIP5 global climate models used in this research.
Author Contributions
Writing—original draft preparation, J.Z.; writing—review and editing, F.W.
Funding
This work was supported by the Strategic Leading Science and Technology Program of the Chinese Academy of Sciences (XDA20020202), the National Key Research and Development Program of China (2016YFA0602704) and the National Natural Science Foundation of China (41771050).
Acknowledgments
We would like to thank two anonymous reviewers for their helpful comments.
Conflicts of Interest
The authors declare no conflict of interest.
References
- Yin, H.; Changan, L.I. Human impact on floods and flood disasters on the Yangtze River. Geomorphology 2001, 41, 105–109. [Google Scholar] [CrossRef]
- Wang, K.; Wei, Y.M.; Ye, M. Beijing storm of July 21, 2012: Observations and reflections. Nat. Hazards 2013, 67, 969–974. [Google Scholar] [CrossRef]
- Trenberth, K.E. Conceptual Framework for Changes of Extremes of the Hydrological Cycle with Climate Change. Clim. Chang. 1999, 42, 327–339. [Google Scholar] [CrossRef]
- Haerter, J.O.; Berg, P. Unexpected rise in extreme precipitation caused by a shift in rain type? Nat. Geosci. 2009, 2, 372–373. [Google Scholar] [CrossRef]
- Collins, M.; Knutti, R.; Arblaster, J.; Dufresne, J.-L.; Fichefet, T.; Friedlingstein, P.; Gao, X.; Gutowski, W.J.; Johns, T.; Krinner, G.; et al. Long-term Climate Change: Projections, Commitments and Irreversibility. In Climate Change 2013: The Physical Science Basis. Contribution of Working Group I to the Fifth Assessment Report of the Intergovernmental Panel on Climate Change; Stocker, T.F., Qin, D., Plattner, G.-K., Tignor, M., Allen, S.K., Boschung, J., Nauels, A., Xia, Y., Bex, V., Midgley, P.M., et al., Eds.; Cambridge University Press: Cambridge, UK; New York, NY, USA, 2013. [Google Scholar]
- UNFCCC. Adoption of the Paris Agreement: Proposal by the President, FCCC/CP/2015/L.9/Rev.1, ed.; UNFCCC: Geneva, Switzerland, 2015. [Google Scholar]
- UNFCCC. Synthesis Report on the Aggregate Effect of the Intended Nationally Determined Contributions, FCCC/CP/2015/7, ed.; UNFCCC: Paris, France, 2015. [Google Scholar]
- Gupta, S.; Tirpak, D.; Burger, N.; Gupta, J.; Höhne, N.; Boncheva, A.; Kanoan, G.; Kolstad, C.; Kruger, J.; Michaelowa, A.; et al. Policies, instruments, and co-operative arrangements. In Climate Chang. 2007: Mitigation. Contribution of Working Group III to the Fourth Assessment Report of the Intergovernmental Panel on Climate Change; Metz, O.B., Bosch, P., Dave, R., Meyer, L., Eds.; Cambridge University Press: Cambridge, UK; New York, NY, USA, 2007; pp. 745–807. [Google Scholar]
- Dosio, A.; Fischer Erich, M. Will Half a Degree Make a Difference? Robust Projections of Indices of Mean and Extreme Climate in Europe Under 1.5 °C, 2 °C, and 3 °C Global Warming. Geophys. Res. Lett. 2017, 45, 935–944. [Google Scholar] [CrossRef]
- Schleussner, C.-F.; Lissner, T.K.; Fischer, E.M.; Wohland, J.; Perrette, M.; Golly, A.; Rogelj, J.; Childers, K.; Schewe, J.; Frieler, K.; et al. Differential climate impacts for policy-relevant limits to global warming: The case of 1.5 °C and 2 °C. Earth Syst. Dyn. 2016, 7, 327–351. [Google Scholar] [CrossRef]
- Xu, Y.; Zhou, B.-T.; Wu, J.; Han, Z.-Y.; Zhang, Y.-X.; Wu, J. Asian climate change under 1.5–4 °C warming targets. Adv. Clim. Chang. Res. 2017, 8, 99–107. [Google Scholar] [CrossRef]
- Zhang, W.; Zhou, T.; Zou, L.; Zhang, L.; Chen, X. Reduced exposure to extreme precipitation from 0.5 °C less warming in global land monsoon regions. Nat. Commun. 2018, 9, 3153. [Google Scholar] [CrossRef]
- Hoegh-Guldberg, O.; Jacob, D.; Taylor, M.; Bindi, M.; Brown, S.; Camilloni, I.; Diedhiou, A.; Djalante, R.; Ebi, K.; Engelbrecht, F.; et al. Impacts of 1.5°C global warming on natural and human systems. In Global Warming of 1.5°C. An IPCC Special Report on the Impacts of Global Warming of 1.5°C above Pre-Industrial Levels and Related Global Greenhouse Gas Emission Pathways, in the Context of Strengthening the Global Response to the Threat of Climate Change, Sustainable Development, and Efforts to Eradicate Poverty; Masson-Delmotte, V., Zhai, P., Pörtner, H.O., Roberts, D., Skea, J., Shukla, P.R., Pirani, A., Moufouma-Okia, W., Péan, C., Pidcock, R., et al., Eds.; Cambridge University Press: Cambridge, UK; New York, NY, USA, 2018; in press. [Google Scholar]
- Sanderson, B.M.; O’Neill, B.C.; Tebaldi, C. What would it take to achieve the Paris temperature targets? Geophys. Res. Lett. 2016, 43, 7133–7142. [Google Scholar] [CrossRef]
- Rogelj, J.; den Elzen, M.; Höhne, N.; Fransen, T.; Fekete, H.; Winkler, H.; Schaeffer, R.; Sha, F.; Riahi, K.; Meinshausen, M. Paris Agreement climate proposals need a boost to keep warming well below 2 °C. Nature 2016, 534, 631. [Google Scholar] [CrossRef]
- CAT. Addressing Global Warming. Available online: https://climateactiontracker.org/global/temperatures/ (accessed on 31 December 2017).
- UNEP. The Emissions Gap Report; UNEP: Nairobi, Kenya, 2017. [Google Scholar]
- IPCC. Climate Change 2014: Synthesis Report. Contribution of Working Groups I, II and III to the Fifth Assessment Report of the Intergovernmental Panel on Climate Change; Cambridge University Press: Cambridge, UK; New York, NY, USA, 2014. [Google Scholar]
- IPCC. Global Warming of 1.5 °C; Cambridge University Press: Cambridge, UK; New York, NY, USA, 2018. [Google Scholar]
- UNFCCC. National Inventory Submissions; UNFCCC: Geneva, Switzerland, 2019. [Google Scholar]
- Taylor, K.E.; Stouffer, R.J.; Meehl, G.A. An Overview of CMIP5 and the Experiment Design. Bull. Am. Meteorol. Soc. 2011, 93, 485–498. [Google Scholar] [CrossRef]
- Wang, F.; Tokarska, K.B.; Zhang, J.; Ge, Q.; Hao, Z.; Zhang, X.; Wu, M. Climate Warming in Response to Emission Reductions Consistent with the Paris Agreement. Adv. Meteorol. 2018, 2018, 1–9. [Google Scholar] [CrossRef]
- Wang, F.; Ge, Q.; Chen, D.; Luterbacher, J.; Tokarska, K.B.; Hao, Z. Global and regional climate responses to national-committed emission reductions under the Paris agreement. Geografiska Annaler Ser. A Phys. Geogr. 2018, 100, 240–253. [Google Scholar] [CrossRef]
- Jia, W. A gridded daily observation dataset over China region and comparison with the other datasets. Chin. J. Geophys. 2013, 56, 1102–1111. [Google Scholar]
- Gao, X.-J.; Wang, M.-L.; Filippo, G. Climate Change over China in the 21st Century as Simulated by BCC_CSM1.1-RegCM4.0. Atmos. Ocean. Sci. Lett. 2013, 6, 381–386. [Google Scholar]
- Ji, Z.; Kang, S. Evaluation of extreme climate events using a regional climate model for China. Int. J. Climatol. 2015, 35, 888–902. [Google Scholar] [CrossRef]
- Robert, V.; Andreas, G.; Stefan, S.; Erik, K.; Annemiek, S.; Paul, W.; Thomas, M.; Oskar, L.; Grigory, N.; Claas, T.; et al. The European climate under a 2 °C global warming. Environ. Res. Lett. 2014, 9, 034006. [Google Scholar]
- Huang, J.; Yu, H.; Dai, A.; Wei, Y.; Kang, L. Drylands face potential threat under 2 °C global warming target. Nat. Clim. Chang. 2017, 7, 417. [Google Scholar] [CrossRef]
- Zhang, X.; Alexander, L.; Hegerl, G.C.; Jones, P.; Tank, A.K.; Peterson, T.C.; Trewin, B.; Zwiers, F.W. Indices for monitoring changes in extremes based on daily temperature and precipitation data. Wiley Interdiscip. Rev. Clim. Chang. 2011, 2, 851–870. [Google Scholar] [CrossRef]
- Sun, Y.; Solomon, S.; Dai, A.; Portmann, R.W. How Often Does It Rain? J. Clim. 2006, 19, 916–934. [Google Scholar] [CrossRef] [Green Version]
- Huang, J.; Sun, S.; Zhang, J. Detection of trends in precipitation during 1960–2008 in Jiangxi province, southeast China. Theor. Appl. Climatol. 2013, 114, 237–251. [Google Scholar] [CrossRef]
- Zhai, P.; Zhang, X.; Wan, H.; Pan, X. Trends in Total Precipitation and Frequency of Daily Precipitation Extremes over China. J. Clim. 2005, 18, 1096–1098, 1100–1108. [Google Scholar] [CrossRef]
- Lavell, A.; Oppenheimer, M.; Diop, C.; Hess, J.; Lempert, R.; Li, J.; Muir-Wood, R.; Myeong, S. Climate change: New dimensions in disaster risk, exposure, vulnerability, and resilience. In Managing the Risks of Extreme Events and Disasters to Advance Climate Change Adaptation; Field, C.B., Barros, V., Stocker, T.F., Qin, D., Dokken, D.J., Ebi, K.L., Mastrandrea, M.D., Mach, K.J., Plattner, G.-K., Allen, S.K., et al., Eds.; A Special Report of Working Groups I and II of the Intergovernmental Panel on Climate Change (IPCC); Cambridge University Press: Cambridge, UK; New York, NY, USA, 2012; pp. 25–64. [Google Scholar]
- Cox, D.R.; Hinkley, D.V. Theoretical Statistics; Chapman and Hall: London, UK, 1974; p. 511. [Google Scholar]
- Kharin, V.V.; Zwiers, F.W. Estimating Extremes in Transient Climate Change Simulations. J. Clim. 2005, 18, 1156–1173. [Google Scholar] [CrossRef]
- Jones, B.; O’Neill, B.C. Spatially explicit global population scenarios consistent with the Shared Socioeconomic Pathways. Environ. Res. Lett. 2016, 11, 084003. [Google Scholar] [CrossRef]
- Ying, X.; Jie, W.; Ying, S.; Bo-Tao, Z.; Rou-Ke, L.; Jia, W. Change in Extreme Climate Events over China Based on CMIP5. Atmos. Ocean. Sci. Lett. 2015, 8, 185–192. [Google Scholar] [CrossRef]
- Seneviratne, S.I.; Donat, M.G.; Pitman, A.J.; Knutti, R.; Wilby, R.L. Allowable CO2 emissions based on regional and impact-related climate targets. Nature 2016, 529, 477. [Google Scholar] [CrossRef] [PubMed]
- Lenton, T.M.; Held, H.; Kriegler, E.; Hall, J.; Lucht, W.; Rahmstorf, S.; Schellnhuber, H. Tipping elements in the Earth’s climate system. Proc. Natl. Acad. Sci. USA 2008, 105, 1786–1793. [Google Scholar] [CrossRef] [PubMed]
- Jiang, D.; Sui, Y.; Lang, X. Timing and associated climate change of a 2 °C global warming. Int. J. Climatol. 2016, 36, 4512–4522. [Google Scholar] [CrossRef]
- Jiang, Z.; Wei, L.; Xu, J.; Li, L. Extreme Precipitation Indices over China in CMIP5 Models. Part I: Model Evaluation. Adv. Sci. Serv. Soc. 2015, 28. [Google Scholar] [CrossRef]
- Rajendran, K.; Kitoh, A.; Yukimoto, S. South and East Asian summer monsoon climate and variation in MRI coupled model (MRI-CGCM2). Adv. Sci. Serv. Soc. 2004, 17, 763–782. [Google Scholar] [CrossRef]
- Lin, Z.; Fu, Y.; Lu, R. Intermodel Diversity in the Zonal Location of the Climatological East Asian Westerly Jet Core in Summer and Association with Rainfall over East Asia in CMIP5 Models. Adv. Atmos. Sci. 2019, 36, 614–622. [Google Scholar] [CrossRef]
Figure 1.
Map of China’s eight geographical subregions.

Figure 2.
Present climatology of the annual Rx5day over Asia (a) and changes in the annual Rx5day under different scenarios (b–f) based on the multi-model mean. The colored shading in (b–f) was applied to areas that were statistically significant at the 10% level according to Wilcoxon rank sum test; the stippling in (b–f) was added to regions with a multi-model mean signal-to-noise ratio (SNR) > 1.

Figure 3.
Present climatology of the annual R25 over Asia (a) and changes in the annual R25 under different scenarios (b–f) based on the multi-model mean. The colored shading in (b–f) was applied to areas that were statistically significant at the 10% level according to Wilcoxon rank sum test; the stippling in (b–f) was added to regions with a multi-model mean SNR > 1.

Figure 4.
Present climatology of the annual SDII over Asia (a) and changes in the annual SDII under different scenarios (b–f) based on the multi-model mean. The colored shading in (b–f) was applied to areas that were statistically significant at the 10% level according to Wilcoxon rank sum test; the stippling in (b–f) was added to regions with a multi-model mean SNR > 1.

Figure 5.
National average differences among different scenarios for the annual Rx5day (a), R25 (b), and SDII (c) changes in China based on the multi-model mean ensemble. Boxes (Whiskers) indicate the 25th and 75th percentiles (maximum and minimum) of 14 climate models, and the horizontal lines represent the multi-model median. The scenarios are the same as those shown in Figure 2, Figure 3 and Figure 4, with corresponding colors. The differences between different sets of scenarios are labeled on the X-axis. The first three bars show the differences of each scenario (1.5 °C, 2.0 °C, and INDC-pledge) relative to the present-day baseline scenario and the last two bars show the differences between the 1.5 °C and 2.0 °C and INDC scenarios and 2.0 °C scenario, as labeled at the bottom. Detailed information for each subregion is provided in Figure S6 (for Rx5day), Figure S7 (for R25), and Figure S8 (for SDII).

Figure 6.
Frequency distributions (probability distribution function, PDF) of extreme precipitation indices: Rx5day (a), R25 (b), and SDII (c). Zero R25 values were omitted. The black lines indicate the results for the period of 1985–2005. The green, blue, and red lines indicate the results during the 1.5 °C, 2.0 °C, and warming periods, respectively. The dashed lines indicate the 5% extreme values of the baseline period (1985–2005). Detailed information for each subregion is provided in Figure S9 (for Rx5day), Figure S10 (for R25), and Figure S11 (for SDII).

Figure 7.
Population exposure to heavy precipitation events with different return values (RVs) at corresponding warming levels over Asia and eight subregions (labeled on the top-left corner). The multi-model means are represented by solid lines and the interquartile ranges are shaded. The dashed black lines denote the linear trend of the exposure depending on the mean global warming. The population-weighted density means are estimated from the 2100 population prediction under the Shared Socioeconomic Pathways 2 (SSP2) scenario (future scenarios). The reliability of the curves decreases at the right edge because of the inconsistent number of ensemble members which corresponds to this figure. The results of the calculations based on the individual models are provided in Figures S15 and S16.

Figure 8.
Changes in the avoided extreme precipitation in China and its subregions in low-warming scenarios. The population exposure to heavy precipitation events that exceed the baseline (a) 10 and (b) 20 year return values is reduced in the low-warming scenarios (1.5 °C compared with 2.0 °C, 2.0 °C compared with Intended Nationally Determined Contributions (INDC). The projected changes are expressed in units of present-day exposure (1985–2005). The central lines and bars denote the multi-model medians and interquartile ranges, respectively.


Table 1.
Definitions of extreme precipitation indices used in this study.
| Extreme Precipitation Indices | Definition (Unit) |
|---|---|
| Rx5day | Maximum consecutive 5 day precipitation (mm) |
| SDII | Simple precipitation intensity index. Let be the daily precipitation amount on wet days, mm in period . If represents the number of wet days in period , then (mm/day). |
| R25 | Cumulative number of precipitation days during which the daily precipitation exceeds 25 mm per year (days) |
© 2019 by the authors. Licensee MDPI, Basel, Switzerland. This article is an open access article distributed under the terms and conditions of the Creative Commons Attribution (CC BY) license (http://creativecommons.org/licenses/by/4.0/).
Share and Cite
MDPI and ACS Style
Zhang, J.; Wang, F. Extreme Precipitation in China in Response to Emission Reductions under the Paris Agreement. Water 2019, 11, 1167. https://doi.org/10.3390/w11061167
AMA Style
Zhang J, Wang F. Extreme Precipitation in China in Response to Emission Reductions under the Paris Agreement. Water. 2019; 11(6):1167. https://doi.org/10.3390/w11061167
Chicago/Turabian StyleZhang, Jintao, and Fang Wang. 2019. "Extreme Precipitation in China in Response to Emission Reductions under the Paris Agreement" Water 11, no. 6: 1167. https://doi.org/10.3390/w11061167
Note that from the first issue of 2016, this journal uses article numbers instead of page numbers. See further details here.