Modeling the Influence of Outflow and Community Structure on an Endangered Fish Population in the Upper San Francisco Estuary


Lodi Fish and Wildlife Office, U.S. Fish and Wildlife Service, Suite 105, 850 S. Guild Avenue, Lodi, CA 95240, USA
Water 2019, 11(6), 1162; https://doi.org/10.3390/w11061162
Submission received: 26 March 2019
/
Revised: 17 May 2019
/
Accepted: 24 May 2019
/
Published: 3 June 2019
(This article belongs to the Special Issue Ecological Status Assessment of Transitional Waters)
Abstract
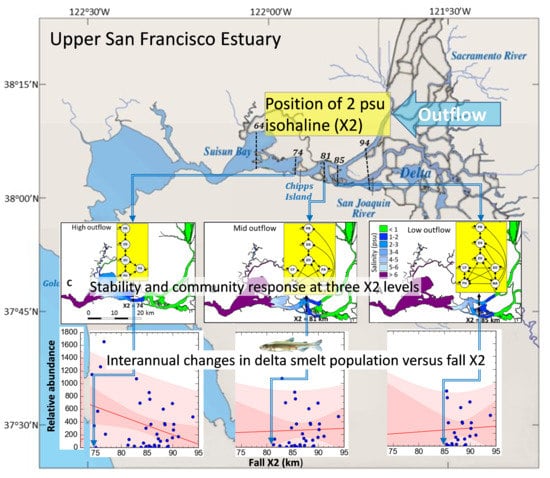
:The aim of this community modeling study was to evaluate potential mechanisms by which freshwater outflow in the upper San Francisco Estuary, CA, controls the fall habitat and abundance of subadult delta smelt Hypomesus transpacificus and its community. Through analyses of the community matrix, community stability and the direction of change of community variables were qualitatively and quantitatively modeled under four outflow–input scenarios. Three subsystems were modeled in the low salinity zone (1–6 psu), each overlapping the location corresponding to the distance from the mouth of the estuary to upstream positions where the near-bottom 2 psu isohaline (X2) is at 74, 81, and 85 km (corresponding to high-, mid-, and low-outflows). Results suggested communities were qualitatively stable at each X2 position, but simulations showed the percent of stable models decreased from low- to high-X2 positions. Under all outflow–input scenarios, the predicted qualitative population responses of delta smelt were: (1) consistently positive for the low X2 position, and (2) uncertain under both mid- and high-X2 positions. Qualitative predictions were generally consistent with quantitative simulations and with the relations between relative abundance of delta smelt and X2. Thus, high outflow seems beneficial to subadult delta smelt when X2 reaches 74 km during fall.
1. Introduction
The complexity of estuarine ecosystems is influenced by the broad range and extent of anthropogenic effects in these transitional waters [1,2], including morphological and hydrological alteration [3,4], entrainment of plankton and nekton to water pumps [5,6], contaminants [3,7], introduced species [8,9], and climate change [10,11]. Changes in freshwater flow, natural or otherwise, can perturb the estuarine salinity gradient [12,13], and influence the abundance and distribution of estuarine organisms through a variety of flow-mediated processes (e.g., [9,14,15]). Moreover, estuarine food webs can be sensitive to small variations in the freshwater input [16,17]. Thus, understanding how freshwater flow controls species abundance, their distribution and interactions requires explicit consideration of spatial and temporal scales and abiotic and biotic habitat components. Impaired freshwater flows can diminish the amount of habitat and the habitat quality for estuarine-dependent species [18,19]. Effects of impaired flows on fish populations include reductions in growth [20,21], survival [21], abundance [10,21], and biomass [22]. This highlights the variety of ecological roles freshwater flows may have on the population dynamics and sustainability of estuarine-dependent species.
The identification of specific ecological mechanisms linking species responses to freshwater flow in estuaries remains challenging due to the highly complex nature of such ecosystems [17,23]. In particular, there is a pressing need for analytical tools to evaluate ecological hypotheses in such ecosystems, and to inform adaptive management of freshwater flows to conserve fish species at risk of extinction (e.g., [9,24]). Because species interactions are notoriously difficult to quantify [25], qualitative analysis of the community matrix is particularly suited to model ecological interactions since essential community properties can be determined by ecosystem topology and sign structure of the interactions, rather than by the values of variables and parameters themselves [26,27,28]. Analysis of qualitative interactions provides a mathematically rigorous foundation for understanding ecosystem behavior [29,30,31] and has been used in a wide range of aquatic ecosystems to evaluate how community stability and community variables respond to abiotic and biotic perturbations, including, nutrient input in freshwater food webs (e.g., [26,32]); introduced species in freshwater communities (e.g., [30,33]) and environmental disturbance in kelp–urchin communities [34]. Qualitatively models in transitional waters have included evaluations of community responses to dumping of mine wastes in shallow-coastal communities (e.g., [35,36]); and increased ocean acidification in an estuarine community [37]. However, there is a need for further metrics to interpret community responses and to determine whether the predicted influence of a perturbation on a given community variable or species of interest is consistent with field observations.
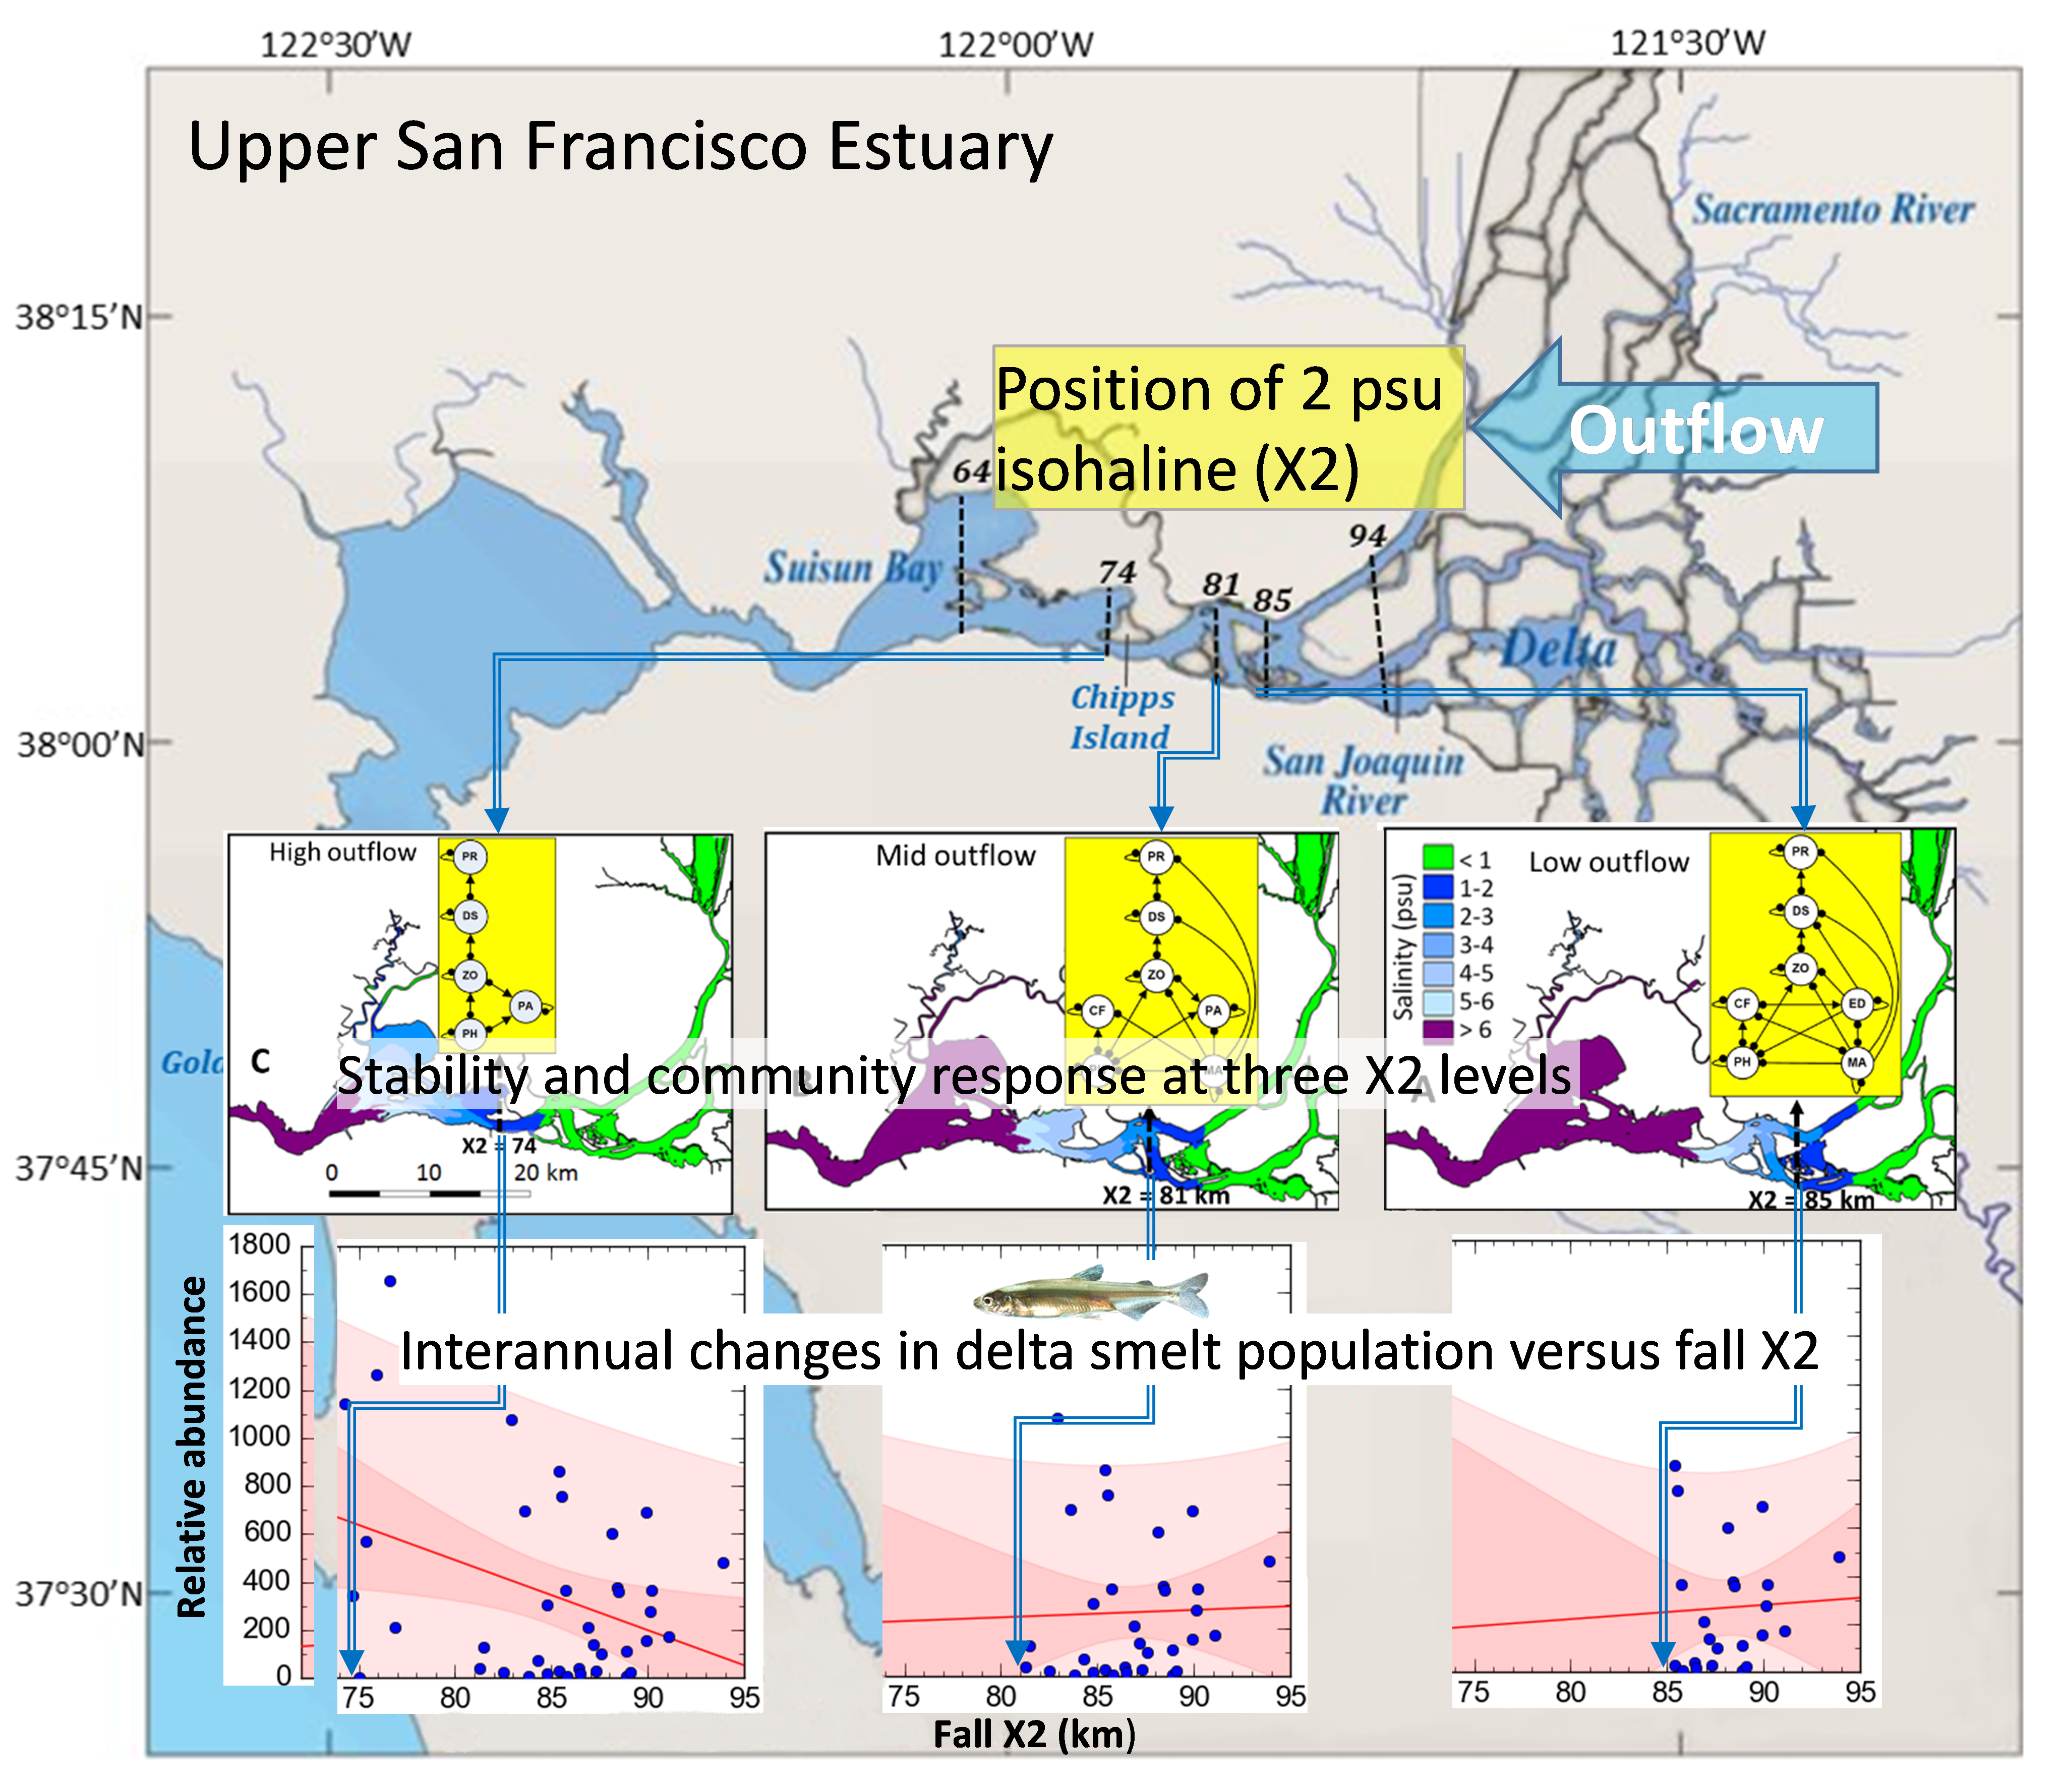
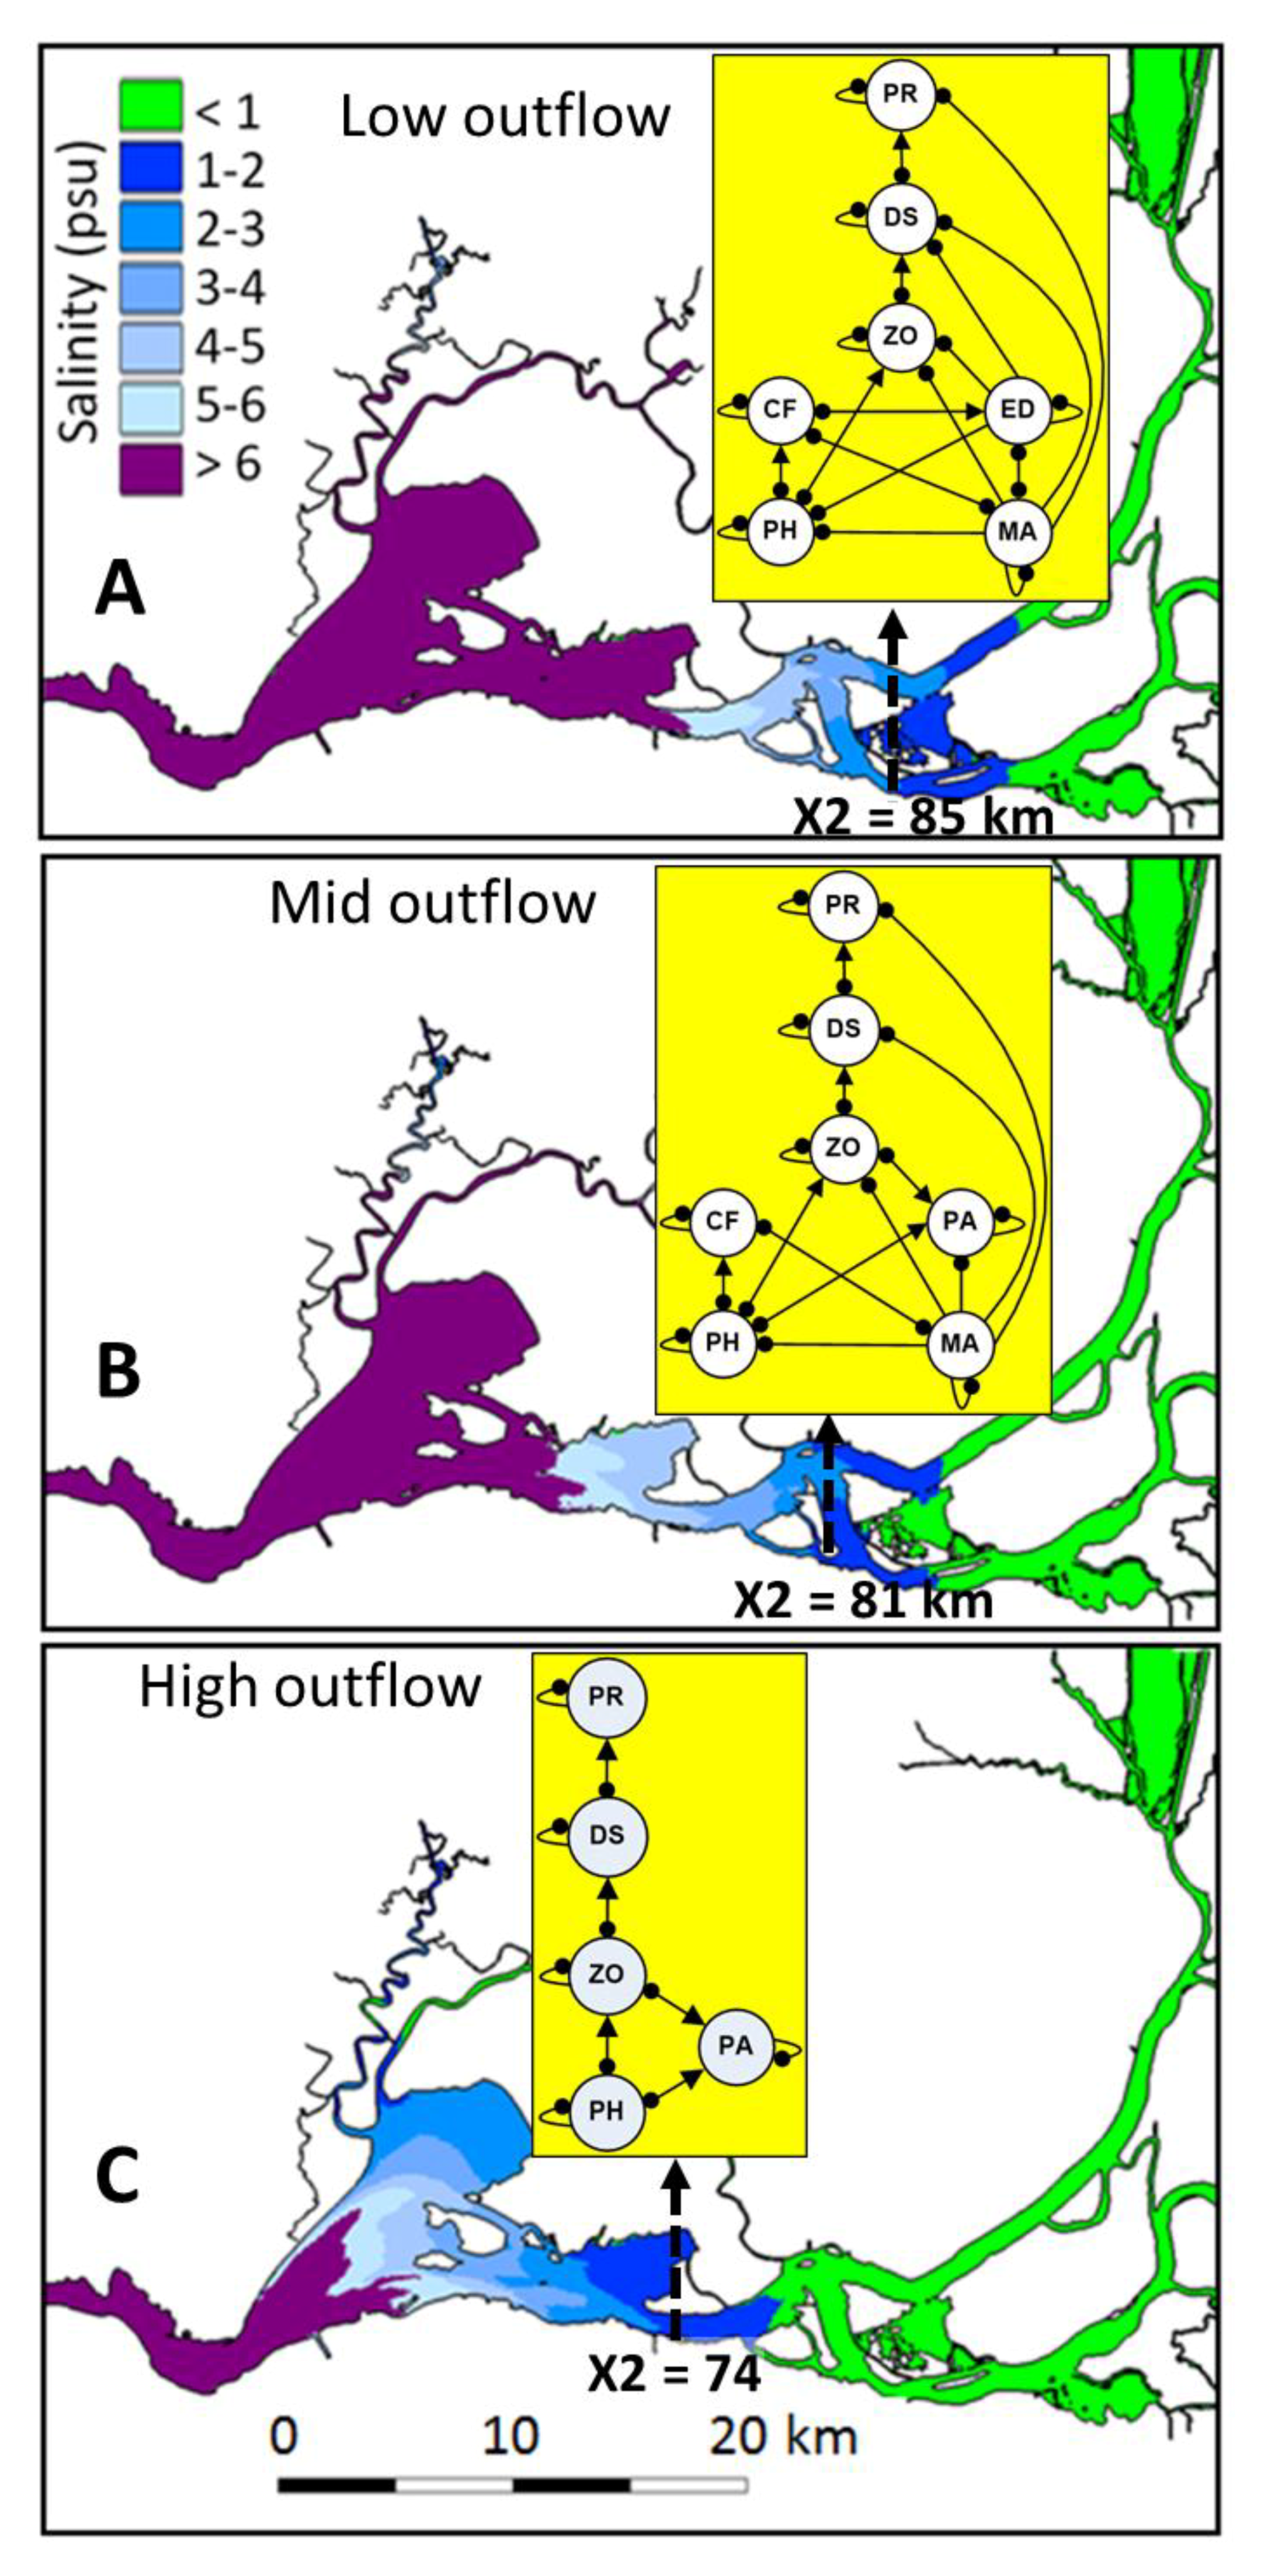
The upper San Francisco Estuary (hereafter upper SF Estuary; California; Figure 1) is an imperiled ecosystem and the central hub of California’s water supply infrastructure [38]. Outflow is the most ecologically important source of freshwater to the SF Estuary and represents the net flow at Chipps Island in the Suisun Region (river km 74; Figure 1) after subtracting water diversions and depletions in the upper SF Estuary and its watershed [6,9]. An ecologically meaningful metric of outflow forcing on the upstream distribution of the salinity field in the SF Estuary is X2, which is defined as the distance (km) from the mouth of the estuary (Golden Gate Bridge), to upstream locations where the near-bottom tidally averaged salinity is 2 psu [39]. The upper SF Estuary is home to several threatened and endangered species including the endemic delta smelt Hypomesus transpacificus, an osmerid particularly sensitive to human impacts due to its low fecundity, predominant annual life cycle, and limited spatial distribution [38,40]. Spawning of delta smelt occurs mostly in freshwater during spring and their planktonic larvae tend to gradually move downstream into the low salinity zone (hereafter LSZ, 1–6 psu), [24], where juveniles and subadults generally rear during summer and fall. Despite major long-term changes in pelagic food webs in the upper SF Estuary, calanoid copepods remain one of their most important prey [41]. Delta smelt was listed as threatened (federal and state) in 1993 and up-listed to endangered (state) in 2010 [42].
Understanding the ecological processes underlying the response of delta smelt to fall outflows is relevant to adaptive management in the upper SF Estuary [24,43], and such management actions are intended to improve fall habitat of delta smelt when preceding precipitation and runoff conditions result in high outflows [43]. Outflow controls the location and range of the LSZ (Figure 1), the extent of the abiotic habitat available for subadult delta smelt [10,44], and the position of X2 which controls the upstream distribution of subadult delta smelt during the fall [45]. Nevertheless, because X2 has not been found to be a simple predictor of delta smelt abundance, the need to investigate more complex mechanisms or additional variables has been suggested [39,44]. The high outflows observed in the upper SF Estuary during 2011 prompted monitoring of abiotic and biotic factors, which along with long-term monitoring in the SF Estuary, enabled the performance of interannual comparisons of abiotic and community responses to changes in the position of fall X2 [24]. Although several of the predicted abiotic and biotic responses in that study could not be confirmed from available field data, the abundance of delta smelt in 2011 and early 2012 was one the highest reported since the early 2000s. Yet, delta smelt became very rare during the 2012–2016 drought and failed to increase its abundance during the wet year 2017, indicating the need to evaluate new management options (e.g., [7,9,46]).
Given the complex abiotic and biotic responses to fall outflow in the upper SF estuary [24,38], there is a pressing need for further analytical approaches to evaluate how outflow controls the essential community structure and functional group interactions influencing delta smelt in the LSZ under particular outflow scenarios (hereafter delta smelt subsystems), and to investigate the likely mechanisms controlling the population response of delta smelt in different subsystems (Figure 1).
The objectives of this study were to evaluate: (1) the stability of the delta smelt subsystems in the LSZ when fall outflows are alternatively maintained at low-, mid-, and high-X2 positions corresponding to 74, 81, and 85 km, (2) the predicted direction of change and its uncertainty for the abundance of delta smelt and other species and trophic levels in each subsystem under four outflow input scenarios, and (3) whether field patterns of relative abundance for delta smelt and X2 are consistent with the predictions of community models. Three community metrics were adapted to model the response of delta smelt and other community variables to outflows, first, the weighted prediction matrix [47] was modified to denote both the direction of change and its uncertainty in a signed weighted prediction matrix (Ws), second, a modified community matrix specifying press inputs () was used to estimate the combined effect of outflow press perturbations on two or more community variables, and third, the proportional net change of adjoints in the negative community matrix (Δ) was used as a measure of the determinacy in the direction of change of variables in quantitative simulations. Finally, statistical relations between the field relative abundance of subadult delta smelt and X2 enabled to evaluate the predicted population response of delta smelt in each of the modeled subsystems.
2. Material and Methods
2.1. Study Area
The SF Estuary is the largest estuary in the west coast of the United States (Figure 1), and has been profoundly altered physically, chemically, and biologically [6,8]. Multiple stressors in the upper SF Estuary have been implicated in the pelagic organism decline occurring in the early 2000s [48,49]. Reservoirs upstream of the SF Estuary, and substantial water diversions within an extensive network of interconnected channels surrounding leveed agricultural islands (the Delta) have greatly altered the hydrodynamics of this estuary [13,50]. Two dataset are central to the evaluation of hydrologic conditions in the SF Estuary: (1) Dayflow, a 2-D mass balance model of freshwater outflows from the tributaries of the Upper SF Estuary [51], and (2) the California Data Exchange Center, a query-based portal which maintains, and operates an extensive hydrologic data collection network [52]. In addition, the Interagency Ecological Program (IEP) provides long-term monitoring data of pelagic, planktonic, and benthic organisms in the SF Estuary [53]. The field data generated by the IEP have been collected consistently over time at multiple locations representing the study areas in the upper SF Estuary (e.g., [24,38,54]). The temporal and spatial coverage of these field surveys has enabled to evaluate the role of hydrodynamic forcing on the distribution and relative abundance of planktonic, pelagic, and benthic species (e.g., [24,38,55,56,57]). Additional monitoring of aquatic macrophytes by the University of California at Davis, has been conducted extensively using a combination of field sampling and remote sensing in the upper SF Estuary (e.g., [58,59]).
The LSZ area varies greatly with outflow, and is about 90 km2 when X2 is positioned at 74 km, 50 km2 when X2 is positioned at 81 km, and 40 km2 when X2 is positioned at 85 km [24]. Altered fresh water outflow in the upper SF Estuary has greatly changed the abiotic habitat for pelagic fishes [9,54], and facilitated the introduction of species [60,61]. A high proportion of pelagic and planktonic organisms in the upper SF Estuary are also lost due to prevailing upstream flows in the south Delta caused by massive water pumps [5,6]. As is the case of the lower SF Estuary, most communities in the upper SF Estuary are dominated by introduced species [61,62]. The introduced macrophyte Egeria densa was first reported in the Delta in 1946 [63] and became the most abundant submersed plant in the Delta, where it has greatly altered community structure and functions [58,64,65]. The introduction of the clam Potamocorbula amurensis in the late 1980s caused major trophic changes in the benthic and pelagic communities of the SF Estuary [60,66], greatly adding to the filter feeding activity of the clam Corbicula fluminea, an earlier introduction in the upper SF Estuary [67]. In addition, the cyanobacterium Microcystis aeruginosa was first observed in the Delta in 1999 [68] and produces toxic algal blooms that can be harmful to upper trophic levels [69,70].
2.2. Community Matrix Models
The community structure and interactions in this study were based on qualitative analysis of the community matrix [29,71]. Given a classical dynamical ecosystem of n interacting variables (Ni), the change in the equilibrium level of species ni* is
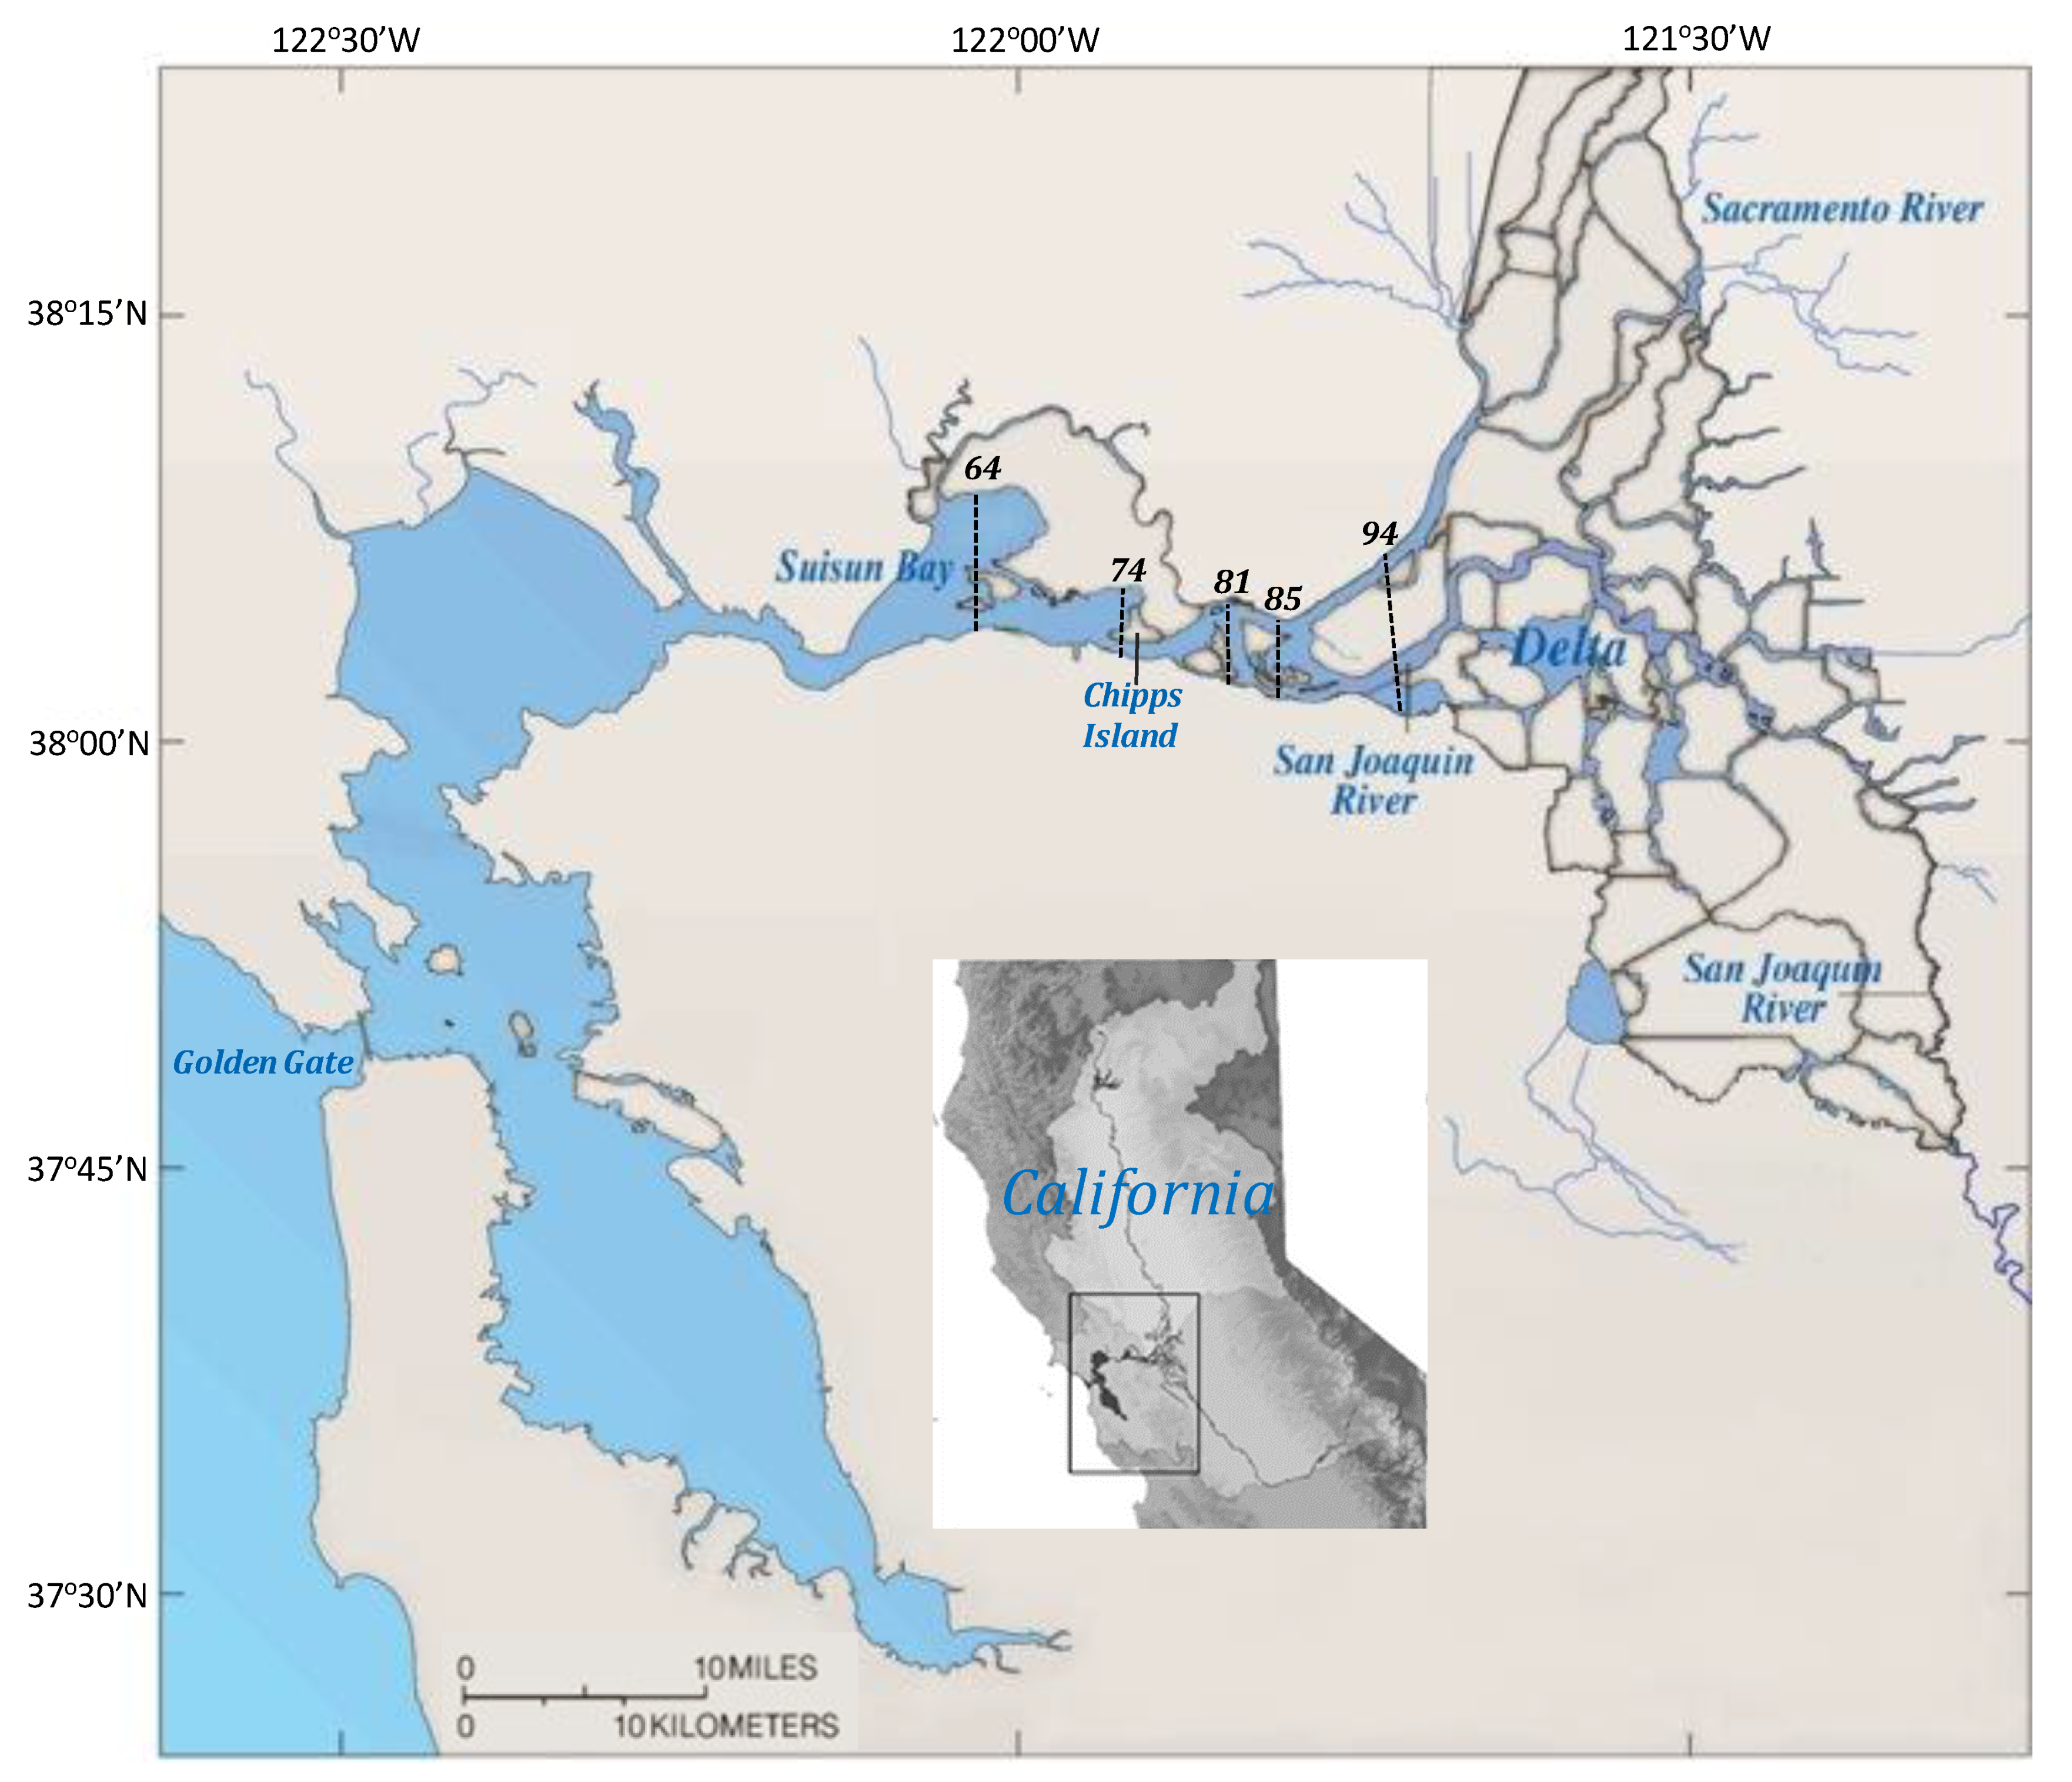
where the ni represent species abundances or abiotic factors. The ci are parameters that govern biological rates (e.g., birth, mortality, growth), and depend on the species and environment [72,73]. Modeled subsystems were represented by a signed digraphs, where element aij of a qualitatively defined community matrix (Ao) of order n denotes the net effect to variable i from variable j (for i and j from 1 to n). For example, a subsystem composed of three trophic levels can be represented by three variables and their interactions (Figure 2). Three possible qualitative effects to variable i from variable j were assigned to each matrix element: ai,j = 1, ai,j = −1 and ai,j = 0, which in the neighborhood of any equilibrium point respectively denote positive, negative, and no effect on the instantaneous growth of variable i due to increase in the level of variable j. The stability of the community matrix was evaluated using the characteristic polynomial:
where, Ao is as defined earlier, I is the n-dimensional identity matrix, and λ are the roots or eigenvalues [71]. Following a perturbation, negative real roots means the community can return to equilibrium. Conversely, positive real roots indicate the ecosystem moves away from equilibrium, as in unstable ecosystems. Multiple zero roots can result in unstable equilibrium [73], and zero overall feedback indicates neutral stability [74].
p(λ) = |Ao − λI| = a0λn + a1λn − 1 + a2λn − 2 + … an = 0
2.3. Community Structure and Outflow Scenarios
Qualitative analysis was used to model three flow-dependent fall community structures in the upper SF Estuary under high-, mid-, and low-net Delta outflows corresponding respectively to X2 positions of 74, 81, and 85 km [24]. The three essential components of qualitative models (community variables, interactions or links, and driving force or perturbation) were based on the following five steps:
- (1)
- Compilation of long-term data and studies in the upper SF Estuary, including: monitoring data for delta smelt and other species [53], outflow and X2 data [51], interpretation of the spatio-temporal distribution of the salinity field in the LSZ based on the three-dimensional UnTRIM hydrodynamic model for the upper SF Estuary [24,75], and baseline knowledge of the modeled ecosystem (e.g., [6,10,39,40,54,55,63,76,77]).
- (2)
- Consideration of dynamic and stationary factors for developing conceptual models of estuarine communities [78], where dynamic factors include physico-chemical and biological characteristics of the low salinity habitat corresponding to the LSZ each X2 position, and stationary factors include geographically fixed habitat features at each X2 position such as substrate, erodible sediment, and bathymetry in the low salinity habitat [24,38].
- (3)
- Refinement of conceptual models into different subsystems describing the essential community variables influencing subadult delta smelt based on ecological syntheses of long-term field data and studies [24,38]. Community variables selected for each of the three modeled subsystems were based on functional groups (e.g., [74,79]), and their predominant spatio-temporal overlap with dynamic and stationary abiotic and biotic factors. Except for delta smelt and species with significant ecological impacts (the cyanobacterium M. aeruginosa [80], the clams P. amurensis and C. fluminea [56], and the macrophyte E. densa [58], Table 1), other functional groups included trophic levels to minimize redundant species interactions (e.g., [74,81]), (Table 1).
- (4)
- Reformulation of conceptual models into signed digraphs based on qualitative model guidelines (e.g., [71,79,93]). Negative self-effect (self-damping) was assumed to arise for each variable from density-dependent growth rate or a limited source, as in the case of nutrients [71]. Each community variable was then implicitly connected to other variables or abiotic factors through negative feedback [71,74]. Reported community interactions considered for the modeled subsystem included: predation (+, −); interference competition (−, −); and amensalism (0, −), (Appendix A).
- (5)
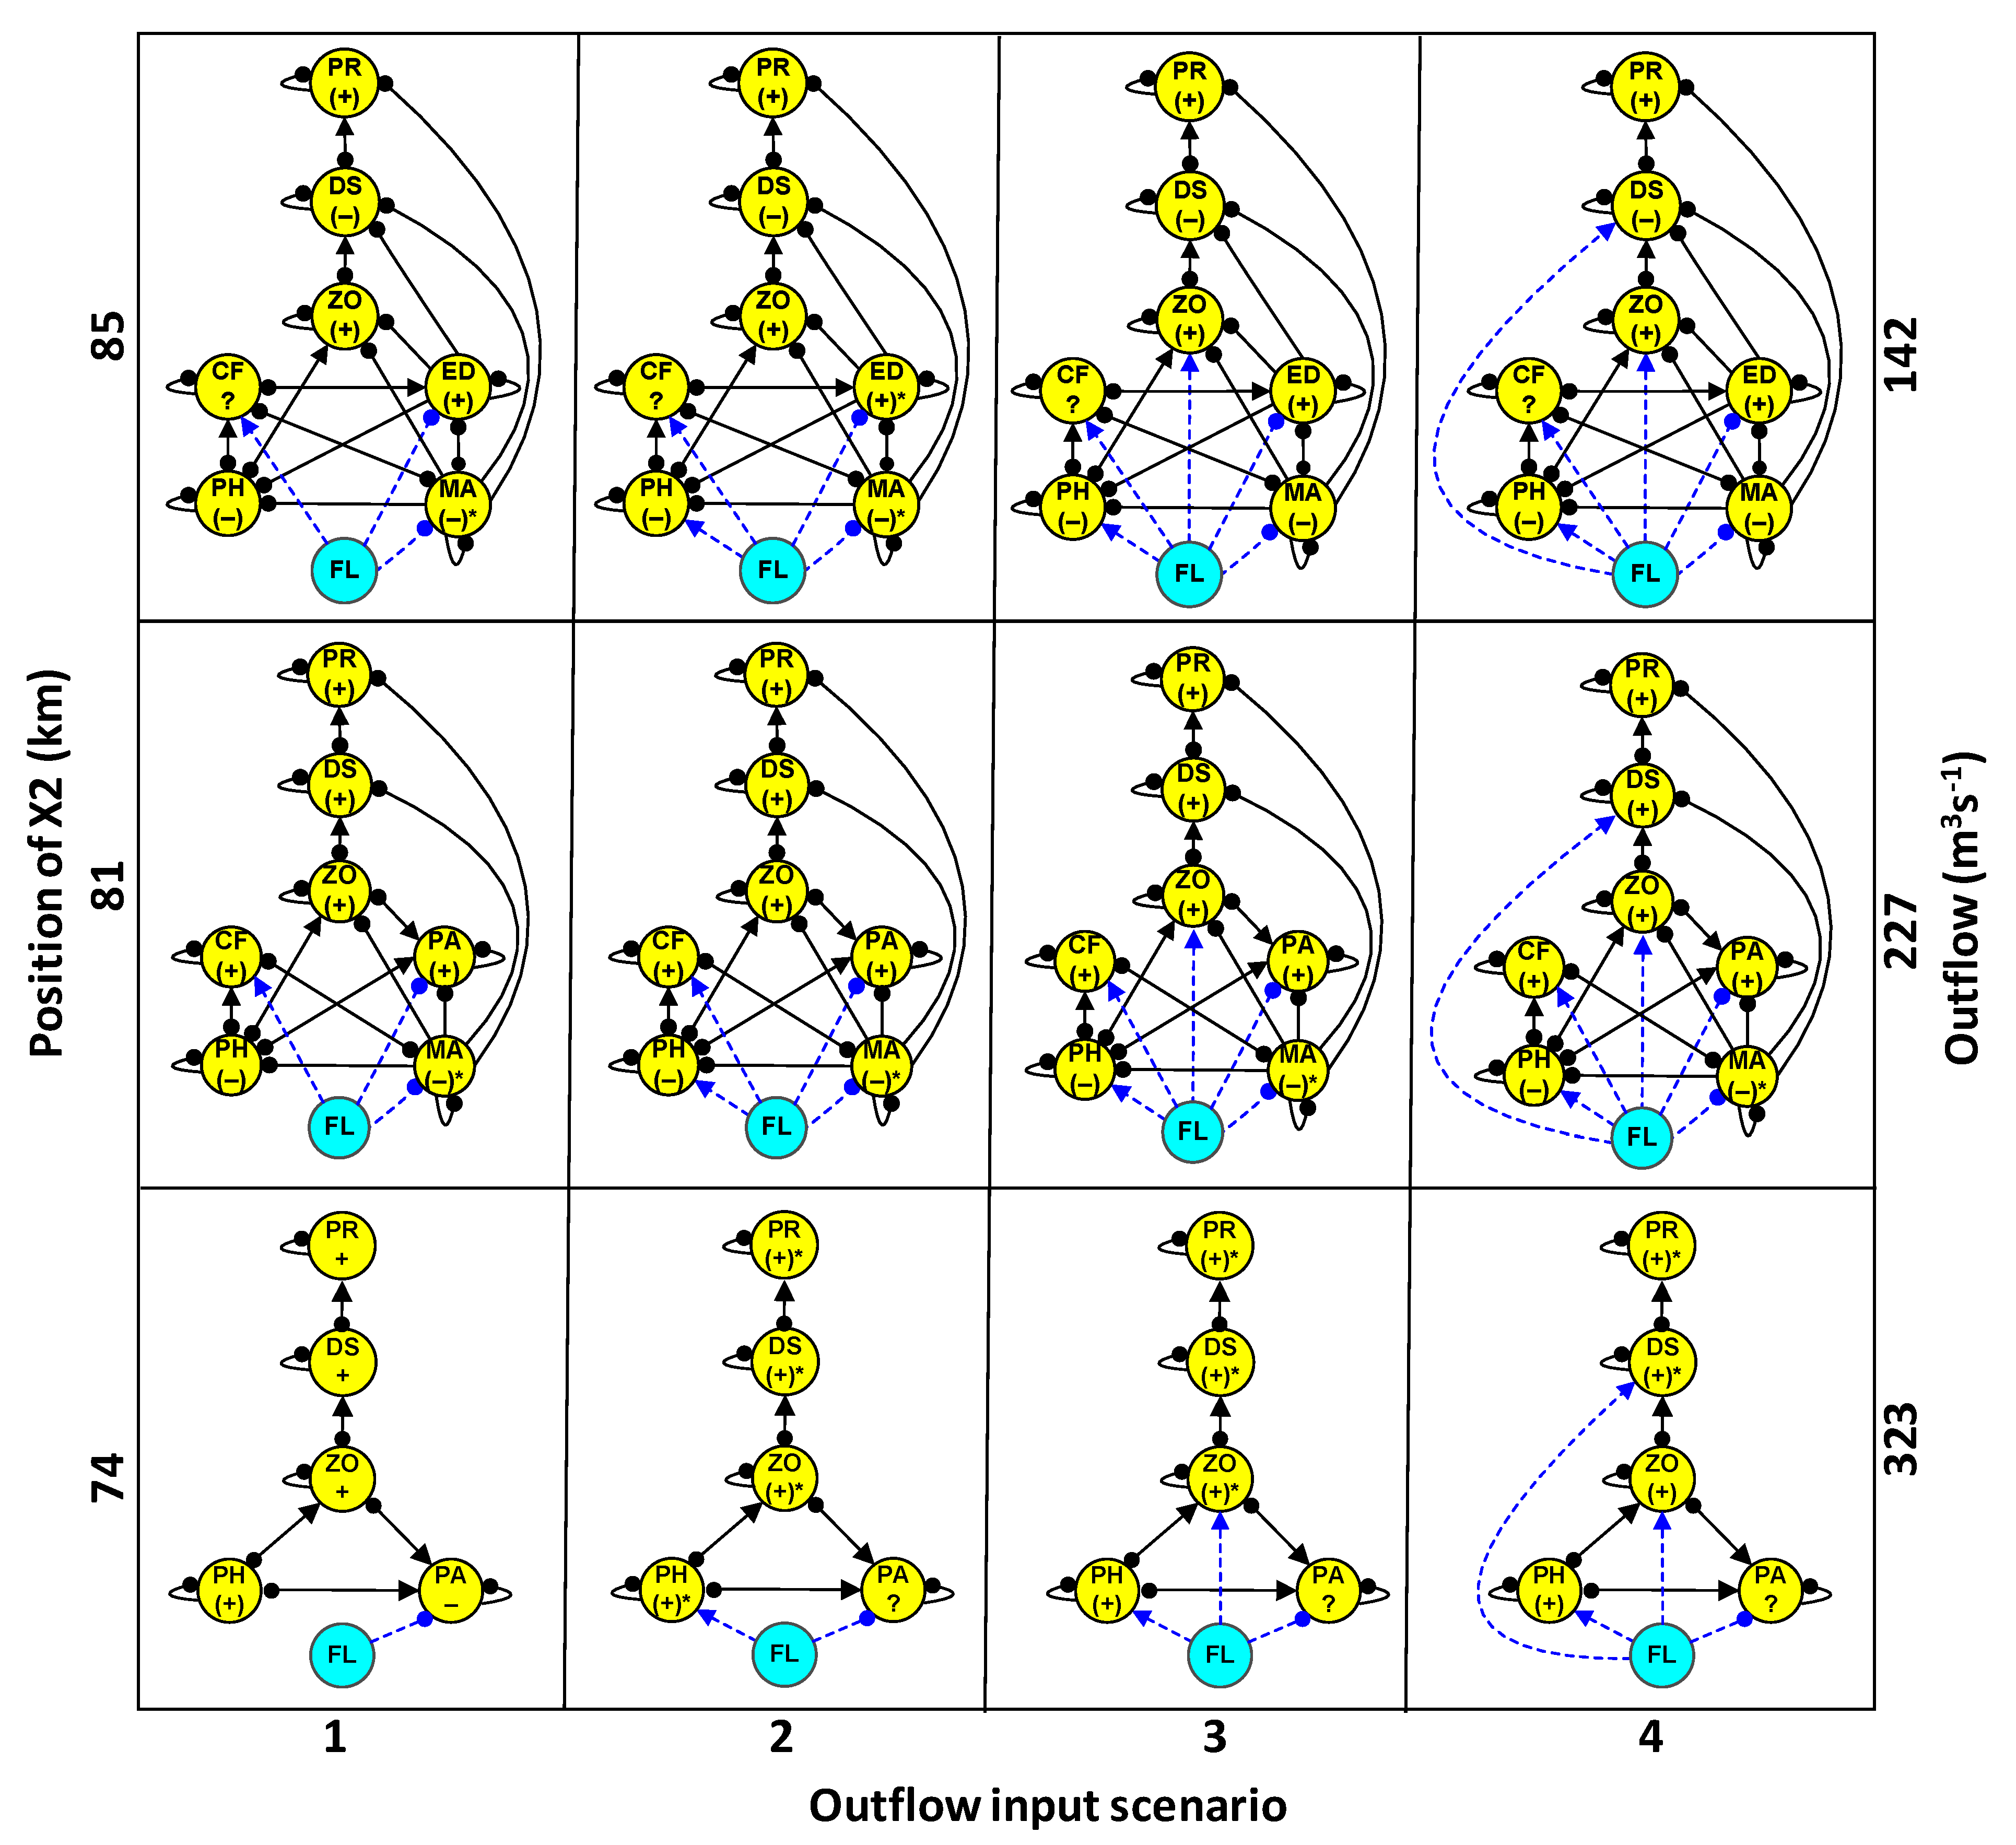
- Estimation of the direction of change of community variables (+, 0, −) in response to increased outflow (Table 1). Four outflow input scenarios were modeled, with the first scenario accounting for the effect of outflow on the previously referred species having significant ecological impacts. The outflow inputs for the three subsequent scenarios were used to evaluate whether cumulative outflow inputs in each subsystem could reinforce or reverse potential responses on delta smelt and other community variables. These scenarios included: scenario 1 + phytoplankton (scenario 2), scenario 2 + zooplankton (scenario 3), and scenario 3 + delta smelt (scenario 4).
2.4. Qualitative Analyses
The modeled subsystem at each X2 position was considered stable if the two Routh–Hurwitz (R–H) criteria [94] were met. The first R–H criterion requires all roots of the characteristic polynomial be different from zero and have the same sign. The second R–H criterion requires all Hurwitz determinants be positive, resulting in stronger feedback at lower feedback levels than at higher levels. The effect of sustained input (Ch), on the rate of change of a hth variable corresponding to the jth variable in the community matrix was predicted assuming an ecosystem in moving equilibrium [29,71]. Such input could result in positive, negative, or no effect on the equilibrium magnitude or carrying capacity (Ni*) of a species. The inverse of the negative community matrix (−Aij−1) provides an estimate of change in the equilibrium level of variable Ni* carrying capacity due to change in parameter Ch [95].
where −CjiT is the adjoint of the negative community matrix (Adj − Aij), and |−Aij| is the determinant of the negative community matrix. Since |−Aij| is constant and positive for each element of −A−1 in stable ecosystems, the predicted response under local equilibrium was inferred from the Adj − A:
which corresponds to the transpose of the negative cofactor matrix [33]. The absolute number of positive and negative complementary feedback cycles (Tc) which contributes to each element of the Adj − A was used to derive model uncertainty. Because Tc differed from zero in all present models, it was deemed practical to modify the weighted prediction matrix [47] to express both the direction of change in response to input and its uncertainty by defining a signed weighted prediction matrix (Ws):
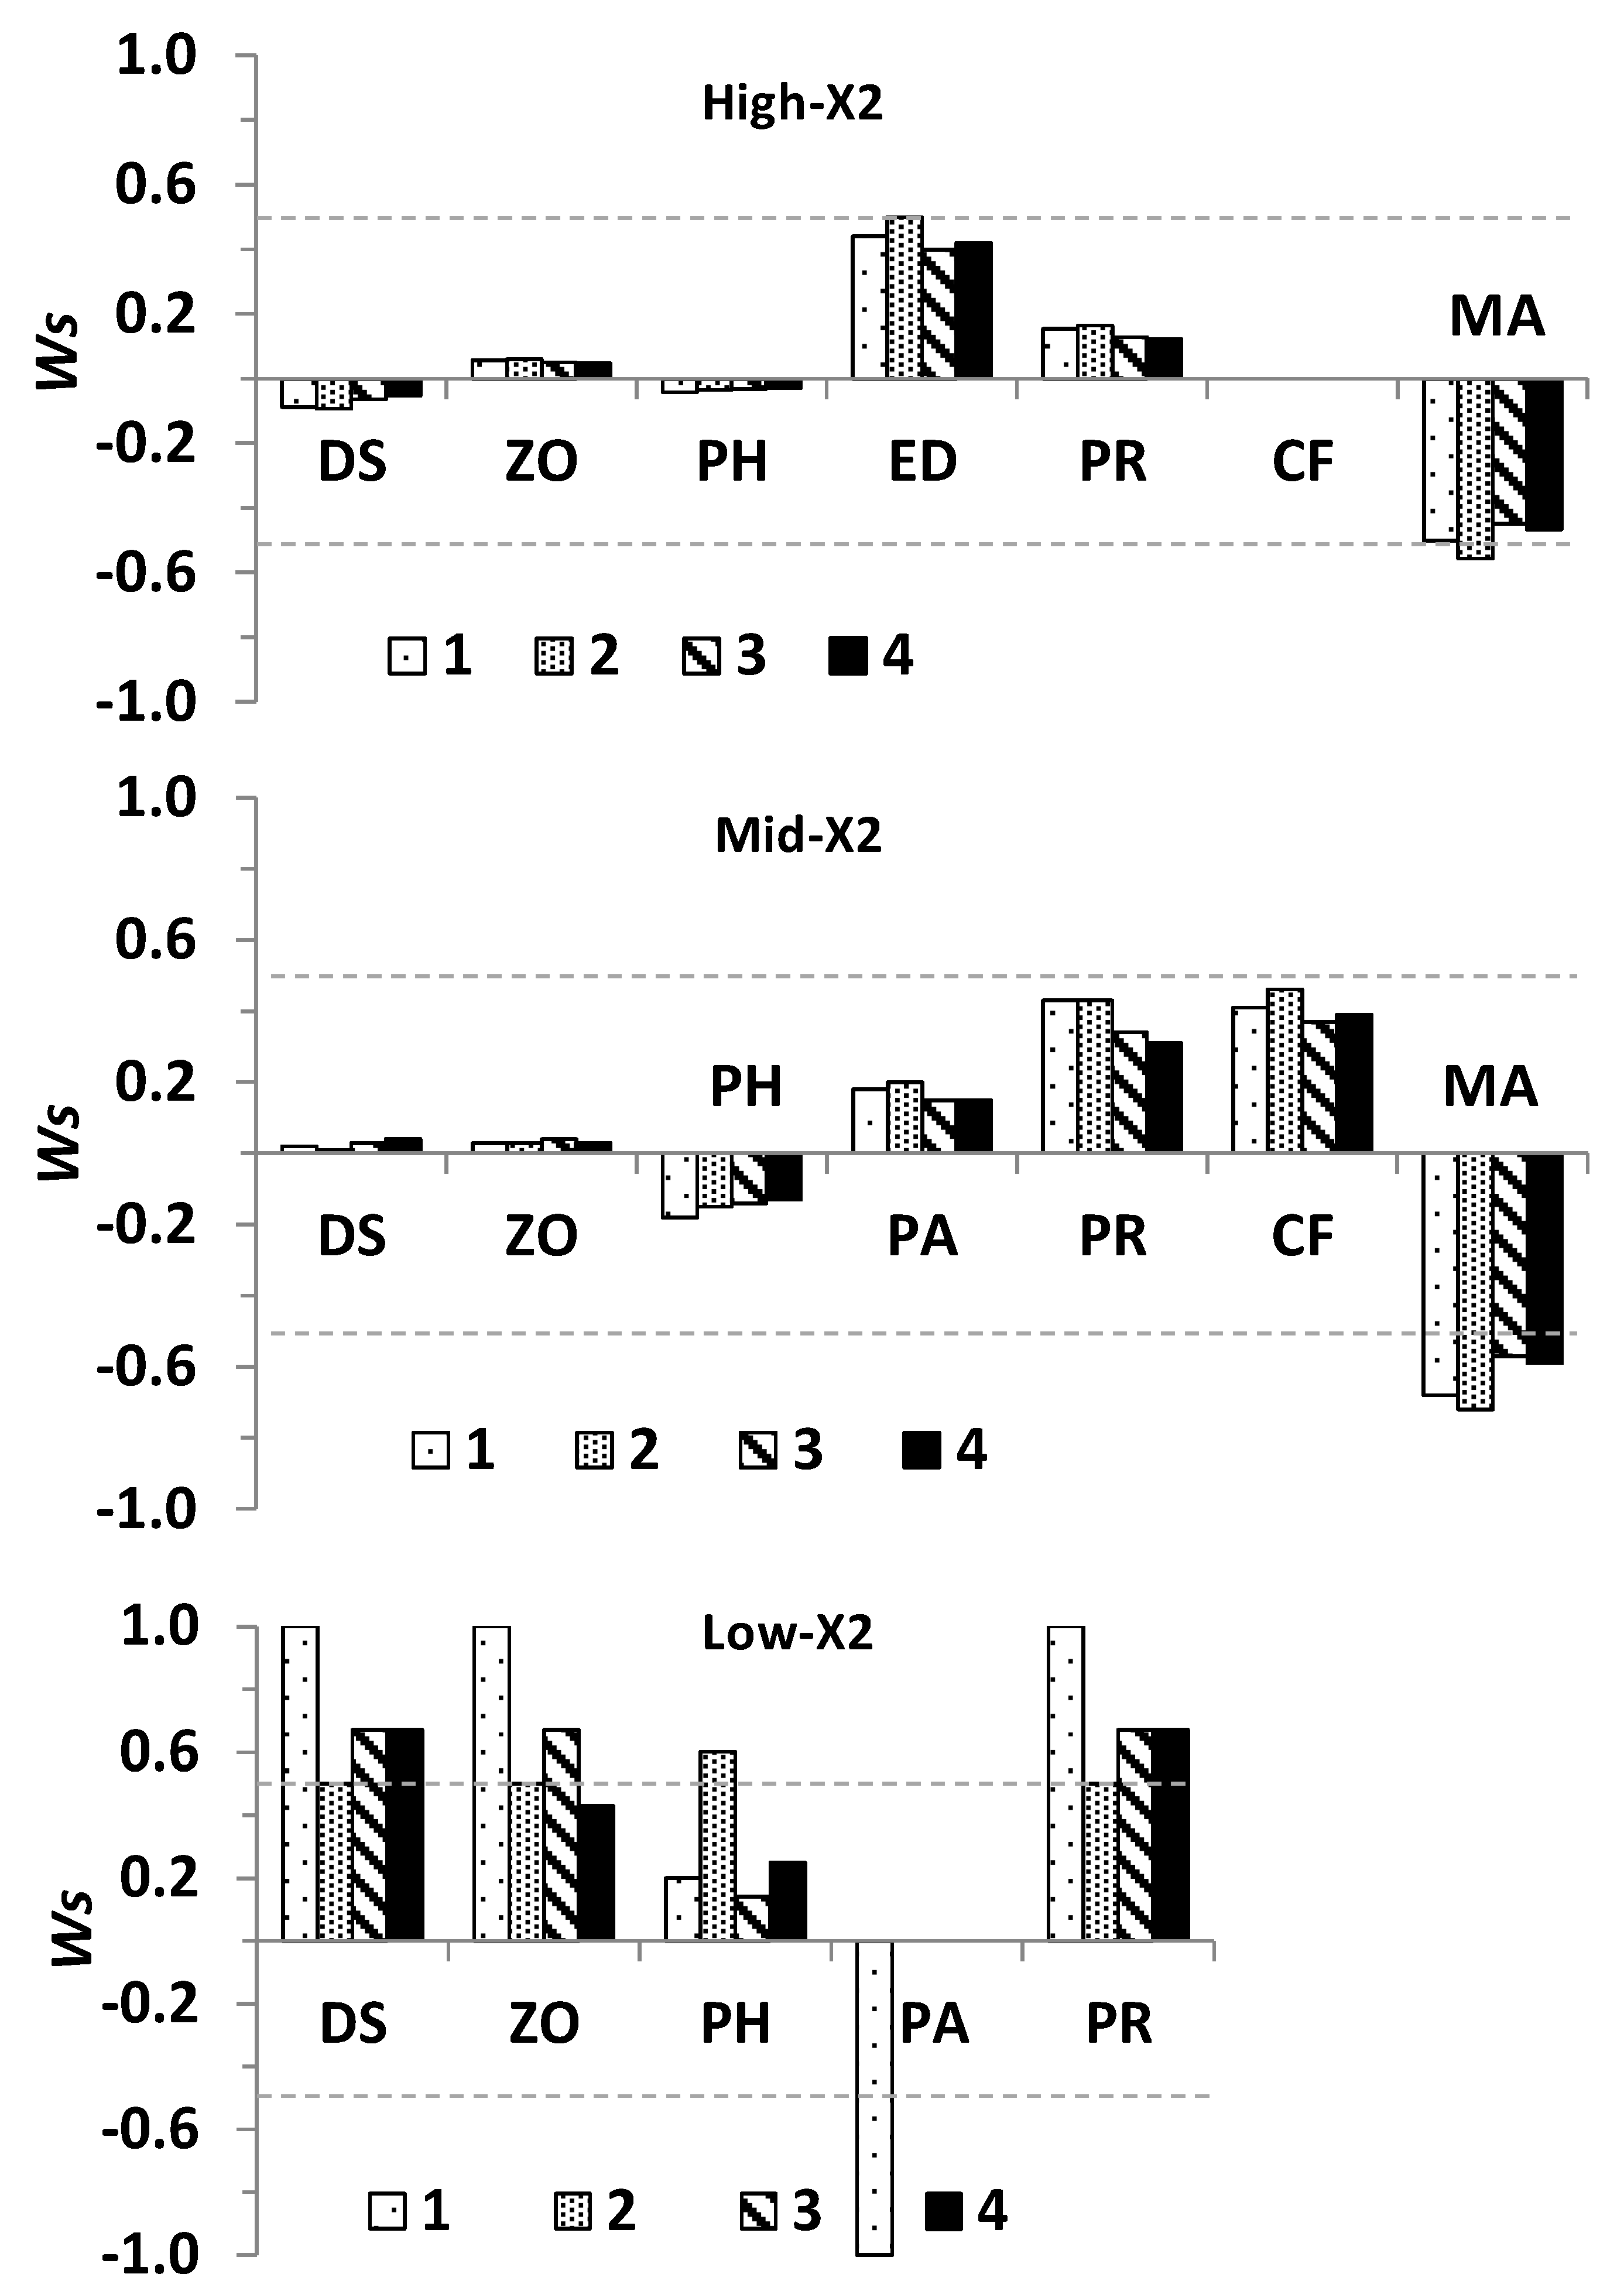
where Adj − A is as defined in Equation (4), and “→” is a vectorized matrix operator denoting element-by-element division for each element of the Ws matrix [47], and Tc is as defined earlier and ≠ 0. Hence, both the lowest Ws value (−1, negative response) and highest Ws value (+1, positive response) indicate unconditional sign determinacy and Ws = 0 denote total uncertainty in the direction of change, while absolute values of Ws ≥ 0.5 and < 1 are indicative of high level of sign determinacy, after [27].
To estimate the overall influence of a press input (Pk) due to a disturbance k acting directly upon two or more variables, the combined effect of Pk on the direction of change for community variable i and their corresponding uncertainty level was computed from the corresponding matrix element Wsik (Equation (5)) and these were derived from a modified community matrix specifying press inputs ():
where a11 to ann represent the interaction elements aij of community matrix Ao, and Pik denotes the press input k on community variable i, which in a qualitatively defined ecosystem is specified as having positive (1), negative (−1) or no effect (0). The last row of matrix includes zero elements to denote no effect of community variables on Pk, and a negative element (−1) to preserve the stability of matrix provided the community matrix Ao is stable. Qualitative analyses were conducted in Maple 18 [47].
2.5. Quantitative Simulations
Simulations using further enabled to quantitatively assess the stability of the community and the direction of change of its variables relative to the qualitatively specified matrix with same structure and sign of interactions. Simulations were performed by assigning interaction strengths between 0.01 and 1.0 to non-zero elements using a pseudorandom number generator from a uniform distribution [31]. The overall direction of change and determinacy in a quantitatively-specified ecosystem was derived from the proportional net change for each community variable (Δ):
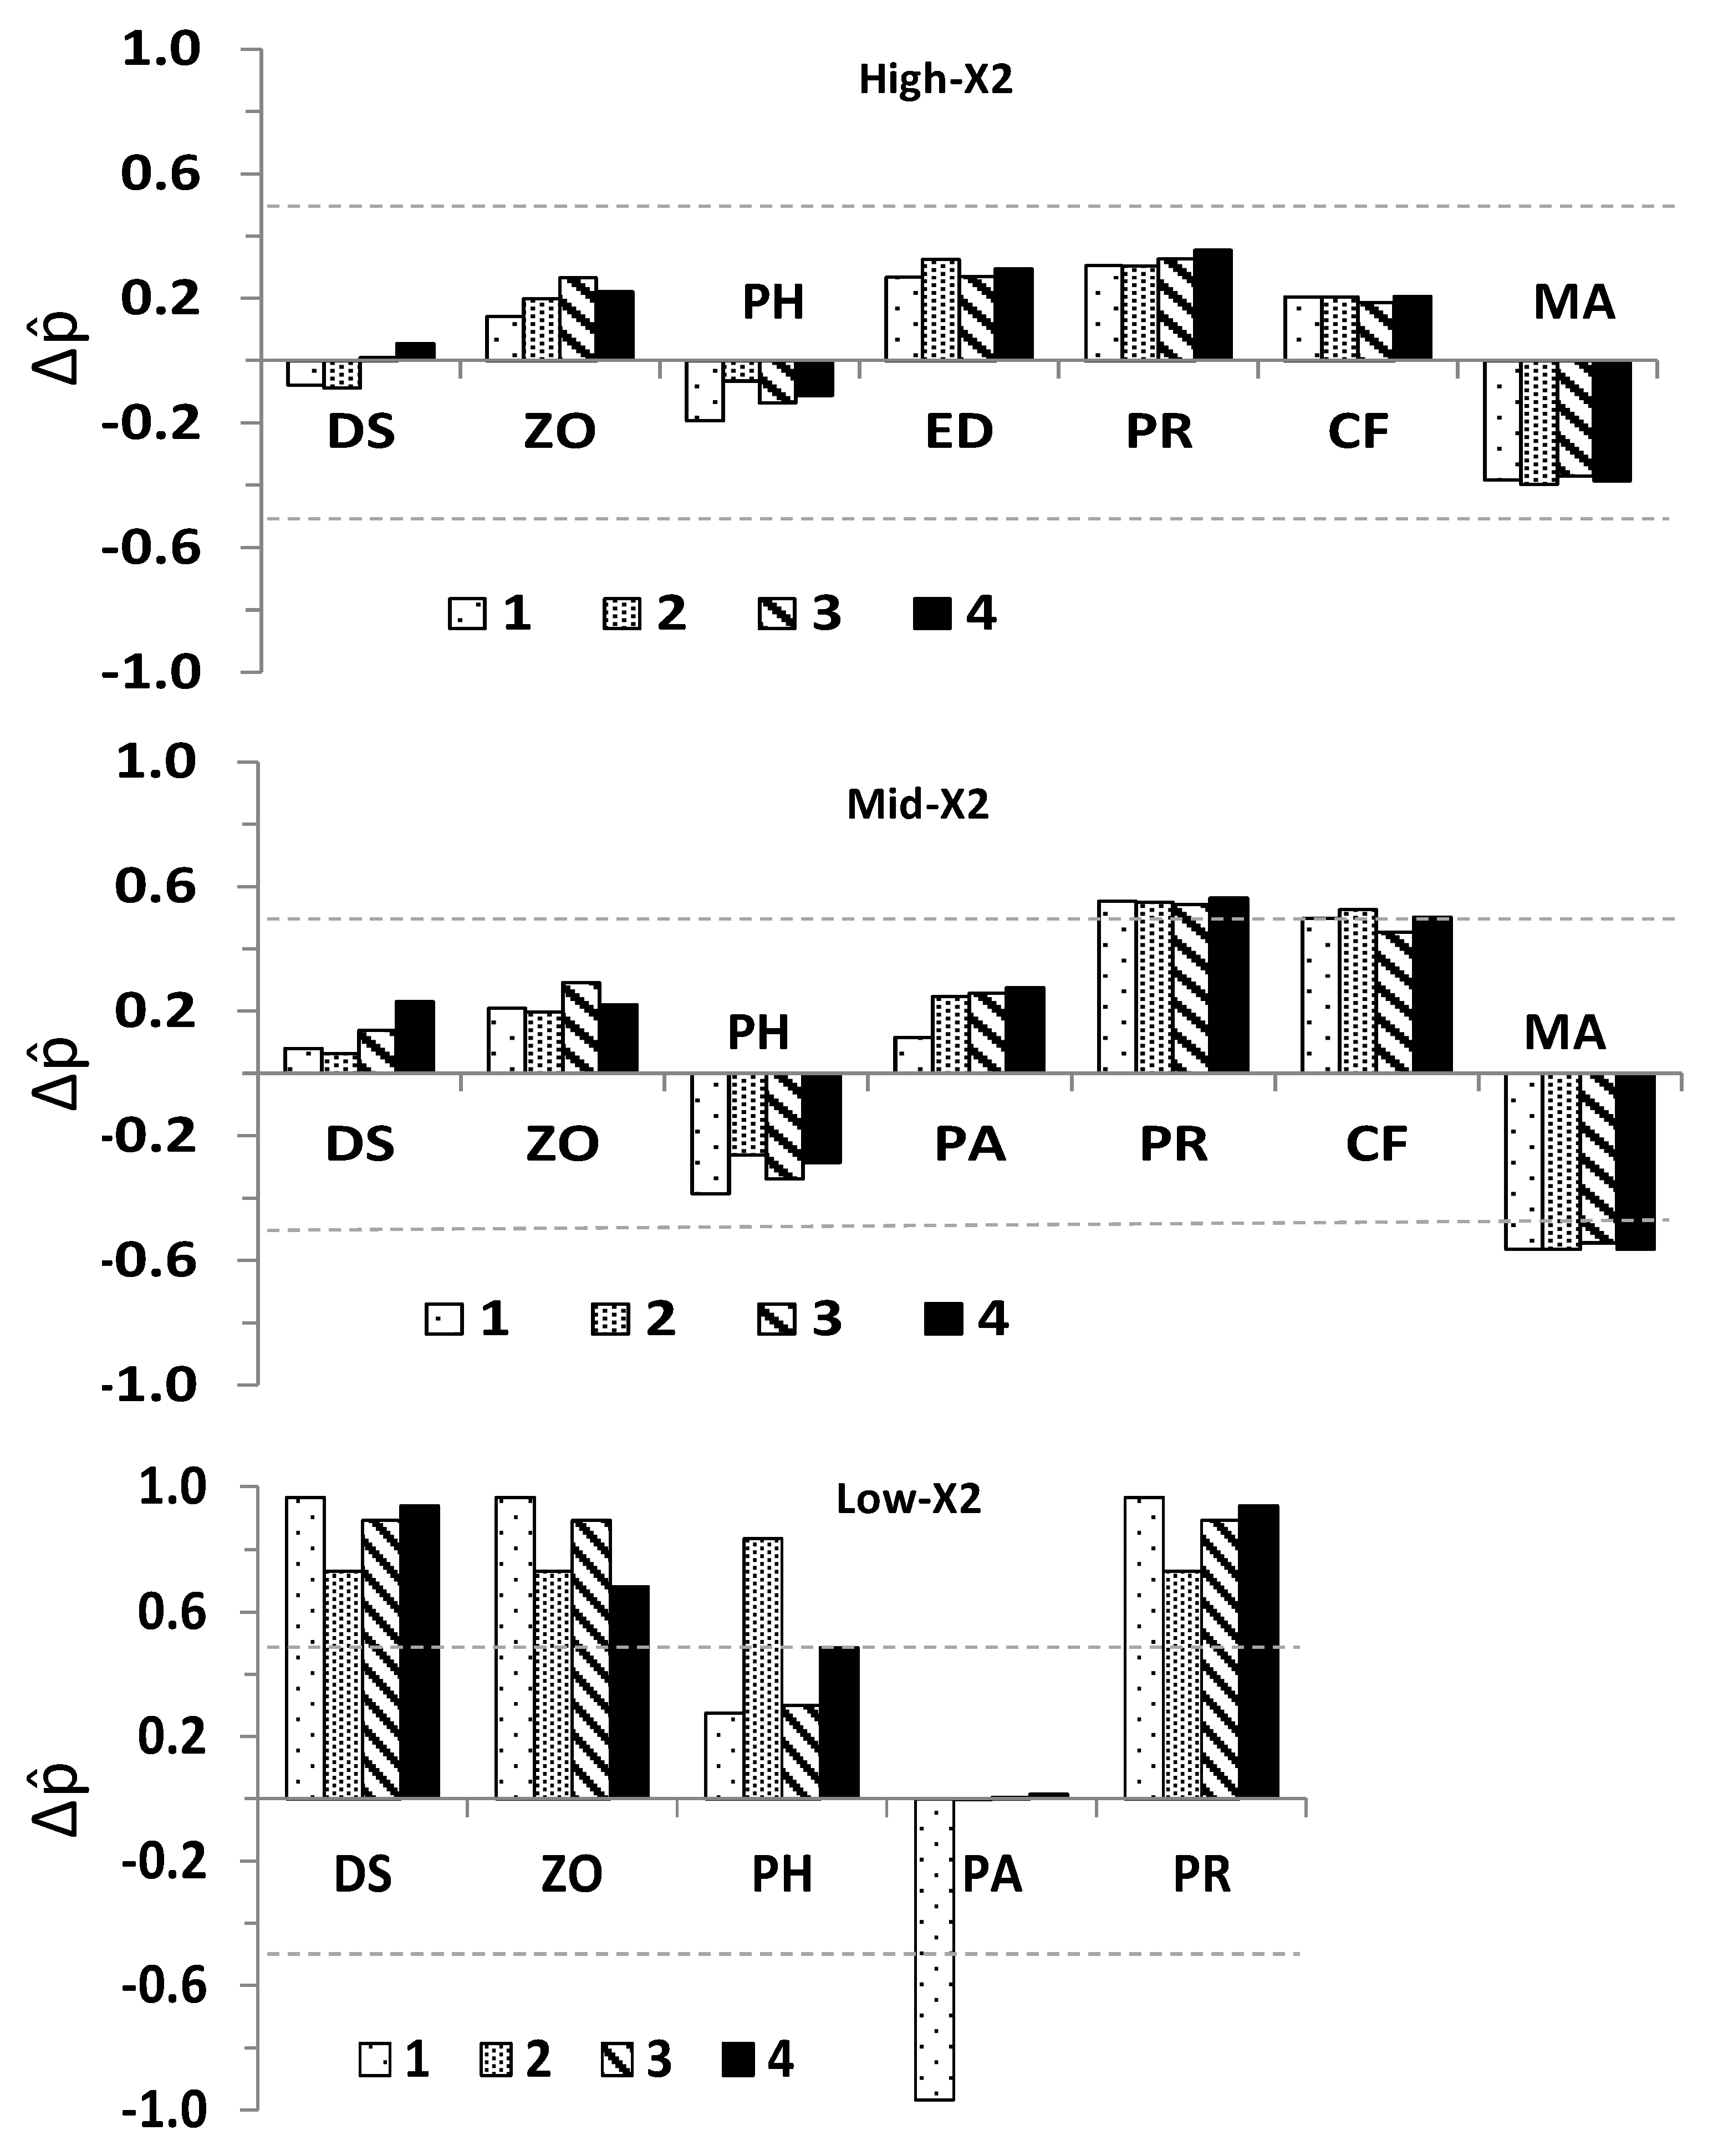
where f(+Adj − Aik)* and f(−Adj − Aik)* respectively denote the absolute frequencies of positive and negative Adj − Aik in stable matrices, and N is the total number of simulations for each perturbation scenario, including stable and non-stable matrices (N = 10,000). As in the case of Ws, the value of Δ provided both the overall direction of change and its uncertainty for each community variable, with extreme potential values (Δ = −1, negative response and Δ = 1, positive response) both indicating no uncertainty in the direction of change among simulations, Δ ≥ |0.5| and < |1|indicating low uncertainty, and Δ = 0 denoting total uncertainty. Quantitative simulations were performed in a program written in C# version 3.0 [96].
2.6. Statistical Analyses
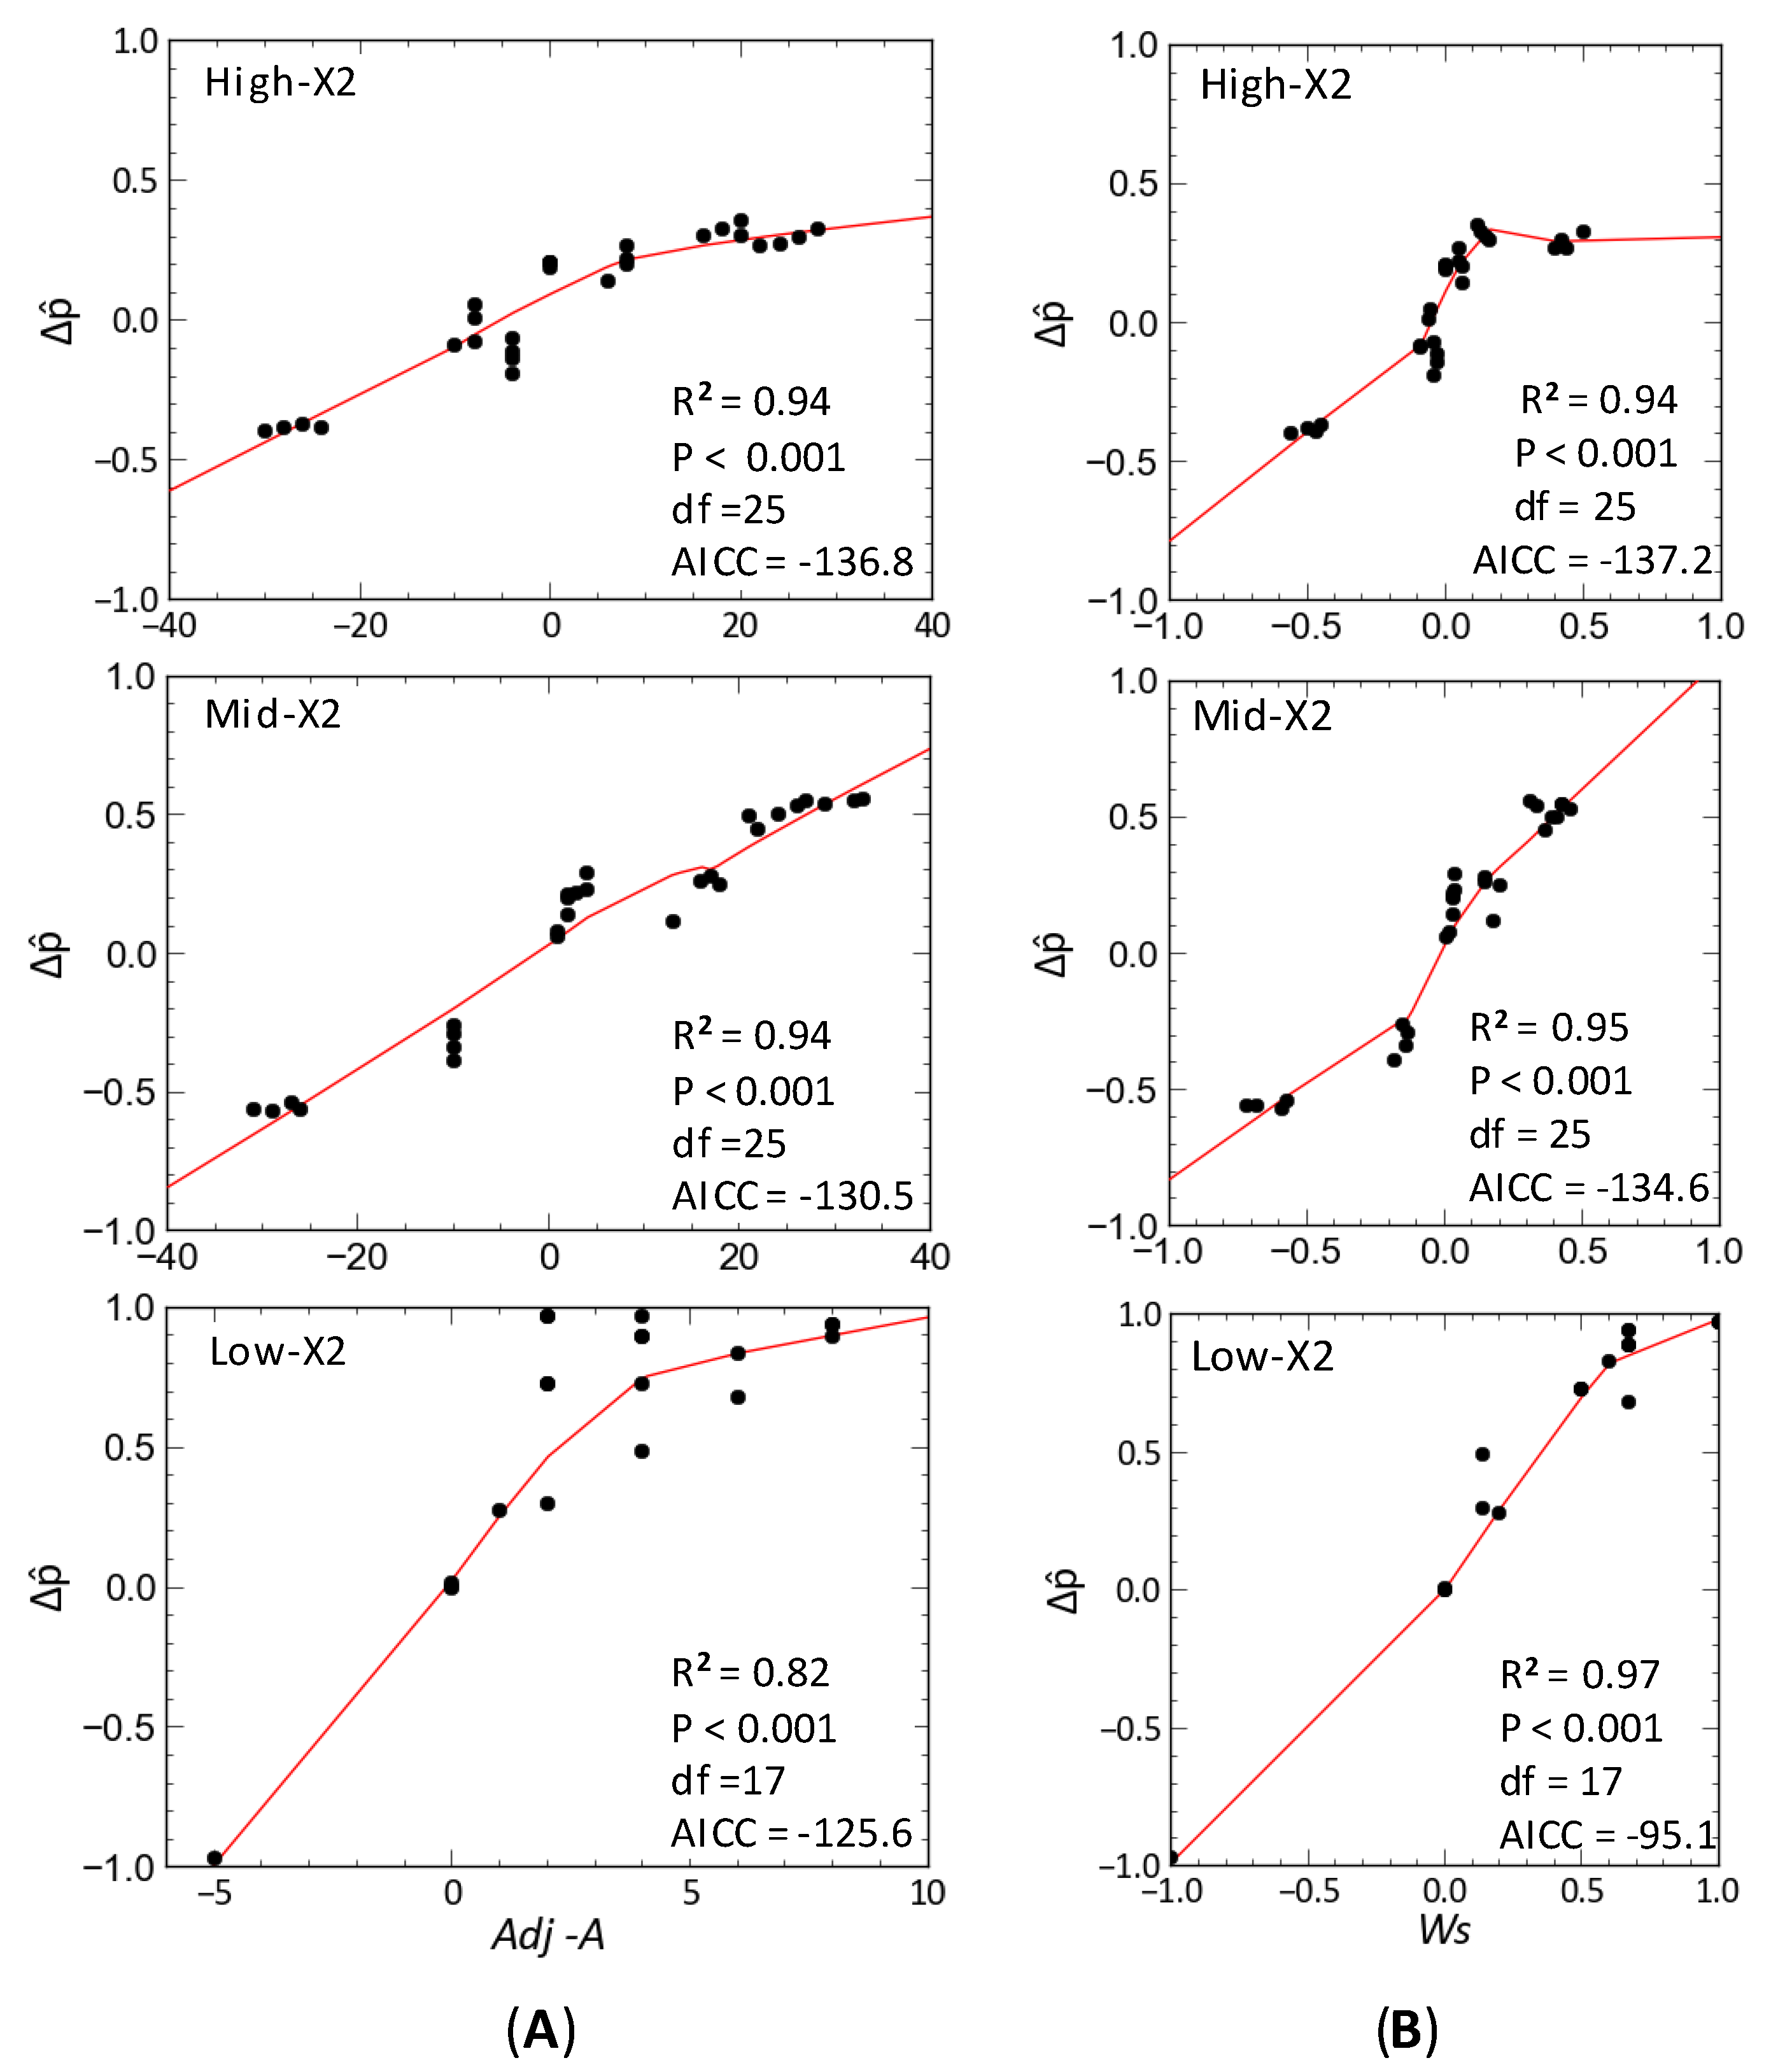
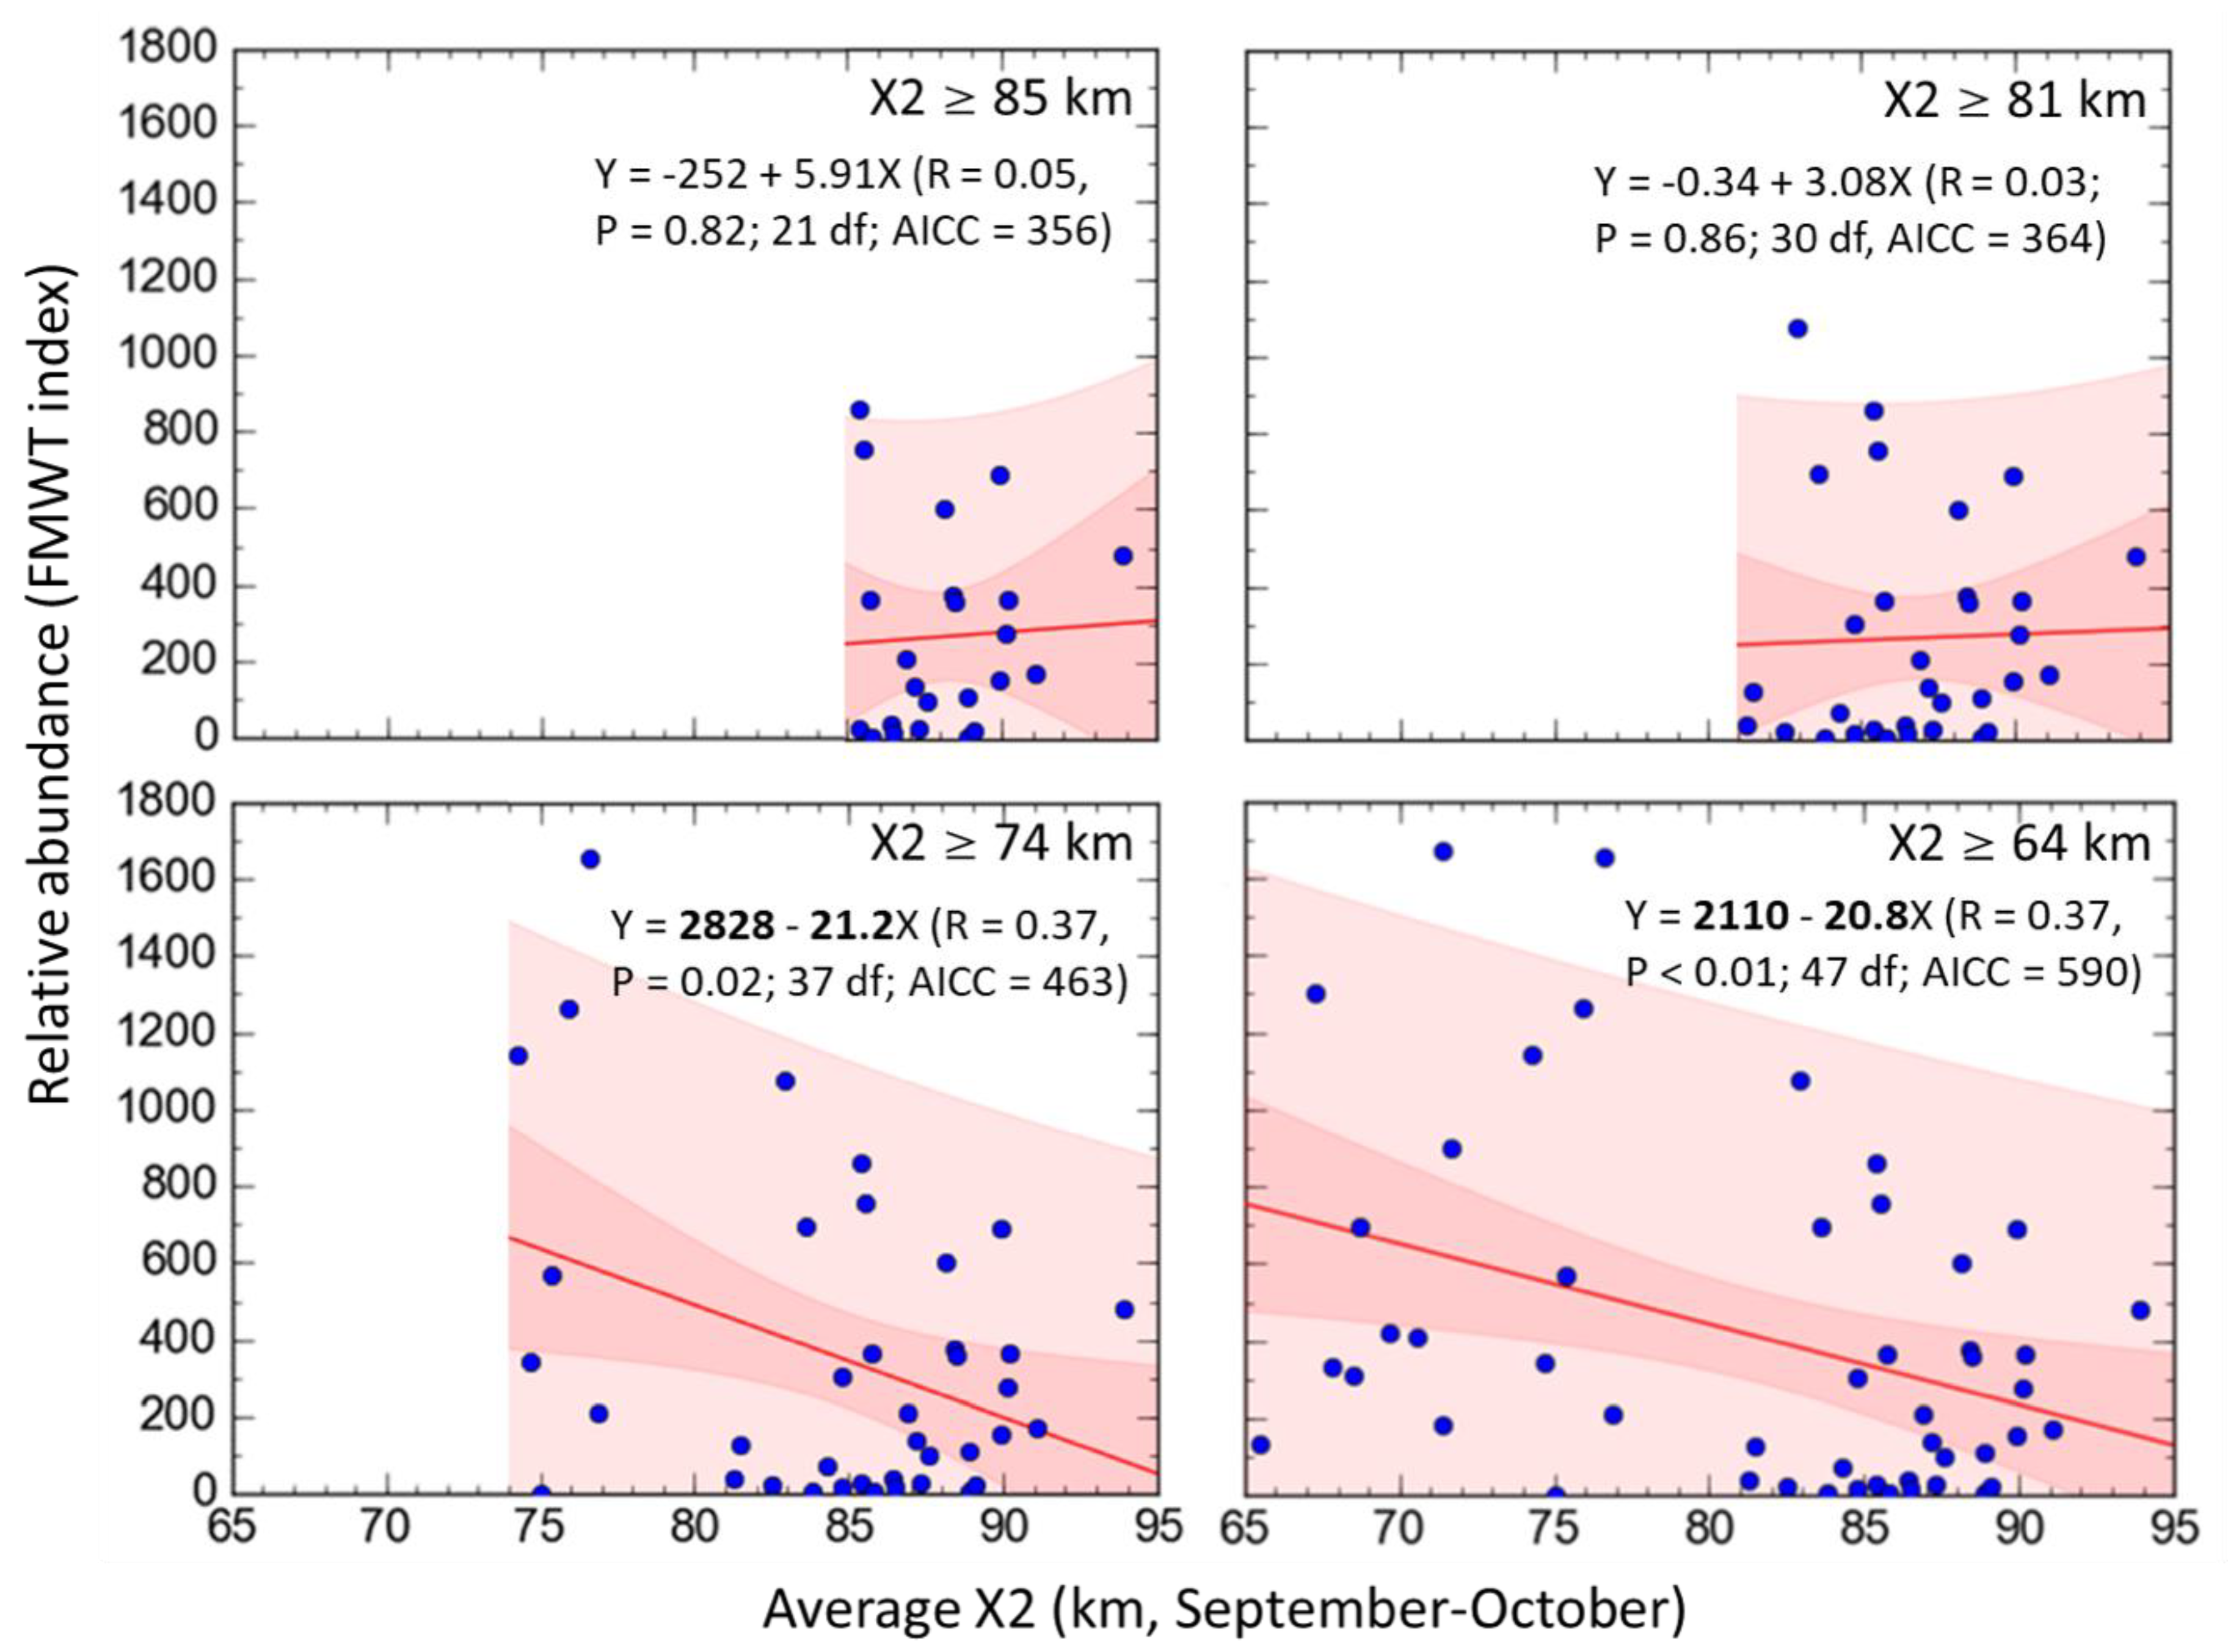
To determine the extent to which the predicted response to outflow input by each variable in qualitative models represented the overall direction of change in quantitative simulations, Δ was plotted vs. Adj − A for all scenarios at each X2 position. Values of Δ were also plotted vs. Ws to compare the direction of change and uncertainty between qualitative and quantitative predictions. These variables were fitted at each X2 position using Lowess smoothing. The predicted population response for subadult delta smelt by community models at each X2 position was compared with the relative abundance for subadult delta smelt as a function of X2 to evaluate model predictions. Relative abundance data for subadult delta smelt, monitored since 1967, was obtained from the California Department of Fish and Wildlife’s Fall midwater trawl index for the period 1967–2017 [97]. The average position of X2 during September–October was derived from the California Department of Water Resources Dayflow program [51]. Linear regression analysis was used to evaluate the slope of the relative abundance for delta smelt during fall (Y) versus the average X2 position in September–October (X). Regressions were conducted for three ranges of X2, which included the three X2 positions in community models (X2 ≥ 74, ≥81, and ≥85 km). The entire historical record of subadult delta smelt abundance as a function of the average September–October X2, was further considered as a baseline relative to the three X2 positions evaluated in the present community models and a previous fall outflow evaluation [24]. Data were analyzed and plotted using Curve Expert Professional (version 2.6; D.G. Hyams).
3. Results
3.1. Community Stability
Compared to the models at the low X2 position, the modeled communities at the mid- and high-X2 positions included a higher number of introduced species and more non-trophic interactions (Figure 3, Appendix A). Although all qualitative community models were stable, the percent of stable simulations decreased greatly from downstream (low X2) to upstream (high X2) positions in the LSZ, and such decrease in stability seemed primarily due to the increasing percent of models with stronger high-level feedbacks than low-level feedbacks at the mid- and high-X2 positions (Table 2).
3.2. Community Response to Outflow
The predicted change in abundance for delta smelt and other community variables to outflow input varied greatly among the three X2 positions (Figure 4), both in the case of qualitative models (Figure 5) and simulations (Figure 6). In response to outflow input for the delta smelt subsystem at the low X2 position (Figure 4), the predicted direction of change in the abundance of all community variables was positive, except for the clam P. amurensis, with predicted responses of species and trophic levels generally showing high sign determinacy, particularly for delta smelt, its predators, and zooplankton across most outflow input scenarios (Figure 5 and Figure 6). Outflow input at the mid X2 position (Figure 4), revealed the cyanobacterium M. aeruginosa was the only community variable with a consistently negative response and high sign determinacy in both qualitative models and simulations. Yet, the clam C. fluminea and predators of delta smelt showed high sign determinacy under most quantitative simulation scenarios at the mid X2 position (Figure 5 and Figure 6).
The cyanobacterium M. aeruginosa suggested a negative response to outflow at the high X2 position (Figure 4), but to a lower extent compared to the mid X2 position (Figure 5 and Figure 6). The Brazilian waterweed, E. densa was the only other variable at the high X2 position indicating high degree of qualitative sign determinacy but only at one outflow scenario (Figure 5). In contrast, simulations at the high X2 position indicated all the predicted responses of community variables had low sign determinacy (Figure 6).
The relation between Δ and Adj − A indicated the predicted direction of change for species and trophic groups in response to outflow input was generally consistent between qualitatively and quantitatively specified subsystems at each X2 position; this despite a plateau in Δ was towards its highest values (Figure 7A). As inferred from Δ and Ws, the direction of change and degree of certainty in the direction of change in quantitatively specified simulations were associated with the corresponding qualitative model, with such relations appearing progressively more sigmoidal toward higher-X2 positions (Figure 7B).
3.3. Delta Smelt Abundance and X2
When only considering years in which the average position of X2 in September–October was located at 81 km and further upstream, the relative abundance of subadult delta smelt was not associated to the position of X2 (Figure 8). However, when all years in which X2 was located at 74 km or further upstream were included, the relative abundance of subadult delta smelt was inversely associated to the average position of X2 in September and October (Figure 8). Moreover, when considering all the years with available relative abundance for subadult delta smelt over the period 1967–2017, an inverse association between the relative abundance of subadult delta smelt and the average position of X2 during September–October was also detected, and such relation included X2 positions as low as 65 km (Figure 8).
4. Discussion
4.1. Community Stability
While the modeled subsystems in the upper SF Estuary at the low-, mid-, and high-X2 positions were qualitative stable based on the R–H criteria, quantitative simulations using such stability criteria revealed a significantly higher percent of stable models at the low X2 position, which could promote enhanced ecosystem resilience when the LSZ is predominantly located in the Suisun region (Figure 1). In contrast, a decreasing number of simulations met both R–H stability criteria at the mid- and high-X2 positions, respectively (Table 2). Such spatial stability pattern supports the hypothesis that fall outflows maintaining the X2 position at 74 km are more conducive to sustaining a community structure supporting the delta smelt population compared to upstream X2 positions. The stability patterns inferred from simulations are consistent with marked reductions in upstream fall habitat quality for subadult delta smelt and with the low abundance for this species since the early 2000s [24,54]. These changes have implicated long-term stressors in the upper SF Estuary, including water diversions, introduced species and contaminants [6,13,50]. As in the case of other ecosystems where native estuarine fish species evolved in turbid waters [98], the decreased turbidity in the Delta is partly due to the spread of E. densa and other introduced macrophytes, which have favored the population expansion of introduced predators [38,99]. Although herbicides have been used in an attempt to control macrophytes in the Delta, the extent to which such efforts have been effective is unclear. Nonetheless, some transitional waters formerly dominated by macrophytes seem to have shifted to pelagic ecosystems through the long-term use of herbicides [100].
4.2. Community Model Predictions
Comparisons between predicted population responses of community variables considered in this modeling study and field data [24] were possible for phytoplankton, zooplankton, P. amurensis, and delta smelt. Consistent with the direction of change and sign determinacy for delta smelt predictions at the low X2 position (Figure 4, Figure 5 and Figure 6), the relative abundance of subadult delta smelt in fall 2011 when X2 was at 74 km was a ten-fold higher compared to years with higher fall X2 positions since the decline of pelagic species in early 2000s [38]. As in the case of the stability for quantitatively simulated subsystems, the response of delta smelt to sustained outflow was influenced by the location of the LSZ and hence, the underlying community structure. When outflow caused X2 to reach 74 km in the Suisun region, a positive population response was suggested for delta smelt and such response had high sign determinacy despite the ambiguous response of P. amurensis under most outflow input scenarios.
Field data for phytoplankton in fall 2011 showed either similar or greater average phytoplankton biomass, as measured by chlorophyll-α, at the low-X2 position relative to the mid- and high-X2 positions [24]. Such field pattern could result from variability in the mass balance of phytoplankton production, total grazing, and transport [89,101]. A positive overall phytoplankton response to outflow input was only predicted for the models at the low-X2 position, and such prediction had low uncertainty or marginally low uncertainty for scenarios 2 and 4 (Figure 4, Figure 5 and Figure 6). Hence, suggesting a conditional phytoplankton response to outflow.
Despite the high variability in zooplankton biomass contributed by calanoids—a key prey item of delta smelt—such biomass seemed slightly higher at the low X2 position in fall 2011 compared to years in which the LSZ was found at higher X2 positions [24]. A positive response of zooplankton was predicted in the LSZ at the three X2 positions but such predictions only had low uncertainty at the low-X2 position under most outflow scenarios (Figure 4, Figure 5 and Figure 6). Importantly, considering the larger area of the LSZ when X2 is located at 74 km relative to higher X2 positions (Figure 1), the potential carrying capacity for species and trophic levels could be significantly higher when the LSZ overlaps Suisun Bay in the fall.
The field abundance of P. amurensis in the Suisun Bay region was lower during October 2011 when X2 was at 75 km compared to the same location in the lower-outflow year 2010, when fall X2 was at 85 km, which is consistent with a negative local response of this species to outflow ([56], their Table 1), and with the low uncertainty in the direction of change under scenario 1 for the low-X2 position (Figure 4, Figure 5 and Figure 6). In contrast, the uncertain direction of change of P. amurensis under other outflow input scenarios at the low X2 position implies the negative direct effect of outflow on P. amurensis would be offset by potential outflow-induced increases in its food supply. Because the approximate center of distribution and abundance of the clam P. amurensis is Suisun Bay and the downstream embayment, San Pablo Bay ([56,67], their Figure 3) its abundance is likely higher when the LSZ overlaps Suisun Bay relative to LSZ locations further upstream. Moreover, changes in its benthic abundance would not be as responsive to changes in the salinity field compared to pelagic species.
4.3. Delta Smelt Abundance under Different Ranges of X2
The predicted response for delta smelt in community models was generally consistent with the patterns of relative abundance for subadult delta smelt across different ranges of X2 (Figure 8). With the exception of 2011 and 2017, no years since 2000 have shown the average of X2 in September–October located in the Suisun region. However, as in the case of year 2017, low values of X2 in fall since 1967 have not always been associated with high relative abundance for subadult delta smelt (Figure 8). This suggest that additional abiotic factors can be important in controlling the abundance of delta smelt in some years. Unlike 2011, the summer 2017 was warmer than usual, which could have reduced the survival for juvenile delta smelt (e.g., [11,38]). Importantly, since year 2000 there has been a substantially lower occurrence of years where the average position of X2 in September–October was ≤75 km in the upper SF Estuary (11.1%) compared to the period 1967–1999 (39.4%). A contributing factor to such difference is the long-term increase in freshwater diversions, both upstream of the SF Estuary and in the south Delta. For example, total water diversions from 1986 to 2005 held X2 upstream of 71 km nearly 80% of the time. In contrast, assuming no upstream water diversions, X2 would have been maintained upstream of 71 km only 50% of the time [13].
The predicted response for delta smelt in community models was generally consistent with the reported decline of abiotic habitat quality indices of at higher positions of X2 (e.g., [10,54]). The present study suggests a key role of community structure in the LSZ given its influence on community stability and response to outflow. Hence, supporting the hypothesis that fall outflow exerts a positive influence on the abundance of subadult delta smelt when the X2 is positioned at 74 km [24]. When considering the four outflow scenarios for each of the three X2 positions, a generally similar response of community variables was apparent across outflow input scenarios, and this was suggested despite the overall ambiguity of subsystems at the mid- and high-X2 positions (Figure 5 and Figure 6). This implies the propagation of outflow inputs through multiple feedbacks in the community could make it difficult to distinguish specific outflow input mechanisms among years.
4.4. Community Models and Prediction Metrics
Because qualitative models sacrifice precision for generality and realism [71], the qualitative models used in this study were intended to provide insights on the community stability and the complex mechanisms mediating the response of delta smelt and its community to fall outflows, rather than quantifying changes in the abundance of community variables in the upper SF Estuary. Given the large differences in qualitatively derived stability among X2 positions, the use of Δ in quantitatively specified subsystems seemed a useful community metric to evaluate both the overall direction of change of community variables and the determinacy in the overall direction of change across subsystems with the same topology but varying interaction strengths. Although estimating the direction of change and the degree of uncertainty in the response of community variables to multiple inputs entails several steps (e.g., determining qualitative direction of change of community variables, the absolute feedback matrix and the weighted predictions from each element of the Adj − A, [47]), the present study showed that the response of community variables to multiple inputs can be alternatively obtained by defining the press inputs for each variable in a modified community matrix (). This enabled readily estimation of the qualitative response of each community variable, and their corresponding weighted predictions. In the case of communities without zero absolute feedback matrix elements, it is also feasible to define signed weighted predictions to facilitate comparisons between qualitative models and quantitative simulations. Moreover, the use of matrix can provide independent verification of detailed computations involving inputs to several community variables. For quantitatively specified communities, the use of matrix in combination with Δ seemed particularly useful to estimate the determinacy in the direction of change for each community variable under simulated press inputs and interaction strengths among community variables. Although the signed weighted feedback seemed a useful measure of uncertainty for qualitatively stable models, and was significantly related to the estimated uncertainty of quantitatively specified models (Figure 7B), quantitative simulations showed that interaction strength can greatly influence the stability of community models with the same sign structure of stable qualitative models. This in turn could influence the determinacy of the predicted direction of change following a perturbation. However, because the determinacy level indicated by Δ accounted for the percent of non-stable models in simulation analyses, the use of Δ can complement qualitative analyses of the community matrix and help to evaluate hypotheses about community stability and their response to perturbations.
Despite the differences in objectives and methods in past modeling studies related to pelagic fishes and their communities in Upper SF Estuary, independent analyses of flow-related metrics (e.g., X2, salinity, specific conductance, water diversions) have revealed that hydrological conditions play a major ecological role through their interactions with multiple natural and anthropogenic forces (e.g., [6,9,102]). For example, generalized additive models (GAM) have shown association between spatial and temporal patterns in specific conductance and turbidity and long-term declines in habitat quality for delta smelt and other pelagic fishes (e.g., [54,99]). Additional GAM-based habitat suitability scenarios for delta smelt suggested changes in outflow due to future development and climate change could lead to increased habitat declines for this species across a broad range of hydrological conditions [10]. A Bayesian-based multivariate autoregressive model (MAR) revealed increased spring and fall X2 could be linked to the decline of several pelagic fishes and their zooplankton prey since the early 2000s [55]. That study further suggested negative influence of spring and winter south Delta diversions and high summer water temperature on delta smelt. Another MAR model evaluating mechanisms of species invasions and their impacts in the Upper SF Estuary suggested salinity intrusion was a primary pressure facilitating species invasions and emphasized a central role introduced species in altering multi-trophic interactions [57]. Individual-based models for delta smelt have shown a combination of abiotic and biotic factors could control its population, including hydrodynamics, water temperature, zooplankton density, long-term changes in the prey-base, entrainment losses due to water diversions in the south Delta, and salinity (e.g., [103,104,105]). Moreover, hydrodynamic and statistical modeling showed the decline in phytoplankton in the upper SF Estuary could be largely explained by the combined impacts of increased freshwater diversions from the south Delta since the late 1960s, and the filter-feeding activity of the clam P. amurensis [106]. Hydrodynamic and statistical modeling also revealed that winter–spring diversions altered the salinity habitat for several species of pelagic fishes, and these changes were significantly associated to their corresponding interannual population trends [9]. Thus, these modeling studies lend further support to the connection between hydrological alteration and multiple processes contributing to the decline of pelagic fishes in the upper SF Estuary [13,38,102].
Given the physical variability of estuarine ecosystems (e.g., [6,13,15]), consideration of the variability in the salinity field seems particularly relevant when evaluating hydrodynamic forcing on estuarine communities. This study is the first qualitative analysis of the community matrix evaluating the role of freshwater flows on aquatic communities, and the first qualitative modeling study in transitional waters based on a hydrological model [75]. Qualitative community models in other estuaries have examined other types of disturbances, for example an intertidal community composed of native and introduced species (Yaquina Bay, Oregon, USA) suggested weak or absent overall feedback, which, to some extent could have buffered such community from impacts of introduced species [74]. In another estuarine community (Willapa Bay, Washington, USA), qualitative networks suggested ocean acidification could stimulate production of phytoplankton and eelgrasses [37]. Yet, the opposite predicted responses for two shellfish species were sensitive to the assumed perturbation on primary producers. This highlights the value of qualitative modeling to identify likely community outcomes while recognizing the uncertainties of complex ecological interactions. As in the case of the SF Estuary, other estuarine ecosystems have been primarily modeled quantitatively. For example, an oxygen-balance model coupled to fish growth models in a range of estuary types in South-Western Australia indicated that climate change could induce declines in river discharge, exacerbating the impacts of reduced rainfall and water diversions on hypoxia in these estuaries [107]. Such increased hypoxia could then magnify the significant reported differences in habitat quality for the growth and body condition of the teleost Acanthopagrus butcheri in those estuaries. A coastal ecosystem model (Integrated Compartment Model) in southern Louisiana, USA [108] suggested that even doubling current riverine flows would be insufficient to fully counteract the impacts of future sea level rise on forested wetlands, implying that habitat expansion for marine fishes would result in habitat contraction for freshwater fishes. Application of the ecosystem model AQUATOX 3.1 in the Minho Estuary, NW coast of Iberian Peninsula [109] revealed that estuarine production was strongly dependent on hydrodynamics, with temperature and river flow showing antagonistic interactions on macroinvertebrate communities. Given the increasing threats to transitional water ecosystems, the integration of qualitative and quantitative models to assess ecosystems responses to multiple perturbations could further promote ecologically sound management in these ecosystems.
4.5. Management Implications
Based on the modeled outflow-mediated community responses and the relations between subadult delta smelt abundance and fall X2 inferred from this study, the sustainability of this species could be compromised in part by the high prevalence of low- and mid- fall-outflows. Given the tendency of the delta smelt population to increase in high outflow years, the population could still be resilient provided the limited outflow in most years is not further reduced by the high percent of upstream water diversions [6,13], particularly in non-wet years [9]. While full understanding of the mechanisms by which outflow influences the abundance of a species like delta smelt does not seem necessary for conservation purposes, there is great value in continued experimental and modeling evaluations on the role of hydrological alteration and other perturbations to mitigate cumulative stressors in the upper SF Estuary, including those anticipated from climate change [10,11], provided such evaluations are implemented using sound ecological and adaptive management guidelines (e.g., [110,111,112]). Considering the long-term population declines for delta smelt and other native species like longfin smelt, Spirinchus thaleichthys, and their record low abundances since the drought beginning in 2012 [7,46], the positive influence of outflow in other seasons for delta smelt and other species (e.g., [7,9,38,102]) suggests the need to integrate flow adaptive management actions across species, seasons and hydrological conditions not restricted to wet years.
5. Conclusions
This study supports the conclusion that fall outflow in the upper SF Estuary tends to increase the abundance of delta smelt when the position of X2 overlaps Chipps Island (X2 = 74 km), but not when X2 is at 81 km or further upstream. The stability patterns of three modeled subsystems of delta smelt in the upper SF estuary support the hypothesis that fall outflows that maintain the X2 position at 74 km are more likely to result in a stable community structure supporting the delta smelt population compared subsystems located at higher X2 positions. Community models suggested a dual role of outflow in controlling the population dynamics delta smelt in the upper SF Estuary, first by determining the geographical location of the LSZ and the underlying community structure, and second by exerting press perturbations on community variables influencing biological rates, as mediated by trophic and non-trophic interactions. Outflow seemed to control community interactions and stability patterns at each X2 position by forcing the overlap among pelagic and benthic species and trophic levels based on their salinity-dependent and geographically-dependent distributions. Integration of flow adaptive management actions across seasons, species, and hydrological conditions could help to address the declining population trends for delta smelt and other native fish populations in the upper SF Estuary. Qualitative community models can complement ecological syntheses, hydrodynamic models and quantitative ecological models to inform ecologically sound management of aquatic ecosystems.
Author Contributions
The findings and conclusions of this study are those of the author and do not necessarily represent the views of the U.S. Fish and Wildlife Service.
Funding
This study was funded by the U.S. Bureau of Reclamation under agreement R15PG00046.
Acknowledgments
This study was based on the collective knowledge of the many scientists involved in the fall outflow studies in the San Francisco Estuary. Michael MacWilliams (Delta Modeling Associates) provided hydrodynamic model results for the salinity field and Janet Thompson (USGS) contributed valuable information on introduced clams. Jeff Dambacher (CSIRO) and Hans Luh (Oregon State University) provided valuable assistance with software codes. Julie Day, Kim Webb and Leo Polansky (U.S. Fish and Wildlife Service), and Anke Mueller-Solger (US Geological Survey), provided useful suggestions. Two anonymous reviewers provided constructive critical suggestions that improved this study.
Conflicts of Interest
The author declare no conflict of interest. Reference to trade names does not imply endorsement by the U.S. Government.
Appendix A

Table A1.
Qualitative interactions for modeled community variables defined in Table 1 at the high-, mid-, and low-X2 positions in the upper San Francisco Estuary. (References shown in parentheses).
Table A1.
Qualitative interactions for modeled community variables defined in Table 1 at the high-, mid-, and low-X2 positions in the upper San Francisco Estuary. (References shown in parentheses).
| High-X2 Variables | DS | ZO | PH | ED | PR | CF | MA |
| DS | −1 [71] | 1 [41] | 0 | −1 [64] | −1 [92] | 0 | −1 [70] |
| ZO | −1 [41] | −1 [71] | 1 [113] | −1 [114] | 0 | 0 | −1 [69] |
| PH | 0 | −1 [113] | −1 [71] | −1 [85] | 0 | −1 [115] | −1 [80] |
| ED | 0 | 0 | 0 | −1 [71] | 0 | 1 [116] | −1 [117] |
| PR | 1 [92] | 0 | 0 | 0 | −1 [71] | 0 | −1 [80] |
| CF | 0 | 0 | 1 [115] | −1 [100] | 0 | −1 [71] | −1 [118] |
| MA | 0 | 0 | 0 | −1 [119] | 0 | −1 [120] | −1 [71] |
| Mid-X2 Variables | DS | ZO | PH | PA | PR | CF | MA |
| DS | −1 [71] | 1 [41] | 0 | 0 | −1 [92] | 0 | −1 [70] |
| ZO | −1 [41] | −1 [71] | 1 [113] | −1 [66,88] | 0 | 0 | −1 [69] |
| PH | 0 | −1 [113] | −1 [71] | −1 [60] | 0 | −1 [115] | −1 [80] |
| PA | 0 | 1 [66,88] | 1 [60] | −1 [71] | 0 | 0 | −1 [118] |
| PR | 1 [92] | 0 | 0 | 0 | −1 [71] | 0 | −1 [80] |
| CF | 0 | 0 | 1 [115] | 0 | 0 | −1 [71] | −1 [118] |
| MA | 0 | 0 | 0 | 0 | 0 | −1 [120] | −1 [71] |
| Low-X2 Variables | DS | ZO | PH | PA | PR | ||
| DS | −1 [71] | 1 [41] | 0 | 0 | −1 [92] | ||
| ZO | −1 [41] | −1 [71] | 1 [113] | −1 [66,88] | 0 | ||
| PH | 0 | −1 [113] | −1 [71] | −1 [60] | 0 | ||
| PA | 0 | 1 [66,88] | 1 [60] | −1 [71] | 0 | ||
| PR | 1 [92] | 0 | 0 | 0 | −1 [71] |
References
- Townend, I.H. Identifying change in estuaries. J. Coast. Conserv. 2004, 10, 5–12. [Google Scholar] [CrossRef]
- Lotze, H.K.; Lenihan, H.S.; Bourque, B.J.; Bradbury, R.H.; Cooke, R.G.; Kay, M.C.; Kidwell, S.M.; Kirby, M.X.; Peterson, C.H.; Jackson, J.B.C. Depletion, degradation, and recovery potential of estuaries and coastal seas. Science 2006, 312, 1806–1809. [Google Scholar] [CrossRef]
- Borja, A.; Dauer, D.M.; Elliott, M.; Simenstad, C.A. Medium- and long-term recovery of estuarine and coastal ecosystems: Patterns, rates and restoration effectiveness. Estuaries Coasts 2010, 33, 1249–1260. [Google Scholar] [CrossRef]
- Gillson, J. Freshwater flow and fisheries production in estuarine and coastal systems: Where a drop of rain is not lost. Rev. Fish. Sci. 2011, 19, 168–186. [Google Scholar] [CrossRef]
- Grimaldo, L.F.; Sommer, T.; Van Ark, N.; Jones, G.; Holland, E.; Moyle, P.B.; Herbold, B.; Smith, P. Factors affecting fish entrainment into massive water diversions in a tidal freshwater estuary: Can fish losses be managed? N. Am. J. Fish. Manag. 2009, 29, 1253–1270. [Google Scholar] [CrossRef]
- Cloern, J.E.; Jassby, A.D. Drivers of change in estuarine-coastal ecosystems: Discoveries from four decades of study in San Francisco Bay. Rev. Geophys. 2012, 50. [Google Scholar] [CrossRef] [Green Version]
- Hobbs, J.A.; Moyle, P.B.; Fangue, N.; Connon, R.E. Is extinction inevitable for delta smelt and longfin smelt? An opinion and recommendations for recovery. SFEWS 2017, 15. [Google Scholar] [CrossRef]
- Cohen, A.N.; Carlton, J.T. Accelerating invasion rate in a highly invaded estuary. Science 1998, 279, 555–558. [Google Scholar] [CrossRef] [PubMed]
- Castillo, G.C.; Damon, L.J.; Hobbs, J.A. Community patterns and environmental associations for pelagic fishes in a highly modified estuary. Mar. Coast. Fish. 2018, 10, 508–524. [Google Scholar] [CrossRef]
- Feyrer, F.; Newman, K.; Nobriga, M.; Sommer, T. Modeling the effects of future outflow on the abiotic habitat of an imperiled estuarine fish. Estuaries Coasts 2011, 34, 120–128. [Google Scholar] [CrossRef]
- Komoroske, L.M.; Connon, R.E.; Lindberg, J.; Cheng, B.S.; Castillo, G.; Hasenbein, M.; Fangue, N.A. Ontogeny influences sensitivity to climate change stressors in an endangered fish. Conserv. Physiol. 2014, 2, cou008. [Google Scholar] [CrossRef] [PubMed]
- Schlacher, T.A.; Wooldridge, T.H. Ecological responses to reductions in freshwater supply and quality in South Africa’s estuaries: Lessons for management and conservation. J. Coast. Conserv. 1996, 2, 115–130. [Google Scholar] [CrossRef]
- Moyle, P.B.; Bennett, W.A.; Fleenor, W.E.; Lund, J.R. Habitat variability and complexity in the upper San Francisco Estuary. SFEWS 2010, 8. [Google Scholar] [CrossRef]
- Reinert, T.R.; Peterson, J.T. Modeling the effects of potential salinity shifts on the recovery of striped bass in the Savannah River Estuary, Georgia-South Carolina, United States. Environ. Manag. 2008, 41, 753–765. [Google Scholar] [CrossRef] [PubMed]
- Guenther, C.B.; MacDonald, T.C. Comparison of estuarine salinity gradients and associated nekton community change in the Lower St. Johns River Estuary. Estuaries Coasts 2012, 35, 1443–1452. [Google Scholar] [CrossRef]
- Wissel, B.; Fry, B. Tracing Mississippi River influences in estuarine food webs of coastal Louisiana. Oecologia 2005, 144, 659–672. [Google Scholar] [CrossRef] [PubMed]
- Vinagre, C.; Salgado, J.; Cabral, H.N.; Costa, M.J. Food web structure and habitat connectivity in fish estuarine nurseries—Impact of river flow. Estuaries Coasts 2011, 34, 663–674. [Google Scholar] [CrossRef]
- Estevez, E.D. Review and assessment of biotic variables and analytical methods used in estuarine inflow studies. Estuaries 2002, 25, 1291–1303. [Google Scholar] [CrossRef]
- Sakaris, P.C. A review of the effects of hydrologic alteration on fisheries and biodiversity and the management and conservation of natural resources in regulated river systems. In Current Perspectives in Contaminant Hydrology and Water Resources Sustainability; Bradley, P.M., Ed.; Tech: Rijeka, Croatia, 2013; pp. 273–297. [Google Scholar]
- Rowell, K.; Flessa, K.W.; Dettmana, D.L.; Román, M.J.; Gerberc, L.R.; Findley, L.T. Diverting the Colorado River leads to a dramatic life history shift in an endangered marine fish. Biol. Conserv. 2008, 141, 1138–1148. [Google Scholar] [CrossRef]
- Purtlebaugh, C.H.; Allen, M.C. Relative abundance, growth, and mortality of five Age-0 estuarine fishes in relation to discharge of the Suwannee River, Florida. Trans. Am. Fish. Soc. 2010, 139, 1233–1246. [Google Scholar] [CrossRef]
- Livingston, R.J. Trophic response of estuarine fishes to long-term changes of river runoff. Bull. Mar. Sci. 1997, 60, 984–1004. [Google Scholar]
- Kimmerer, W.J. Effects of freshwater flow on abundance of estuarine organisms: Physical effects or trophic linkages? Mar. Ecol. Prog. Ser. 2002, 243, 39–55. [Google Scholar] [CrossRef]
- Brown, L.R.; Baxter, R.; Castillo, G.; Conrad, L.; Culberson, S.; Erickson, G.; Feyrer, F.; Fong, S.; Gehrts, K.; Grimaldo, L.; et al. Synthesis of Studies in the Fall Low-Salinity Zone of the San Francisco Estuary, September–December 2011; US Geological Survey Scientific Investigations Report 2014–5041; US Geological Survey: Reston, VA, USA, 2014.
- Wootton, J.T.; Emmerson, M. Measurement of interaction strength in nature. Annu. Rev. Ecol. Evol. Syst. 2005, 36, 419–444. [Google Scholar] [CrossRef]
- Lane, P.; Levins, R. The dynamics of aquatic systems. The effects of nutrient enrichment on model plankton communities. Limnol. Oceanogr. 1977, 22, 454–471. [Google Scholar]
- Dambacher, J.M.; Li, H.W.; Rossignol, P.A. Qualitative predictions in model ecosystems. Ecol. Model. 2003, 161, 79–93. [Google Scholar] [CrossRef]
- Fox, J.W. Current food web models cannot explain the overall topological structure of observed food webs. Oikos 2006, 115, 97–109. [Google Scholar] [CrossRef]
- Levins, R. The qualitative analysis of partially specified systems. Ann. N. Y. Acad. Sci. 1974, 231, 123–138. [Google Scholar] [CrossRef] [PubMed]
- Li, H.W.; Moyle, P.B. Ecological analysis of species introductions into aquatic ecosystems. Trans. Am. Fish. Soc. 1981, 110, 772–782. [Google Scholar] [CrossRef]
- Dambacher, J.M.; Luh, H.K.; Li, H.W.; Rossignol, P.A. Qualitative stability and ambiguity in model ecosystems. Am. Nat. 2003, 161, 876–888. [Google Scholar] [CrossRef]
- Hosack, G.R.; Hayes, K.R.; Dambacher, J.M. Assessing model structure uncertainty through an analysis of system feedback and Bayesian networks. Ecol. Appl. 2008, 18, 1070–1082. [Google Scholar] [CrossRef]
- Li, H.W.; Rossignol, P.A.; Castillo, G. Risk analysis of species introduction: Insights from qualitative modeling. In Non-Indigenous Fresh Water Organisms in North America; Vectors of Introduction, Biology and Impact; Claudi, R., Leach, J., Eds.; Lewis Press: Boca Raton, FL, USA, 1999; pp. 431–447. [Google Scholar]
- Montano-Moctezuma, G.; Li, H.W.; Rossignol, P.A. Alternative community structures in a kelp-urchin community: A qualitative modeling approach. Ecol. Model. 2007, 205, 343–354. [Google Scholar] [CrossRef]
- Dambacher, J.M.; Brewer, D.T.; Dennis, D.M.; Macintyre, M.; Foale, S. Qualitative modelling of gold mine impacts on Lihir Island’s socioeconomic system and reef-edge fish community. Environ. Sci. Technol. 2007, 41, 555–562. [Google Scholar] [CrossRef]
- Ramos-Jiliberto, R.; Garay-Narváez, L.; Medina, M.H. Retrospective qualitative analysis of ecological networks under environmental perturbation: A copper-polluted intertidal community as a case study. Ecotoxicology 2012, 21, 234–243. [Google Scholar] [CrossRef] [PubMed]
- Reum, J.C.P.; Ferriss, B.E.; McDonald, P.S.; Farrell, D.M.; Harvey, C.J.; Klinger, T.; Levin, P.S. Evaluating community impacts of ocean acidification using qualitative network models. Mar. Ecol. Prog. Ser. 2015, 536, 11–24. [Google Scholar] [CrossRef]
- IEP (Interagency Ecological Program). An Updated Conceptual Model of Delta Smelt Biology: Our Evolving Understanding of an Estuarine Fish; Interagency Ecological Program for the San Francisco Bay/Delta Estuary. Technical Report 90; IEP: Sacramento, CA, USA, 2015. [Google Scholar]
- Jassby, A.D.; Kimmerer, W.J.; Monismith, S.G.; Armor, C.; Cloern, J.E.; Powell, T.M.; Schubel, J.R.; Vendlinski, T.J. Isohaline position as a habitat indicator for estuarine populations. Ecol. Appl. 1995, 5, 272–289. [Google Scholar] [CrossRef]
- Bennett, W.A. Critical assessment of the delta smelt population in the San Francisco Estuary, California. SFEWS 2005, 3. [Google Scholar] [CrossRef]
- Slater, S.B.; Baxter, R.D. Diet, prey selection, and body condition of age-0 delta smelt, Hypomesus transpacificus, in the Upper San Francisco Estuary. SFEWS 2014, 12. [Google Scholar] [CrossRef]
- Department of Fish and Wildlife. State and Federally Listed endangered and Threatened Animals of California; State of California, Natural Resources Agency, Department of Fish and Wildlife, Biogeographic Data Branch, California Natural Diversity Database: Sacramento, CA, USA, 2018.
- U.S. Fish and Wildlife Service. Formal Endangered Species Act Consultation on the Proposed Coordinated Operations of the Central Valley Project (CVP) and State Water Project (SWP); U.S. Fish and Wildlife Service, California and Nevada Region: Sacramento, CA, USA, 2008.
- Kimmerer, W.J.; MacWilliams, M.L.; Gross, E.S. Variation of fish habitat and extent of the low-salinity zone with freshwater flow in the San Francisco Estuary. SFEWS 2013, 11. [Google Scholar] [CrossRef]
- Sommer, T.; Mejia, F.H.; Nobriga, M.L.; Feyrer, F.; Grimaldo, L. The spawning migration of delta smelt in the upper San Francisco Estuary. SFEWS 2011, 9. [Google Scholar] [CrossRef]
- Moyle, P.B.; Brown, L.R.; Durand, J.R.; Hobbs, J.A. Delta smelt: Life history and decline of a once-abundant species in the San Francisco Estuary. SFEWS 2016, 14. [Google Scholar] [CrossRef]
- Dambacher, J.M.; Li, H.W.; Rossignol, P.A. Relevance of community structure in assessing indeterminacy of ecological predictions. Ecology 2002, 83, 1372–1385. [Google Scholar] [CrossRef]
- Cloern, J.E. Habitat connectivity and ecosystem productivity: Implications from a simple model. Am. Nat. 2007, 169, E21–E33. [Google Scholar] [CrossRef] [PubMed]
- Sommer, T.; Armor, C.; Baxter, R.; Breuer, R.; Brown, L.; Chotkowski, M.; Culberson, S.; Feyrer, F.; Gingras, M.; Herbold, B.; et al. The collapse of pelagic fishes in the upper San Francisco Estuary. Fisheries 2007, 32, 270–277. [Google Scholar] [CrossRef]
- Arthur, J.F.; Ball, M.D.; Baughman, S.Y. Summary of federal and state water project environmental impacts in the San Francisco Bay-Delta estuary, California. In The San Francisco Bay: The Ecosystem. Further Investigations into the Natural History of San Francisco Bay and Delta with Reference to the Influence of Man; Hollibaugh, J.T., Ed.; Friesen Printers: Altona, MB, Canada, 1996; pp. 445–495. [Google Scholar]
- California Department of Water Resources. Dayflow Data. Available online: https://water.ca.gov/Programs/Environmental-Services/Compliance-Monitoring-And-Assessment/Dayflow-Data (accessed on 14 May 2019).
- CDEC (California Data Exchange Center). The California Data Exchange Center. California Department of Water Resources. Available online: http://cdec.water.ca.gov (accessed on 29 April 2019).
- IEP (Interagency Ecological Program). Portal to IEP Data and Metadata. Available online: https://water.ca.gov/Programs/Environmental-Services/Interagency-Ecological-Program/Data-Portal (accessed on 29 April 2019).
- Feyrer, F.; Nobriga, M.L.; Sommer, T.R. Multidecadal trends for three declining fish species: Habitat patterns and mechanisms in the San Francisco Estuary, California, USA. Can. J. Fish. Aquat. Sci. 2007, 64, 723–734. [Google Scholar] [CrossRef]
- MacNally, R.; Thomson, J.R.; Kimmerer, W.J.; Feyrer, F.; Newman, K.B.; Sih, A.; Bennett, W.A.; Brown, L.; Fleishman, E.; Culberson, S.D.; et al. Analysis of pelagic species decline in the upper San Francisco Estuary using multivariate autoregressive modeling (MAR). Ecol. Appl. 2010, 20, 1417–1430. [Google Scholar] [CrossRef] [Green Version]
- Peterson, H.A.; Vayssieres, M. Benthic assemblage variability in the upper San Francisco Estuary: A 27-year retrospective. SFEWS 2010, 8. [Google Scholar] [CrossRef]
- Kratina, P.; MacNally, R.; Kimmerer, W.J.; Thomson, J.R.; Winder, M. Human-induced biotic invasions and changes in plankton interaction networks. J. Appl. Ecol. 2014, 51, 1066–1074. [Google Scholar] [CrossRef]
- Santos, M.J.; Anderson, L.W.; Ustin, S.L. Effects of invasive species on plant communities: An example using submersed aquatic plants at the regional scale. Biol. Invasions 2011, 13, 443–457. [Google Scholar] [CrossRef]
- Durand, J.; Fleenor, W.; McElreath, R.; Santos, M.J.; Moyle, P. Physical controls on the distribution of the submersed aquatic weed Egeria densa in the Sacramento–San Joaquin Delta and implications for habitat restoration. SFEWS 2016, 14. [Google Scholar] [CrossRef]
- Nichols, F.H.; Thompson, J.K.; Schemmel, L.E. Remarkable invasion of San Francisco Bay (California, USA) by the Asian clam Potamocorbula amurensis. II. Displacement of a former community. Mar. Ecol. Prog. Ser. 1990, 66, 95–101. [Google Scholar] [CrossRef]
- Winder, M.; Jassby, A.D. Shifts in zooplankton community structure: Implications for food web processes in the Upper San Francisco Estuary. Estuaries Coasts 2011, 34, 675–690. [Google Scholar] [CrossRef]
- Nobriga, M.L.; Feyrer, F.; Baxter, R.D.; Chotkowski, M. Fish community ecology in an altered river delta: Species composition, life history strategies, and biomass. Estuaries 2005, 28, 776–785. [Google Scholar] [CrossRef]
- Light, T.; Grosholz, T.; Moyle, P. Delta Ecological Survey (Phase I): Nonindigenous Aquatic Species in the Sacramento-San Joaquin Delta, a Literature Review; U.S. Fish and Wildlife Service: Stockton CA, USA, 2005. [Google Scholar]
- Ferrari, M.C.; Ranåker, L.; Weinersmith, K.L.; Young, M.J.; Sih, A.; Conrad, J.L. Effects of turbidity and an invasive waterweed on predation by introduced largemouth bass. Environ. Biol. Fishes 2014, 97, 79–90. [Google Scholar] [CrossRef]
- Hestir, E.L.; Schoellhamer, D.H.; Greenberg, J.; Morgan-King, T.; Ustin, S.L. The Effect of submerged aquatic vegetation expansion on a declining turbidity trend in the Sacramento-San Joaquin River Delta. Estuaries Coasts 2016, 39, 1110–1112. [Google Scholar] [CrossRef]
- Kimmerer, W.J. Response of anchovies dampens effects of the invasive bivalve Corbula amurensis on the San Francisco Estuary foodweb. Mar. Ecol. Prog. Ser. 2006, 324, 207–218. [Google Scholar] [CrossRef]
- Carlton, J.T.; Thompson, J.K.; Schemel, L.E.; Nichols, F.H. Remarkable invasion of San Francisco Bay (California, USA) by the Asian clam Potamocorbula amurensis. I. Introduction and dispersal. Mar. Ecol. Prog. Ser. 1990, 66, 81–94. [Google Scholar] [CrossRef]
- Lehman, P.W.; Boyer, G.; Hall, C.; Waller, S.; Gehrts, K. Distribution and toxicity of a new colonial Microcystis aeruginosa bloom in the San Francisco Bay Estuary, California. Hydrobiologia 2005, 541, 87–90. [Google Scholar] [CrossRef]
- Ger, K.A.; Teh, S.J.; Goldman, C.R. Microcystin-LR toxicity on dominant copepods Eurytemora affinis and Pseudodiaptomus forbesi of the upper San Francisco Estuary. Sci. Total Environ. 2009, 407, 4852–4857. [Google Scholar] [CrossRef] [PubMed]
- Acuña, S.; Baxa, D.; Teh, S. Sublethal dietary effects of microcystin producing Microcystis on threadfin shad, Dorosoma petenense. Toxicon 2014, 60, 1191–1202. [Google Scholar] [CrossRef]
- Puccia, C.J.; Levins, R. Qualitative Modeling of Complex Systems. An Introduction to Loop Analysis and Time Averaging; Harvard University Press: Cambridge, MA, USA, 1985. [Google Scholar]
- Levins, R. Evolution in Changing Environments. Some Theoretical Explorations. Monographs in Population Biology; McArthur, R.H., Ed.; Princeton University Press: Princeton, NJ, USA, 1968. [Google Scholar]
- Puccia, C.J.; Levins, R. Qualitative Modeling in Ecology: Loop Analysis, Signed Digraphs and Time Averaging. In Qualitative Simulation Modeling and Analysis; Fishwick, P.A., Luker, P.A., Eds.; Advances in Simulation; Springer: New York, NY, USA, 1991; pp. 119–143. [Google Scholar]
- Castillo, G.C.; Li, H.W.; Rossignol, P.A. Absence of overall feedback in a benthic estuarine community: A system potentially buffered from impacts of biological invasions. Estuaries 2000, 23, 275–291. [Google Scholar] [CrossRef]
- MacWilliams, M.L.; Bever, A.J.; Gross, E.S.; Ketefian, G.S.; Kimmerer, W.J. Three-dimensional modeling of hydrodynamics and salinity in the San Francisco Estuary: An evaluation of model accuracy, X2, and the low–salinity zone. SFEWS 2015, 13. [Google Scholar] [CrossRef]
- Castillo, G. Annotated Bibliography of the Delta Smelt (Hypomesus transpacificus). Programmatic Review of Delta Smelt Program Elements (2005–06). Interagency Ecological Program. Available online: https://www.researchgate.net/publication/332725919 (accessed on 28 April 2019).
- Sommer, T.; Mejia, F.H. A place to call home: A synthesis of delta smelt habitat in the upper San Francisco Estuary. SFEWS 2013, 11. [Google Scholar] [CrossRef]
- Peterson, M.S. A conceptual view of environment-habitat-production linkages in tidal river estuaries. Rev. Fish. Sci. 2003, 11, 291–313. [Google Scholar] [CrossRef]
- Lane, P.A. Preparing Marine Plankton Data Sets for Loop Analysis. ESA Supplement. Available online: http://esapubs.org/archive/ecol/E067/001/suppl-1B.pdf (accessed on 29 April 2019).
- Lehman, P.W.; Teh, S.J.; Boyer, G.L.; Nobriga, M.L.; Bass, E.; Hogle, C. Initial impacts of Microcystis aeruginosa blooms on the aquatic food web in the San Francisco Estuary. Hydrobiologia 2010, 637, 229–248. [Google Scholar] [CrossRef]
- Simberloff, D.; Dayan, T. The guild concept and the structure of ecological communities. Annu. Rev. Ecol. Syst. 1991, 22, 115–143. [Google Scholar] [CrossRef]
- Lucas, L.V.; Cloern, J.E.; Thompson, J.K.; Monsen, N.E. Functional variability of habitats within the Sacramento-San Joaquin Delta: Restoration implications. Ecol. Appl. 2002, 12, 1528–1547. [Google Scholar]
- Lopez, C.B.; Cloern, J.E.; Schraga, T.S.; Little, A.J.; Lucas, L.V.; Thompson, J.K.; Burau, J.R. Ecological values of shallow-water habitats: Implications for restoration of disturbed ecosystems. Ecosystems 2006, 9, 422–440. [Google Scholar] [CrossRef]
- Brown, L.R.; Michniuk, D. Littoral fish assemblages of the alien-dominated Sacramento–San Joaquin Delta, California, 1980–1983 and 2001–2003. Estuaries Coasts 2007, 30, 186–200. [Google Scholar] [CrossRef]
- Yarrow, M.; Marin, V.H.; Finlayson, M.; Tironi, A.; Delgado, L.E.; Fisher, F. The ecology of Egeria densa Planchón (Liliopsida: Alismatales): A wetland ecosystem engineer? Rev. Chil. Hist. Nat. 2009, 82, 299–313. [Google Scholar] [CrossRef]
- Lehman, P.W.; Boyer, G.; Satchwell, M.; Waller, S. The influence of environmental conditions on the seasonal variation of Microcystis cell density and microcystins concentration in San Francisco Estuary. Hydrobiologia 2008, 600, 187–204. [Google Scholar] [CrossRef]
- Alpine, A.E.; Cloern, J.E. Trophic interactions and direct physical effects control phytoplankton biomass and production in an estuary. Limnol. Oceanogr. 1992, 37, 946–955. [Google Scholar] [CrossRef]
- Kimmerer, W.J.; Gartside, E.; Orsi, J.J. Predation by an introduced clam as the probable cause of substantial declines in zooplankton in San Francisco Bay. Mar. Ecol. Prog. Ser. 1994, 113, 81–93. [Google Scholar] [CrossRef]
- Kimmerer, W.J.; Parker, A.E.; Lidström, U.; Carpenter, E.J. Short-term and interannual variability in primary production in the low-salinity zone of the San Francisco Estuary. Estuaries Coasts 2012, 35, 913–929. [Google Scholar] [CrossRef]
- Sobczak, W.V.; Cloern, J.E.; Jassby, A.D.; Muller-Solger, A.B. Bioavailability of organic matter in a highly disturbed estuary: The role of detrital and algal resources. Proc. Natl. Acad. Sci. USA 2002, 99, 8101–8105. [Google Scholar] [CrossRef] [PubMed] [Green Version]
- Jassby, A.D. Phytoplankton in the upper San Francisco Estuary: Recent biomass trends, their causes and their trophic significance. SFEWS 2008, 6. [Google Scholar] [CrossRef]
- Nobriga, M.L.; Loboschefsky, E.; Feyrer, F. Common predator, rare prey: Exploring juvenile striped bass predation on delta smelt in California’s San Francisco Estuary. Trans. Am. Fish. Soc. 2014, 142, 1563–1575. [Google Scholar] [CrossRef]
- Novak, M.; Wootton, J.T.; Doak, D.F.; Emmerson, M.; Estes, J.A.; Tinker, M.T. Predicting community responses to perturbations in the face of imperfect knowledge and network complexity. Ecology 2011, 92, 836–846. [Google Scholar] [CrossRef] [PubMed] [Green Version]
- Gantmacher, F.R. Applications of the Theory of Matrices; Dover Publications. Inc.: Mineola, NY, USA, 2005. [Google Scholar]
- Nakajima, H. Sensitivity and stability of flow networks. Ecol. Model. 1992, 62, 123–133. [Google Scholar] [CrossRef]
- Luh, H.K. Oregon State University. Loop Analysis Program in Microsoft.NET 3.5 Framework. Available online: http://ipmnet.org/loop/loopanalysis.aspx (accessed on 12 March 2019).
- California Department of Fish and Wildlife. Fall Midwater Trawl Index. Available online: http://www.dfg.ca.gov/delta/data/fmwt/indices.asp (accessed on 12 March 2019).
- Maceda-Veiga, A. Towards the conservation of freshwater fish: Iberian Rivers as an example of threats and management practices. Rev. Fish. Biol. Fisher. 2013, 23, 1–22. [Google Scholar] [CrossRef]
- Nobriga, M.L.; Sommer, T.R.; Feyrer, F.; Fleming, K. Long-term trends in summertime habitat suitability for delta smelt, Hypomesus transpacificus. SFEWS 2008, 6, 6. [Google Scholar] [CrossRef]
- Yamamuro, M. Herbicide-induced macrophyte-to-phytoplankton shifts in Japanese lagoons during the last 50 years: Consequences for ecosystem services and fisheries. Hydrobiologia 2012, 699, 5–19. [Google Scholar] [CrossRef]
- Kimmerer, W.J.; Thompson, J.K. Phytoplankton growth balanced by clam and zooplankton grazing and net transport into the low-salinity zone of the San Francisco Estuary. Estuaries Coasts 2014, 37, 1202–1218. [Google Scholar] [CrossRef]
- Bennett, W.A.; Moyle, P.B. Where have all the fishes gone? Interactive factors producing fish declines in the Sacramento-San Joaquin Estuary. In The San Francisco Bay: The Ecosystem. Further Investigations into the Natural History of San Francisco Bay and Delta with Reference to the Influence of Man; Hollibaugh, J.T., Ed.; Friesen Printers: Altona, MB, Canada, 1996; pp. 519–542. [Google Scholar]
- Rose, K.A.; Kimmerer, W.J.; Edwards, K.P.; Bennett, W.A. Individual-based modeling of delta smelt population dynamics in the upper San Francisco Estuary I. Model description and baseline results. Trans. Am. Fish. Soc. 2013, 142, 1238–1259. [Google Scholar] [CrossRef]
- Rose, K.A.; Kimmerer, W.J.; Edwards, K.P.; Bennett, W.A. Individual-based modeling of delta smelt population dynamics in the upper San Francisco Estuary II. Alternative baselines and good versus bad years. Trans. Am. Fish. Soc. 2013, 142, 1260–1272. [Google Scholar] [CrossRef]
- Kimmerer, W.J.; Rose, K.A. Individual-based modeling of delta smelt population dynamics in the upper San Francisco Estuary III. Effects of entrainment mortality and changes in prey. Trans. Am. Fish. Soc. 2018, 147, 223–243. [Google Scholar] [CrossRef]
- Hammock, B.G.; Moose, S.P.; Sandoval Solis, S.; Goharian, E.; Swee, J.T. Hydrodynamic modeling coupled with long-term field data provide evidence for suppression of phytoplankton by invasive clams and freshwater exports in the San Francisco Estuary. J. Environ. Manag. 2019, 63, 703–717. [Google Scholar] [CrossRef] [PubMed]
- Cottingham, A.; Huang, P.; Hipsey, M.R.; Hall, N.G.; Ashworth, E.; Williams, J.; Potter, I.C. Growth, condition, and maturity schedules of an estuarine fish species change in estuaries following increased hypoxia due to climate change. Ecol. Evol. 2018, 8, 7111–7130. [Google Scholar] [CrossRef] [Green Version]
- Baustian, M.M.; Clark, F.R.; Jerabek, A.S.; Wang, Y.; Bienn, H.C.; White, E.D. Modeling current and future freshwater inflow needs of a subtropical estuary to manage and maintain forested wetland ecological conditions. Ecol. Indic. 2018, 85, 791–807. [Google Scholar] [CrossRef]
- Martins, I.; Antunes, C.; Dias, E.; Campuzano, F.J.; Pinto, L.; Santos, M.M.; Antunes, C. Antagonistic effects of multiple stressors on macroinvertebrate biomass from a temperate estuary (Minho estuary, NW Iberian Peninsula). Ecol. Indic. 2019, 101, 792–803. [Google Scholar] [CrossRef]
- Allen, C.R.; Gunderson, L.H. Pathology and failure in the design and implementation of adaptive management. J. Environ. Manag. 2011, 92, 1379–1384. [Google Scholar] [CrossRef] [Green Version]
- Cartwright, J.; Caldwell, C.; Nebiker, S.; Knight, R. Putting flow-ecology relationships into practice: A decision-support system to assess fish community response to water-management scenarios. Water 2017, 9, 196. [Google Scholar] [CrossRef]
- Arthington, A.H.; Bhaduri, A.; Bunn, S.E.; Jackson, S.E.; Tharme, R.E.; Tickner, D.; Young, B.; Acreman, B.; Baker, N.; Capon, S.; et al. The Brisbane declaration and global action agenda on environmental flows. Front. Environ. Sci. 2018, 6, 45. [Google Scholar] [CrossRef]
- Gifford, S.M.; Rollwagen Bollens, G.C.; Bollens, S.M. Mesozooplankton omnivory in the upper San Francisco Estuary. Mar. Ecol. Prog. Ser. 2007, 348, 33–46. [Google Scholar] [CrossRef]
- Burks, R.L.; Jeppesen, E.; Lodge, D.M. Macrophyte and fish chemicals suppress Daphnia growth and alter life-history traits. Oikos 2000, 88, 139–148. [Google Scholar] [CrossRef]
- Lucy, F.E.; Karatayev, A.Y.; Burlakova, L.E. Predictions for the spread, population density, and impacts of Corbicula fluminea in Ireland. Aquat. Invasions 2012, 7, 465–474. [Google Scholar] [CrossRef]
- Sousa, R.; Gutierrez, J.L.; Aldridge, D.C. Non-indigenous invasive bivalves as ecosystem engineers. Biol. Invasions 2009, 11, 2367–2385. [Google Scholar] [CrossRef]
- Pflugmacher, S. Promotion of oxidative stress in the aquatic macrophyte Ceratophyllum demersum during biotransformation of the cyanobacterial toxin microcystin-LR. Aquat. Toxicol. 2004, 70, 169–178. [Google Scholar] [CrossRef]
- Hwang, S.J.; Kim, H.S.; Park, J.H.; Kim, B.H. Effects of cyanobacterium Microcystis aeruginosa on the filtration rate and mortality of the freshwater bivalve Corbicula leana. J. Environ. Biol. 2010, 31, 483–488. [Google Scholar]
- Gao, Y.N.; Dong, J.; Fu, Q.Q.; Wang, Y.P.; Chen, C.; Li, J.H.; Li, R.; Zhou, C.J. Allelopathic effects of submerged macrophytes on phytoplankton. Allelopath. J. 2017, 40, 1–22. [Google Scholar] [Green Version]
- Liu, Y.; Xie, P.; Wu, X.P. Grazing on toxic and non-toxic Microcystis aeruginosa PCC7820 by Unio douglasiae and Corbicula fluminea. Limnology 2009, 10, 1–5. [Google Scholar] [CrossRef]
Figure 1.
The San Francisco Estuary showing the Suisun Bay and Delta regions in the upper estuary. Dashed lines denote the positions of the 2 psu isohalines (X2) considered in community models (74, 81, and 85 km) and the range of the average X2 position in September–October (64–94 km) from 1967 to 2017. Map adapted from [24].

Figure 2.
Example of (A) a 3 × 3 community matrix (Ao) showing qualitative interaction terms for 3 variables such as species or trophic groups, with diagonal matrix elements −a11, −a22, and −a33 representing negative self-effects of each variable and zero denoting no effect, and (B) its corresponding signed-digraph. Open circles denote variables (Ni), with lines between variables ending in arrows and bubbles respectively denoting positive and negative effects, and curved lines originating and ending in the same variable denoting self-effects, after [29].

Figure 3.
Alternative fall community models for the Delta smelt subsystem under three scenarios of the salinity field in upper San Francisco Estuary. Dashed arrows show where the low salinity zone overlaps the position of the 2 psu isohaline (X2) at (A) high X2 (85 km), (B) mid X2 (81 km), and (C) low X2 (74 km) at low-, mid- and high-outflow, respectively. Community variables included in signed digraphs: CF = Corbicula fluminea; DS = Delta smelt; ED = Egeria densa; MA = Microcystis aeruginosa; PA = Potamocorbula amurensis; PH = phytoplankton; PR = predators of delta smelt; ZO = zooplankton. Salinity field after [75].

Figure 4.
Signed digraphs of the modeled delta smelt subsystems at three positions of the 2 psu isohaline (X2) in the upper San Francisco Estuary. Dashed lines indicate the four alternative outflow (FL) input scenarios for community variables. Dashed lines in scenario 1 represent outflow perturbations to Corbicula fluminea (CF), Egeria densa (ED), Microcystis aeruginosa (MA), and Potamocorbula amurensis (PA). Dashed lines in outflow scenarios 2, 3, and 4 cumulatively add outflow perturbations to phytoplankton (PH, scenario 2), zooplankton (ZO, scenario 3), and delta smelt (DS, scenario 4). PR denotes predators of delta smelt. Community variables show the predicted direction of change in abundance (+, −) in response to sustained outflow input. Direction of change without parentheses is unconditional. Direction of change in parentheses denote high-certainty (asterisk) and low-conditional certainly (no asterisk), and ? denotes complete ambiguity.

Figure 5.
Predicted direction of change and its uncertainty for community variables based on signed weighted predictions (Ws) at low-, mid-, and high-X2 positions under outflow–input scenarios (1–4, Figure 4). Values of |Ws| for each community variable range between unconditional sign determinacy (1) and complete uncertainty (0), with |Ws| between 0.50 (dotted line) and ≤1 indicating high sign determinacy.

Figure 6.
Predicted direction of change of community variables for low-, mid-, and high-X2 positions based on the difference between the proportions of quantitative simulations with positive and negative Adj − A (Δ). Acronyms represent species or trophic groups (Table 1, Figure 3) and legend denotes the four outflow input scenarios (Figure 4). Values of |Δ| can range between 1 (unconditional sign determinacy) and 0 (complete uncertainty), with |Δ| between 0.5 (dotted lines) and <1 implying low uncertainty in the predicted direction of change.

Figure 7.
Relations between the net proportion of positive and negative Adj − A in stable quantitative models (Δ) at low-, mid-, and high-X2 positions and: (A) the estimated direction of change of corresponding variables in qualitative models (Adj − A); (B) the signed weighted feedback in qualitative models (Ws), as indicated for modeled subsystems in the low salinity zone at low-, mid-, and high-X2 positions.

Figure 8.
Relative abundance for subadult delta smelt based on the fall midwater trawl (FMWT) index (Y) versus the average position of the 2 psu isohaline (X2) during September and October (X) under four ranges of X2 over the period 1967–2017. Dark and light shaded areas denote 95% confidence intervals for regression lines and predicted values, respectively. Regression coefficients in bold type are significant (P < 0.05).

Table 1.
Variables considered in qualitative community models for the upper San Francisco Estuary. Black circles denote community variables included in the low salinity zone at three positions of the 2 psu isohaline (X2).
Table 1.
Variables considered in qualitative community models for the upper San Francisco Estuary. Black circles denote community variables included in the low salinity zone at three positions of the 2 psu isohaline (X2).
| Variable Type | Variable Code (Description) | Low X2 74 km | Mid X2 81 km | High X2 85 km | Functional Role | Community Response to Outflow |
|---|---|---|---|---|---|---|
| Explanatory | FL (Delta outflow, m3 s−1) | 323 [24] | 227 [24] | 142 [24] | Major abiotic forcing factor controlling the overlap between dynamic and stationary factors in the upper San Francisco Estuary, the position and size of the low salinity zone and the low salinity habitat of delta smelt and community interactions [24,38]. | |
| Response (Community variables) | CF (Corbicula fluminea, Asian clam) 1 | ● [24] | ● [24] | Filter feeder exerting grazing pressure on phytoplankton [82,83]. | (+) [56] | |
| DS (Hypomesus transpacificus, delta smelt) | ● [38,45] | ● [38,45] | ● [38,45] | Zooplanktivorous preying primarily on copepods, mysids, and cladocerans [40,41]. | (+) [10,54] | |
| ED (Egeria densa, Brazilian waterweed) 1 | ● [58,59] | Primary producer of dense submersed vegetation beds which reduce open water habitat, alter the habitat for other aquatic plants [58,65] and provide habitat for centrarchids [84]. | (−) [59,85] | |||
| MA (Microcystis aeruginosa, cyanobacterium) 2 | ● [24,86] | ● [24,86] | Biological contaminant due to its poor nutritional value and transfer of toxic microcystins into the aquatic food web [24,69,70,80]. | (−) [86] | ||
| PA (Potamocorbula amurensis, overbite clam) 1 | ● [24] | ● [24] | Filter feeder exerting grazing pressure on phytoplankton and zooplankton [87,88]. | (−) [56] | ||
| PH (Phytoplankton) | ● [38,89,90] | ● [38,89,90] | ● [38,89,90] | Primary producer fueling higher trophic levels of the food web in the open waters of the Delta and Suisun Bay [89,90]. | (+) [38,91] | |
| PR (Predators of delta smelt) | ● [24,38] | ● [24,38] | ● [24,38] | Piscivores deemed to exert predation pressure on delta smelt throughout the Delta and Suisun Bay [24], including two introduced species, striped bass Morone saxatilis [62,92] and largemouth bass Micropterus salmoides [64,84]. | (0) 3 [38] | |
| ZO (Zooplankton) | ● [24,38] | ● [24,38] | ● [24,38] | Primary and secondary consumer supporting pelagic and benthic food webs [41,88]. | (+) [55] |
Table 2.
Percent of quantitative community models meeting zero, one and both Routh–Hurwitz (R–H) stability criteria at three X2 positions in the low salinity zone of the upper San Francisco Estuary (based on 10,000 simulations at each X2 position).
Table 2.
Percent of quantitative community models meeting zero, one and both Routh–Hurwitz (R–H) stability criteria at three X2 positions in the low salinity zone of the upper San Francisco Estuary (based on 10,000 simulations at each X2 position).
| R–H Criteria | Low-X2 (74 km) | Mid-X2 (81 km) | High-X2 (85 km) |
|---|---|---|---|
| None | 2.7 | 39.9 | 48.2 |
| Only I | 0.3 | 3.5 | 10.6 |
| Only II | 0.0 | 0.0 | 0.0 |
| Both | 97 | 56.6 | 41.2 |
© 2019 by the author. Licensee MDPI, Basel, Switzerland. This article is an open access article distributed under the terms and conditions of the Creative Commons Attribution (CC BY) license (http://creativecommons.org/licenses/by/4.0/).
Share and Cite
MDPI and ACS Style
Castillo, G.C. Modeling the Influence of Outflow and Community Structure on an Endangered Fish Population in the Upper San Francisco Estuary. Water 2019, 11, 1162. https://doi.org/10.3390/w11061162
AMA Style
Castillo GC. Modeling the Influence of Outflow and Community Structure on an Endangered Fish Population in the Upper San Francisco Estuary. Water. 2019; 11(6):1162. https://doi.org/10.3390/w11061162
Chicago/Turabian StyleCastillo, Gonzalo C. 2019. "Modeling the Influence of Outflow and Community Structure on an Endangered Fish Population in the Upper San Francisco Estuary" Water 11, no. 6: 1162. https://doi.org/10.3390/w11061162
Note that from the first issue of 2016, this journal uses article numbers instead of page numbers. See further details here.