Intraseasonal Dynamics of River Discharge and Burned Forest Areas in Siberia


1
V.N. Sukachev Institute of Forest SB RAS, Federal Research Center, Krasnoyarsk 660036, Russia
2
Institute of Ecology and Geography, Siberian Federal University, Krasnoyarsk 660041, Russia
*
Author to whom correspondence should be addressed.
Water 2019, 11(6), 1146; https://doi.org/10.3390/w11061146
Submission received: 19 April 2019
/
Revised: 24 May 2019
/
Accepted: 27 May 2019
/
Published: 31 May 2019
(This article belongs to the Special Issue Hydrological and Hydro-Meteorological Extremes and Related Risk and Uncertainty)
Abstract
:This study demonstrates the dependence between the forest burning rates and abnormal decrease in Siberian river discharges under the conditions of the permafrost zone. Our study area is in Central Siberia and Eastern Siberia/Yakutia. Four rivers (Podkamennaya Tunguska, Lower Tunguska, Aldan, and Viluy) were selected for the study. We analyzed the long-term and seasonal variation of river discharges (archive of The Global Runoff Data Centre for 1939–2015) together with the forest burning dynamics within the river basins (archive of Sukachev Institute of Forest for 1996–2015). We compared the discharges per year with the 77-year average value. Abnormally low levels of discharge constituted 58–78% of the averaged annual rate. An analysis of available chronologies of extreme fire events and relative burned areas (RBAs) showed a high correlation with intra-seasonal data on the runoff minima. The most significant response of river discharges to the wildfire effect was shown for the late summer/autumn season after extreme wildfires during the summer period. The deficit of the runoff was not explained by a low precipitation. Late summer and autumn anomalies of discharge were typical (r = −0.57…−0.77, p < 0.05) for rivers of Central Siberia in seasons of extreme forest burning. The correlation was lower for rivers of Eastern Siberia/Yakutia.
1. Introduction
Along with summer and winter precipitation, the groundwater determines between 10% and 25% of the total supply of Siberian rivers under conditions of permafrost [1]. This portion of supply is determined by the water-physical properties of the soil, and it is also influenced by the type of vegetation and the state of the on-ground cover and tree stands [2,3].
In some papers, inter-annual fluctuations and trends in river discharges in Siberia are mainly associated with climatic processes [2,4,5,6]. At the same time, wildfire impact is the main factor, which strongly affected the state of Siberian boreal ecosystems as a whole [7,8,9]. The increased water yields or total runoff primarily resulting from the reduced evapotranspiration have been a reported effect on post-wildfire hydrology [10]. Significant and long-term postfire effects are well-documented in the permafrost zone of Siberia [7,11,12]. The seasonally thawing soil layer deepens quickly over the first postfire years, and slowly recovers following re-vegetation. Permafrost active layer dynamics as well soil condition changes after wildfires were observed in the region [9,13,14]. Long-term temperature anomalies were evaluated postfire using remote sensing data [12]. This affects the soil’s moisture content [11,15], as well the water supply and the flow regime of small and medium rivers. Such an effect was shown in the Interior Alaska region under similar nature and climate conditions [16]. The study of the postfire effect under the conditions of the permafrost zone is very important because the impacts of fire on the groundwater discharge as well as on the river flow depend strongly on local site characteristics.
It was evident that hydrologic budgets change on the sub-watershed scale following wildfire. This is caused by an increase of the interflow in the burned area. Due to an absent transpiration without vegetation cover, more water can infiltrate and contribute to the total runoff [17,18]. Fire can impact the groundwater discharge to surface water features by changing both the supply of water (via an altered recharge) and the transmissivity of the subsurface (via an altered active layer thickness).
A number of models are available for postfire runoff forecasting in different natural conditions [18,19,20]. According to Springer et al., 2015 [19], in the burned region the runoff generation is slightly increased when compared to the unburned area. In some cases, fires led to an approximately 50% reduction in the quantity of water released from the groundwater to the stream, with the mean annual discharge decreasing [21].
The results of the analysis of the wildfire impact on the Siberian river flows have been discussed in only a few papers [20,22]. The decreased discharge has been suggested to result from the larger water-holding capacity of the deepening active soil layer, which developed after the fire event and the combustion of the organic layer [22]. Consequently, the substantial uncertainty regarding postfire changes to the water and energy balances under the conditions of the permafrost zone of Siberia need to be further discussed. This issue is one of the main factors of boreal ecosystem stability under current and future climate conditions in terms of wildfire regimes.
In this work, we investigated the degree of dependence between the forest burning rates and the abnormal decrease in the Siberian river discharge under the conditions of the permafrost zone. The following aspects of the issue were considered: (i) long-term river discharge dynamics and anomalies; (ii) the correlation of long-term data on discharge minima and the relative burned area (RBA); and (iii) the intra-seasonal variations of the postfire river discharge.
2. Materials and Methods
The area of interest is the territory of Siberia within the boundaries of 57–67 N, 85–110 E. The total area is more than 110 million hectares. This territory is mostly covered by forests dominated by larch (Larix sibirica, L. gmelinii); Scots pine (Pinus sylvestris) and dark coniferous stands (Abies sibirica, Picea obovata, Pinus sibirica) are also present [23].
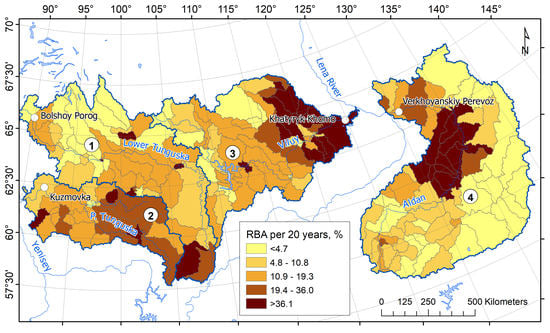
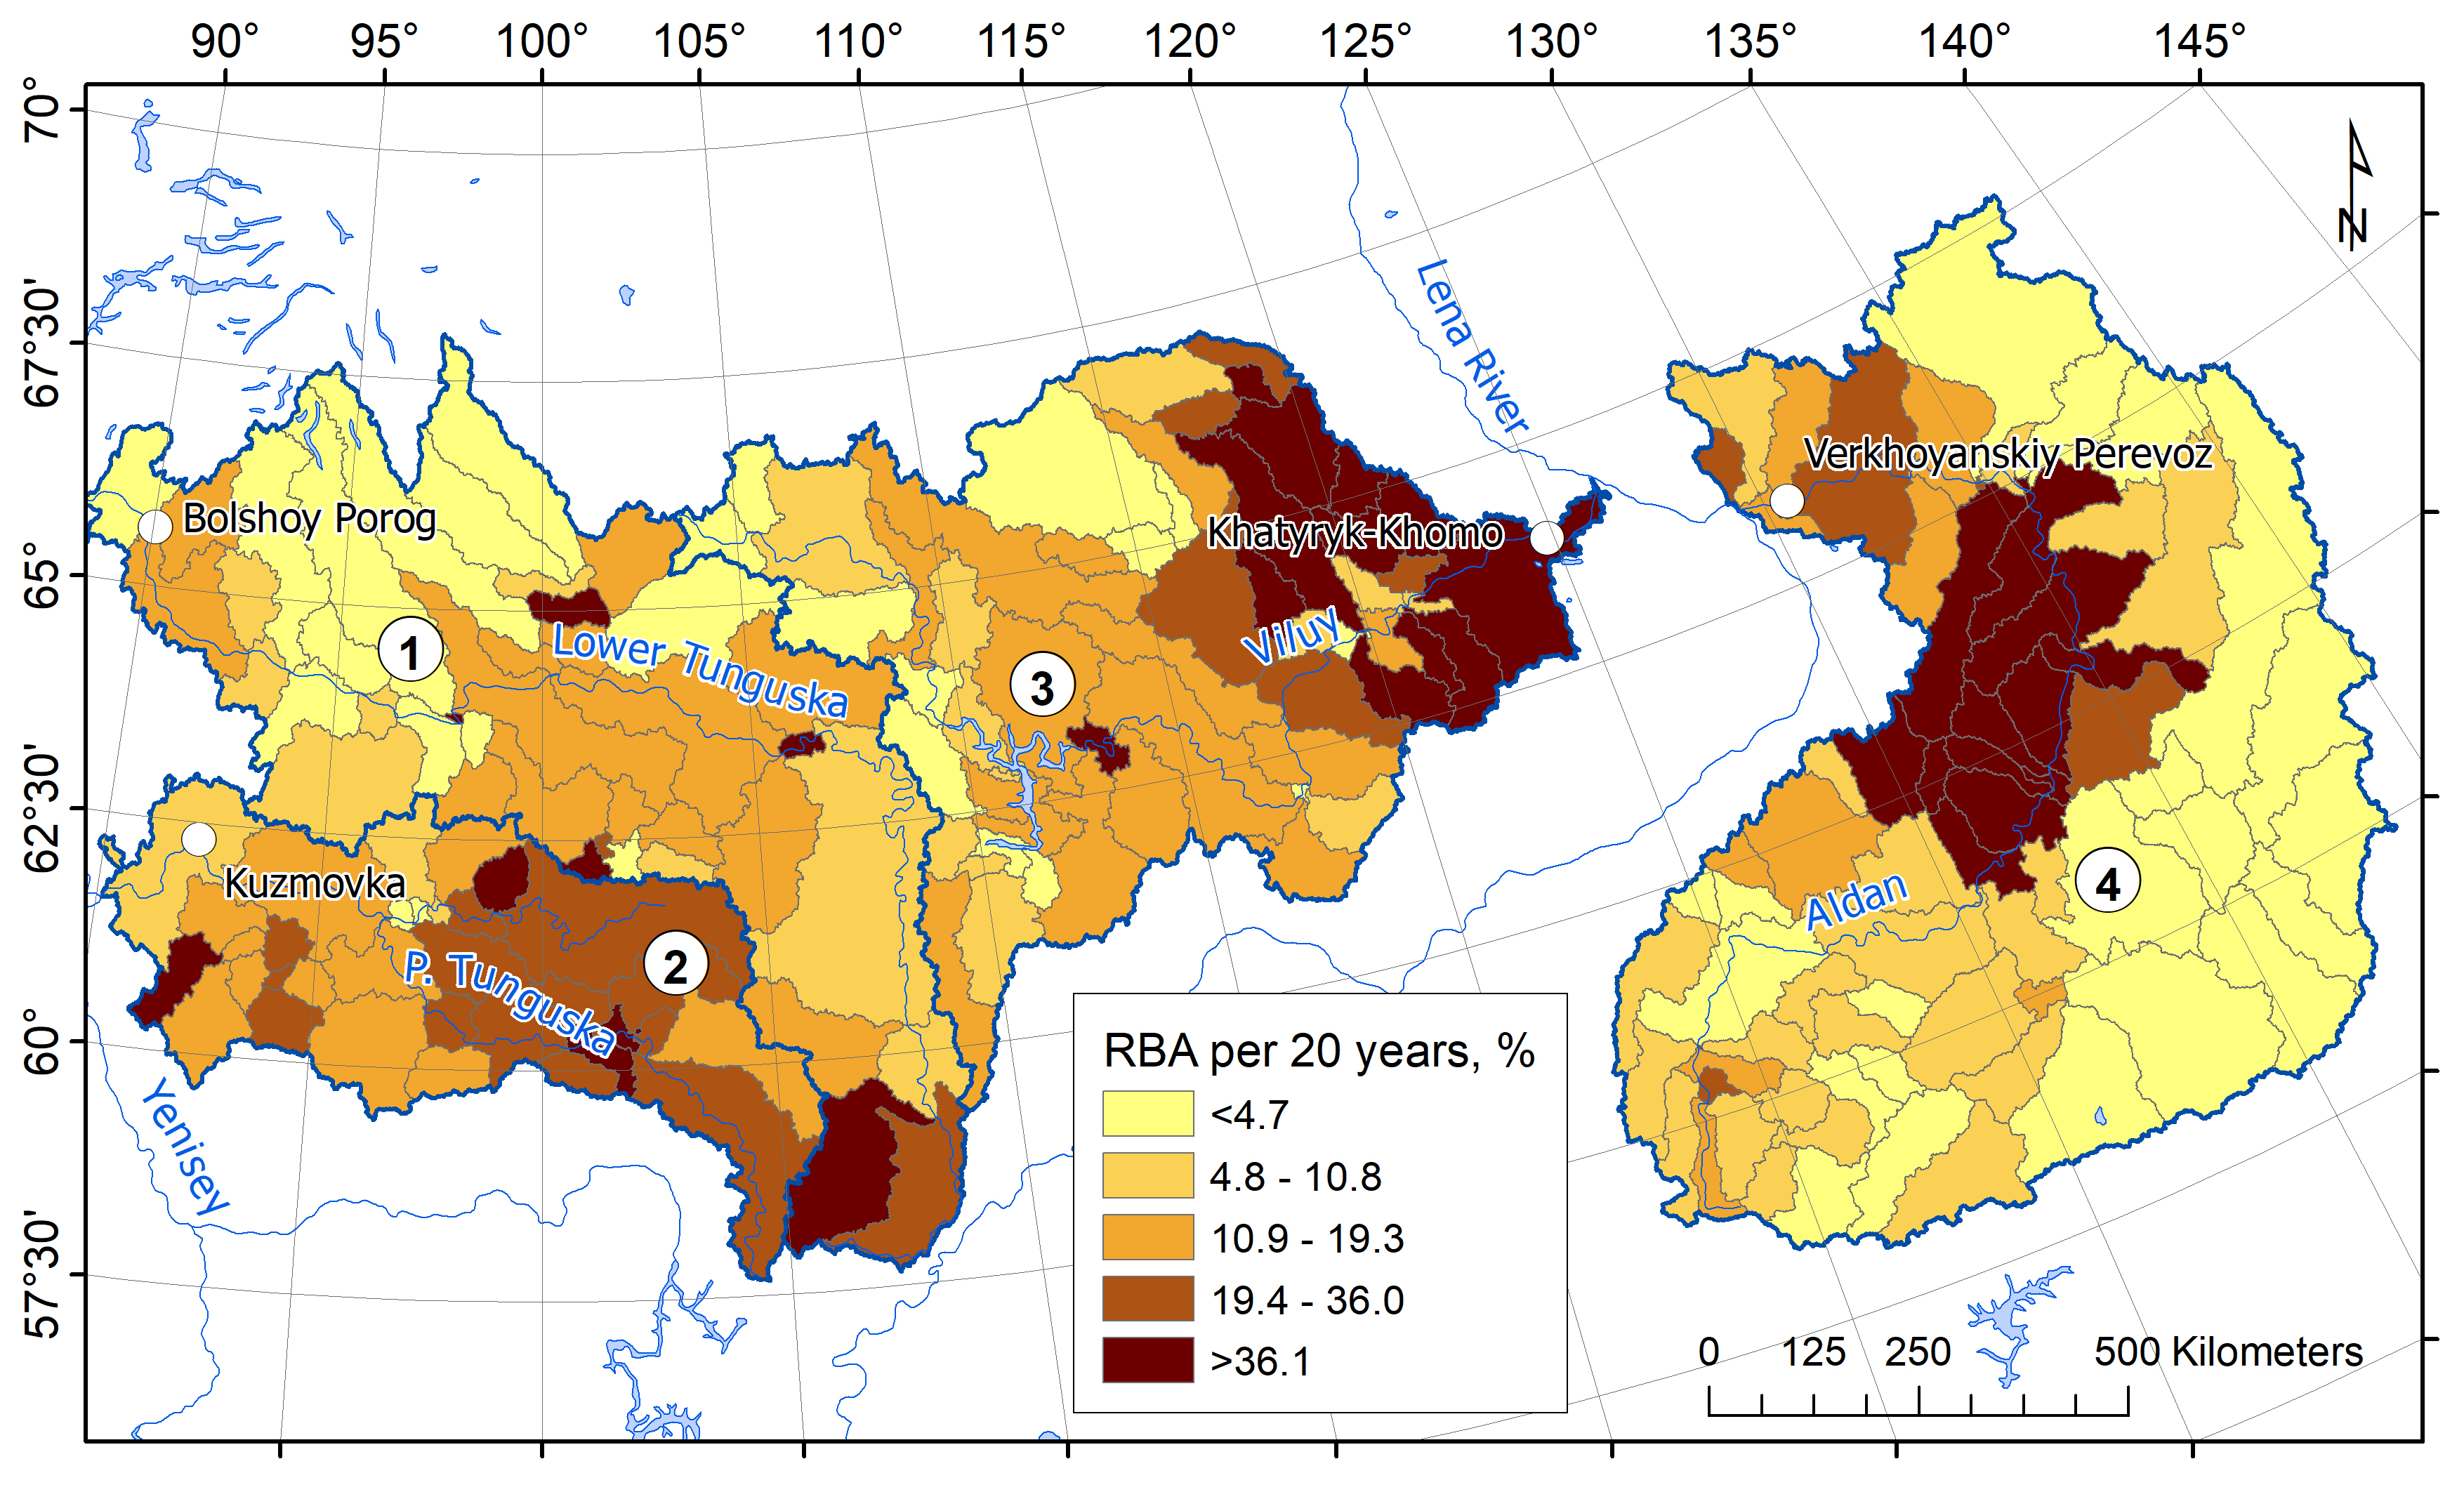
Four rivers were selected for the study (Figure 1): the Lower Tunguska, Podkamennaya Tunguska (Basin District of Yenisey River), and Aldan, Viluy (Basin District of Lena River). Their basins are all forest-dominated and susceptible to fire. But they differ in their groundwater supply character, which is limited by continuous permafrost and soil conditions. The groundwater supply is 10% of the total in the Lower Tunguska river basin and is 10–15% of the total in the Aldan river basins. This supply is influenced by the low water permeable loamy soils and crystalline rocks [24]. The groundwater supply is higher in the Podkamennaya Tunguska basins (25%) and the Viluy river basins (20%) [1].
According to the long-term series, the annual discharge values varied from 47–50 km3 for the Podkamennaya Tunguska and Viluy rivers to 108–173 km3 for the Lower Tunguska and Aldan rivers. The long-term data on the flow rate (m3/s) and river discharge (km3) were compiled from the open database R-ArcticNET 4.0 (http://www.R-ArcticNET.sr.unh.edu), the integrated monitoring system Arctic-RIMS (Rapid Integrated Monitoring System; http://rims.unh.edu/index.shtml), The Global Runoff Data Center (http://www.bafg.de), and Composite Runoff Field V 1.0 (http: //www.compositerunoff.sr.unh.edu/) [25,26,27]. We analyzed the monthly average water runoff for 1936–2015 at the following hydrological posts (Figure 1): Bolshoy Porog (basin of Lower Tunguska), Kuzmovka (basin of Podkamennaya Tunguska), Khatyryk-Khomo (basin of Viluy River), and Verkhoyanskiy Perevoz (basin of Aldan River).
We analyzed the river discharge per year, comparing it with the 77-year average value, to find out extreme minima. First, we tested the hypothesis that the extreme discharge anomalies would correlate with extreme fire events in Central and Eastern Siberia available from the literature dataset [7,28,29].
Next, we determined the average annual value of the discharge () for 1996–2015. This is the period of available satellite data on Siberian wildfires attributed with precise coordinates, dates and estimations of burning characteristics [30]. For 1996–2015, we analyzed the intra-seasonal deviations () from the average statistical norm for each month (i) per season:
To understand the influence of wildfire, we need to analyze the intra-seasonal variety of discharge jointly with the area burnt per month/vegetation season. However, the historical data (since 1939) on large fires [7,28,29] are not accompanied by information on the fire dates and areas or the RBA, since they are obtained on the basis of dendrochronological studies. We used satellite-obtained data on fires only available for the last 20 years (1996–2015) [30,31].
The wildfire database for 1996–2015 was collected using a satellite fire monitoring technique in collaboration with the Federal Research Center (Krasnoyarsk, Russia) and Krasnoyarsk department of Russian Emergency Committee. The data on wildfires were pre-processed into the format of a polygon layer for the Geographic Information System (GIS). For each year, we aggregated the area burnt per month within the river basins. The relative burned area (RBA) indexes were calculated for each river basin per season, as well as per month of the season. The RBA (γ) was defined as the ratio of the total area of fires (Sburned) to the total forested area within the river basin (S):
Geo-referenced hydrological maps based on SHuttle Elevation Derivatives at multiple scales (HydroSHEDS, http://www.hydrosheds.org) were used to represent the river basins in GIS [27]. We used 4 polygons (level-04 in the classification of HydroSHEDS) for the selected river basins and 204 polygons of the sub-basins (level-06) of the smaller rivers within the basins of Lower Tunguska, Podkamennaya Tunguska, Aldan and Viluy. The areas for each basin were calculated using a geometry calculation procedure by ESRI ArcGIS 10.4.1 software. Furthermore, using GIS, we selected and analyzed only wildfires within the boundary of the vector layer of the river basins.
The data on precipitation was obtained from the catalog of the Global Precipitation Climatology Center (GPCC) [32]. The product contains the monthly total precipitation on a regular grid with a spatial resolution of 1.0 × 1.0 latitude by longitude. It was used to evaluate the intra-seasonal precipitation within the river basins. The precipitation product was too coarse to represent the spatial heterogeneity of the precipitation at the level-06 river basin scale. However, it was quite appreciated for estimating the monthly-averaged data on the precipitation to characterize the territories of the large river basins (level-04). For some years, the data on the runoff (less than 1%) were missing in the source database (see some gaps in Figure 2).
The data processing was performed in GIS using geospatial tools for the vector data layers; a correlation and statistical analyses were also used [33].
3. Results
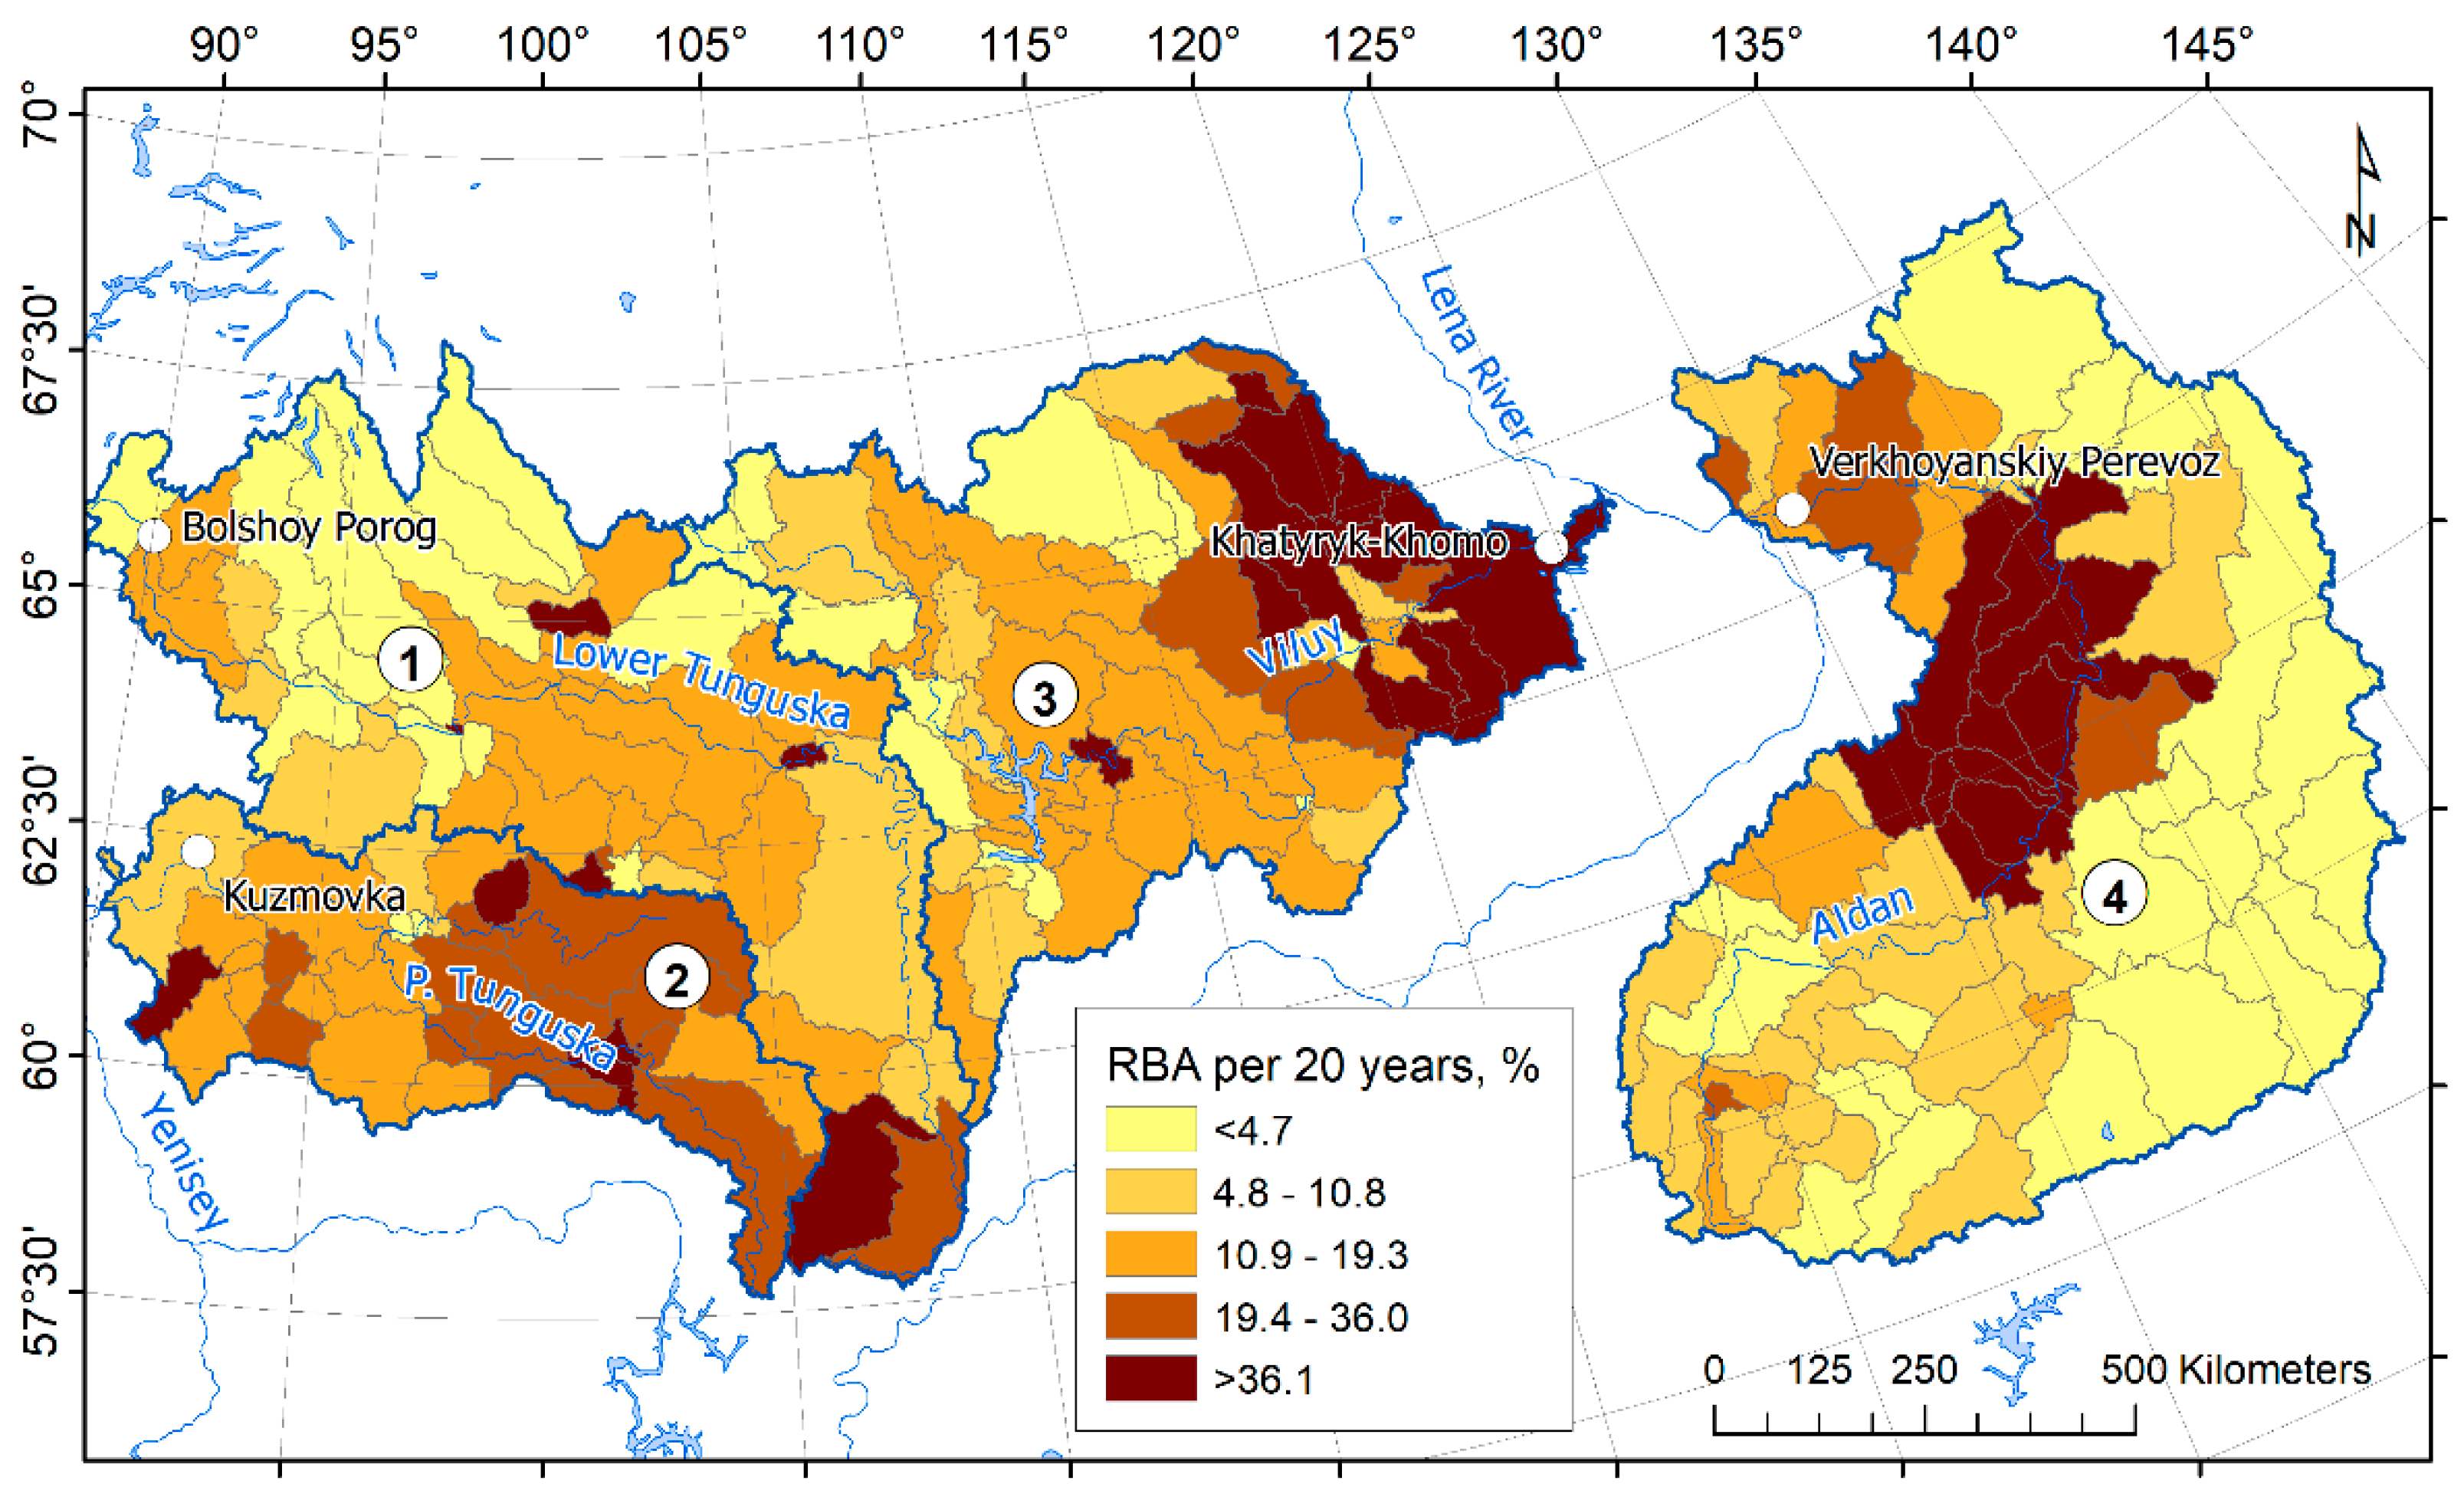
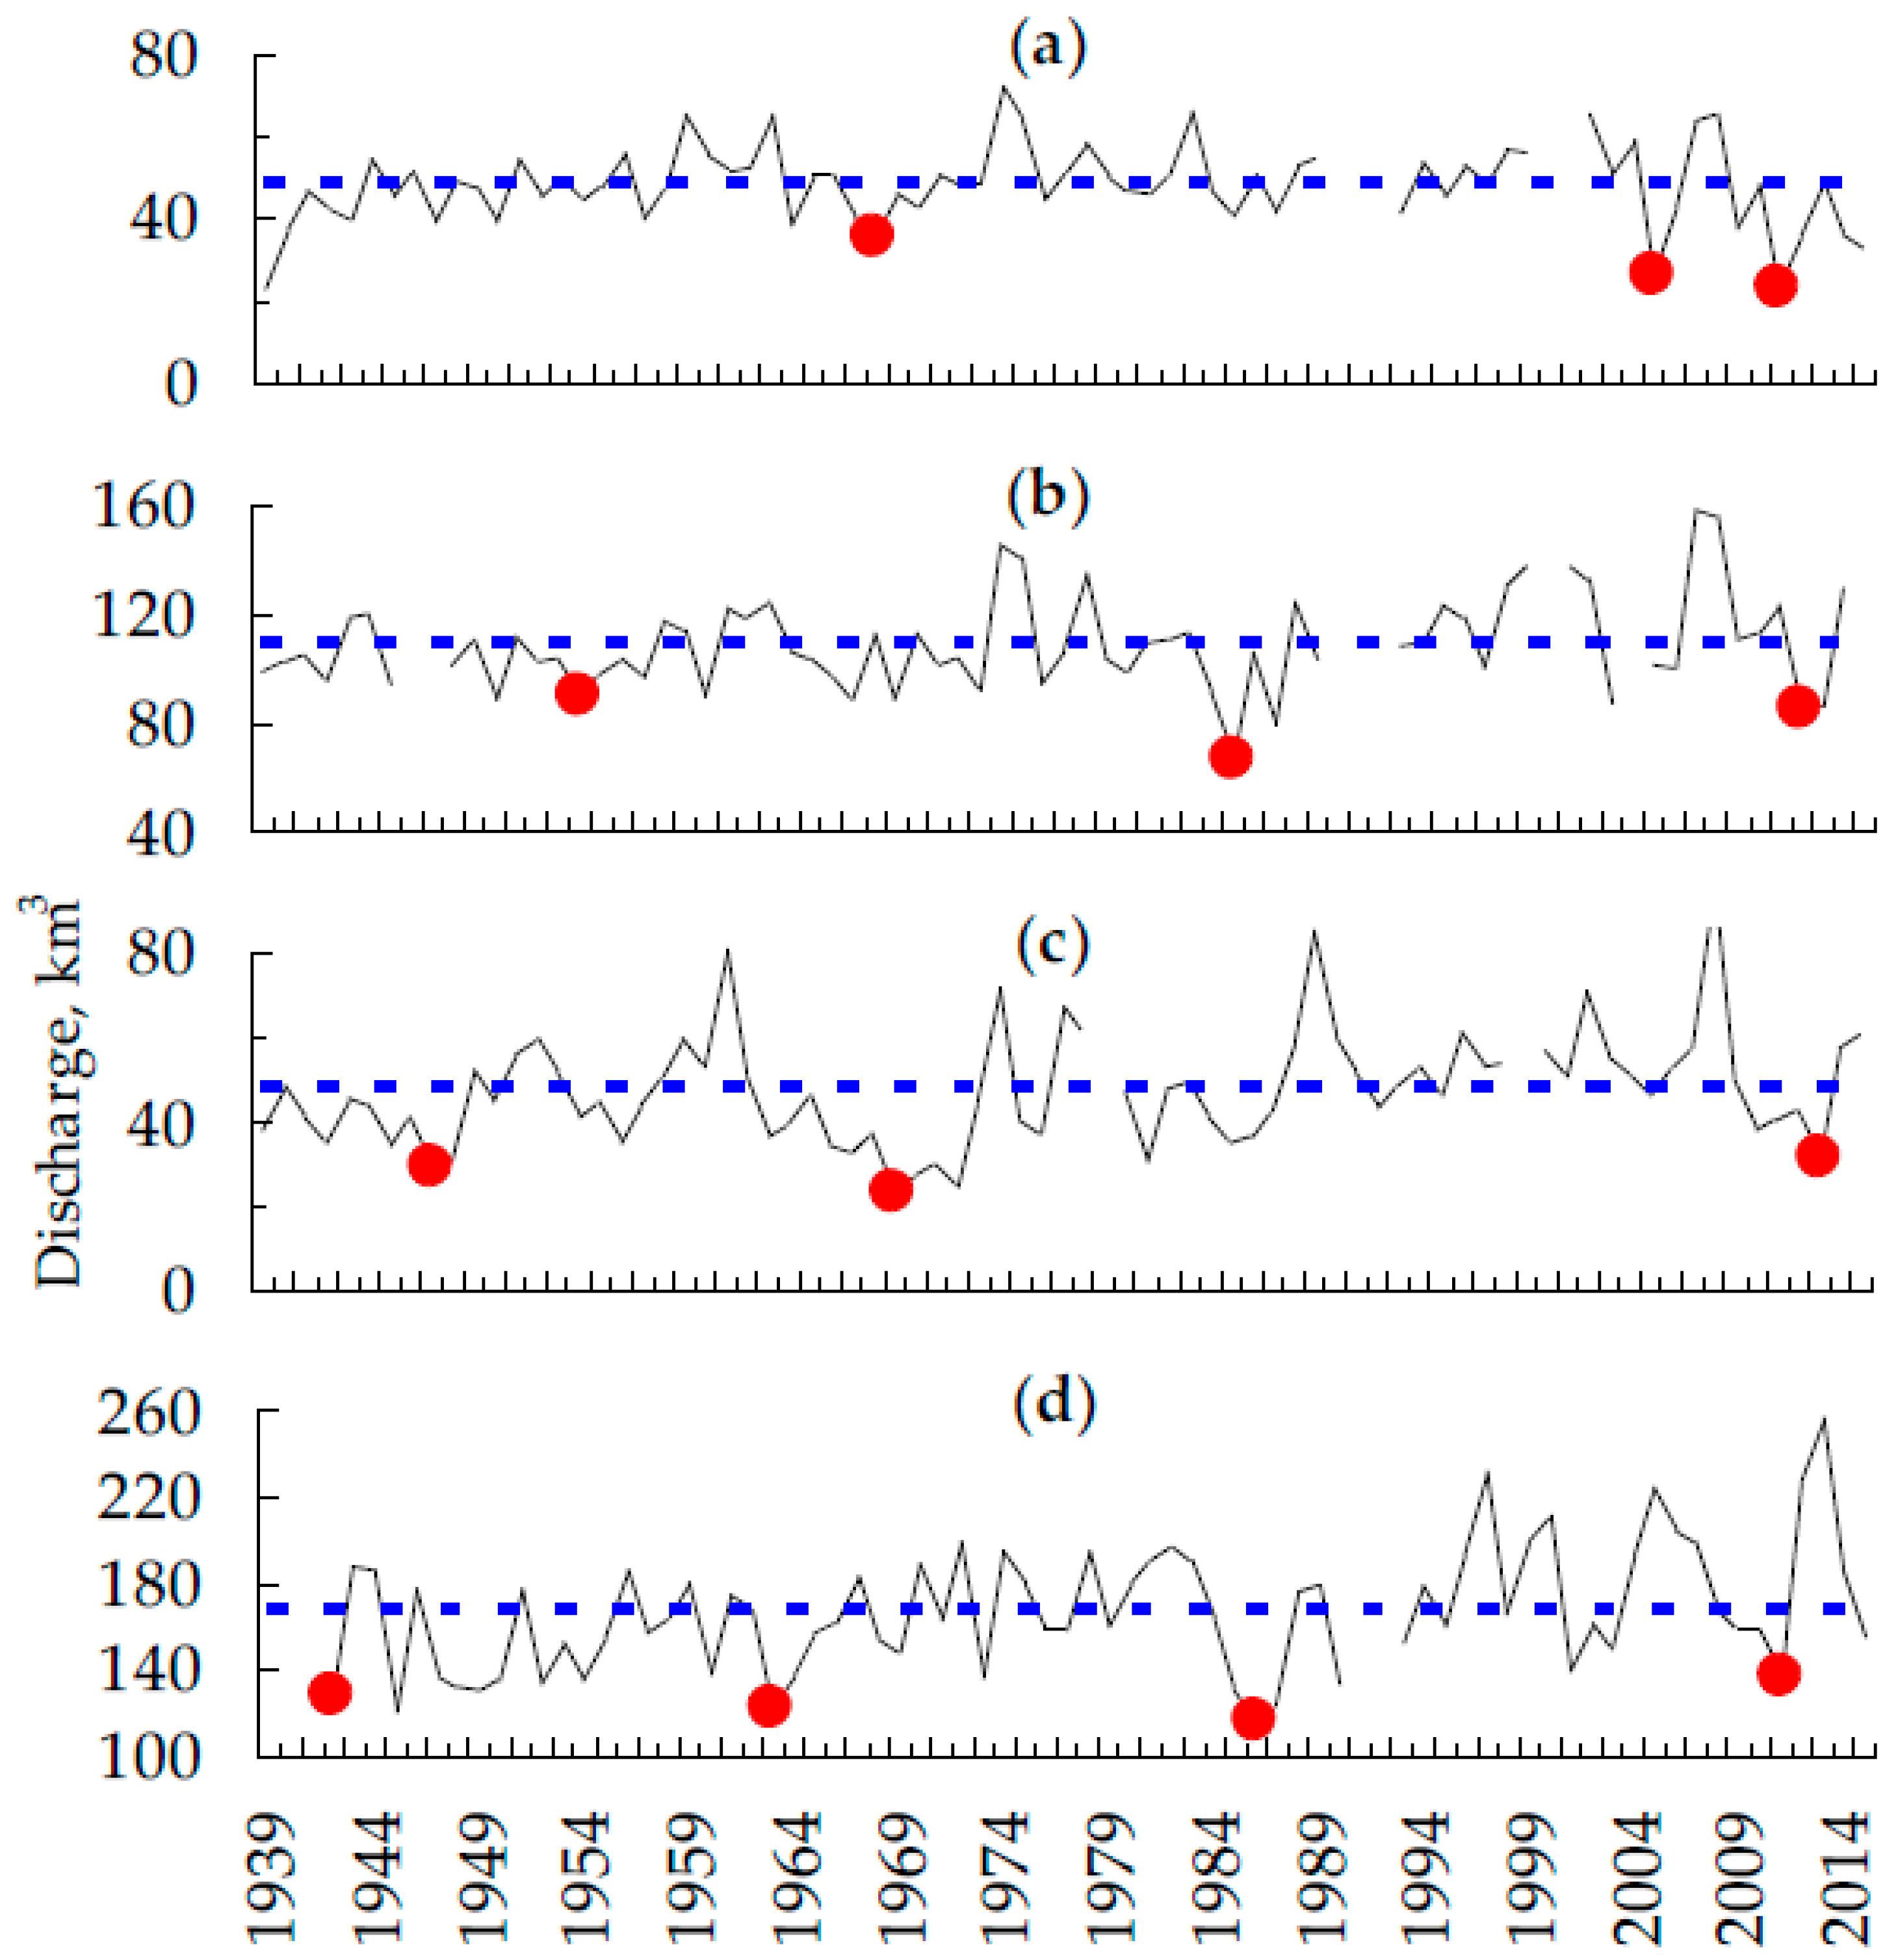
The period of recurrence of the extremely low runoff ranged from 18 to 25 years over the past 77 years. The available chronologies of extreme fire events [7,28,29] coincided with the discharge minima in each river basin of the region (Figure 2), as expected.
The data on the burnt area for 1996–2015 is summarized in Table 1. The mean RBA (γ) were ~0.50 ± 0.01% for the forests of the Lower Tunguska and Podkamennaya Tunguska basins. For Eastern Siberia, the level of RBA was higher (~0.72 ± 0.04%). A high level of dispersion (standard deviation) from 0.60 to 1.15 was typical for RBA, strongly influenced by the variety of weather conditions on the sub-regional scale [5]. While these RBA values were very close to the average for Siberia [23] and were comparable to that for Canada [34], we selected ones related to cases from the extreme fire season only. The maxima RBA were higher by order for all of the river basins. About 3–6% of the total forested area per year was damaged by fires during some extreme fire seasons.
The recorded range of discharge anomalies also had significant limits. The minima were lower by 27 ± 5% of the annual mean value, while the maxima were higher by 30 ± 5% (Table 1). Thus, during some seasons extremely low runoff values were only 58–78% of the average annual rate.
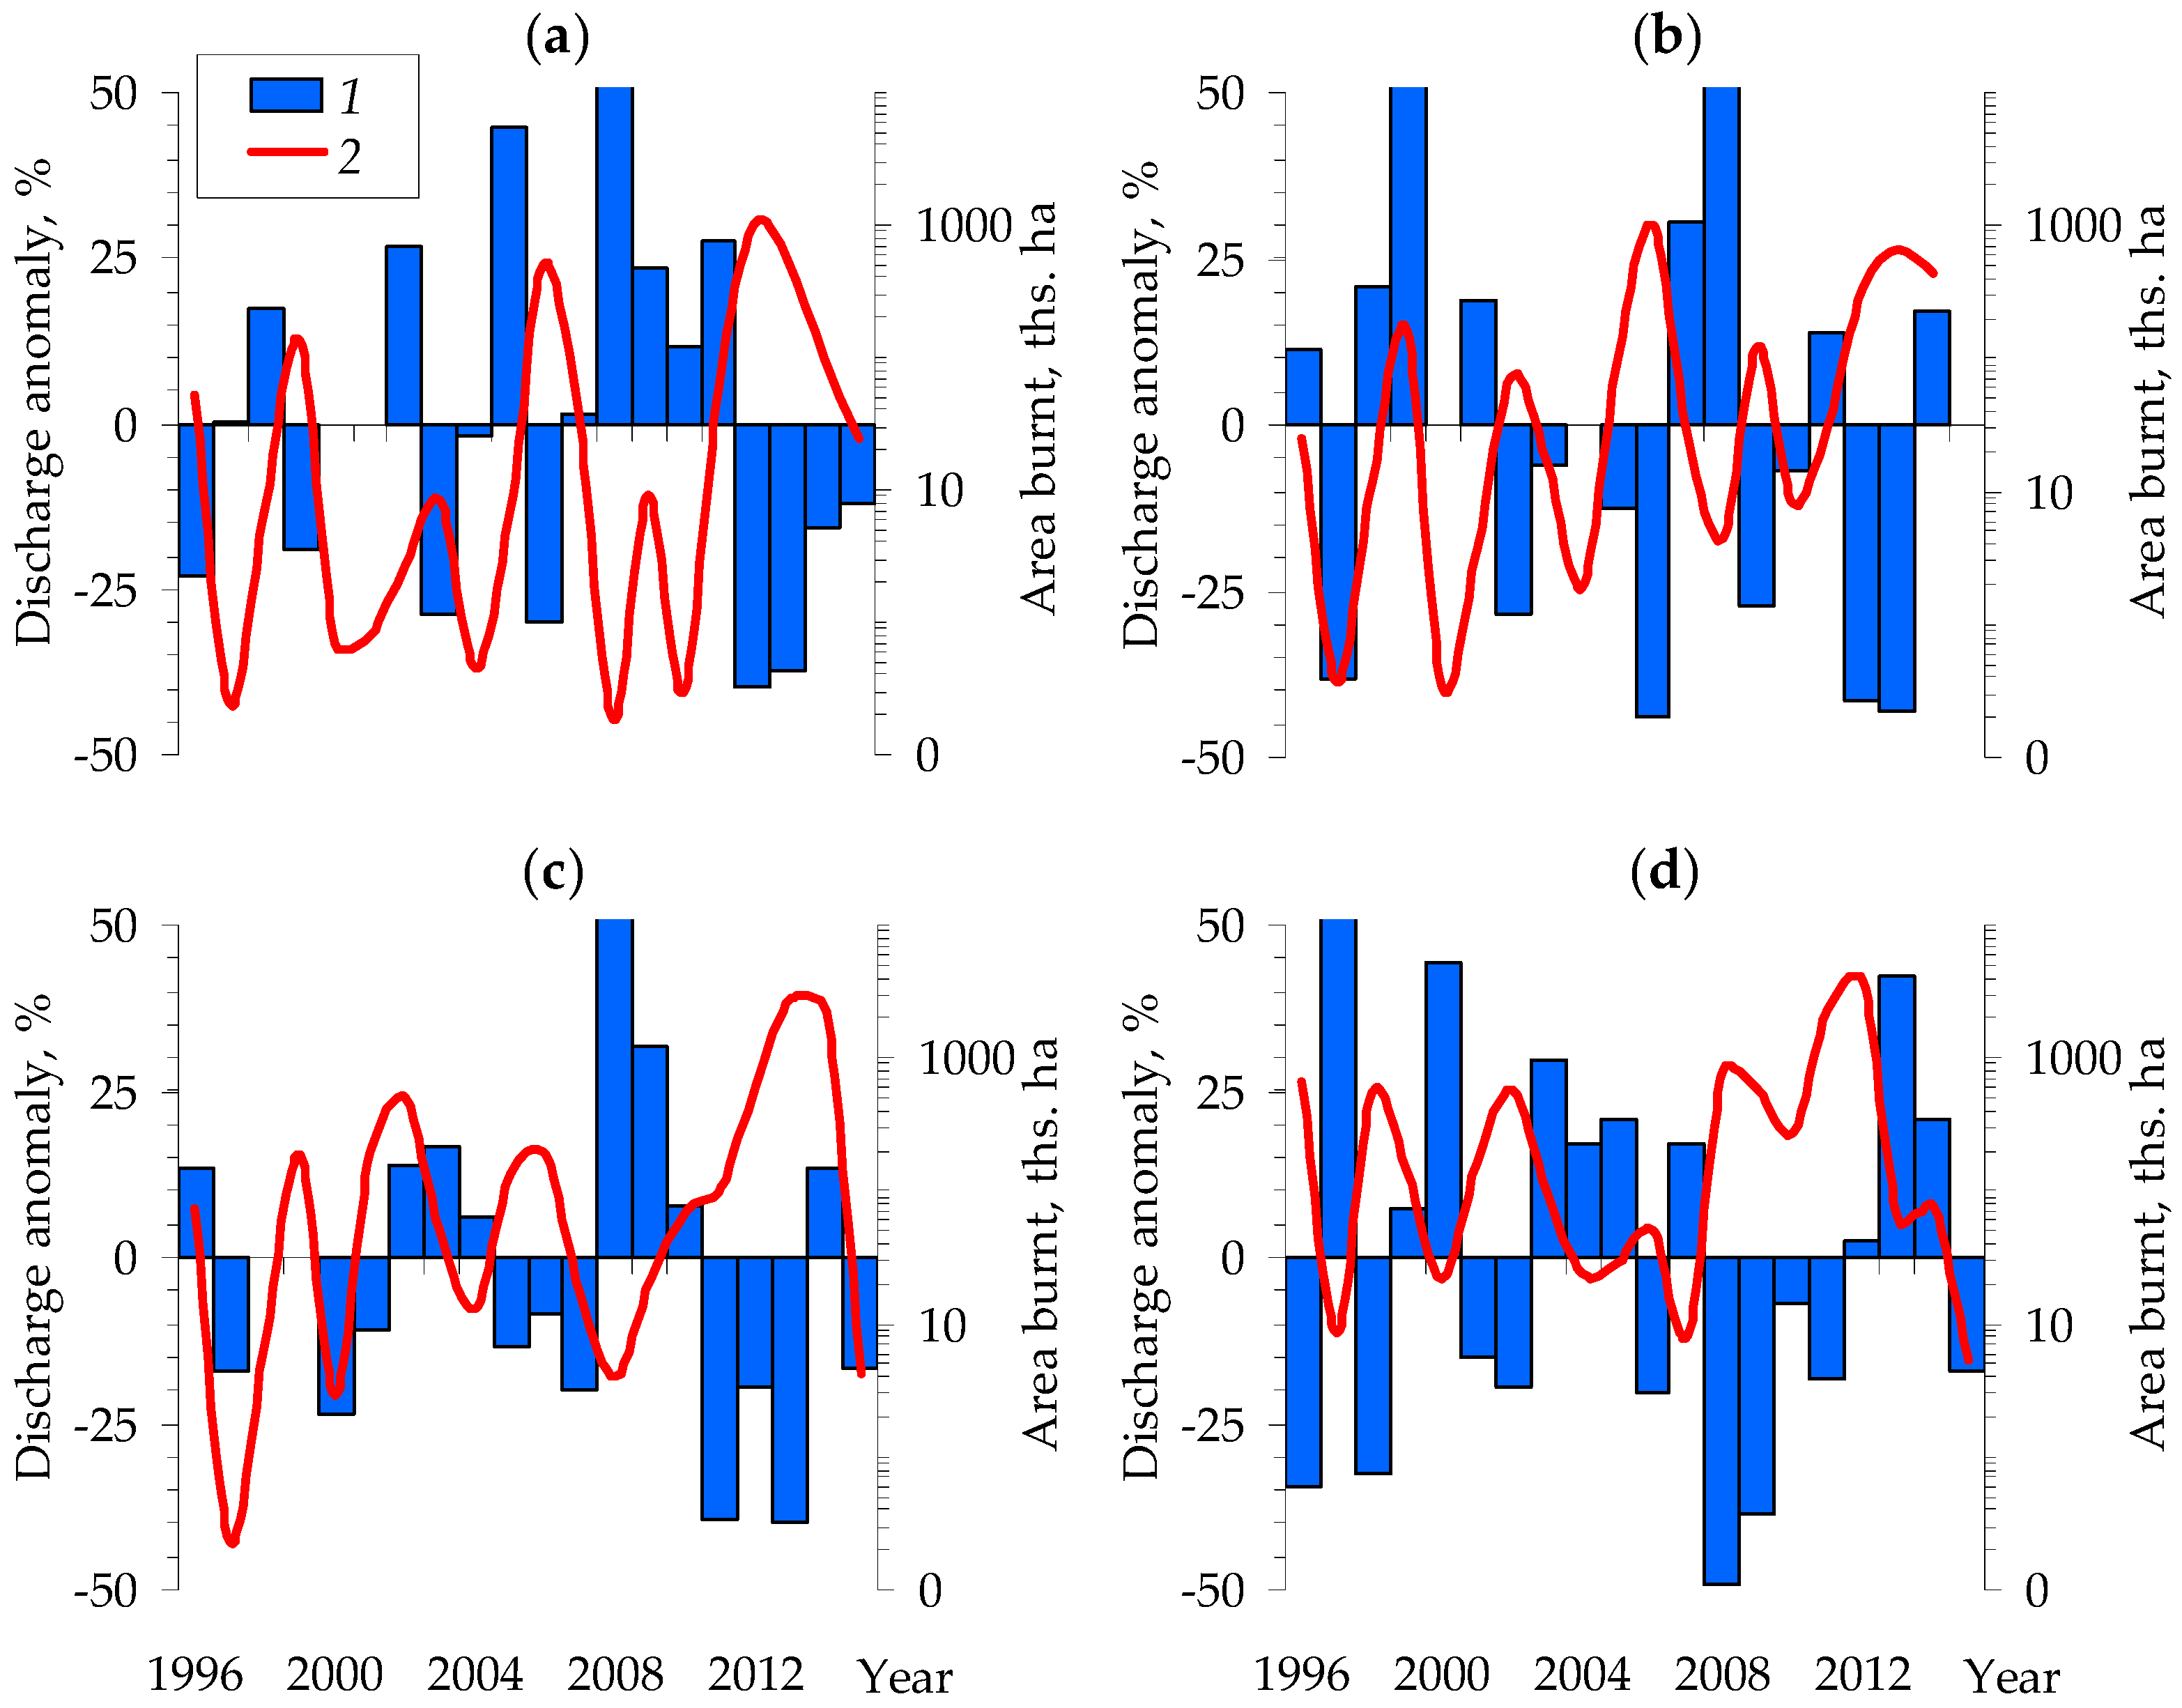
The seasonal correlation of the river discharge anomalies and the burnt area was illustrated (Figure 3). Generally, a low runoff corresponds to an area burnt per season. However, the level of correlation was not high (r = –0.38…–0.53, p < 0.05). The most significant correlation was for the Podkamennaya Tunguska basin (r = –0.66).
The next stage was to investigate the level of intra-seasonal correlation. It can be assumed: (1) that the runoff minima of the first half of the vegetation season may be precursors of high forest burning; and (2) that the consequences in terms of the postfire runoff would be observed in late summer or in early autumn.
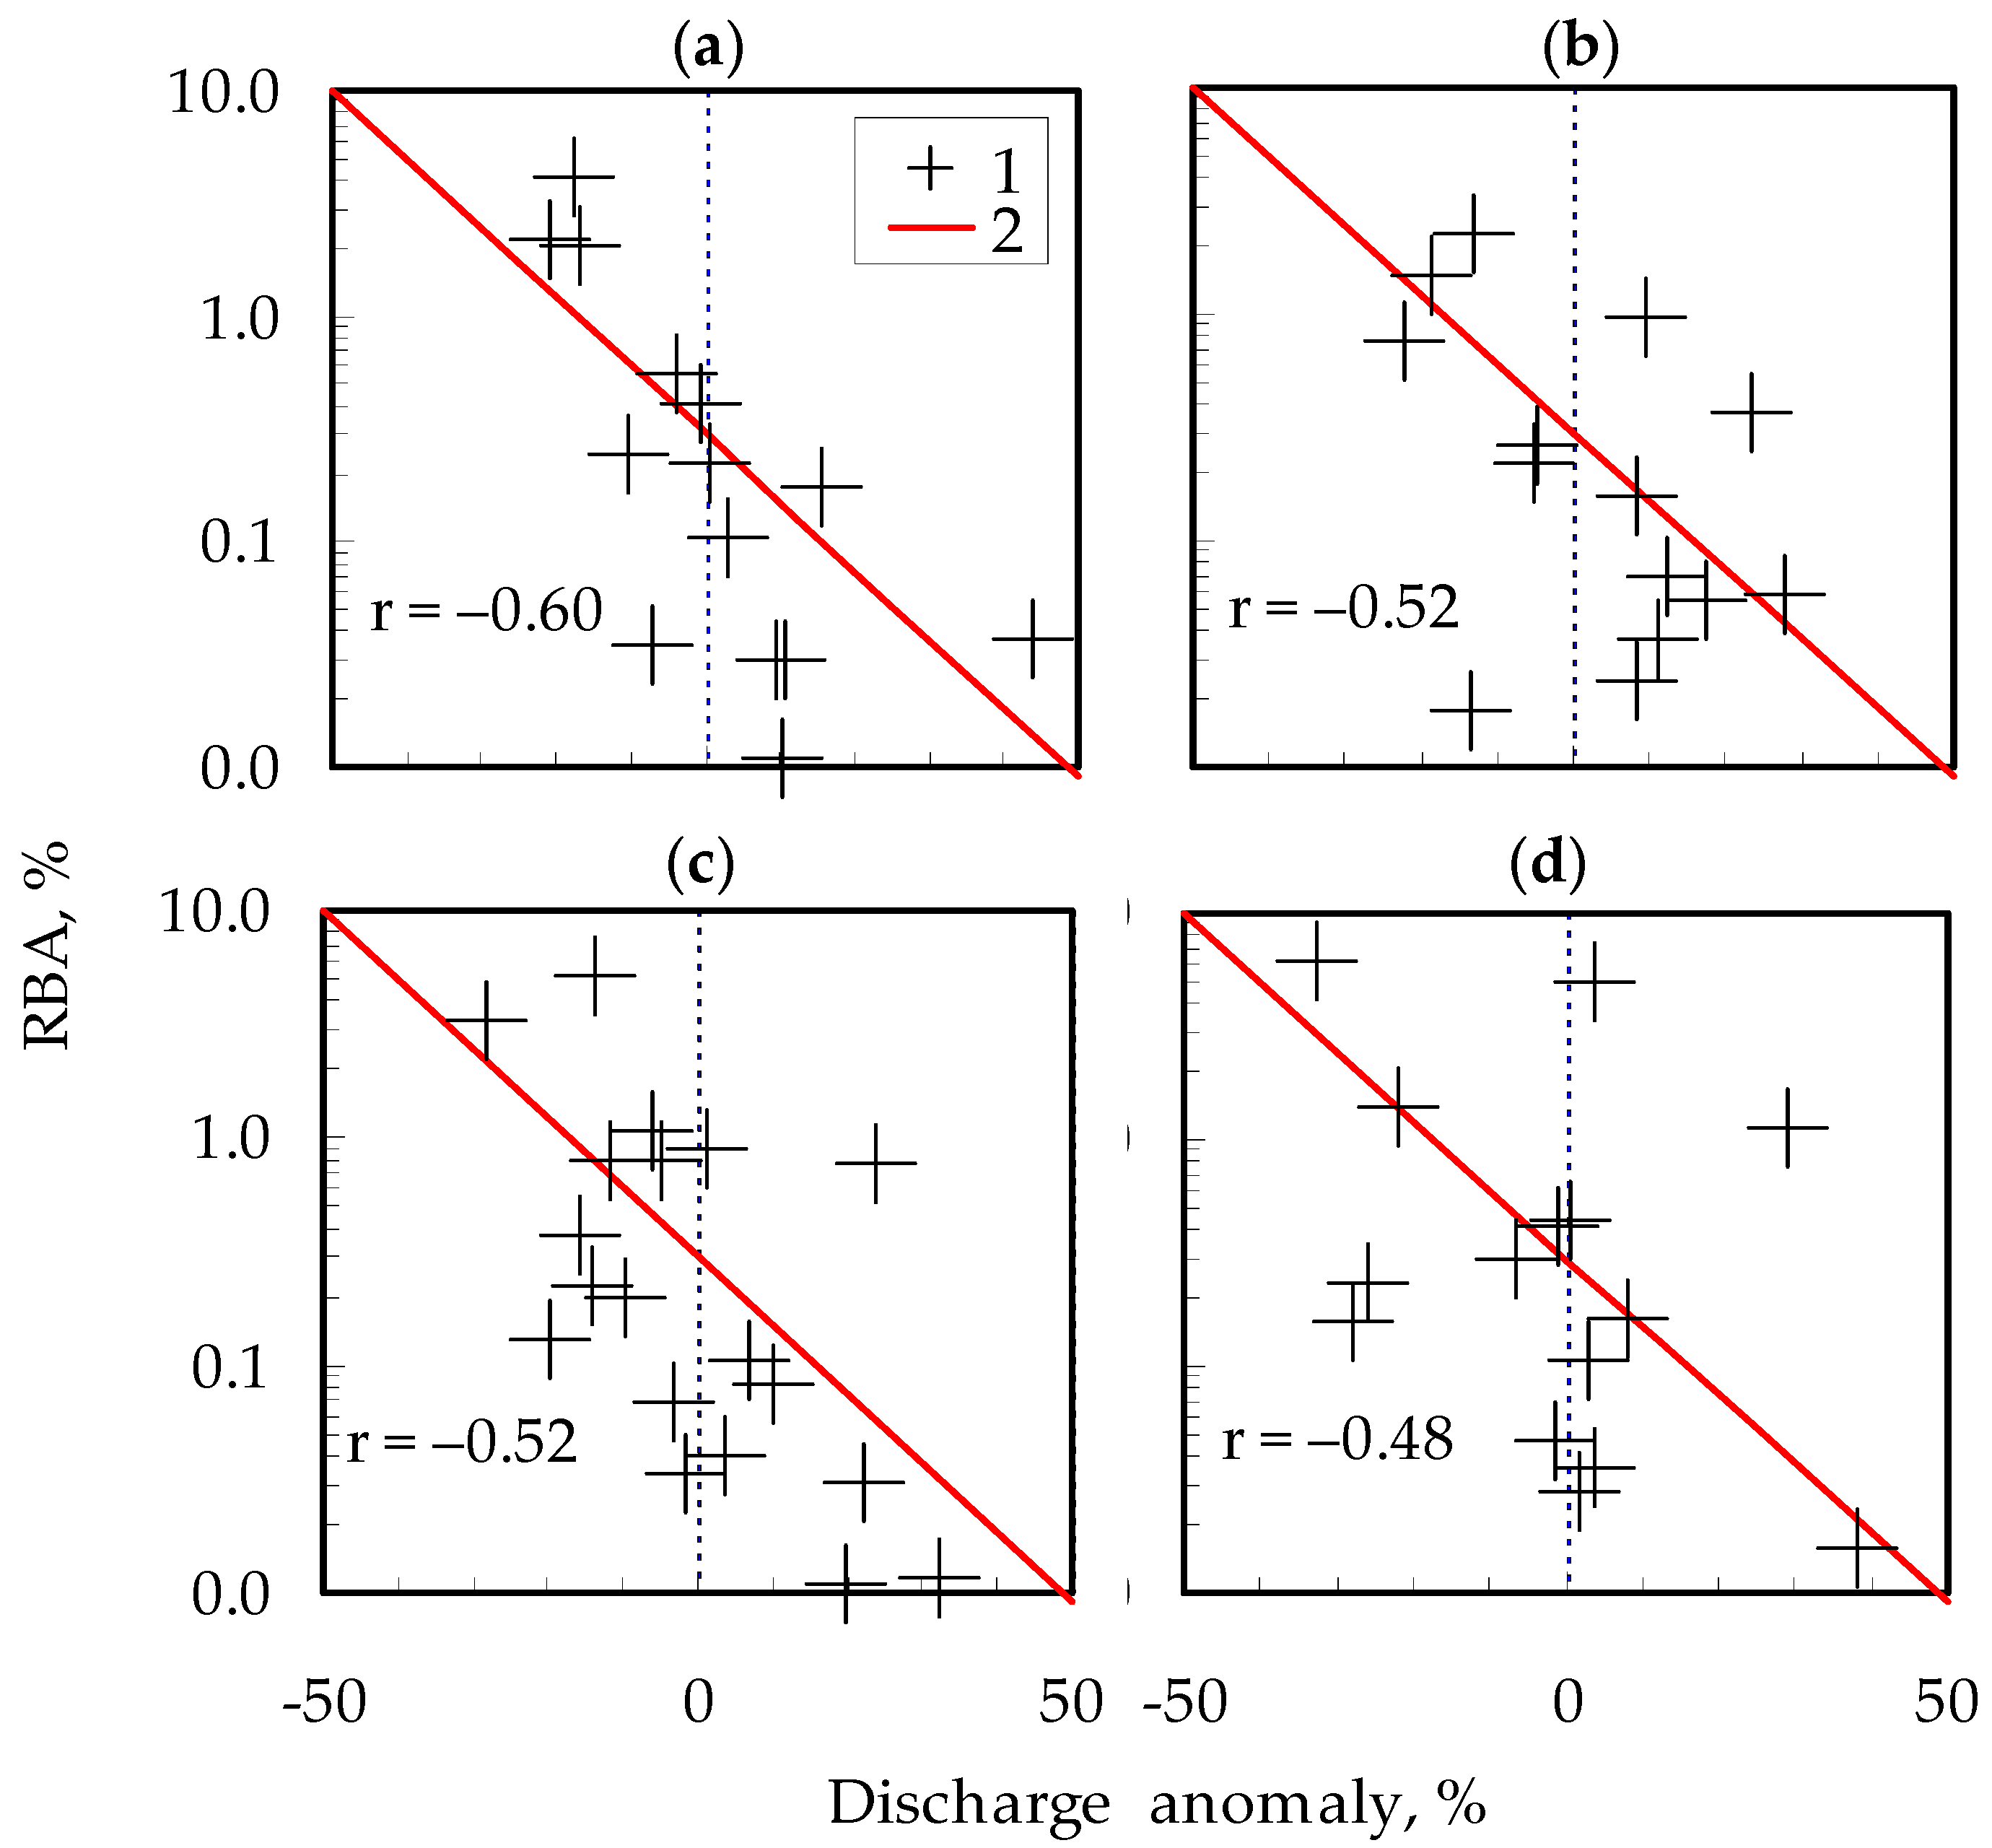
To describe the dependence quantitatively, we analyzed the data on the burned areas and runoff anomalies jointly per month/season of the year (Table 2 and Table 3). According to our data, the correlation was rising up to r = −0.48…−0.60 for the first half of the vegetation season (March–July) during the last decade spanning 2005–2015 (Figure 4).
4. Discussion
The groundwater supply is influenced by permafrost active layer dynamics, the vegetation cover state as well as soil conditions. Wildfire impacts could be significant in some seasons of extreme forest burning. Fires impact the groundwater discharge by changing both the supply of water and the transmissivity of the subsurface [17,18]. However, interpretations of this impact are not fully understood [3,9,35] and estimations of the postfire runoff are not similar for different regions and different conditions [19,21,22].
Our results were obtained for the conditions of the permafrost. The correlation between the mid-summer burning (July) and the runoff anomalies in August–September was evaluated. The postfire effect on the river discharge was recorded for all of the selected rivers. Late summer and autumn postfire runoff anomalies were typical for the rivers of Central Siberia (Podkamennaya Tunguska and Lower Tunguska). A relatively high correlation level (r = −0.57…−0.77, p < 0.05) was observed there. However, the dependence was not significant (r < –0.42) for Eastern Siberia/Yakutia (the Aldan and Viluy rivers).
The only exception was in the case of the Aldan river basin, which was characterized as having an insignificant dependence of autumn runoff to the burnt area. The territory of this basin differs in soil characteristics, which are dominated by water permeable loamy soils and crystalline rocks [1,24]. This is probably the reason why the runoff regime was preserved after fires there. Wildfires cause several geo-morphically important changes in soil properties, including the modification of the pre-fire soil profile and the development of a spatial variation of the soil properties. Combustion removes some or all of the litter, and may induce or enhance a water-repellent layer [36]. Erosion after wildfires are often attributed to the development of hydrophobic soils [35]. For a comparison, the soils of the Viluy River lowland are dominated by loess-like sediments [24] with a higher water permeability, especially in conditions of postfire thermal imbalance. Cryozems and podburs predominate in the basins of the Lower Tunguska and Podkamennaya Tunguska [14]. The soil moisture content, as well as the water permeability, are influenced significantly by the state and degree of the vegetation and ground cover disturbance. Consequently, the correlation between runoff anomalies and forest burning is much more significant here. In fact, late summer and autumn discharge anomalies were more typical for the rivers of Central Siberia (Podkamennaya Tunguska and Lower Tunguska) under postfire conditions in comparison with the rivers of Eastern Siberia/Yakutia.
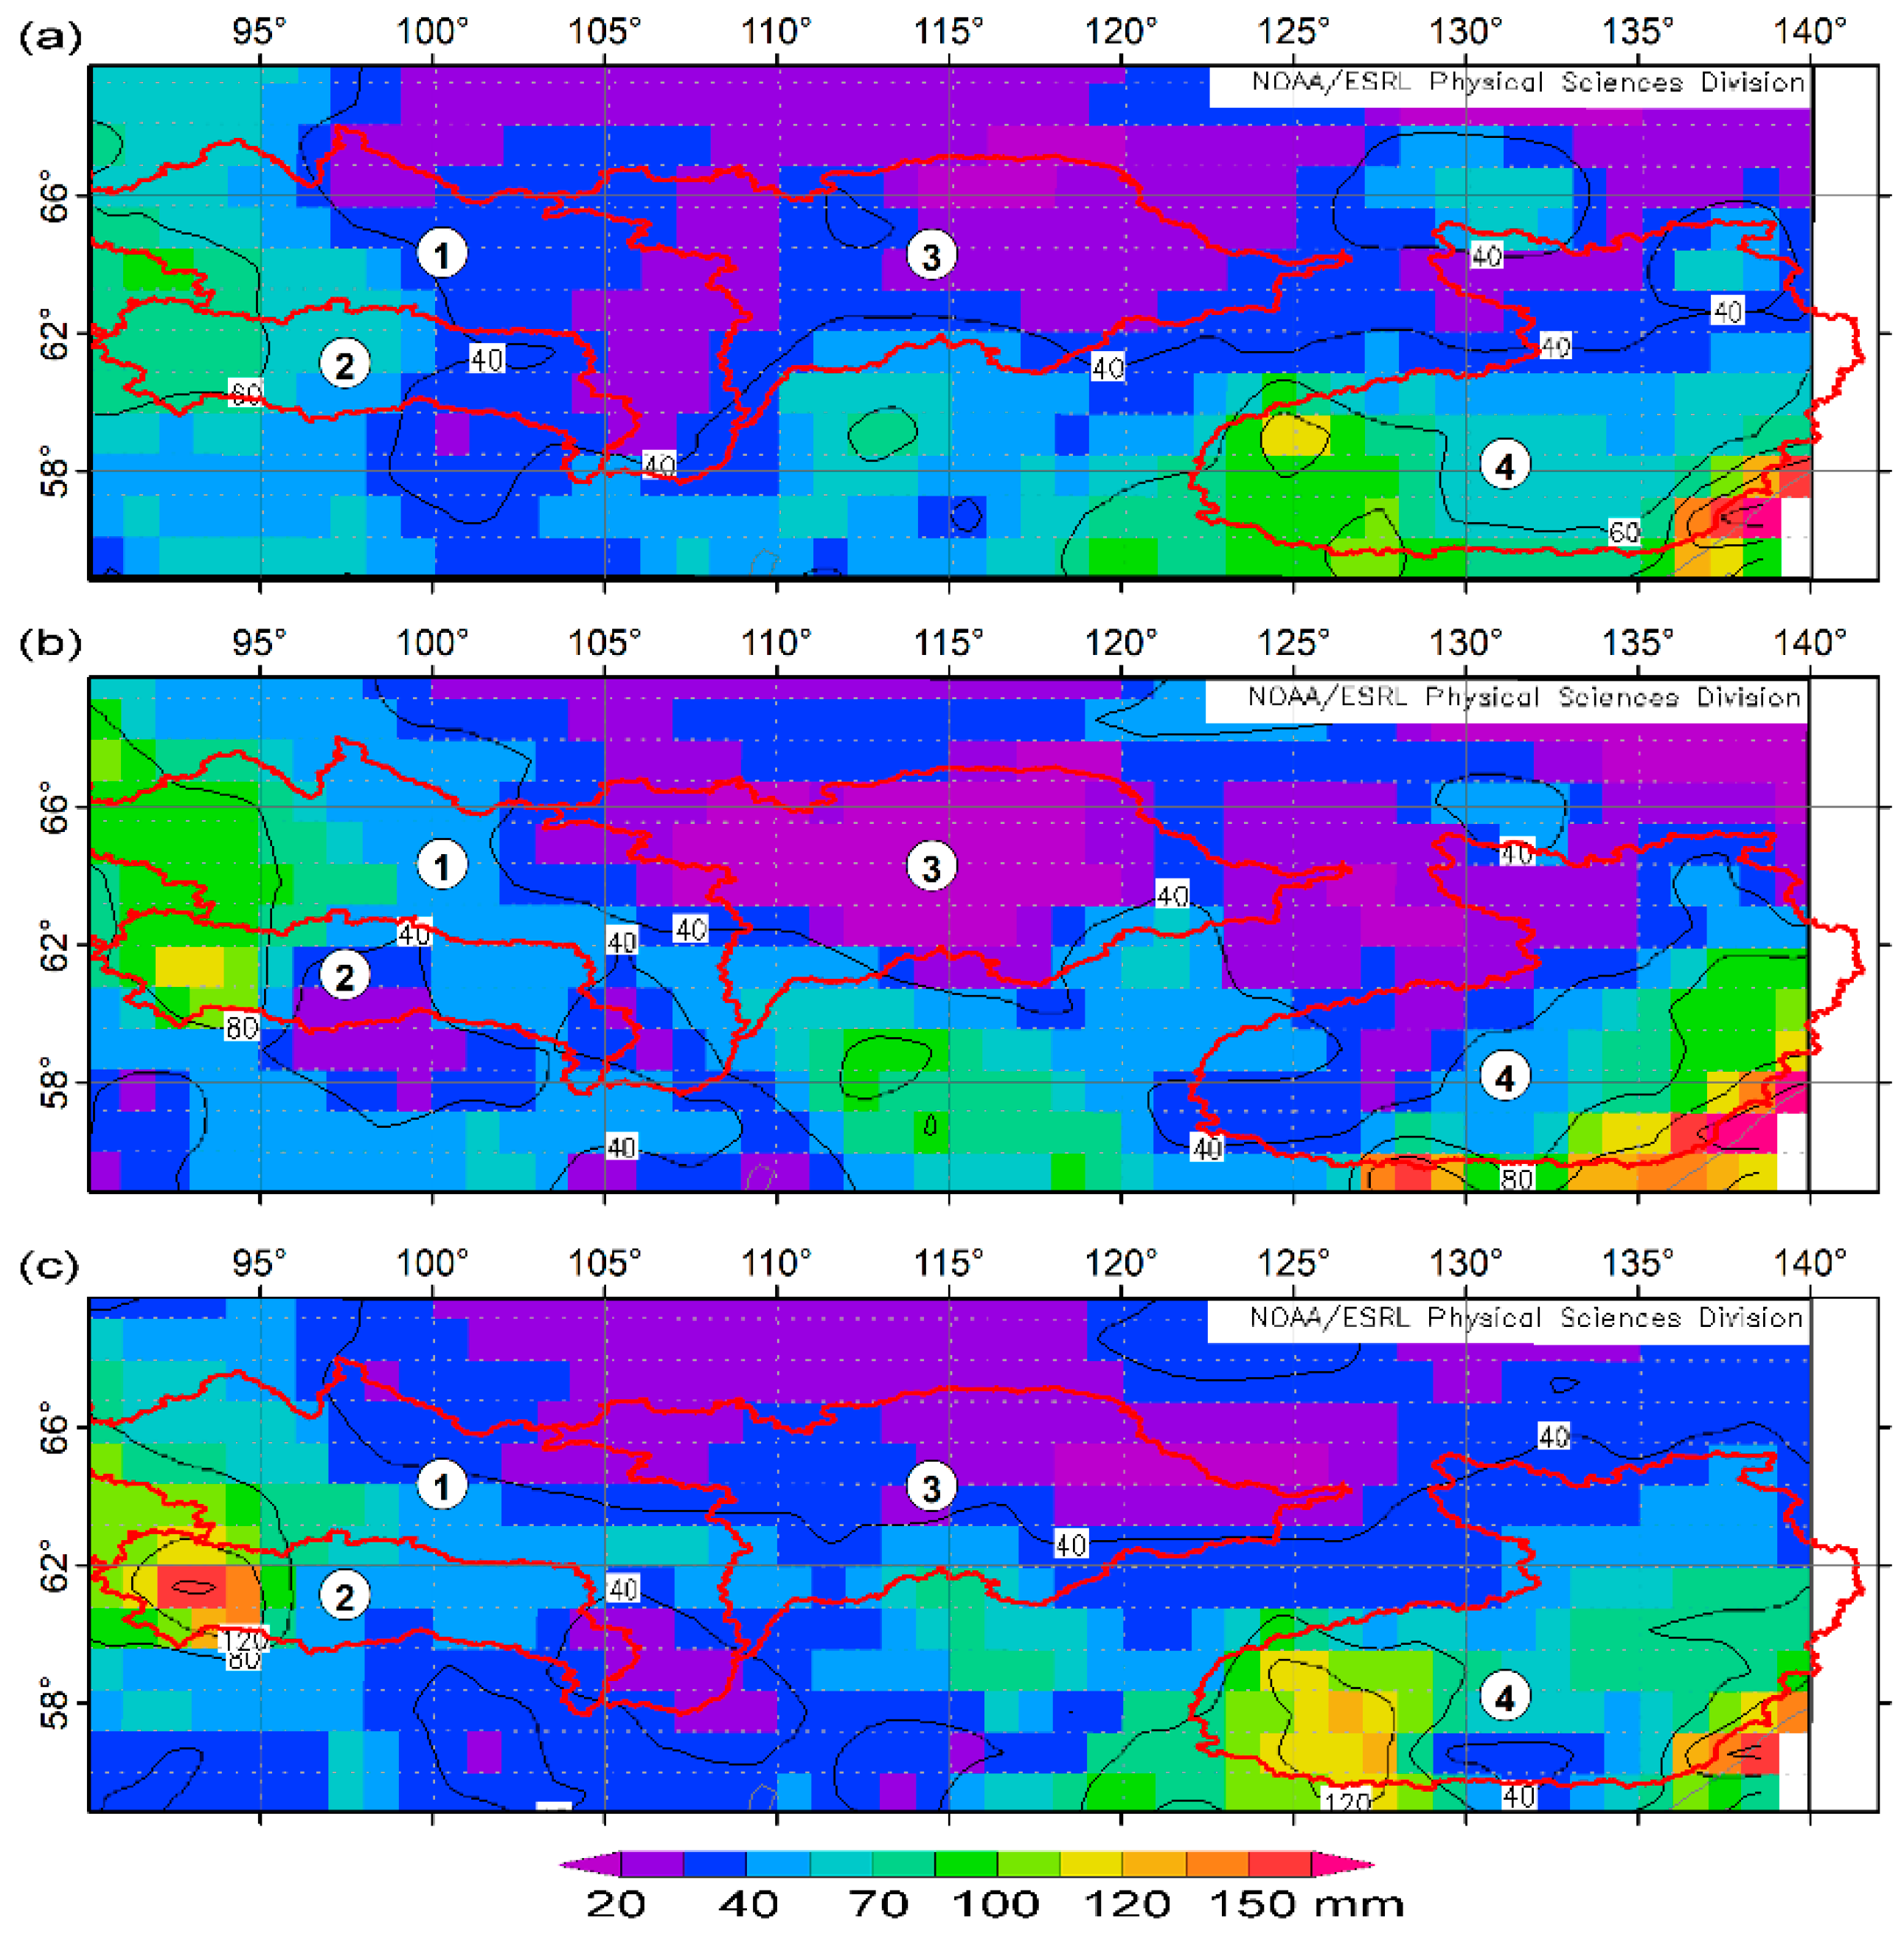
Additionally, the data on precipitation was analyzed from the catalog of the Global Precipitation Climatology Center (GPCC) [32]. We compared the precipitation distribution map of the long-term mean (1981–2010) for September with the distributions for the strongest fire seasons of 2012 and 2013, which were characterized by high anomalies in discharge. Qualitatively, the map of the precipitations remained unchanged (Figure 5). The deficit of runoff that was recorded in September for Podkamennaya Tunguska and Lower Tunguska was not explained by low precipitations. The postfire transformation of the vegetation cover can be the cause of heat and water balance anomalies [12], changes in the depth of the seasonally thawed layers of the soils, or changes in the water permeability within different soil horizons [15]. Consequently, the postfire response of permafrost soil conditions can explain the revealed differences of the runoff, which determines the share of groundwater in the formation of the total river flow. The features of the postfire discharge anomalies are determined by the interdependency of the “fire effect”, “ground cover and vegetation”, and “soil”. The influence of wildfires is only significant for the seasonally thawed layer that is active during the summer–autumn period.
The other side of the question is that runoff anomalies can be considered as predictors of extreme fire occurrences. In [6], it was shown that the data on the moisture content in the soil are an effective indicator of the prediction of forest burning in the permafrost zone of Siberia. At the same time, it is noted that the moisture reserves in the soil in the current season determine the degree of fire danger of this and the subsequent season. For example, the methods for the remote monitoring of water mass dynamics according to gravimetric survey data would be useful for this [11,37]. Furthermore, according to current results, the river discharge anomalies are an effective criterion for predicting the fire regime at the scale of river basins as well.
5. Conclusions
The response of boreal ecosystems to fire impacts is expressed in the anomaly low river runoff during the late summer/autumn period. Late summer and autumn anomalies of discharge were typical for the rivers of Central Siberia during seasons of extreme forest burning. However, the correlation was lower for the rivers of Eastern Siberia/Yakutia. Along with the vegetation, the soil characteristics determine the share of groundwater in the formation of the total river flow under permafrost. It can be assumed that the local postfire permafrost soil conditions can explain the revealed differences of the runoff in Siberia.
Author Contributions
Conceptualization, E.I.P. and T.V.P.; methodology, E.I.P.; writing—original draft preparation, E.I.P. and T.V.P.; writing—review and editing, E.I.P., A.S.P.; funding acquisition, E.I.P., T.V.P., A.S.P.
Funding
This research was funded by the Russian Foundation for Basic Research (RFBR) grant number 17-04-00589 “Radiometric method for quantitative analysis of soils structure organization”, RFBR and Government of the Krasnoyarsk krai, and Krasnoyarsk krai Foundation for Research and Development Support, grant number 18-41-242003 “Modeling and satellite monitoring of effects from thermal anomalies of the underlying surface in the seasonally thawed soil layer of the permafrost zone of Siberia” and grant number 18-05-60203-Arktika “Landscape and hydrobiological controls on the transport of terrigenic carbon to the Arctic Ocean”.
Acknowledgments
River discharge data was provided by The Global Runoff Data Centre, 56068 Koblenz, Germany. The satellite data-receiving equipment used was provided by the Regional Center for Remote Sensing, Federal Research Center “Krasnoyarsk Science Center, Siberian Branch of Russian Academy of Sciences”, Krasnoyarsk, Russia. Reanalysis data on precipitation was obtained from Global Precipitation Climatology Center (GPCC).
Conflicts of Interest
The authors declare no conflict of interest.
References
- Water of Russia. Electronic Resource. Available online: http://water-rf.ru/ (accessed on 9 April 2019).
- Georgiadi, A.G.; Kashutina, E.A. Long-term runoff changes of the largest Siberian Rivers. Izv. Akad. Sci. Ser. Geogr. 2016, 5, 70–81. (In Russian) [Google Scholar] [CrossRef]
- Onuchin, A.A. The reasons for conceptual contradictions in evaluating hydrological role of boreal forests. Sib. J. For. Sci. 2015, 2, 41–54. (In Russian) [Google Scholar] [CrossRef]
- Shiklomanov, A.I.; Lammers, R.B.; Rawlins, M.A.; Smith, L.C.; Pavelsky, T.M. Temporal and spatial variations in maximum river discharge from a new Russian data set. J. Geophys. Res. 2007, 112, G04S53. [Google Scholar] [CrossRef]
- Ponomarev, E.I.; Skorobogatova, A.S.; Ponomareva, T.V. Wildfire Occurrence in Siberia and Seasonal Variations in Heat and Moisture Supply. Russ. Meteorol. Hydrol. 2018, 43, 456–463. [Google Scholar] [CrossRef]
- Bartsch, A.; Balzter, H.; George, C. Influence of regional surface soil moisture anomalies on forest fires in Siberia observed from satellites. Environ. Res. Lett. 2009, 4, 045021. [Google Scholar] [CrossRef]
- Kharuk, V.I.; Dvinskaya, M.L.; Petrov, I.A.; Im, S.T.; Ranson, K.J. Larch Forests of Middle Siberia: Long-Term Trends in Fire Return Intervals. Reg. Environ. Chang. 2016, 8, 2389–2397. [Google Scholar] [CrossRef]
- Brown, D.R.N.; Jorgenson, M.T.; Kielland, K.; Verbyla, D.L.; Prakash, A.; Koch, J.C. Landscape Effects of Wildfire on Permafrost Distribution in Interior Alaska Derived from Remote Sensing. Remote Sens. 2016, 8, 654. [Google Scholar] [CrossRef]
- Knorre, A.A.; Kirdyanov, A.V.; Prokushkin, A.S.; Krusic, P.J.; Buntgen, U. Tree ring-based reconstruction of the long-terminfluence of wildfires on permafrost active layer dynamics in Central Siberia. Sci. Total Environ. 2019, 652, 314–319. [Google Scholar] [CrossRef]
- Neary, D.G.; Gottfried, G.J.; Ffolliott, P.F. Post-Wildfire Watershed Flood Responses. In Proceedings of the Second International Fire Ecology and Fire Management Congress, Paper 1B7, Orlando, FL, USA, 16–20 November 2003. [Google Scholar]
- Forkel, M.; Thonicke, K.; Beer, C.; Cramer, W.; Bartalev, S.; Schmullius, C. Extreme fire events are related to previous-year surface moisture conditions in permafrost-underlain larch forests of Siberia. Environ. Res. Lett. 2012, 7, 044021. [Google Scholar] [CrossRef]
- Ponomarev, E.I.; Ponomareva, T.V. The Effect of Postfire Temperature Anomalies on Seasonal Soil Thawing in the Permafrost Zone of Central Siberia Evaluated Using Remote Data. Contemp. Probl. Ecol. 2018, 11, 420–427. [Google Scholar] [CrossRef]
- Anisimov, O.A.; Sherstiukov, A.B. Evaluating the effect of environmental factors on permafrost in Russia. Earth’s Cryosph. 2016, XX, 90–99. (In Russian) [Google Scholar]
- Bezkorovaynaya, I.N.; Borisova, I.V.; Klimchenko, A.V.; Shabalina, O.M.; Zakharchenko, L.P.; Il’in, A.A.; Beskrovny, A.K. Influence of the pyrogenic factor on the biological activity of the soil in permafrost conditions (Central Evenkia). Vestn. KrasGAU 2017, 9, 181–189. (In Russian) [Google Scholar]
- Dymov, A.A.; Dubrovsky, Y.A.; Gabov, D.N. Pyrogenic Changes in Iron-Illuvial Podzols in the Middle Taiga of the Komi Republic. Eurasian Soil Sci. 2014, 47, 47–56. [Google Scholar] [CrossRef]
- Brown, D.R.N.; Jorgenson, M.T.; Douglas, T.A.; Romanovsky, V.E.; Kielland, K.; Hiemstra, C.; Euskirchen, E.S.; Ruess, R.W. Interactive effects of wildfire and climate on permafrost degradation in Alaskan lowland forests. J. Geophys. Res. Biogeosci. 2015, 120, 1619–1637. [Google Scholar] [CrossRef]
- Batelis, S.; Nalbantis, I. Potential effects of forest fires on streamflow in the Enipeas River Basin, Thessaly, Greece. Environ. Process. 2014, 1, 73–85. [Google Scholar] [CrossRef]
- Havel, A.; Tasdighi, A.; Arabi, M. Assessing the hydrologic response to wildfires in mountainous regions. Hydrol. Earth Syst. Sci. 2018, 22, 2527–2550. [Google Scholar] [CrossRef] [Green Version]
- Springer, J.; Ludwig, R.; Kienzle, S.W. Impacts of Forest Fires and Climate Variability on the Hydrology of an Alpine Medium Sized Catchment in the Canadian Rocky Mountains. Hydrology 2015, 2, 23–47. [Google Scholar] [CrossRef] [Green Version]
- McClelland, J.W.; Holmes, R.M.; Peterson, B.J.; Stieglitz, M. Increasing river discharge in the Eurasian Arctic: Consideration of dams, permafrost thaw, and fires as potential agents of change. J. Geophys. Res. 2004, 109, D18102. [Google Scholar] [CrossRef]
- Zipper, S.C.; Lamontagne-Hallé, P.; McKenzie, J.M.; Rocha, A.V. Groundwater controls on postfire permafrost thaw: Water and energy balance effects. J. Geophys. Res. Earth Surf. 2018, 123, 2677–2694. [Google Scholar] [CrossRef]
- Prokushkin, A.S.; Hobara, S.; Prokushkin, S.G. Behavior of Dissolved Organic Carbon in Larch Ecosystem. In Permafrost Ecosystems, Siberian Larch Forests; Osawa, A., Zyryanova, O.A., Matsuura, Y., Kajimoto, T., Wein, R.W., Eds.; Springer: London, UK, 2010; pp. 205–225. [Google Scholar]
- Ponomarev, E.I.; Kharuk, V.I.; Ranson, J.K. Wildfires Dynamics in Siberian Larch Forests. Forests 2016, 7, 125. [Google Scholar] [CrossRef]
- Fedorov, A.N.; Vasilyev, N.F.; Torgovkin, Y.I.; Shestakova, A.A.; Varlamov, S.P.; Zheleznyak, M.N.; Shepelev, V.V.; Konstantinov, P.Y.; Kalinicheva, S.S.; Basharin, N.I.; et al. Permafrost-Landscape Map of the Republic of Sakha (Yakutia) on a Scale 1:1,500,000. Geosciences 2018, 8, 465. [Google Scholar] [CrossRef]
- Bring, A.; Shiklomanov, A.; Lammers, R.B. Pan-Arctic river discharge: Prioritizing monitoring of future climate change hot spots. Earth’s Future 2017, 5, 72–92. [Google Scholar] [CrossRef]
- Holmes, R.M.; Shiklomanov, A.I.; Tank, S.E.; McClelland, J.W.; Tretiakov, M. River Discharge; Arctic Report Card: Update for 2015. Available online: https://www.arctic.noaa.gov/Report-Card/Report-Card-2015/ArtMID/5037/ArticleID/227/River-Discharge (accessed on 18 October 2018).
- Lehner, B.; Grill, G. Global river hydrography and network routing: Baseline data and new approaches to study the world’s large river systems. Hydrol. Process. 2013, 27, 2171–2186. [Google Scholar] [CrossRef]
- Valendik, E.N.; Ivanova, G.A. Extreme fire seasons in the boreal forests of Central Siberia. For. Sci. 1996, 4, 12–19. (In Russian) [Google Scholar]
- Ivanova, G.A. The history of forest fire in Russia. Dendrochronology 1999, 16–17, 147–161. [Google Scholar]
- Ponomarev, E.I.; Shvetsov, E.G. Satellite detection of forest fires and GIS-methods for result calibration. Issled. Zemli iz Kosmosa (Rem. Sens.) 2015, 1, 84–91. (In Russian) [Google Scholar] [CrossRef]
- Kharuk, V.I.; Ponomarev, E.I. Spatiotemporal characteristics of wildfire frequency and relative area burned in larch-dominated forests of Central Siberia. Russ. J. Ecol. 2017, 48, 507–512. [Google Scholar] [CrossRef]
- Schneider, U.; Becker, A.; Finger, P.; Meyer-Christoffer, A.; Rudolf, B.; Ziese, M. GPCC Full Data Monthly Product Version 7.0 at 1.0: Monthly Land-Surface Precipitation from Rain-Gauges built on GTS-based and Historic Data. 2015. [Google Scholar] [CrossRef]
- Hawkins, D. Biomeasurement. A Student’s Guide Biological Statistics, 3rd ed.; Oxford University Press: New York, NY, USA, 2014; 333p. [Google Scholar]
- De Groot, W.J.; Cantin, A.S.; Flannigan, M.D.; Soja, A.J.; Gowman, L.M.; Newbery, A. A comparison of Canadian and Russian boreal forest fire regimes. For. Ecol. Manag. 2013, 294, 23–34. [Google Scholar] [CrossRef]
- Woods, S.W.; Birkas, A.; Ahl, R. Spatial variability of soil hydrophobicity after wildfires in Montana and Colorado. Geomorphology 2007, 86, 465–479. [Google Scholar] [CrossRef]
- Robichaud, P.R.; Miller, S.M. Spatial interpolation and simulation of post-burn duff thickness after prescribed fire. Int. J. Wildland Fire 1999, 9, 137–143. [Google Scholar] [CrossRef] [Green Version]
- Im, S.T.; Kharuk, V.I. Water mass dynamics in permafrost of Central Siberia based on GRACE gravity data. Izv. Atmos. Ocean. Phys. 2015, 51, 806–818. [Google Scholar] [CrossRef]
- Flannigan, M.; Stocks, B.; Turetsky, M.; Wotton, M. Impacts of climate change on fire activity and fire management in the circumboreal forest. Glob. Chang. Biol. 2009, 15, 549–560. [Google Scholar] [CrossRef]
Figure 1.
The study area and river basins. The color gradient corresponds to the relative burned area per 20 years of satellite monitoring. The river basins are: 1—Lower Tunguska, 2—Podkamennaya Tunguska, 3—Viluy, and 4—Aldan.
Figure 1.
The study area and river basins. The color gradient corresponds to the relative burned area per 20 years of satellite monitoring. The river basins are: 1—Lower Tunguska, 2—Podkamennaya Tunguska, 3—Viluy, and 4—Aldan.

Figure 2.
The long-term data on the total annual runoff (km3). The dots indicate the minima, which correspond to the dates of extreme fire events. Dotted line—annual mean value of the discharge per season. Rivers: (a) Podkamennaya Tunguska; (b) Lower Tunguska; (c) Viluy; and (d) Aldan.
Figure 2.
The long-term data on the total annual runoff (km3). The dots indicate the minima, which correspond to the dates of extreme fire events. Dotted line—annual mean value of the discharge per season. Rivers: (a) Podkamennaya Tunguska; (b) Lower Tunguska; (c) Viluy; and (d) Aldan.

Figure 3.
The seasonal variety of discharge anomalies (1) and burnt area (2) for 1996–2015. The river basins are: (a) Podkamennaya Tunguska; (b) Lower Tunguska; (c) Viluy; and (d) Aldan.
Figure 3.
The seasonal variety of discharge anomalies (1) and burnt area (2) for 1996–2015. The river basins are: (a) Podkamennaya Tunguska; (b) Lower Tunguska; (c) Viluy; and (d) Aldan.

Figure 4.
RBA (γ, %) vs. the discharge anomalies for the first half of the vegetation season (March–July). (a) Podkamennaya Tunguska, (b) Lower Tunguska, (c) Aldan, and (d) Viluy. 1—data, and 2—linear model.
Figure 4.
RBA (γ, %) vs. the discharge anomalies for the first half of the vegetation season (March–July). (a) Podkamennaya Tunguska, (b) Lower Tunguska, (c) Aldan, and (d) Viluy. 1—data, and 2—linear model.

Figure 5.
The reanalysis data [32] of the precipitation for September. (a) The long-term mean, (b) 2012, and (c) 2013. The river basins are 1—Lower Tunguska, 2—Podkamennaya Tunguska, 3—Viluy, and 4—Aldan.
Figure 5.
The reanalysis data [32] of the precipitation for September. (a) The long-term mean, (b) 2012, and (c) 2013. The river basins are 1—Lower Tunguska, 2—Podkamennaya Tunguska, 3—Viluy, and 4—Aldan.


Table 1.
The long-term discharge anomalies and relative burned area (γ).
| River Name | Area of Basin, mln ha | Discharge, km3 | Discharge Anomaly, % | γ, % | |||
|---|---|---|---|---|---|---|---|
| Min. | Max. | Mean | σ | Max. | |||
| Lower Tunguska | 45.6 | 108.25 | −22 | 29 | 0.49 | 0.60 | 2.99 |
| Podkamennaya Tunguska | 23.8 | 49.87 | −21 | 40 | 0.51 | 0.65 | 4.12 |
| Viluy | 45.5 | 47.97 | −32 | 36 | 0.76 | 1.15 | 6.13 |
| Aldan | 72.8 | 173.59 | −28 | 32 | 0.67 | 0.77 | 5.21 |
Table 2.
Inverse dependence correlation between the discharge anomalies per season of year and RBA.
| River Name | Correlation Level | |||
|---|---|---|---|---|
| November–February | March–April | May–July | August–October | |
| Lower Tunguska | −0.43 | −0.25 | −0.83 | −0.77 |
| Podkamennaya Tunguska | −0.20 | −0.24 | −0.66 | −0.57 |
| Viluy | −0.22 | −0.16 | −0.42 | −0.42 |
| Aldan | −0.21 | −0.10 | −0.47 | −0.22 |
Table 3.
The correlation matrix for RBA vs. the discharge anomalies.
| River Discharge Anomalies Per Month | |||||||
|---|---|---|---|---|---|---|---|
| April | May | June | July | August | September | ||
| Relative Burned Area per Month, % | Lower Tunguska | ||||||
| April | NA | NA | |||||
| May | NA | NA | −0.60 | ||||
| June | −0.11 | −0.64 | −0.52 * | ||||
| July | −0.29 | −0.59 | −0.65 * | ||||
| August | −0.81 | −0.88 | −0.68 * | ||||
| Podkamennaya Tunguska | |||||||
| April | NA | NA | |||||
| May | 0.07 | −0.33 | −0.54 * | ||||
| June | −0.23 | −0.45 | −0.49 | ||||
| July | −0.34 | −0.73 | −0.68 * | ||||
| August | −0.40 | −0.63 | −0.38 | ||||
| Aldan | |||||||
| April | −0.32 | −0.41 | |||||
| May | −0.38 | −0.38 | −0.45 * | ||||
| June | 0.13 | −0.44 | −0.11 | ||||
| July | −0.57 | −0.21 | −0.19 | ||||
| August | −0.30 | −0.52 | −0.22 | ||||
| Viluy | |||||||
| April | −0.33 | −0.54 * | |||||
| May | 0.03 | −0.43 | −0.53 * | ||||
| June | −0.40 | −0.50 | −0.42 | ||||
| July | −0.28 | −0.45 | −0.32 | ||||
| August | −0.50 | −0.59 | −0.45 * | ||||
* significant correlation coefficients (p < 0.05) are marked.
© 2019 by the authors. Licensee MDPI, Basel, Switzerland. This article is an open access article distributed under the terms and conditions of the Creative Commons Attribution (CC BY) license (http://creativecommons.org/licenses/by/4.0/).
Share and Cite
MDPI and ACS Style
Ponomarev, E.I.; Ponomareva, T.V.; Prokushkin, A.S. Intraseasonal Dynamics of River Discharge and Burned Forest Areas in Siberia. Water 2019, 11, 1146. https://doi.org/10.3390/w11061146
AMA Style
Ponomarev EI, Ponomareva TV, Prokushkin AS. Intraseasonal Dynamics of River Discharge and Burned Forest Areas in Siberia. Water. 2019; 11(6):1146. https://doi.org/10.3390/w11061146
Chicago/Turabian StylePonomarev, Evgenii I., Tatiana V. Ponomareva, and Anatoly S. Prokushkin. 2019. "Intraseasonal Dynamics of River Discharge and Burned Forest Areas in Siberia" Water 11, no. 6: 1146. https://doi.org/10.3390/w11061146
Note that from the first issue of 2016, this journal uses article numbers instead of page numbers. See further details here.