Hydrodynamic Interactions between Bracket and Propeller of Podded Propulsor Based on Particle Image Velocimetry Test


College of Shipbuilding Engineering, Harbin Engineering University, Harbin 150001, China
*
Authors to whom correspondence should be addressed.
Water 2019, 11(6), 1142; https://doi.org/10.3390/w11061142
Submission received: 17 April 2019
/
Revised: 22 May 2019
/
Accepted: 28 May 2019
/
Published: 31 May 2019
(This article belongs to the Section Hydraulics and Hydrodynamics)
Abstract
:In this study, particle image velocimetry was used to measure the fine flow-field characteristics of an L-type podded propulsor in various working conditions. The flow-field details at different cross-sections between the propeller and the inclined bracket were compared and analyzed, allowing for more intuitive comparison of the flow-field characteristics of L-type podded propulsors. The interference mechanisms among the propeller, pod, and bracket of the L-type podded propulsors at different advance coefficients, deflection angles, and deflection directions were investigated in depth. The results of this study can serve as reference material and provide technical support for the design and practical shipbuilding application of L-type podded propulsors. Therefore, the results have theoretical significance and practical engineering value.
1. Introduction
The traditional equipment for measuring propeller thrust and torque is an open water dynamometer. However, the test device should be able to rotate 360 degrees for podded propulsors. In addition, different pod types have different angles between bracket and pod. The measurement method is different from that of the conventional open water dynamometer. Force and moment need to be transmitted to the upper end of bracket through angular gear for output measurement. Therefore, the equipment that was used for regular propellers in open water tests is not suitable, and a set of special test equipment that integrates steering and measurement needs to be developed. A specialist committee on podded propulsion proposed research recommendations on test procedures for podded propulsors at the 25th International Towing Tank Conference (ITTC) [1].
Scholars have carried out a lot of experimental studies in view of the hydrodynamic performance of podded propellers under off-design conditions. However, there is no mechanism analysis of the interaction among the bracket, the pod, and the propeller from the micro-fine flow field. Szantyr [2] conducted experimental research in a cavitation tunnel on the hydrodynamic performances of puller, pusher, and dual-propeller podded propulsors in oblique flows. The study indicated that the deflection angle had greater impact on the dual-propeller podded propulsor and that the blade rotation had some impact on the pod performance. Heinke [3] conducted model testing of podded propulsors in a towing tank in complex working conditions, which included the non-designed conditions, such as emergency stopping and dynamic steering. The study revealed the occurrence of an irregular load distribution on the blades when steering at large angles. The performance of the podded propulsors during dynamic steering was slightly better than that at fixed rudder angles. Grygorowicz et al. [4] conducted experimental research on the hydrodynamics of puller and pusher podded propulsors at different deflection angles and different advance coefficients in a circulating water tank. The results showed that the lateral force and the steering torque of the podded propulsor were the functions of the pressure distribution on the blades and velocity of the incoming flow. Reichel [5] studied a pusher podded propulsor that was equipped with right-handed propellers in a towing tank, as well as the variation and pattern of different hydrodynamic coefficients of podded propulsors when changing the advance coefficient, deflection angle, and deflection direction. Islam et al. [6,7] compared the performances of the puller podded propulsors with oblique angles and dynamic steering conditions. The study indicated that the rudder turning rate had little effect on the hydrodynamic performance of podded propulsor. Xin et al. [8] performed model experiments and cavitation observations on the contra-rotating podded propulsors. Their study revealed that the pod and bracket had noticeable effects on the flow-field of the rear blade, which is important to consider when designing a contra-rotating podded propulsor. Shen et al. [9,10,11] conducted a series of experiments on the podded propulsors in a towing tank and cavitation tunnel and documented the effects of the Reynolds number of the propellers, hub-pod gap, and bracket gap on the open water performances of the podded propulsors. The study also indicated that the surface, bracket, or skeg of the pod had no cavitation at small rudder angles. For pusher podded propulsors, the impact of the wake vortex from the blades is the main source of the pulsating pressure. He et al. [12] conducted model experiments on the performances of serial podded propulsors in straight and oblique drive conditions. The results were used to analyze the variations and patterns of different hydrodynamic coefficients with the oblique angle. The study revealed that the pod and front propeller increasingly affected the rear propellers of the serial podded propulsors; an increase in the oblique angle reduced the thrust, while simultaneously increasing the lateral force and steering torque of the podded propulsor.
With the development of underwater particle image velocimetry (PIV) technology, scholars began to study the hydrodynamic performance of podded propeller from a microscopic point of view. The interaction mechanism of support, cabin, and propeller was explored through the fine flow field test, and it was no longer limited to the macroscopic force and moment. An underwater particle image velocimetry system is a piece of equipment that is used in ship model towing tanks to measure the fluid mechanic velocity. The system moves with the ship-towing carriage and performs instantaneous multi-point non-contact measurements on the fine flow-fields of ships and marine structures.
Felice et al. [13] carried out an experimental investigation of the propeller wake in a cavitation tunnel by using particle image velocimetry. A PIV image analysis algorithm that implements iterative window offset and stretching has been adopted. The main characteristics of the propeller wake at different loading conditions have been pointed out. Stettler et al. [14] explored the quasi-steady and dynamic maneuverability of the podded propulsors with model experiments and measured the wake flow-fields of podded propulsors while using PIV. Their experiments showed that the thrust and normal force that are generated by the podded propulsor are approximately linear with respect to the rudder angle in a certain range near the designed advance velocity. Paik et al. [15] investigated the wake characteristics behind a marine propeller with four blades at high Reynolds number by using a two-frame particle image velocimetry technique. They studied the spatial evolution of the propeller wake in the region, ranging from the trailing edge to one propeller diameter downstream location. The phase-averaged mean velocity shows that the trailing vorticity was related to radial velocity jump. Guo and Gong [16,17] used PIV to test the fine flow field of bulk carrier and waterjet-propeller ship in the towing tank, and the uncertainty of measurement was analyzed. Aiming at the uncertainty factors of PIV in towing tank, Falchi and Felli [18,19] generally analyze and explain the uncertainty of PIV measurement system itself.
Based on the autonomously developed podded propulsor model, open water performance was investigated in this study while using the fine flow-field measurement technique and the interference mechanism between the bracket and propeller was explored from a microscopic flow-field perspective.
2. Materials and Methods
2.1. Experimental Model
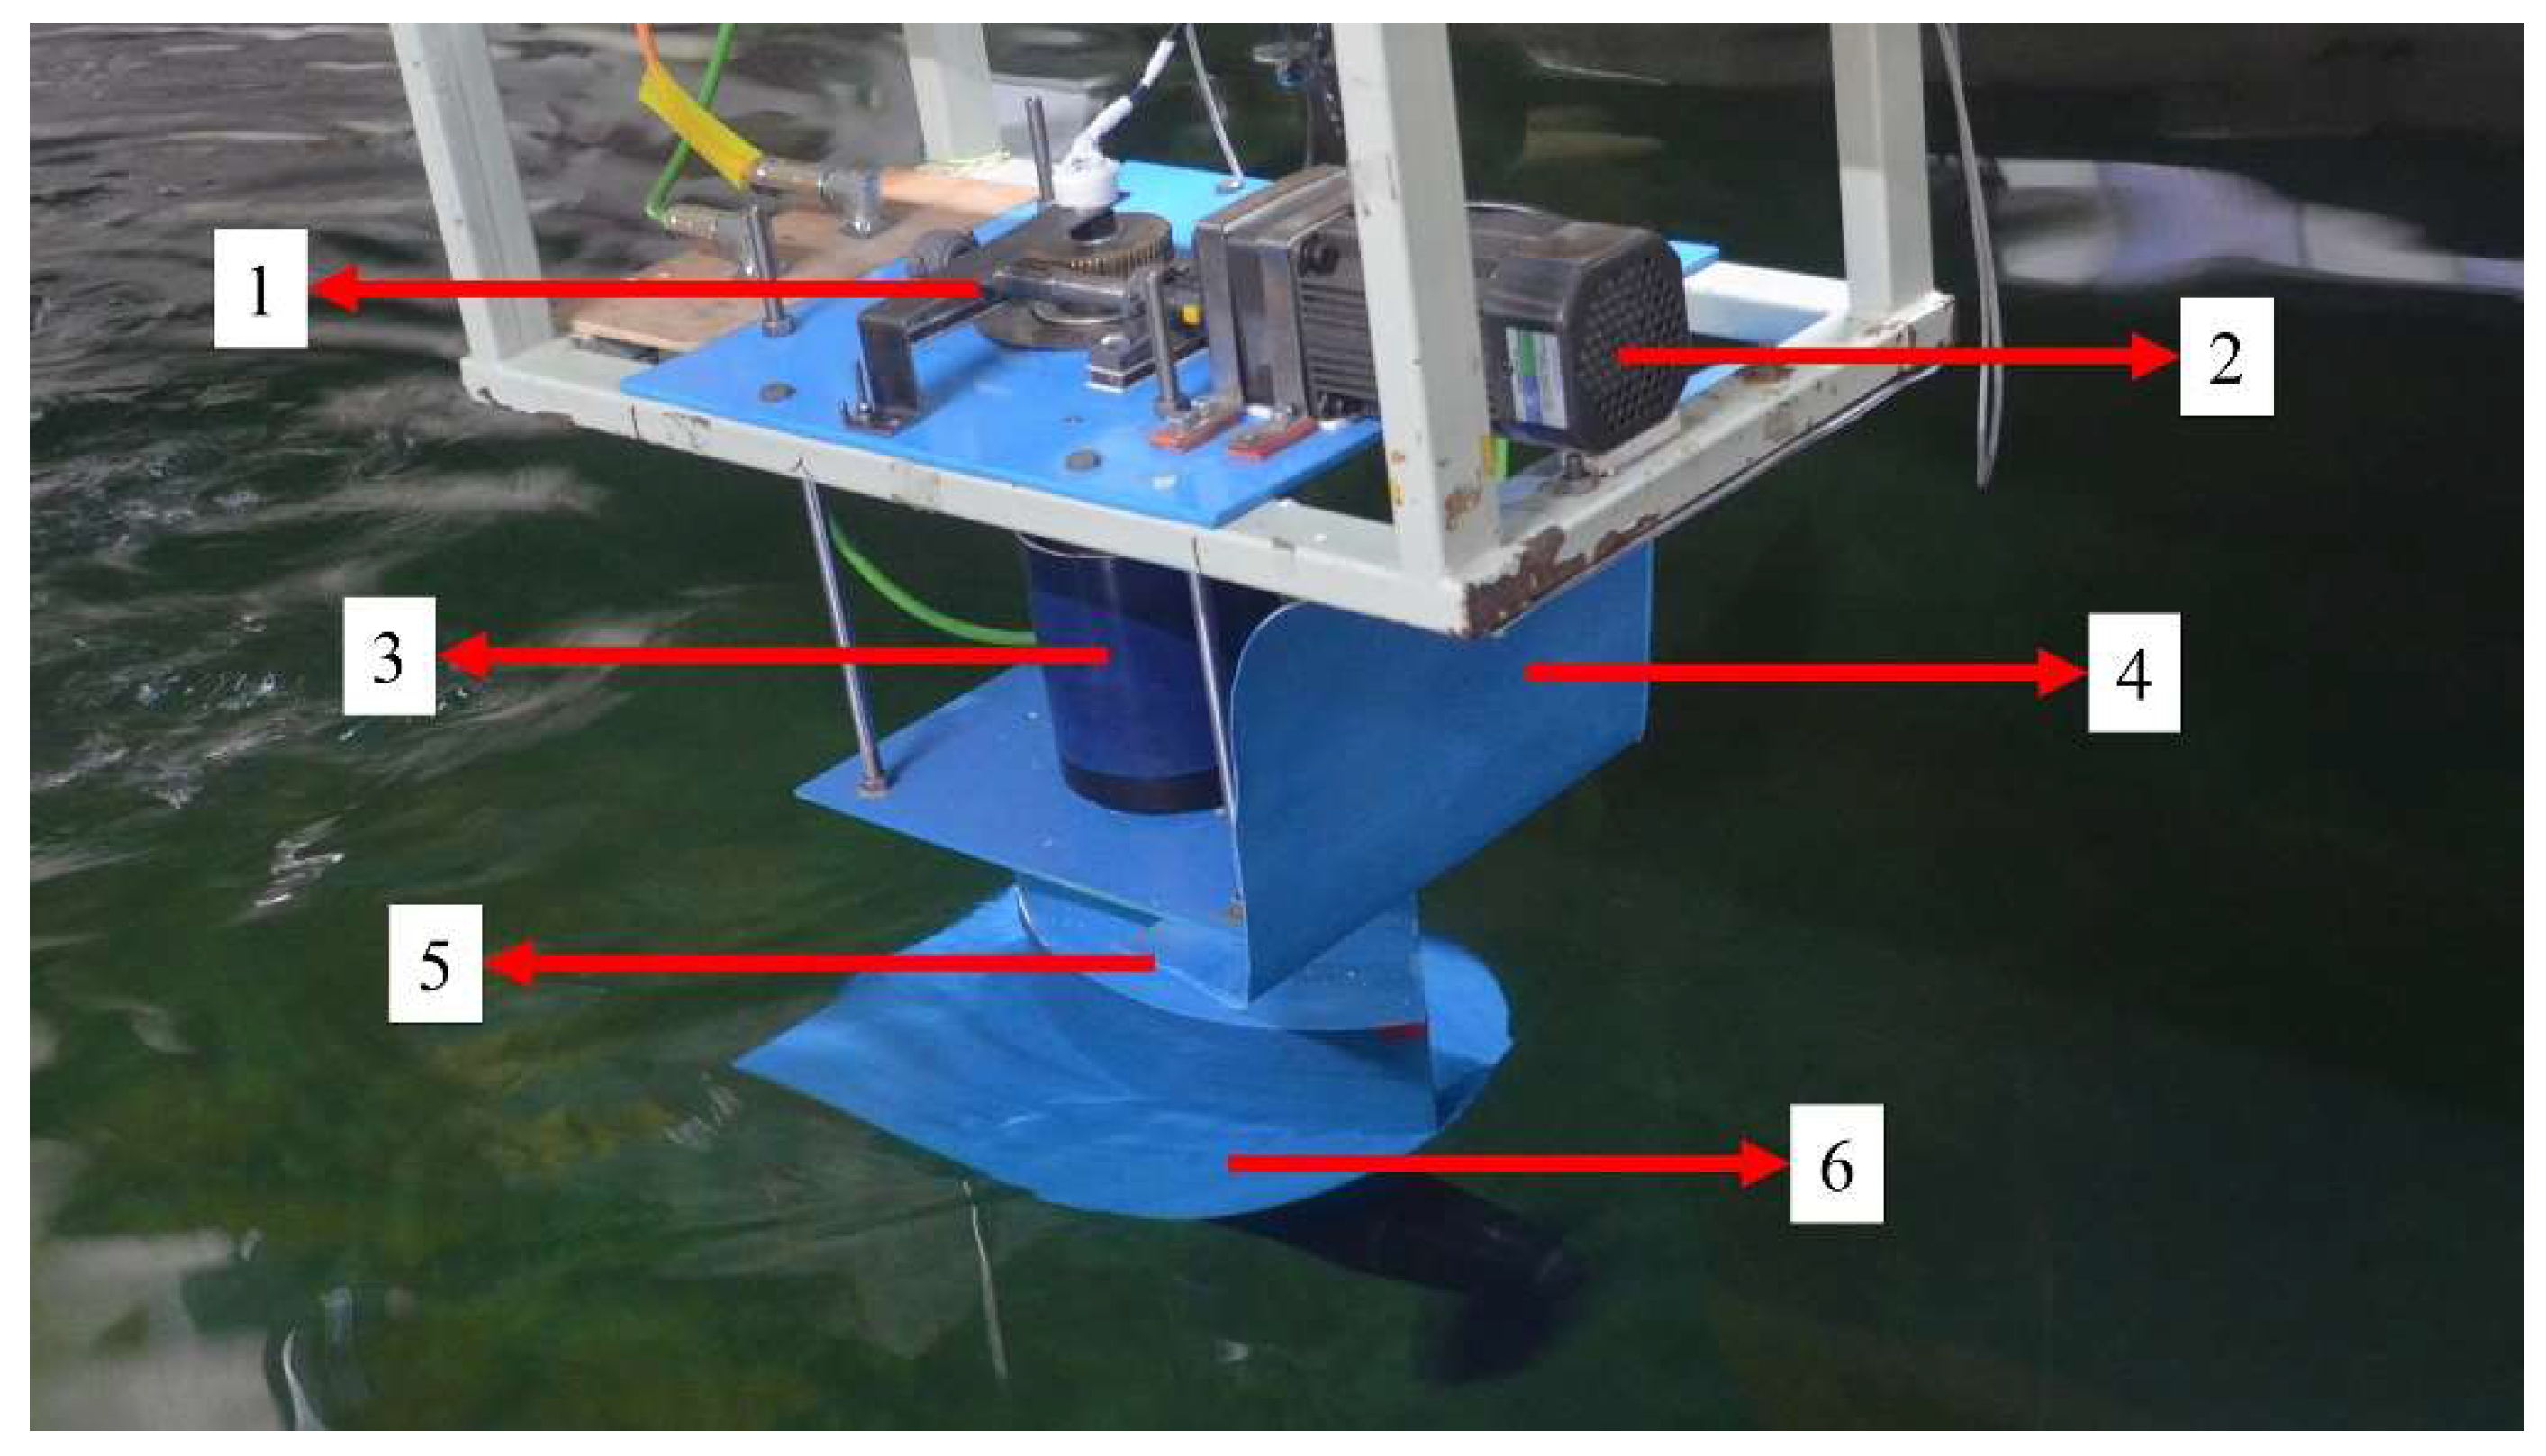
The L-type podded propulsor that was investigated in this study consists of a pod, bracket, and propeller. Table 1 and Table 2 list the basic parameters of the podded propulsor and PIV respectively. Figure 1 and Figure 2 show the experimental system and the stereoscopic towing tank PIV probe and laser.
2.2. PIV Measurement Design
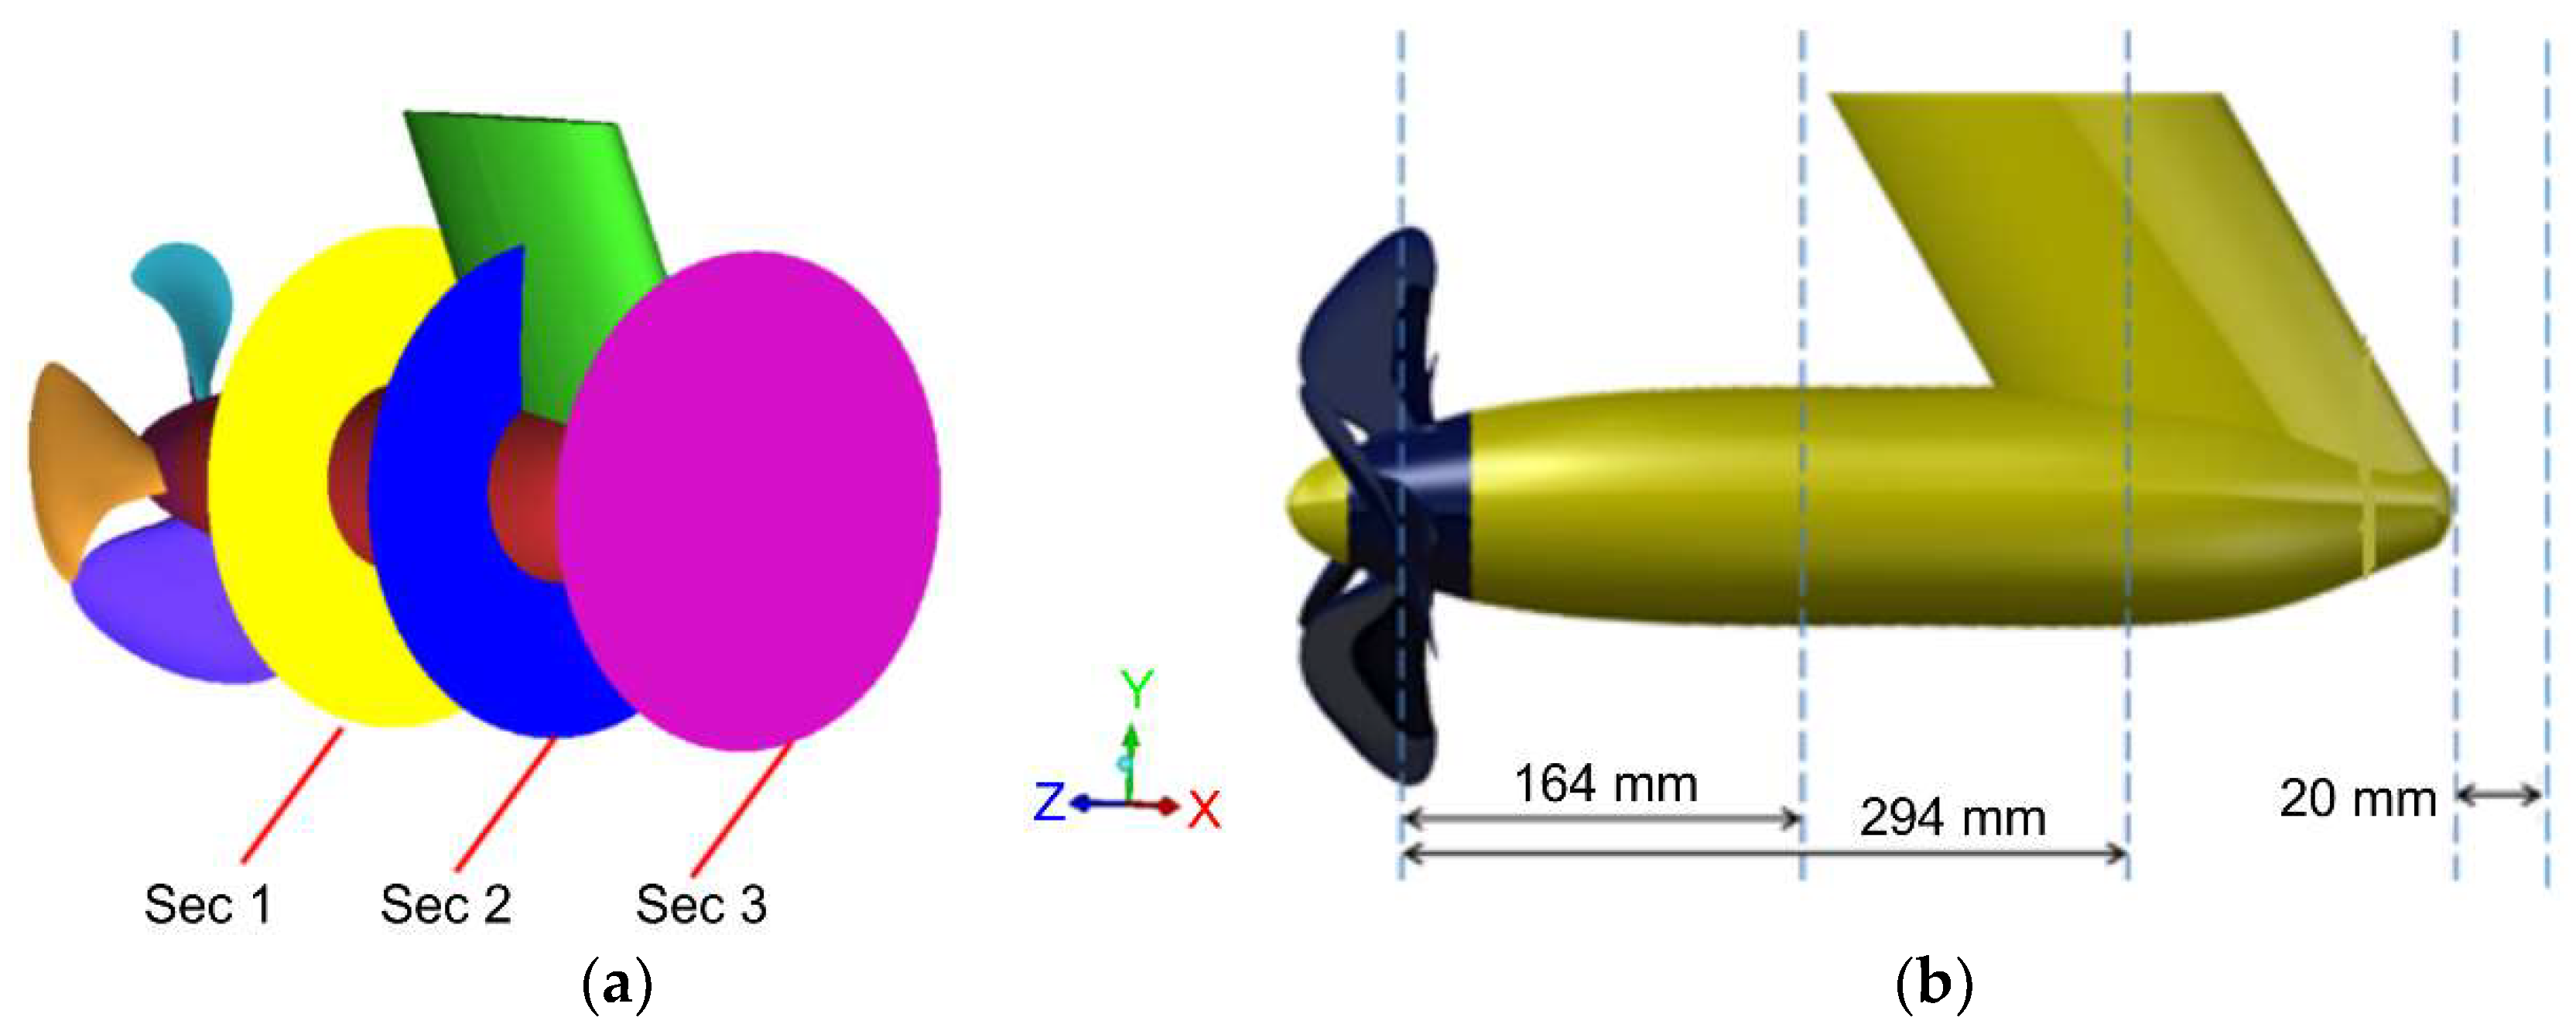
During the whole experiment, the rotating speed of the propeller was 600 rpm. Changing the traveling speed of the carrier changes the advance coefficient of the podded propulsor. The inflow velocity value was 0.24 m/s, 1.2 m/s, and 2.16 m/s. Flow-field information for the L-type podded propulsor was measured using a PIV system with advance coefficients of 0.1, 0.5, and 0.9. The analysis was mainly focused on the flow-field characteristics of the three different cross-sections in straight, 30° oblique, and −30° oblique drive conditions. Cross-section 1 (Sec 1) was 164 mm from the propeller disk, cross-section 2 (Sec 2) was 294 mm from the propeller disk, and cross-section 3 (Sec 3) was 20 mm from the pod tail of the podded propulsor, as shown in Figure 3.
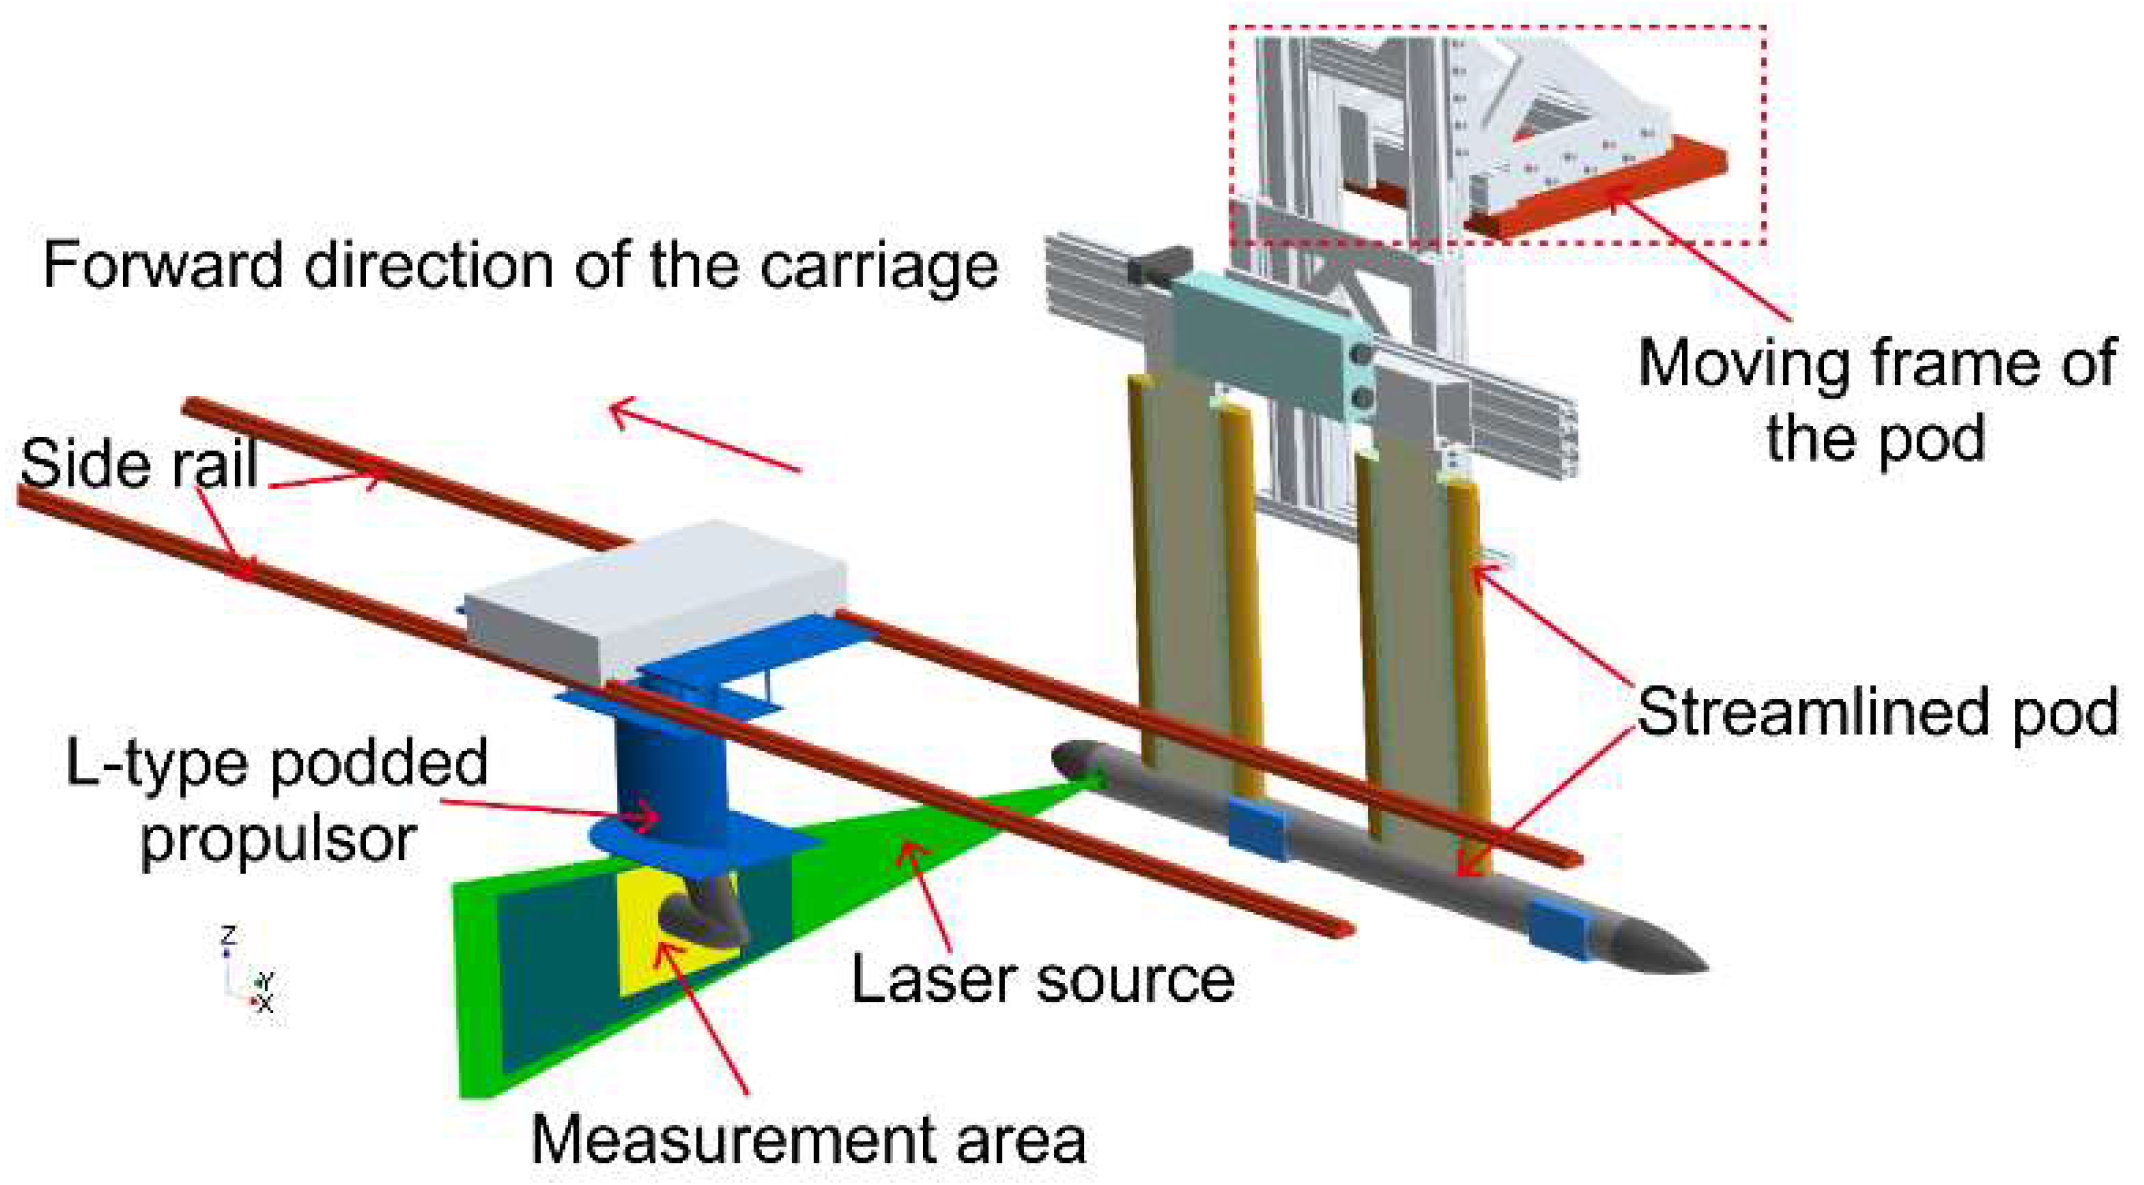
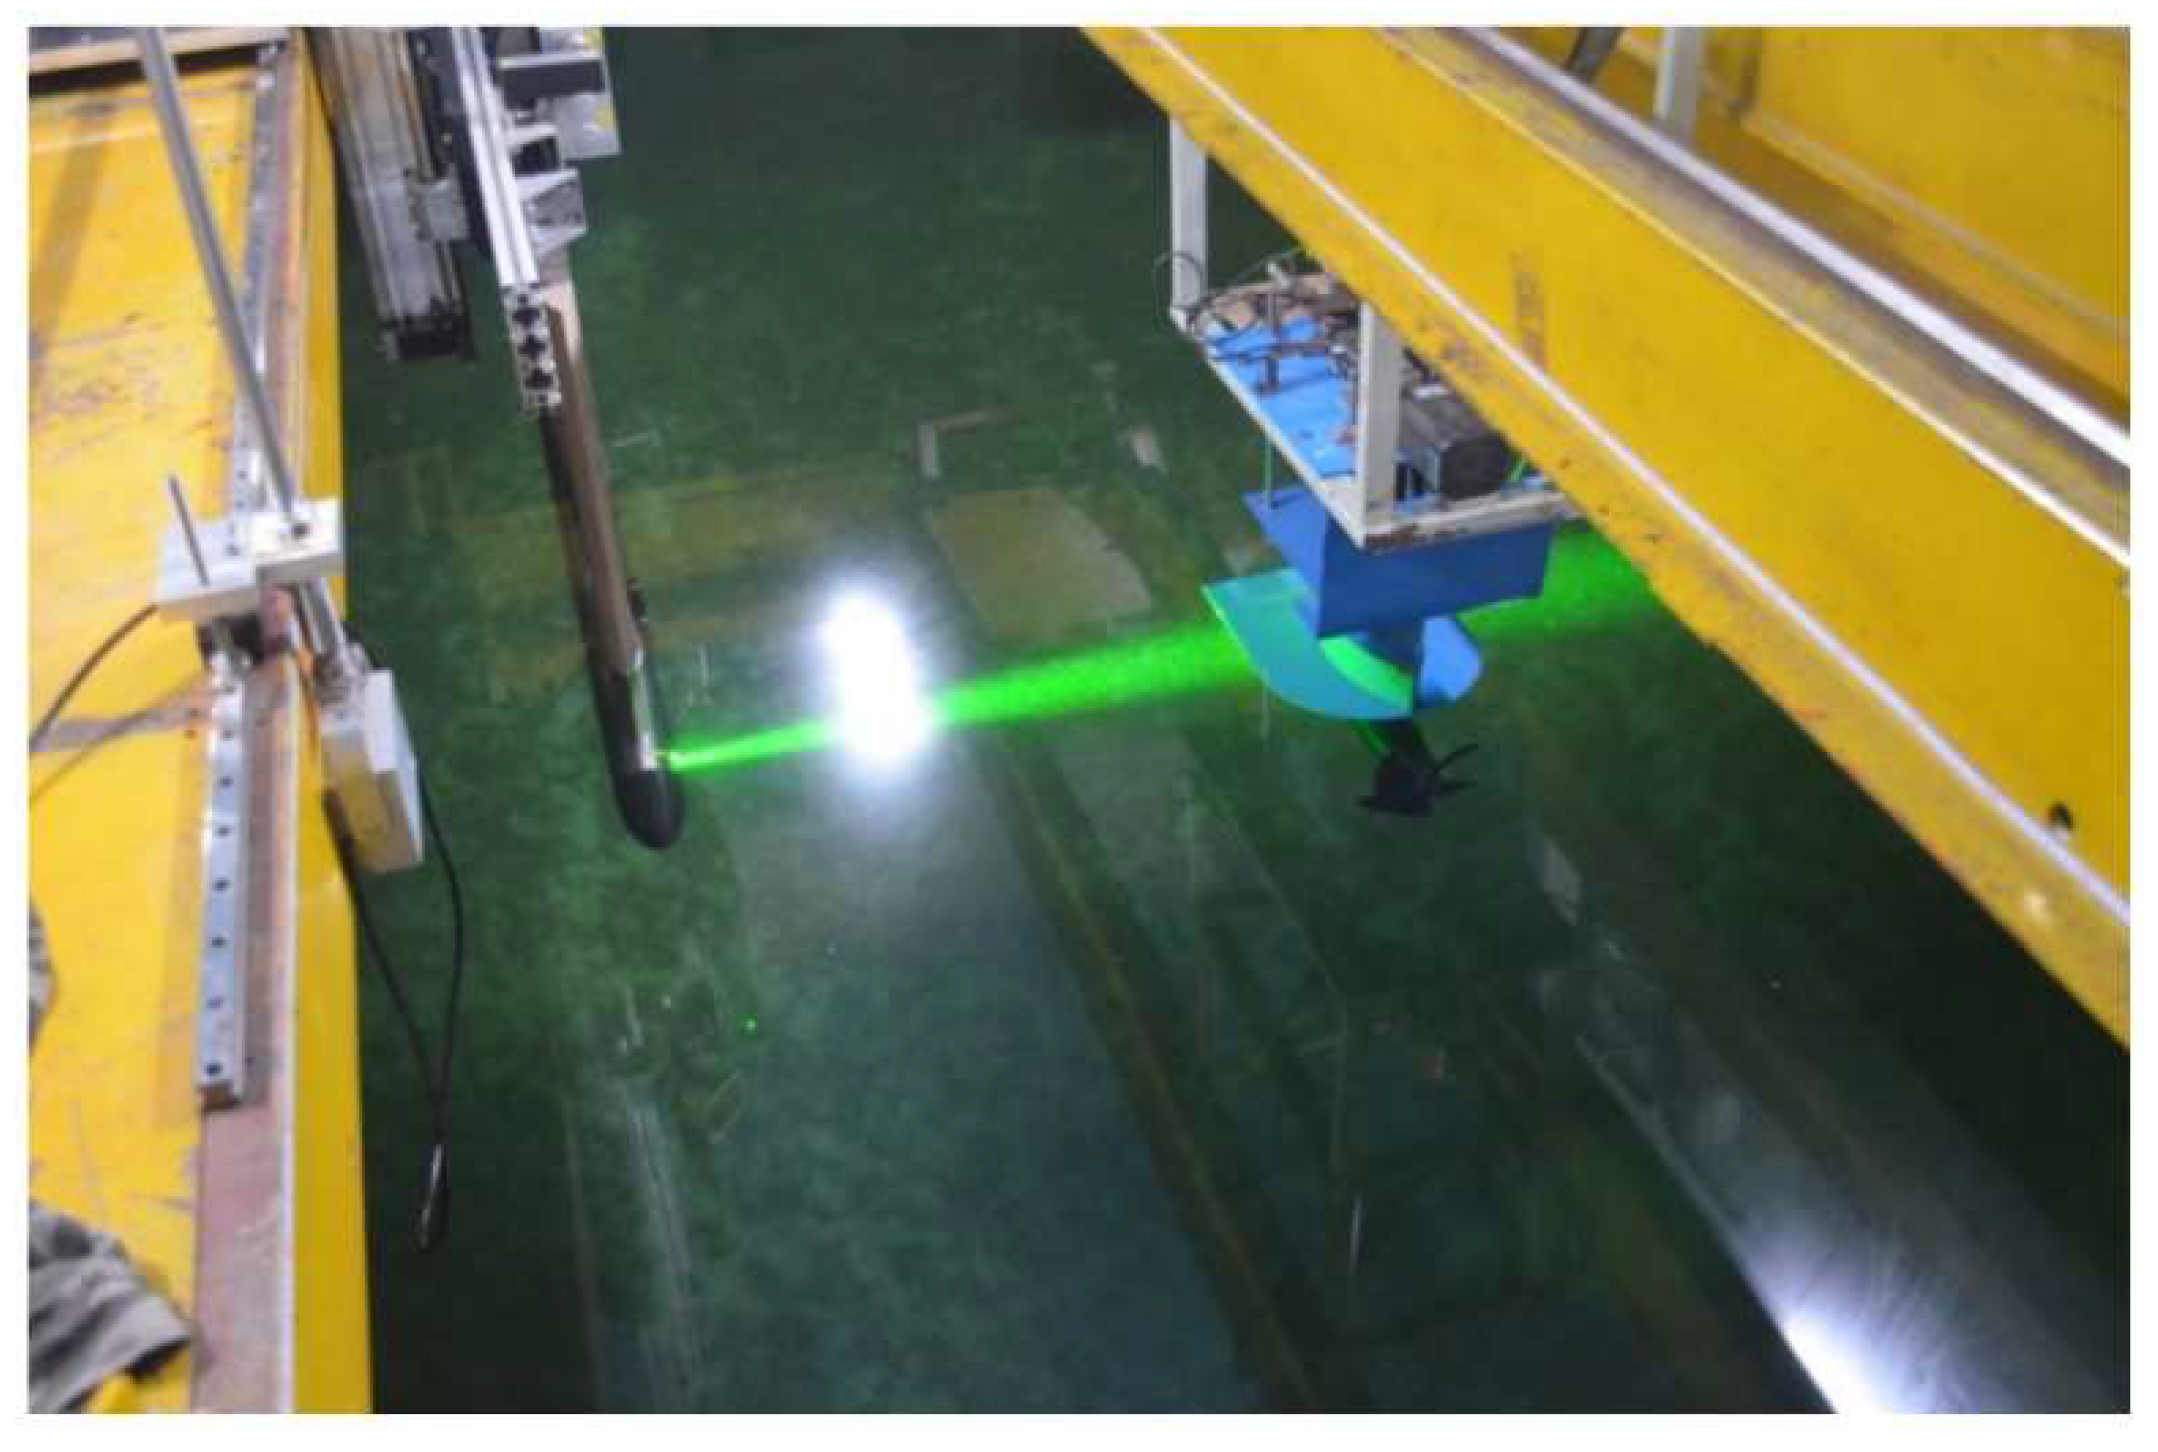
Before measuring the flow field of the L-type podded propeller, the position of the PIV system was adjusted, so that the laser could accurately irradiate the cross-sections that are to be measured. The speed of the carriage and rotating speed of the propeller were then adjusted. At a stable velocity, the two charge-coupled device cameras on the PIV system began to take pictures of the measured area and recorded displacement information for the tracer particles, as shown in Figure 4 and Figure 5. The PIV measurement system can measure the velocity components of tracer particles in X, Y, and Z directions. The axial direction in this paper is X direction, and it is also the forward direction of the pod propeller.
Particle image processing mainly includes two aspects: one is the pre-processing of particle image before calculation, which is generally used to remove the image information that has an impact on the processing results, such as background, bubbles, impurities, etc. in particle image, the other is the negative correlation analysis of two consecutive particle images, while using fast Fourier transform method to determine the particle speed and direction. In this study, PIVlab was the main software used to process PIV test images, which was an open source program in MATLAB.
The error sources in PIV flow field measurement mainly include two parts in this paper: One is the uncertainty source of PIV measurement system itself. These errors include calibration error, perspective error, and error due to the determination of correlation peak between the image pairs. These errors exist, even in the most ideal conditions, but they may vary according to specific optical configurations. The other is the source of uncertainty outside the PIV measurement system. It includes the precision of model manufacture, model installation, and speed, etc. The errors that are caused by test equipment debugging and parameter setting largely depend on the reliability of the test scheme and the professionalism of test personnel. Reasonable test scheme and correct operation rules can greatly reduce such errors. The uncertainty analysis in this paper is also the uncertainty of the PIV measurement system. The analysis method that is used in this paper can be referred to reference [18].
PIV analysis was conducted in batch processes while using Dantec DynamicStudio v6.0 software. The exact size of the effective observation window was approximately 320 mm × 280 mm (width × height). The velocity vectors were calculated using the adaptive correlation method with initial 128 × 128 pixel interrogation windows and final 32 × 32 pixel interrogation windows. An overlap of 50% among the neighboring interrogation windows is used during the correlation analysis process. Local neighborhood validation compares individual vectors to the local vectors in the neighborhood vector area (size 3 × 3), and any spurious vectors are removed and replaced by vectors that are calculated through the local interpolation of the vectors present in the area. Typically, the bad vectors were fewer than 2% before post-processing. The final spacing vector grid of one velocity vector in the time-averaged velocity map is 2.19 × 2.19 mm2. The acquisition frequency is 7.5 Hz and the separation time between two consecutive illuminations of the tracer particles was 400 μs.
The uncertainty analysis of PIV is mainly divided into two aspects: one is the measurement of the reference flow field to evaluate the accuracy of the measurement method; the other is repeated measurements under the same working condition to determine the mean square error of measurement. The detailed uncertainty analysis process can be referred to the author’s literature [16,17]. In the PIV measurement process in this paper, the number of instantaneous velocity samples that were collected for each towing is 250 and the corresponding measurement accuracy is 2.5%.
3. Results and Discussion
3.1. PIV Measurements in Straight Drive
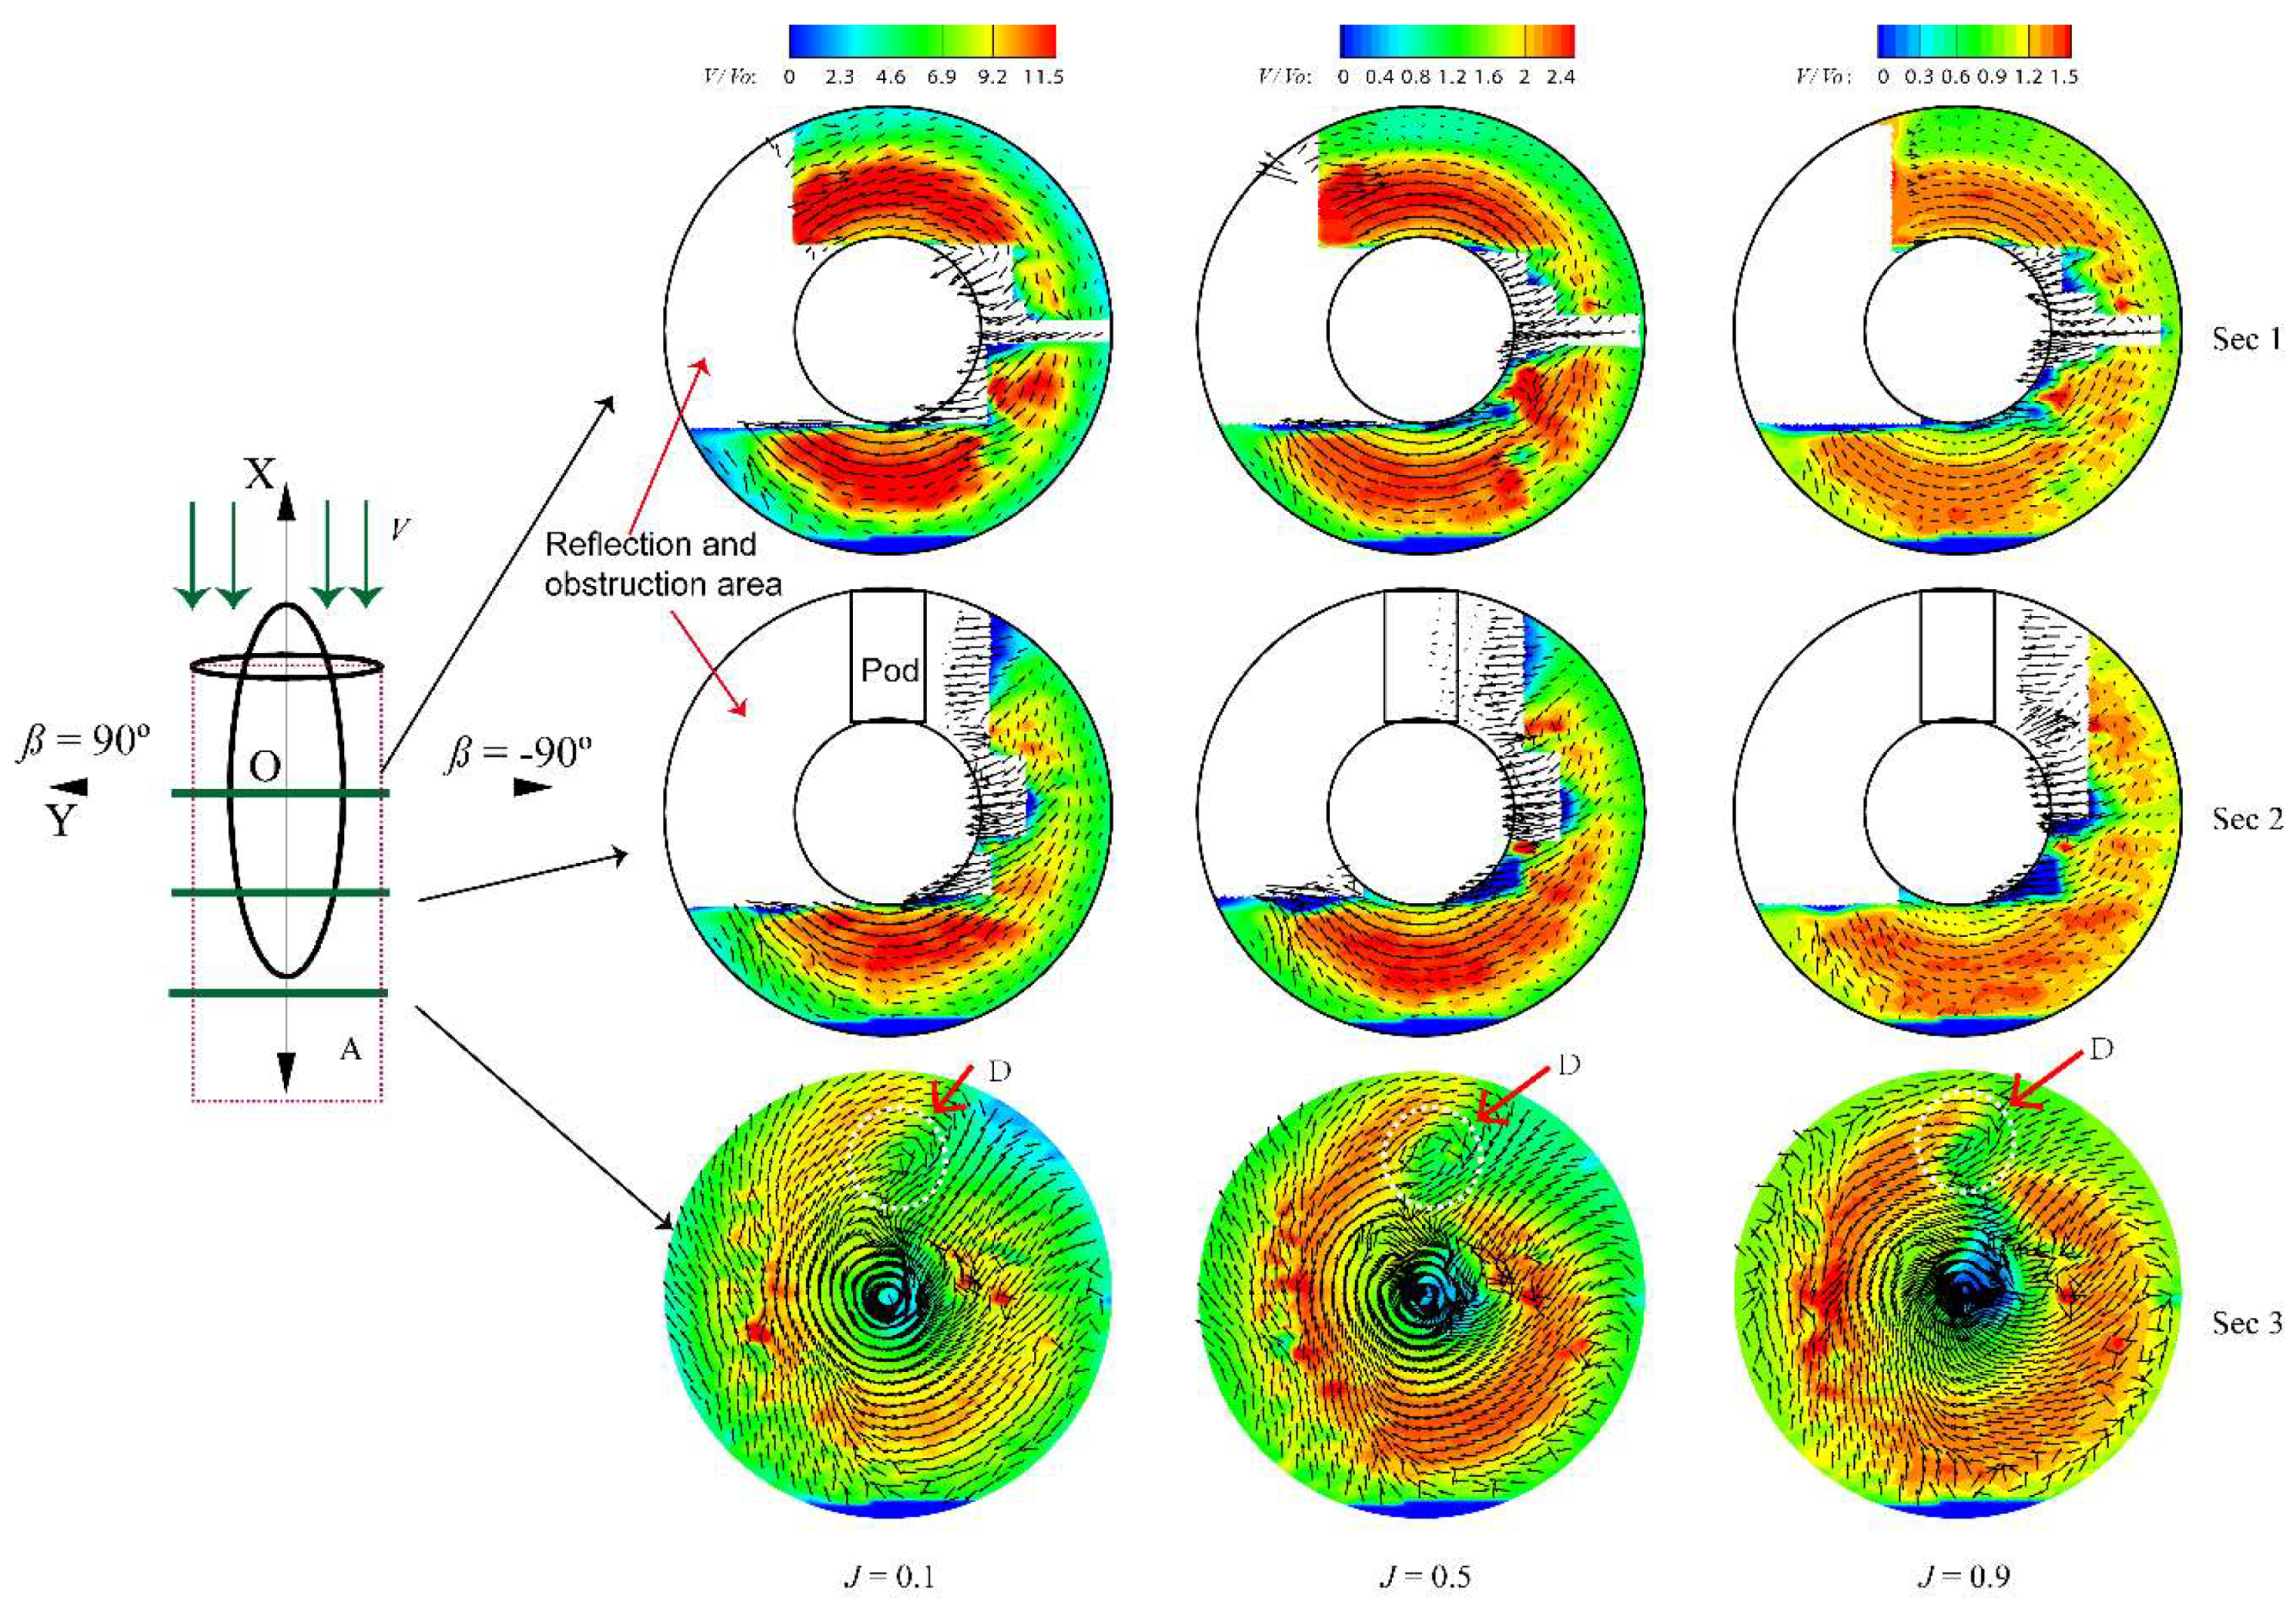
Figure 6 shows the distribution of the axial velocity vectors for the L-type podded propulsor with different cross-sections and advance coefficients. Owing to the reflection and obstruction of the pod by the laser, there were several velocity-free areas in the measured image, which are marked in Figure 6. Here, is the advance coefficient of the propeller and is the deflection angle of the podded propulsor. The measurement results were made dimensionless by calculating the ratio, where is the axial velocity of the cross-section and is the inflow velocity. Label A is the disturbance area of the propeller rotation. Sec 1 and Sec 2 show that the propeller rotation disturbance area coincides with the incoming flow disturbance area. The propeller was in a heavy load state when the advance coefficient was low (i.e., = 0.1), which yielded a large difference between the rotating wake velocity of the propeller and the external inflow velocity. In the propeller disk projection area, was approximately 11, while it was approximately 5 at the propeller disk boundary. When was 0.5, the propeller was in a medium load state, which yielded a large velocity difference between the rotating wake velocity of the propeller and the external inflow velocity. In this state, was approximately 2.4 in the propeller disk projection area and approximately 1 at the propeller disk boundary. The propeller was in a light load state when was 0.9, which yielded a small difference between the rotating wake velocity of the propeller and the external inflow velocity. was approximately 1.5 in the propeller disk projection area, while it was approximately 0.7 at the propeller disk boundary. The differences in wake velocity for the propeller under the different advance coefficients above indicate the interaction intensity between the propeller and inflow, which is consistent with the propeller load state. Based on Figure 5, the core area rotation speed is higher than that of the external area of the propeller.
The velocity vector distribution of Sec 3 shows that clear asymmetry at the measured position at the end of the pod characterized the wake flow. Owing to pod disturbance in the Y direction, the right side of the pod had an obvious velocity disturbance area and the weakening area had a noticeable recirculation vortex area, as shown by Label D in Figure 6. The asymmetric propeller wake will cause lateral force in the podded propulsor.
3.2. PIV Measurements in −30° Oblique Drive
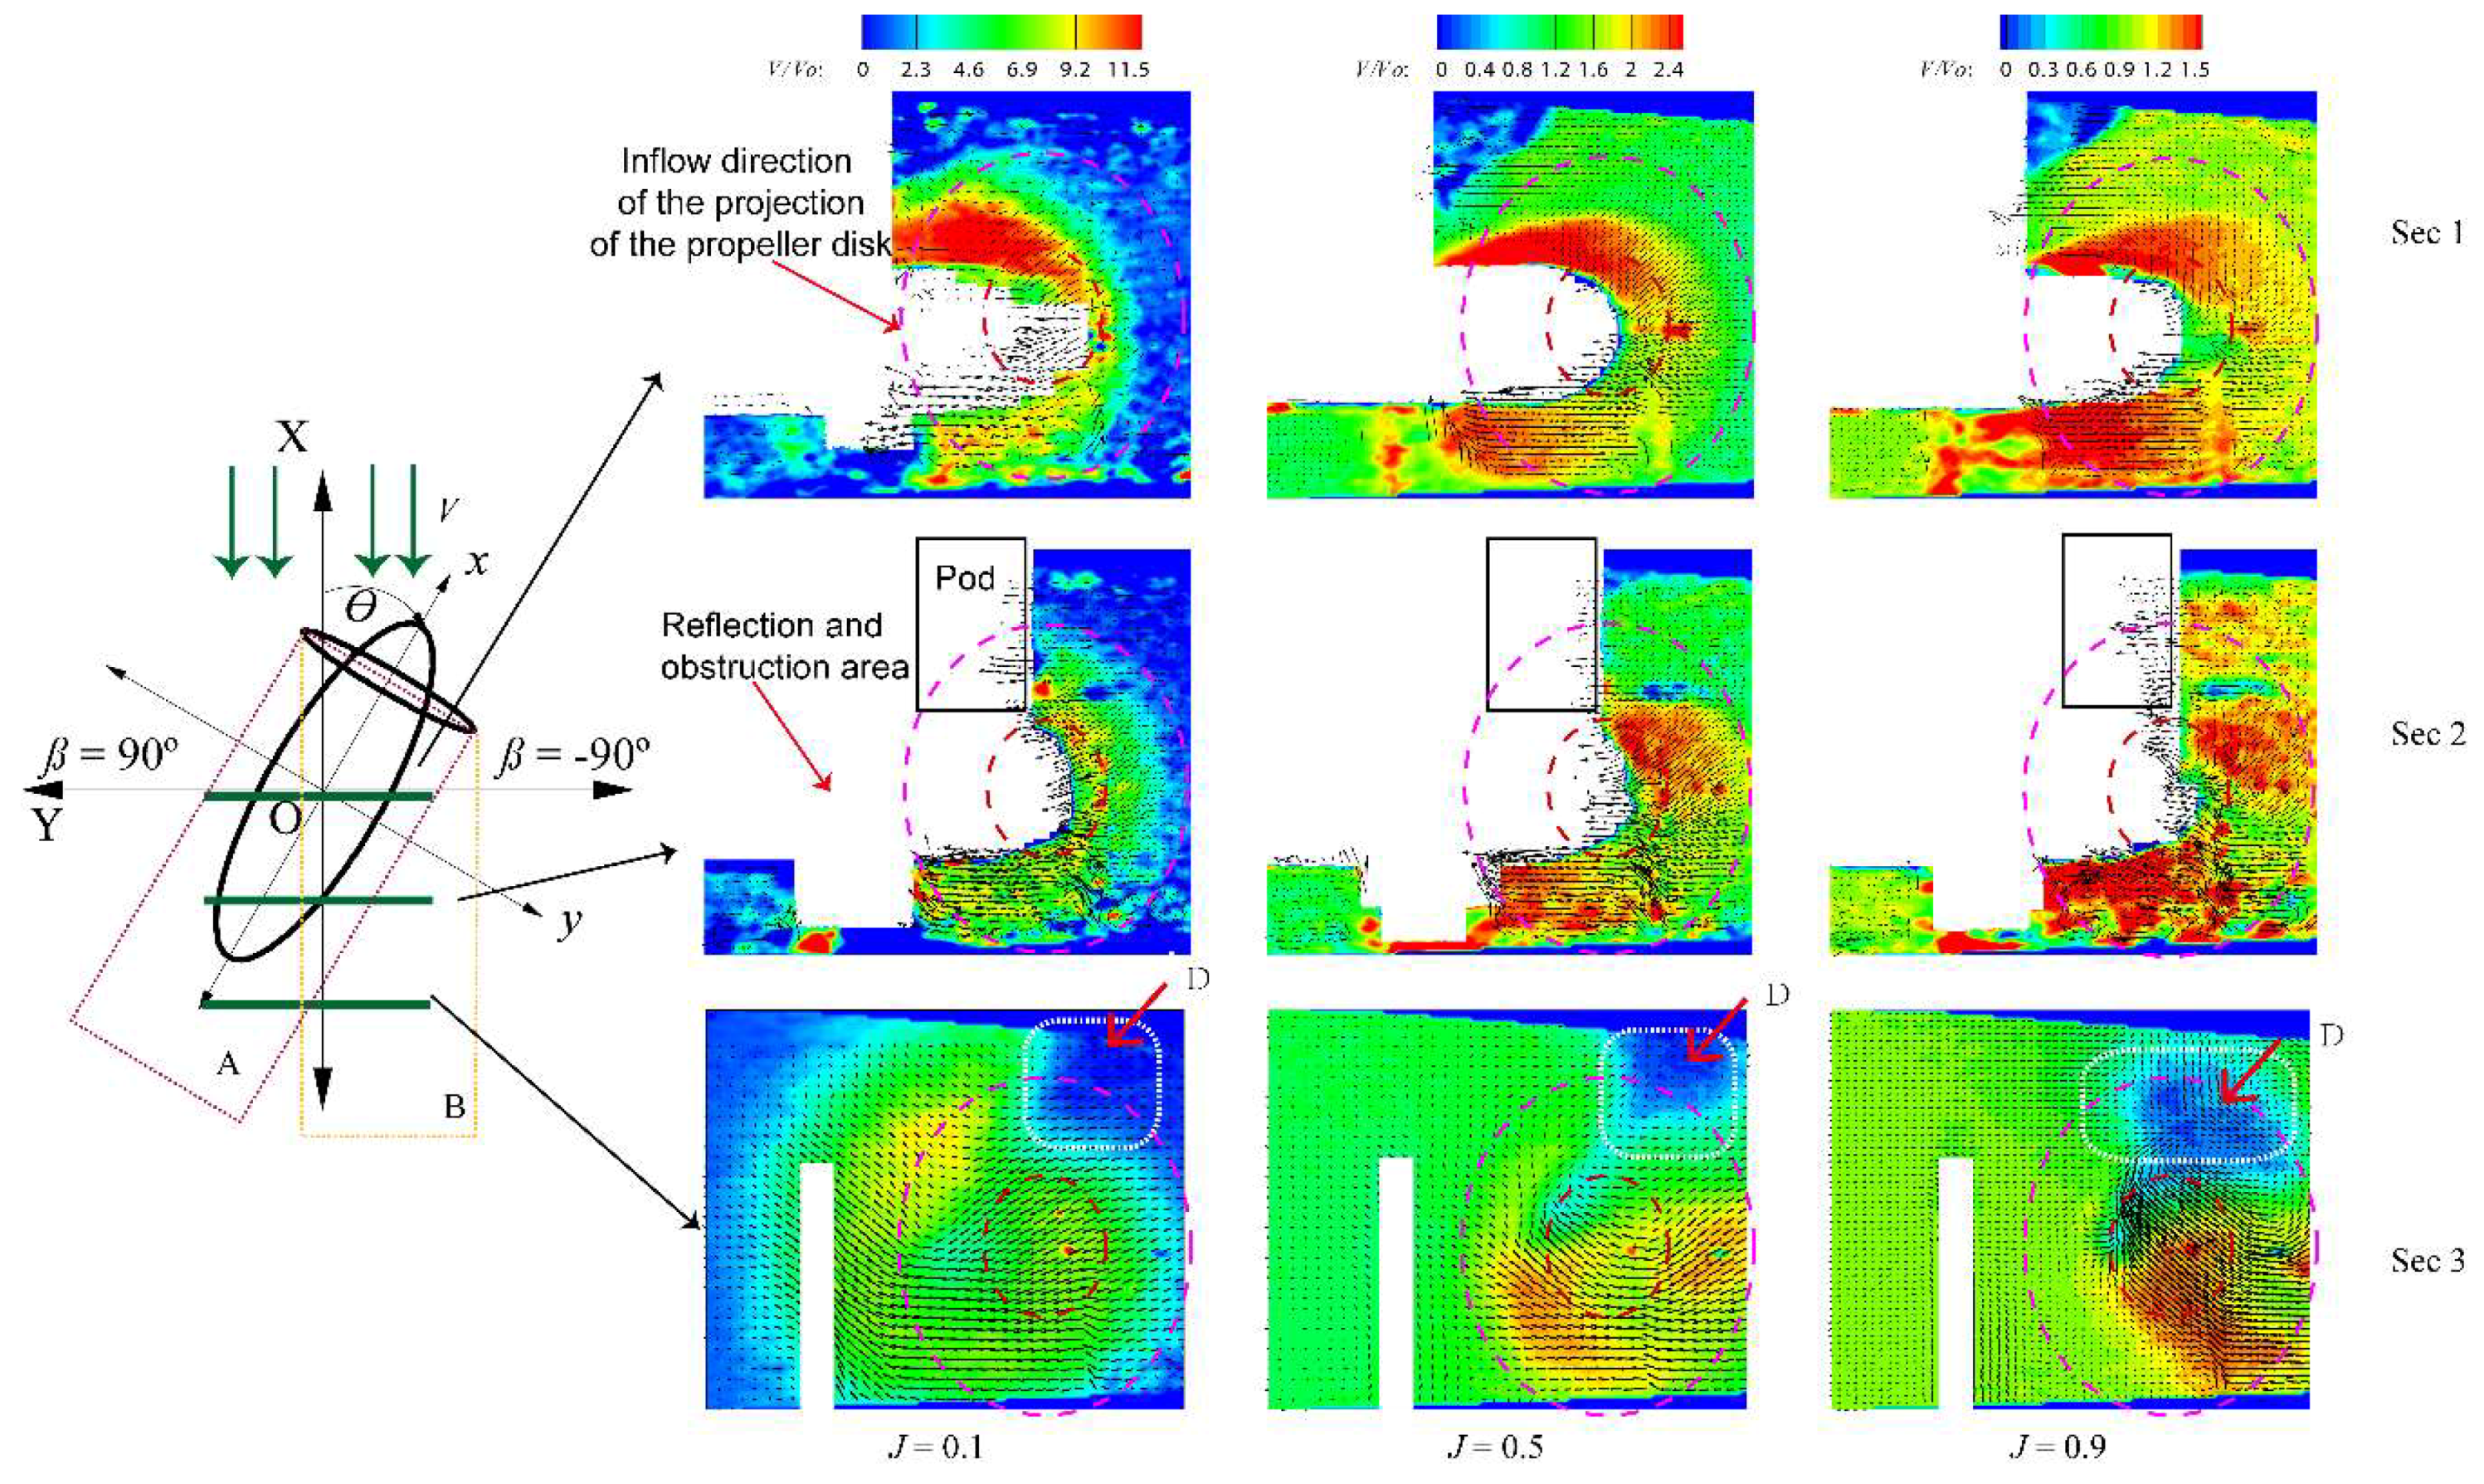
Figure 7 shows the axial velocity vector distribution for the L-type podded propulsor under different advance coefficients ( = 0.1, 0.5, and 0.9) in −30° oblique drive. Label A is the propeller rotation disturbance area and Label B is the inflow disturbance area.
When the advance coefficient was low (i.e., = 0.1), the flow field in the propeller disk projection area was strongly affected by the propeller rotation and was less disturbed by the incoming flow. There was a large difference between the rotating wake velocity of the propeller and the external inflow velocity. was approximately 11 in the propeller disk projection area, while it was approximately 5 at the propeller disk boundary. When was 0.5, the propeller rotation disturbance effect was weaker than that when was 0.1. The influence of the inflow on the flow field in the propeller disk projection area became stronger. The propeller wake field appeared to drift to the lower left, and the drift angle was determined by the interaction between the propeller-induced wake flow and inflow. There was a large velocity difference between the rotating wake velocity of the propeller and the external inflow velocity. At this time, was approximately 2.4 in the propeller disk projection area and was approximately 1 at the propeller disk boundary. When was 0.9, the propeller was in a light load state. When compared with = 0.1 and 0.5, the propeller rotation disturbance effect was the weakest when J was 0.9, while the influence of inflow on the flow field in the propeller disk projection area became the strongest. The propeller wake field also appeared to drift to the lower left, but the drift angle was smaller than that when was 0.5. There was a small difference between the rotating wake velocity of the propeller and the external inflow velocity. In the propeller disk projection area, was approximately 1.5, while it was approximately 0.9 at the propeller disk boundary.
As Sec 2 was farther from the propeller than Sec 1, i.e., when the advance coefficient was small ( = 0.1), the flow field at Sec 2 was less affected by the propeller rotation than that at Sec 1, while the influence of the inflow on the flow field in the propeller disk projection area was weaker. There was a small difference between the rotating wake velocity of the propeller and the external inflow velocity. was approximately 9 in the propeller disk projection area, while it was approximately 5 at the propeller disk boundary. When was 0.5, the propeller rotation disturbance effect was weaker than that when was 0.1. The influence of the inflow on the flow field in the propeller disk projection area became stronger. The propeller wake field appeared to drift to the right. The velocity difference between the rotating wake velocity of the propeller and the external inflow velocity became smaller. In this scenario, was approximately 2.4 in the propeller disk projection area and was approximately 2 at the propeller disk boundary. When was 0.9, the propeller was in a light load state. When compared with = 0.1 and 0.5, the propeller rotation disturbance effect was the weakest when J was 0.9, while the influence of inflow on the flow field in the propeller disk projection area became the strongest. The propeller wake field also appeared to drift to the right. There was a small difference between the rotating wake velocity of the propeller and the external inflow velocity. was approximately 1.5 in the propeller disk projection area, while it was approximately 1.2 at the propeller disk boundary. The reason for the phenomenon described above was that the influences of the propeller rotating wake and inflow produced a wake deflection angle, which was tantamount to the oblique drive angle. In different working conditions, the corresponding wake flow area showed different interference effects. The data from Section 3 illustrated that, when the propeller was in a heavy load state at = 0.1, the podded propulsor wake flow behaved mainly as a rotating wake flow with less of an influence from the inflow. The measured results had a velocity vector distribution that was similar to that in straight drive conditions. The bracket interfered with the velocity vector distribution and drifted to the lower left. When was 0.5, the propeller was in a medium load state. The propeller wake flow was subjected to a joint effect from the rotary wake flow and inflow, in which the interference from the inflow was dominant. The measurement results were significantly different from those that were obtained in straight drive conditions. The velocity on the right side decreases noticeably, owing to pod interference in the Y direction, and there is an obvious circumfluence vortex in the weakened area, as shown by Label D in Figure 6. When was 0.9, the propeller was in a heavy load state. The interference effect from the inflow was much stronger, which yielded an area of weakening velocity and a more erratic recirculating vortex.
3.3. PIV Measurements at Identical Rudder Angles and Different Oblique Drive Directions
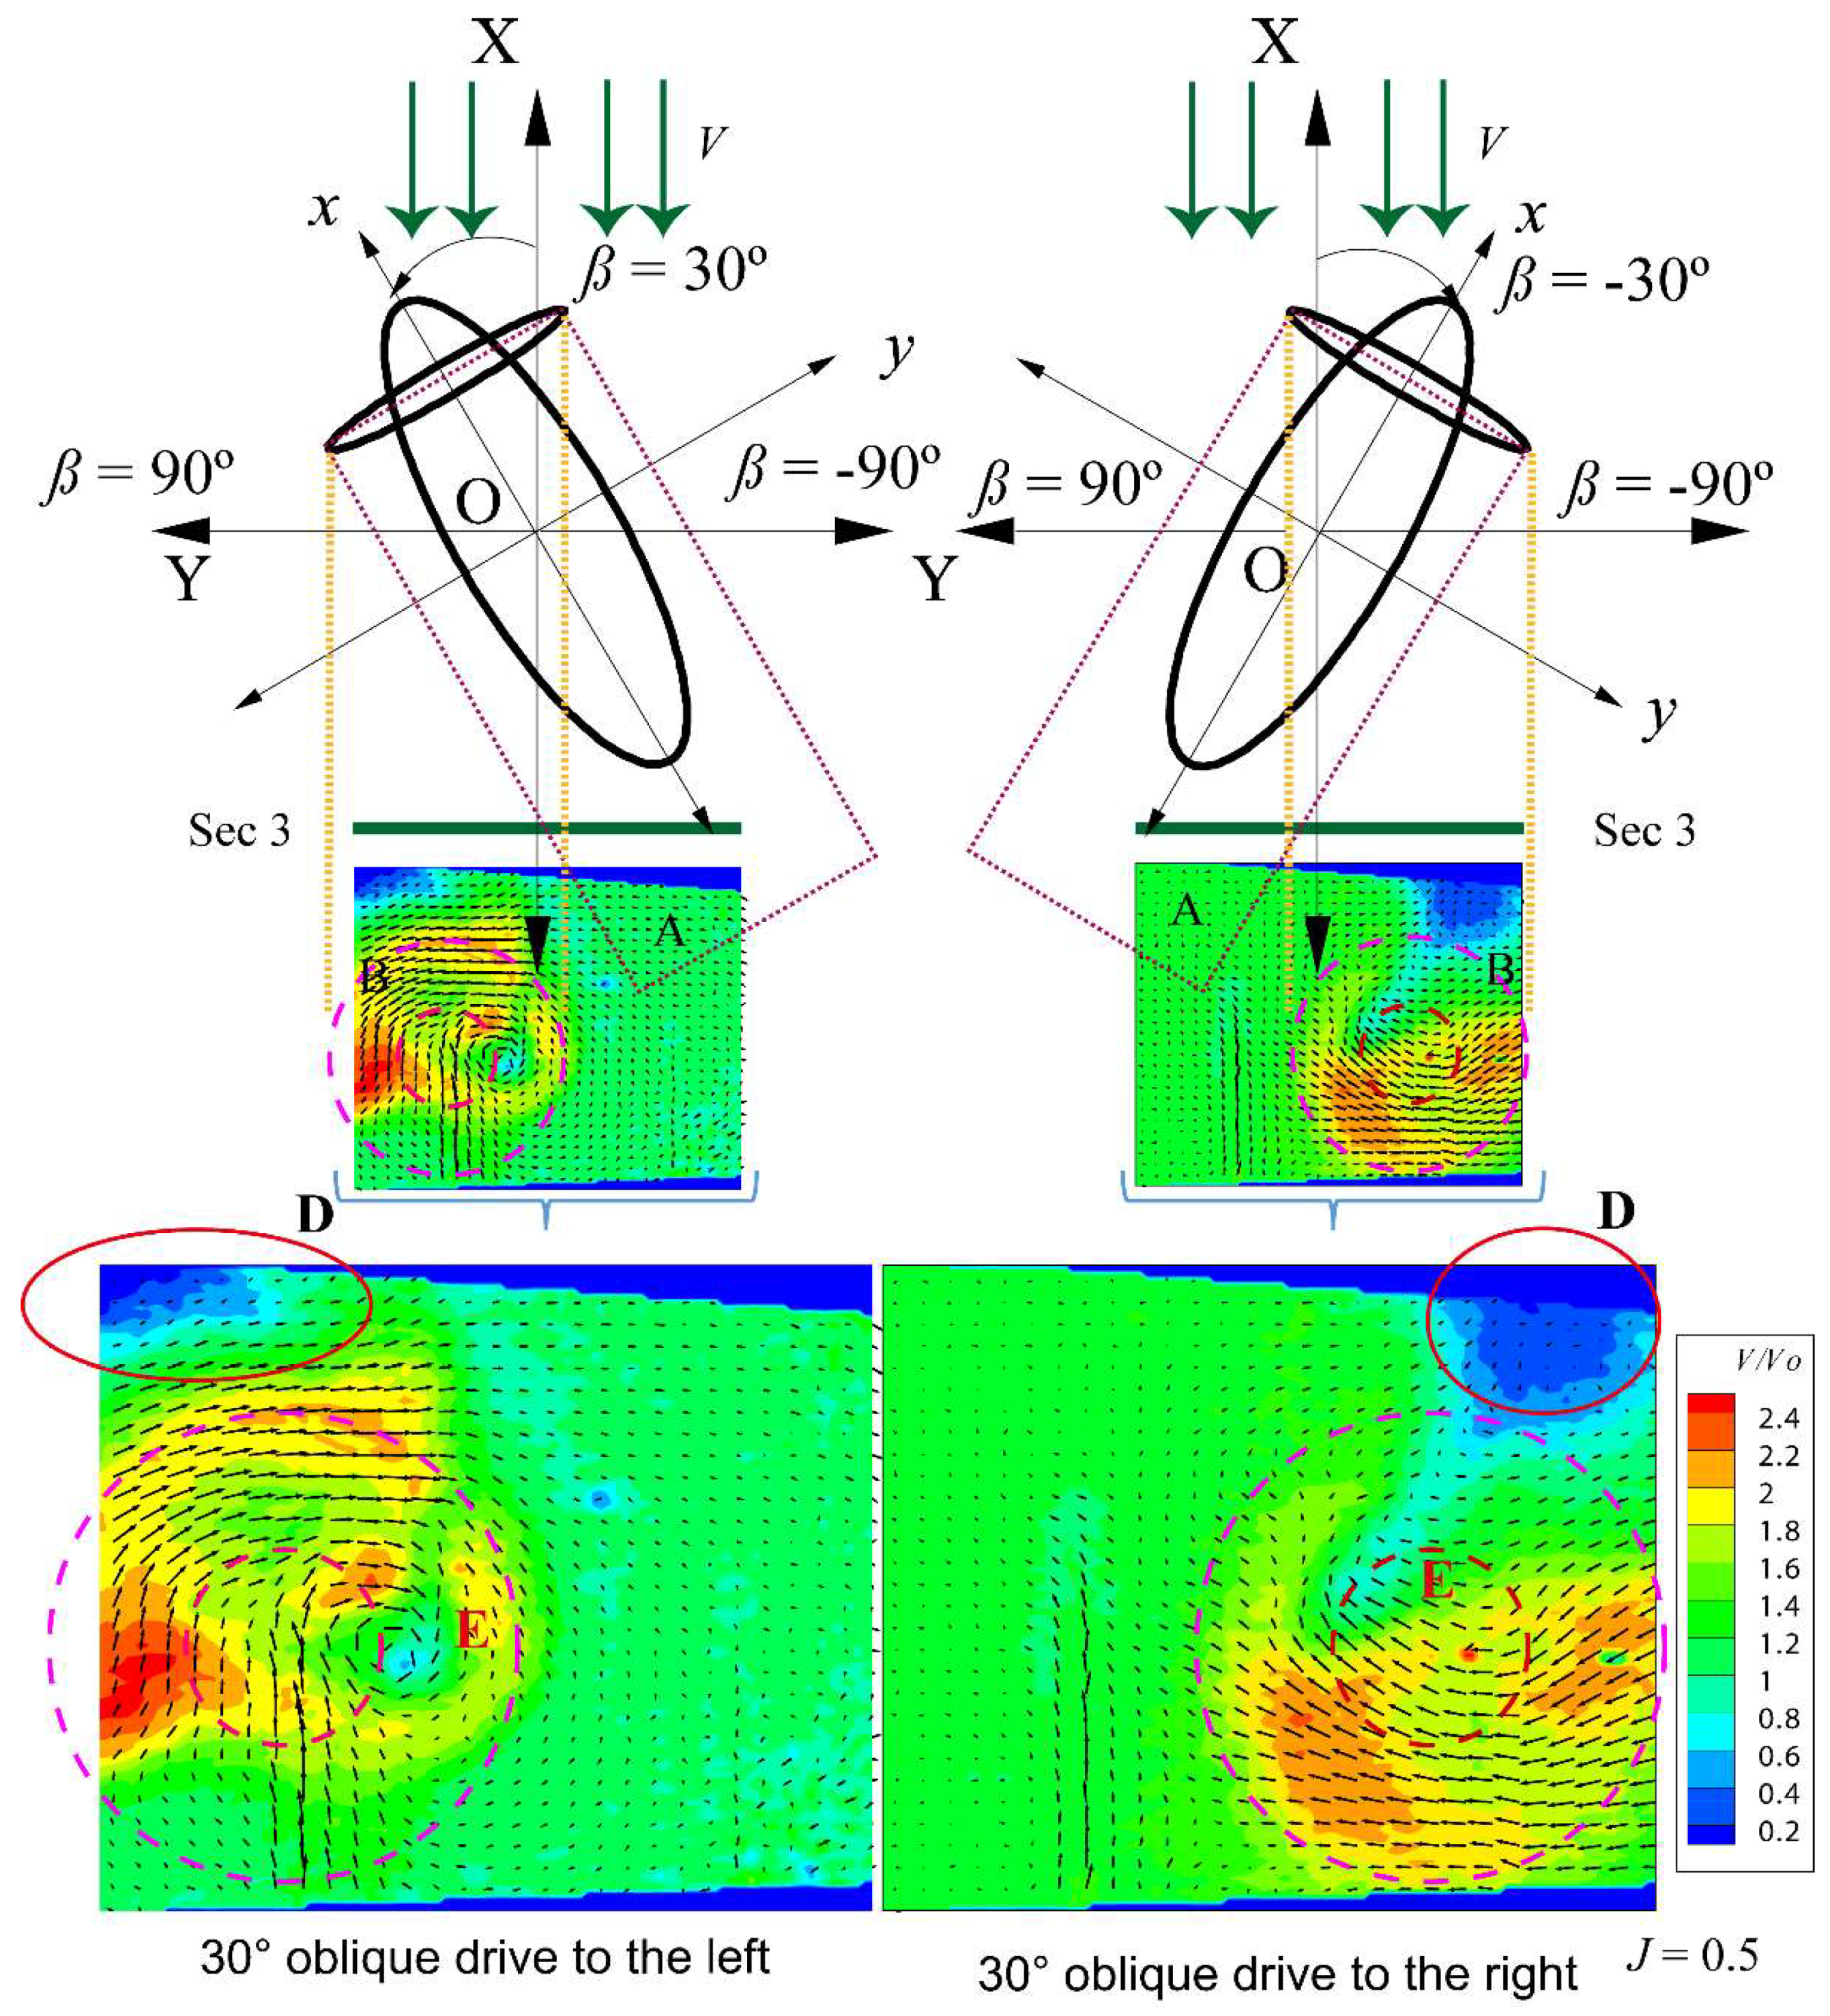
Figure 8 shows the axial velocity vector distribution at Sec 3 for the L-type podded propulsor when was 0.5 and was ±30°. In the 30° oblique drive working condition, the inflow wake flowed from the right to left side of the pod. The direction of the propeller rotating wake velocity perturbation was identical to that of the inflow, because the propeller was right-handed. The superposition of the two disturbances yielded clearly observable wake vortices in the measurement area, as shown by Label E in Figure 8. In this scenario, owing to the effects of the propeller rotation and inflow, the pod wake moved upward, which weakened the disturbance effect that the pod had on the wake velocity. In the −30° oblique drive working condition, the inflow wake flowed from the left to the right side of the pod. The direction of the wake velocity perturbation due to the propeller rotation was opposite to that of the inflow because the propeller was right-handed, which caused a mutually destructive interference effect and resulted in faster dissipation of the wake vortex in the measurement area. The axial velocity vector diagram illustrates that the drift location of the propeller rotating wake flow was basically identical to the axial projection of the propeller disk. At this time, the pod wake moved downward, which weakened the disturbance effect of the pod on the wake velocity. The wake velocity disturbances by the pod were weaker than those that were in the 30° oblique drive state.
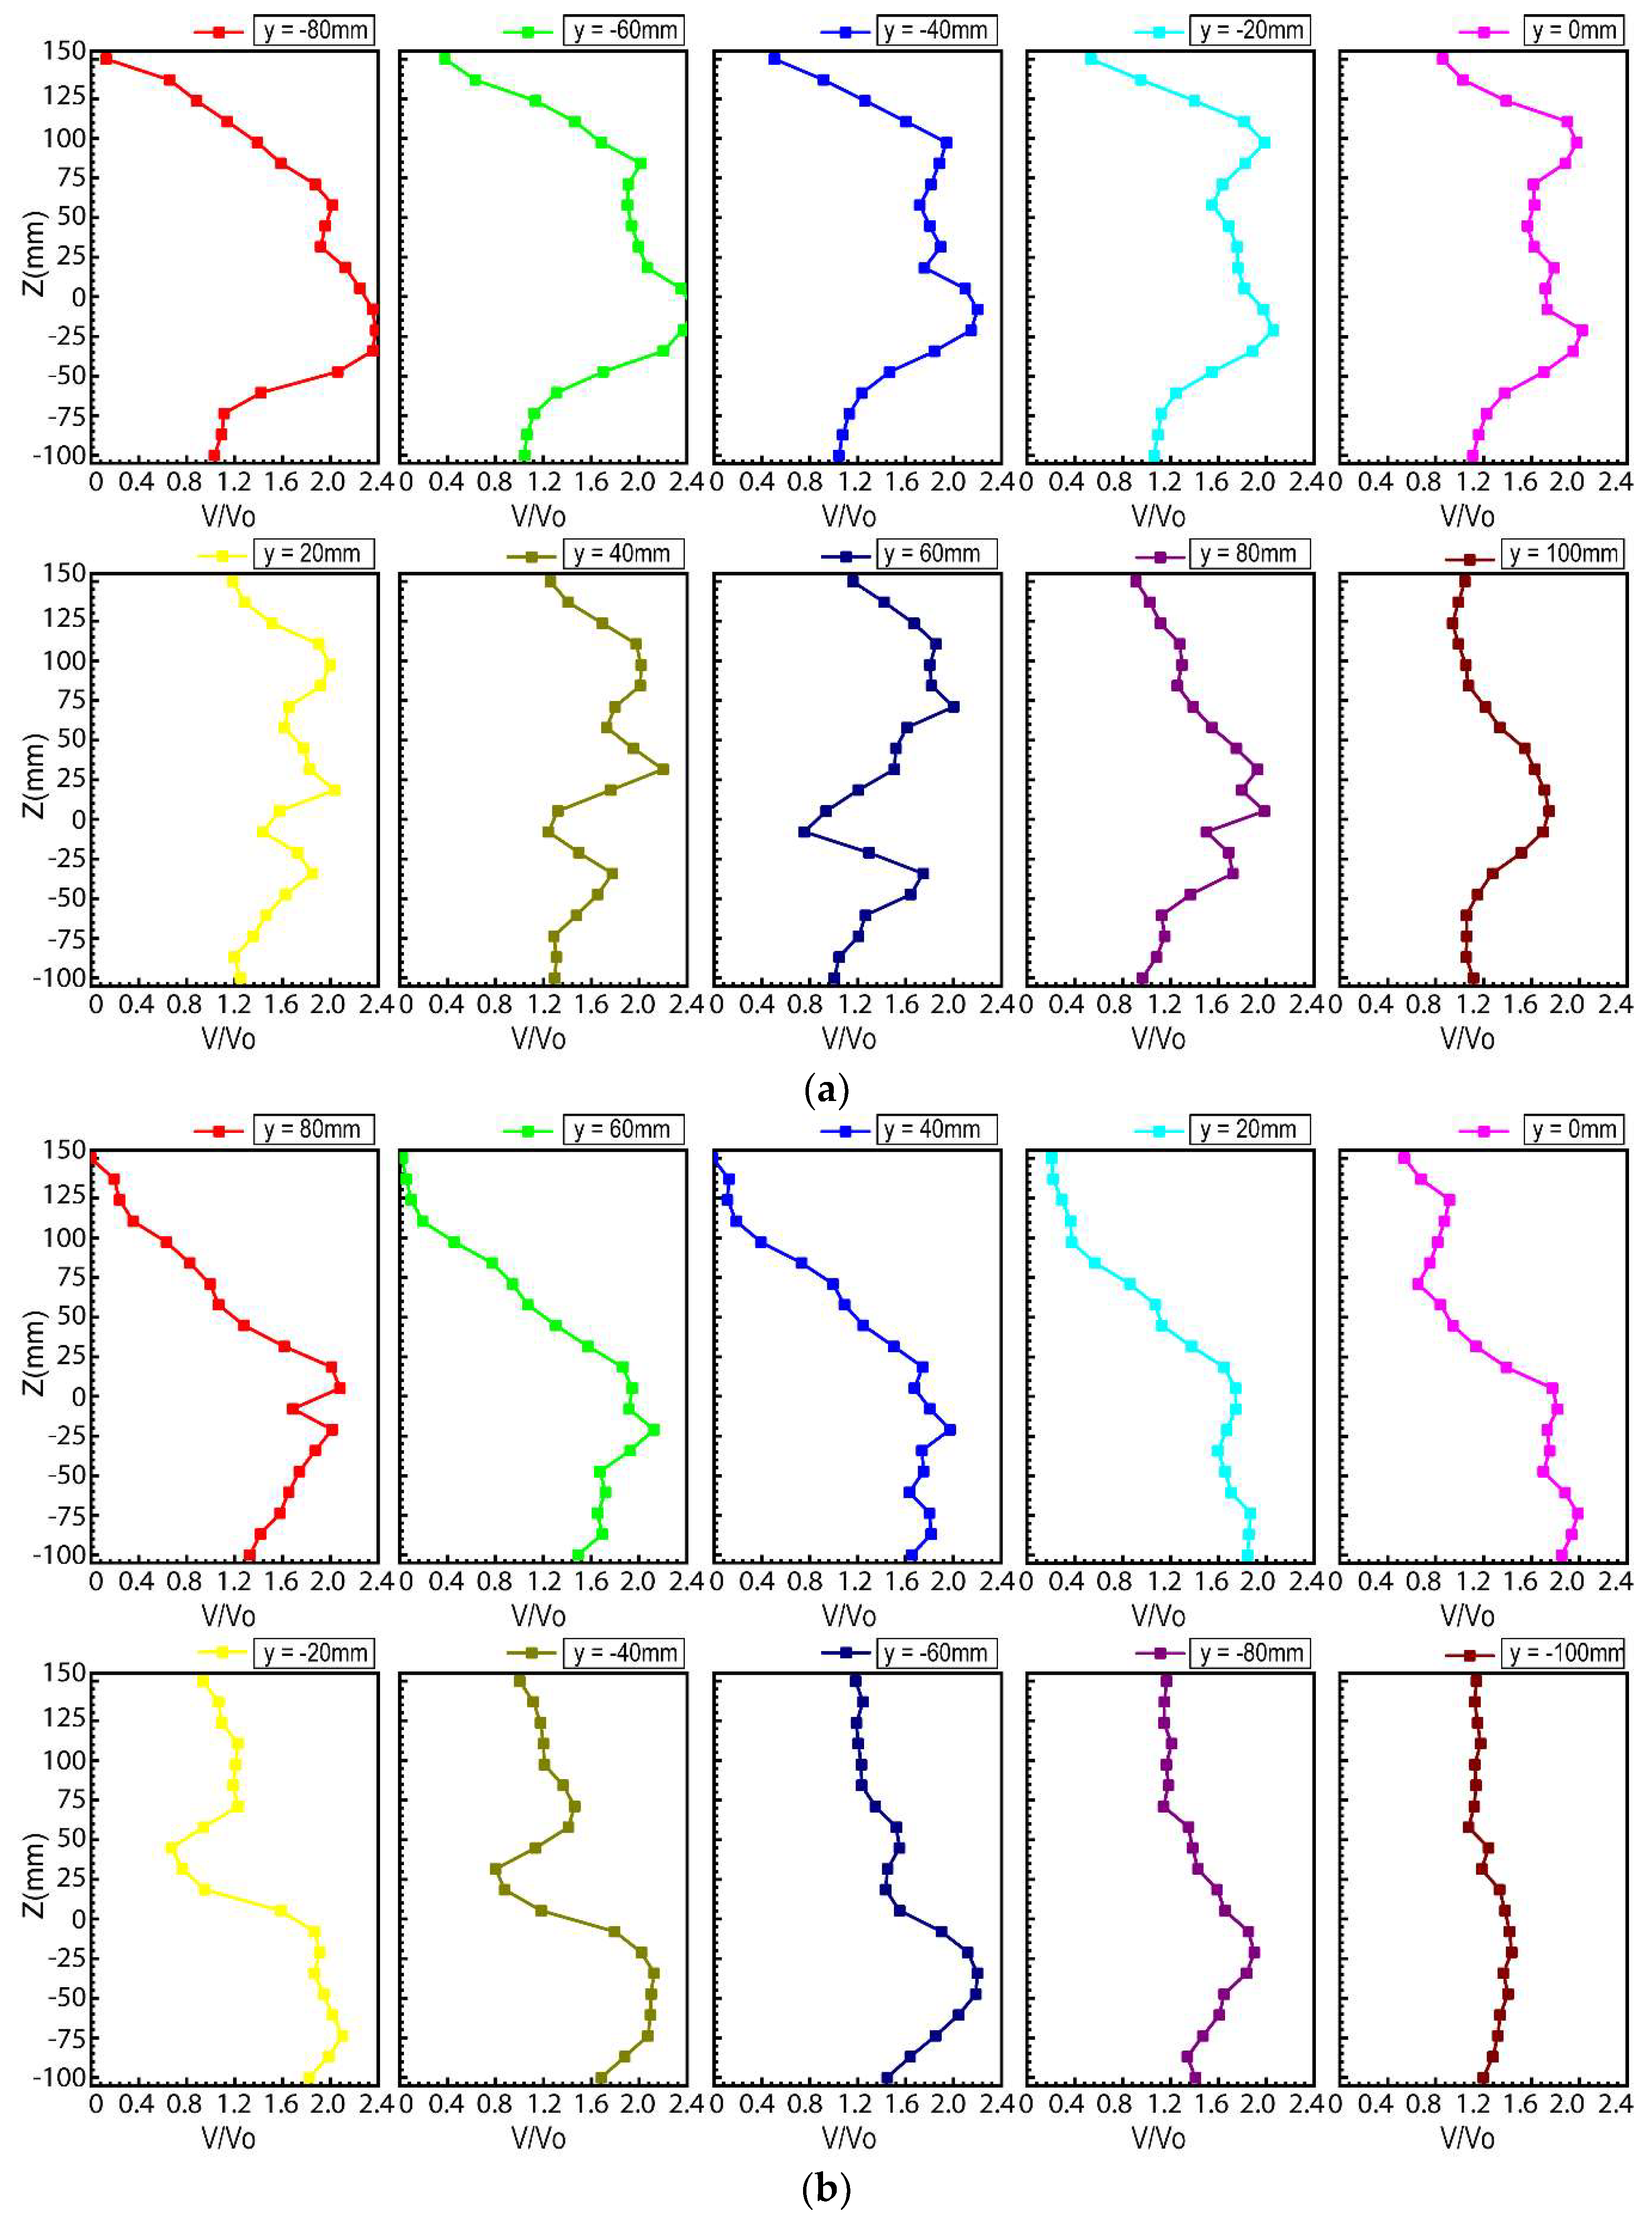
Figure 9 is a quantitative comparative analysis diagram of Figure 8. It is a dimensionless axial velocity distribution curve at different longitudinal tangents under the ±30° oblique drive conditions. The coordinate value (y, z) = (0, 0) is the projection position of the center of the propeller disk in the measured cross section. The +30° oblique drive state has a larger low-speed area that is disturbed by the pod than −30°.
In the −30° oblique drive state, the area with y = −80–0 and z = 100–150 is the low-speed zone. The curves show a bimodal distribution in the area with y = −80–0, and the upper region of the propeller disk has a high-speed region, which corresponds to Figure 8. While in the +30° oblique drive state, the area with y = 0–80 and z = 50–150 is the low-speed zone. The curves show a bimodal distribution in the area with y = 0–80 and there is a high-speed area in the lower part of the propeller disk. Figure 9b shows a significant peak distribution in the y = −100–0 and z = −100–0 regions.
3.4. PIV Measurements at Different Rudder Angles and Identical Advance Coefficients
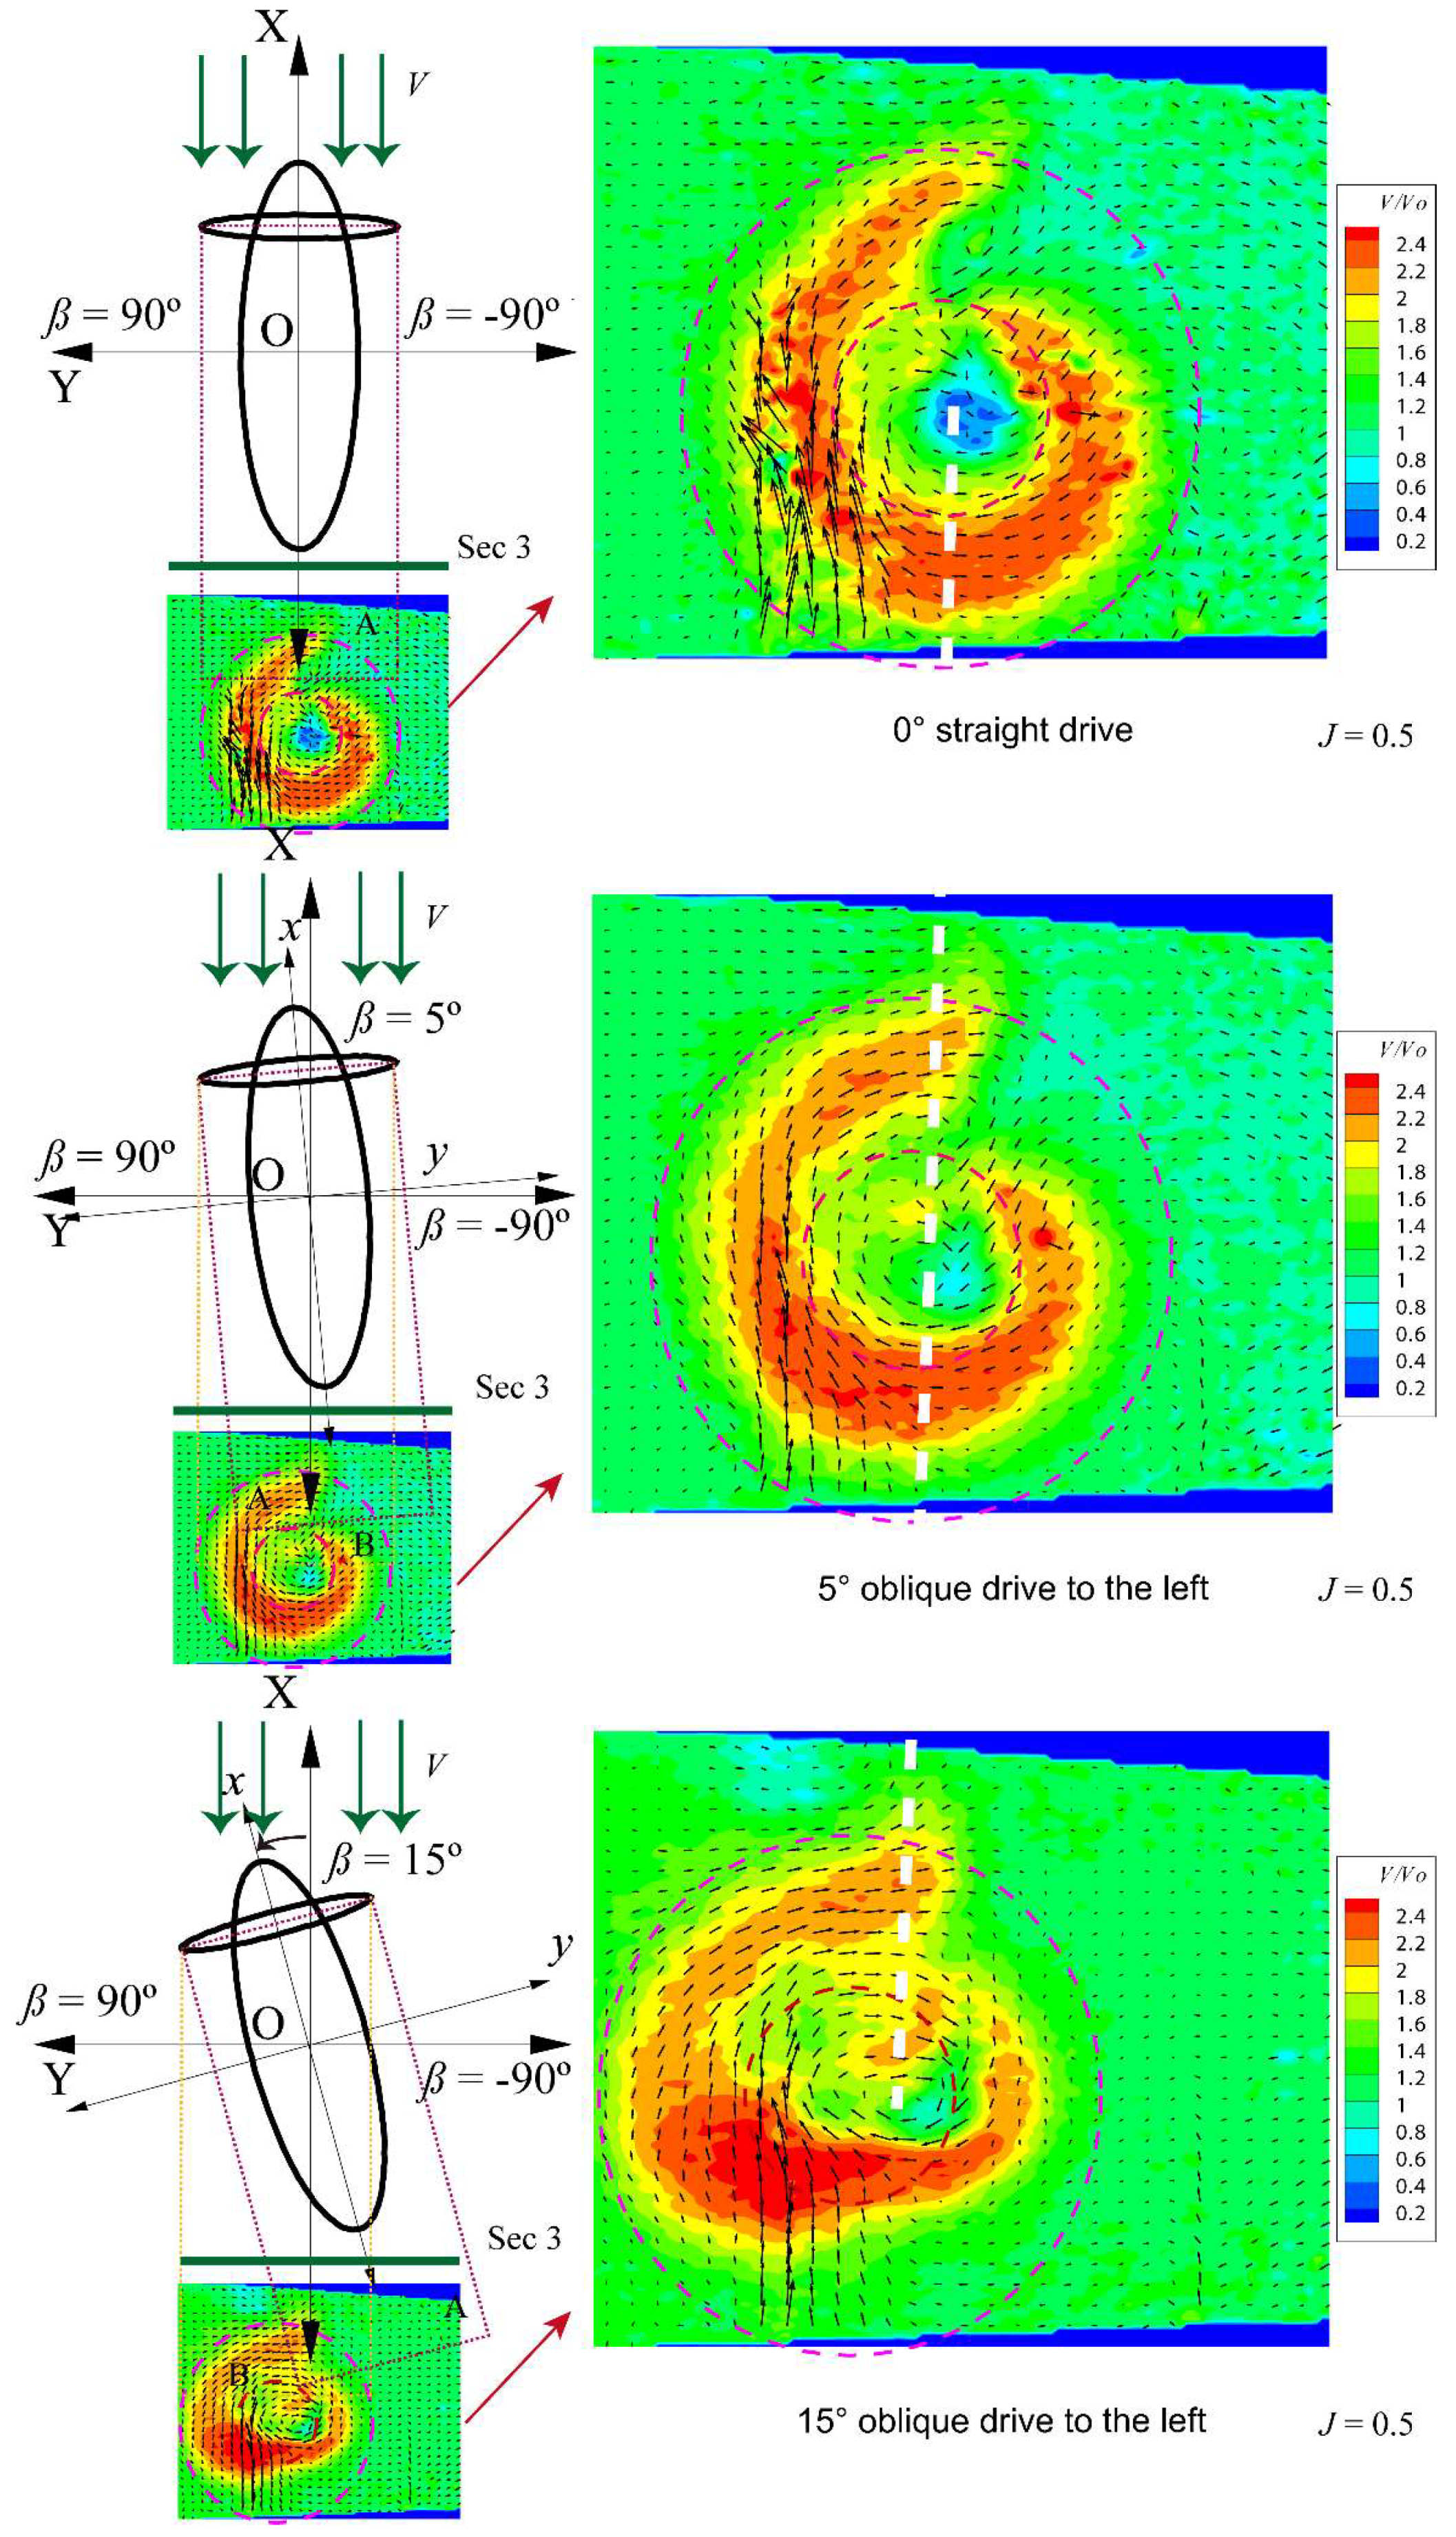
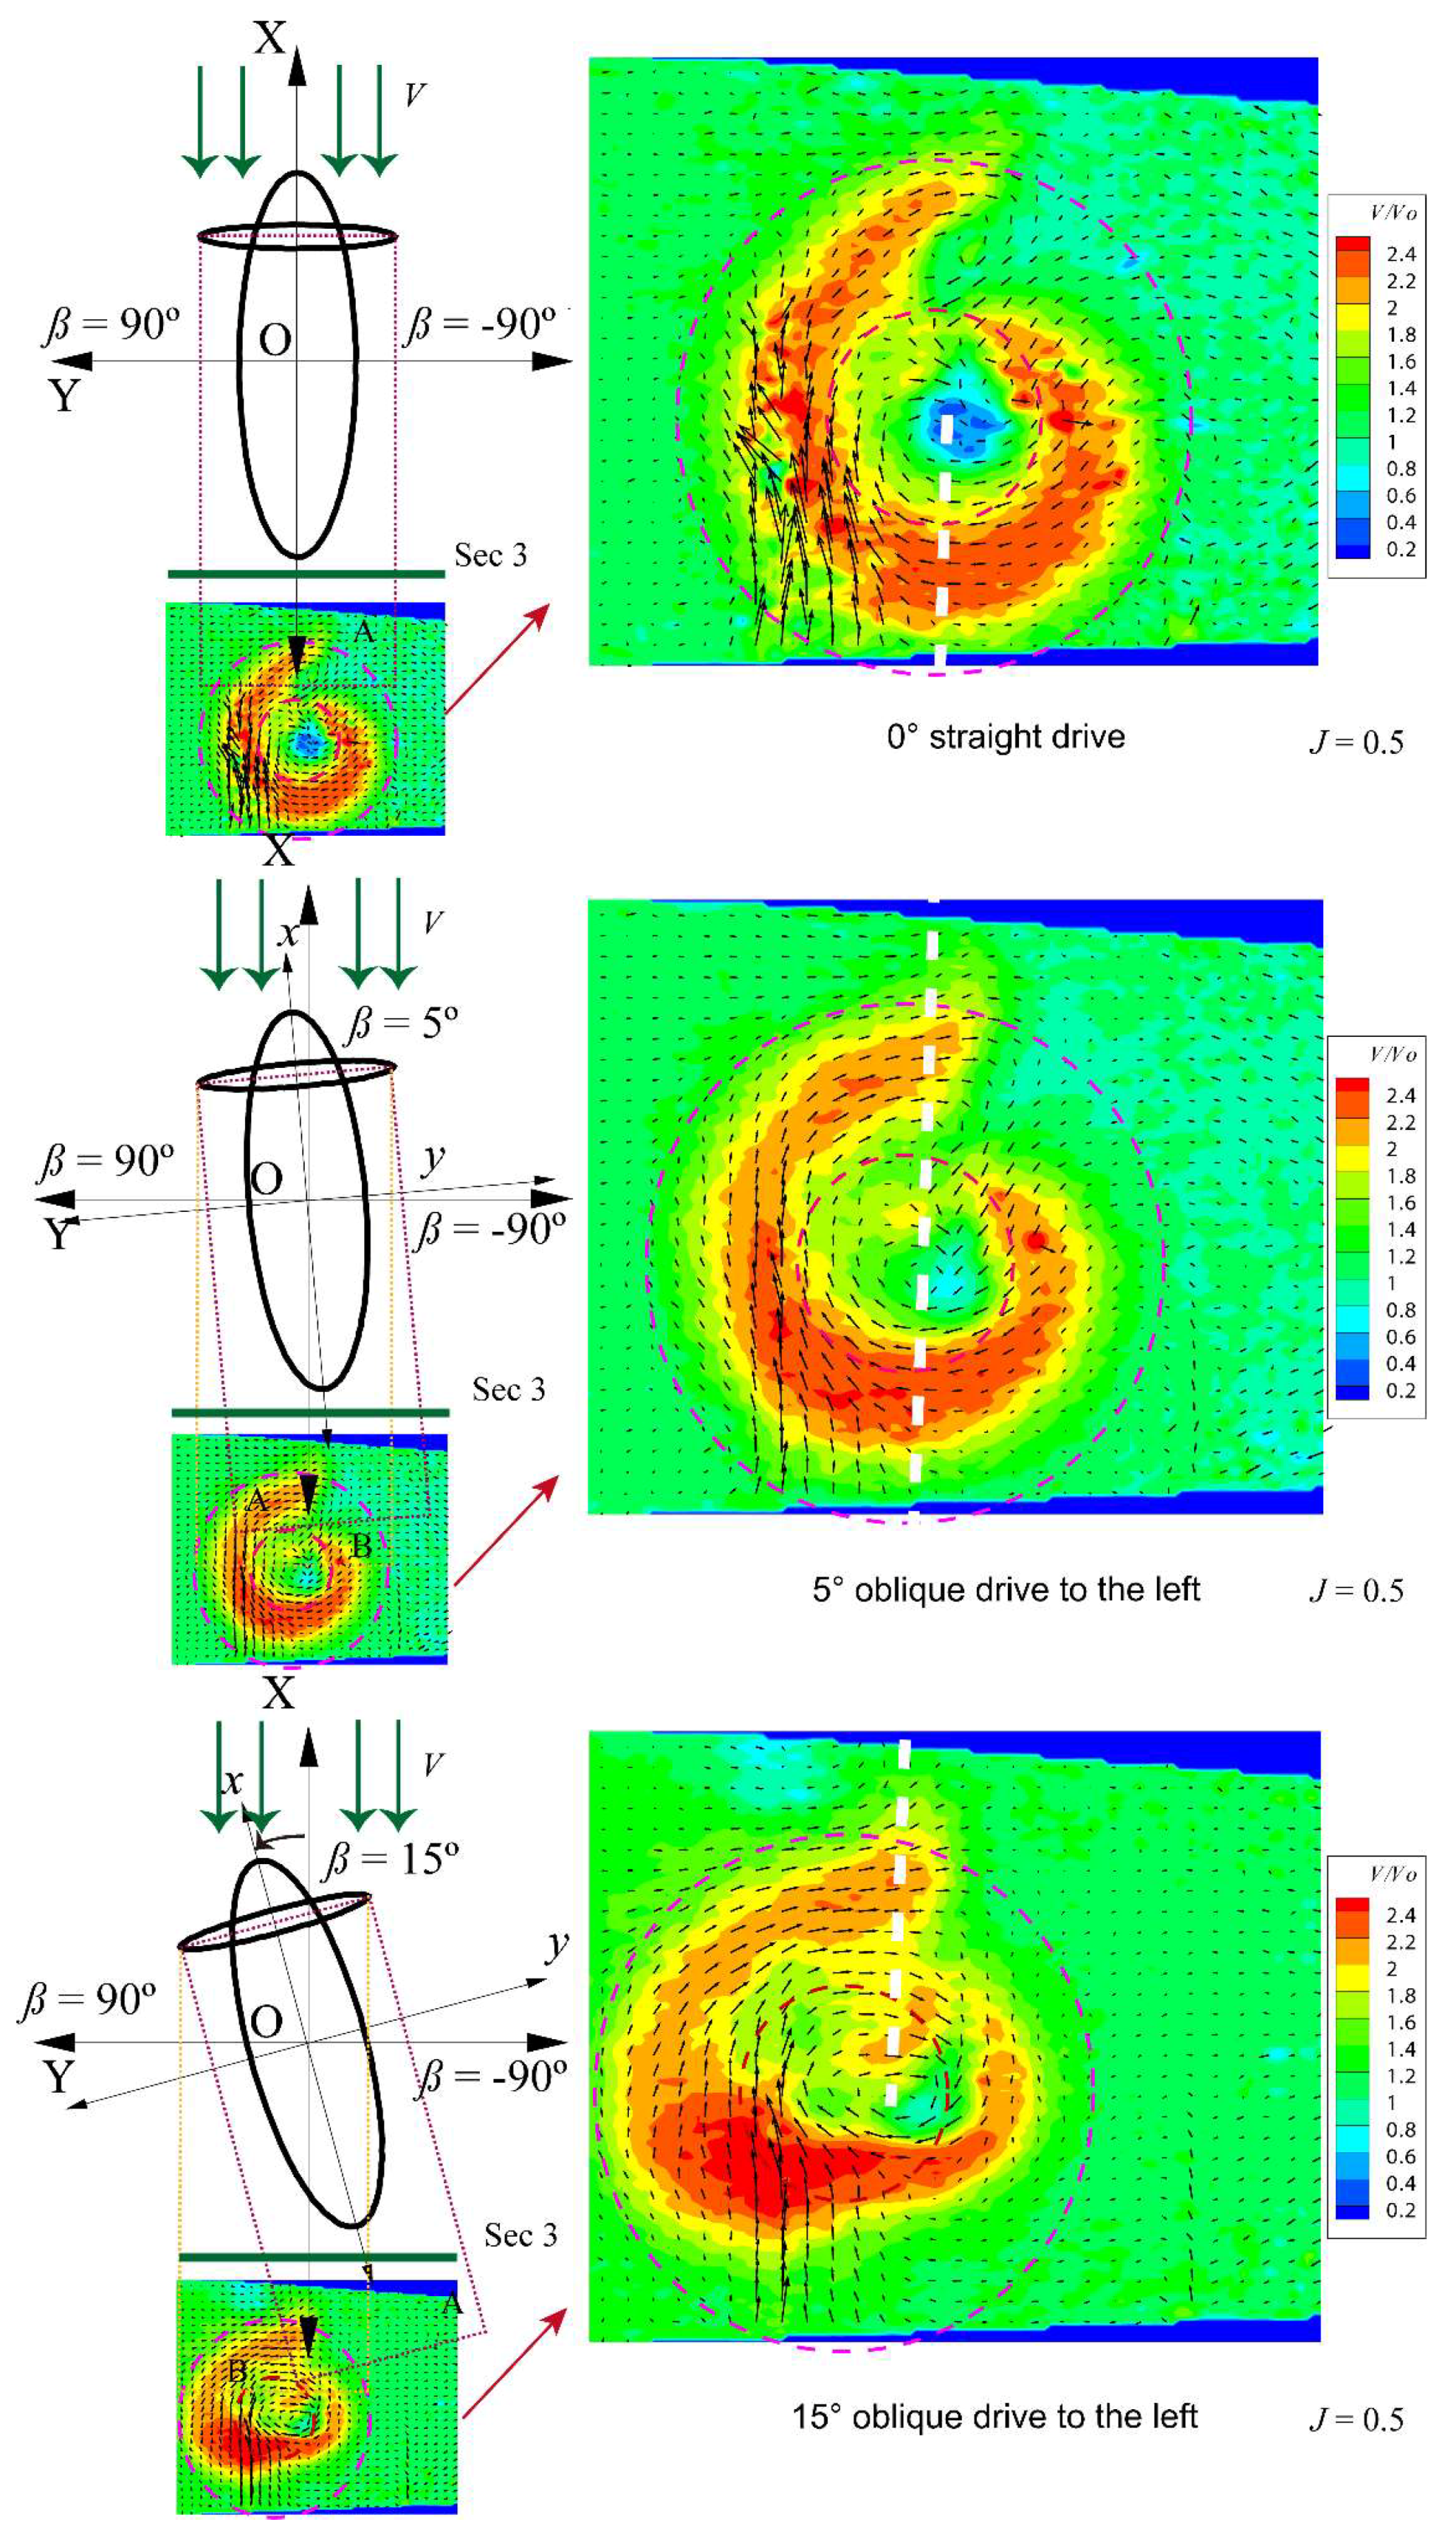
Figure 10 and Figure 11 show the axial velocity vector distribution of Section 3 at different rudder angles, when was 0.5. Figure 10 and Figure 11 also depict the working conditions for small and large rudder angles, respectively. As the rudder angle increased, the angle between the rotary wake flow area of the propeller and inflow increased. The interference of the inflow on the measurement area flow field also gradually increased.
With a 0° rudder angle, the rotary center of the propeller wake flow basically coincided with the center of the propeller disk, with a distinct asymmetry in the propeller wake flow at the measurement location that is near the pod tail. There was an obvious area of weakening velocity on the right side of the pod, owing to pod interference in the Y-direction; the weakening area also had an area of obvious vortex recirculation. With a 5° rudder angle, the axial velocity vectors of the propeller wake flow were subjected to effects from the inflow and drifted left. The interference effect also decreased at the pod tail. In addition, distinct asymmetry of the propeller wake flow at the measurement location near the pod tail remains observable. There was also an obvious area of weakening velocity on the right side of the pod, owing to pod interference in the Y-direction; the weakening area also had an obvious area of vortex recirculation. However, the recirculating area moved to the lower left as compared with that when the rudder angle was 0°. With a 15° rudder angle, the axial velocity vectors of the propeller wake flow were affected by inflow and they drifted farther left. Pod interference reduced the velocity in the lower right area. In addition, the area of velocity weakening on the right side of the pod became smaller, as did the area of the recirculation vortex, which then merged with the main vortex area.
The large rudder angles were defined as 30°, 45°, and 60°. At rudder angles that exceeded 30°, with gradual increases, the angle between the propeller rotating wake and the inflow increased. The effect of the propeller rotation on the flow field was gradually replaced by interference from the inflow. At large rudder angles, the interference of the inflow mainly occurred as pod obstruction on the entire flow field. The pod obstruction of the flow field became more severe, as the steering angle increased. The velocity weakening effect due to effect of the pod on the propeller rotating wake also became more severe with an increasing steering angle. With a 60° steering angle, the non-dimensional velocities of the propeller disk projection and external flow field areas were nearly identical. As the steering angle increased, the pod obstruction of the propeller wake flow became more prominent with an increase in the obstructed area. The overall behavior of the main vortex near the pod tail gradually moved to the left as the steering angle increased from 0° to 60°. The flow field measurement results between 45° and 60° illustrate the poor hydrodynamic performance of the podded propulsor in this range. Therefore, we do not recommend that the podded propulsor be operated within this rudder angle range unless it is absolutely necessary.
4. Conclusions
In this study, the experimental measurements of the fine flow field were performed on an L-type podded propulsor while using the PIV technique. The measurement results demonstrate the following:
- In the straight drive conditions with different advance coefficients, the velocity difference for the propeller wake flow indicated the magnitude of the interaction intensity between the propeller and inflow. Distinct asymmetry near the pod tail characterizes the propeller wake flow.
- Owing to pod interference in the Y-direction, the right side of the pod interfered with the flow field, which created an obvious area of velocity interference. The interference area also had an obvious area of vortex recirculation.
- In the oblique drive conditions, the existence of an oblique drive angle results in a flow field deflection angle in both the propeller rotating wake flow and inflow areas. This deflection angle was equivalent to the oblique drive angle. The magnitude of the deflection angle determined the shape of the interference between the propeller rotating wake and inflow.
The flow field details at different sections between the propeller and inclined support were compared and analyzed. The flow field characteristics of L-type podded propeller were compared and studied in a more intuitive way. The interaction mechanism between propeller and pod was discussed in depth at different speed coefficients, different deflection angles, and different deflection directions. The measurement results in this study provide valuable reference information regarding in-depth analyses of the hydrodynamic performance and design of podded propulsors.
Author Contributions
Conceptualization, W.W.; Formal analysis, T.W.; Investigation, X.Y.; Methodology, C.G.; Writing—original draft, D.Z.; Writing—review & editing, D.Z.
Funding
This study was funded by the National Natural Science Foundation of China, grant numbers 51709060 and 51609030, Fundamental Research Funds for the Central Universities, grant number HEUCFM180104, and the National High Technology Joint Research Program of China, grant number (2016) 548.
Acknowledgments
I would like to thank my tutor Guo; in the process of composing this paper, he provided significant academic and constructive advice and helped me to correct my paper. I would also like to thank the other authors for their help in writing the manuscript.
Conflicts of Interest
The authors declare no conflict of interest. The sponsors had no role in the design, execution, interpretation, or writing of the study.
References
- Propulsion Committee of 22nd ITTC. Final report and recommendations to the 23rd ITTC. In Proceedings of the 23rd ITTC, Hamburg, Germany, 8–14 September 2002.
- Szantyr, J.A. Hydrodynamic model experiments with pod drives. Ocean. Eng. Int. 2001, 5, 95–103. [Google Scholar]
- Heinke, H.J. Investigation about the Forces and Moment at Podded Drives. In Proceedings of the 1st International Conference on Technological Advances in Podded Propulsion; Atlar, M., Clarke, D., Glover, E.J., Eds.; University of Newcastle: Newcastle, UK, 2004; pp. 305–320. [Google Scholar]
- Grygorowicz, M.; Szantyr, J.A. Open water experiment with two pod propulsor models. In Proceedings of the 1st International Conference on Technological Advances in Podded Propulsion; Atlar, M., Clarke, D., Glover, E.J., Eds.; University of Newcastle: Newcastle, UK, 2004; pp. 357–370. [Google Scholar]
- Reichel, M. Manoeuvring forces on azimuthing podded propulsor model. Pol. Marit. Res. 2007, 14, 3–8. [Google Scholar] [CrossRef] [Green Version]
- Islam, M.F.; Veitch, B.; Liu, P.F. Experimental research on marine podded propulsors. J. Nav. Archit. Mar. Eng. 2007, 4, 57–71. [Google Scholar] [CrossRef]
- Islam, M.F.; Akinturk, A.; Veitch, B.; Liu, P.F. Performance characteristics of static and dynamic azimuthing podded propulsor. In Proceedings of the 1st International Symposium on Marine Propulsors-smp’09, Trondheim, Norway, 22–24 June 2009; pp. 482–492. [Google Scholar]
- Xin, G.Z.; Liu, D.C.; Shi, X.Y.; Wei, X.H. Numerical prediction of hydrodynamic performance and model test for contra-rotating POD propulsion. In Proceedings of the 23rd National Symposium on Hydraulics and 10th National Academic Conference on Hydraulics, Xian, China, 1 September 2011. [Google Scholar]
- Shen, X.R.; Cai, Y.J.; Cai, R.Q.; Feng, X.M. Summarization of hydrodynamics performance study of podded propulsor. J. Ship Mech. 2011, 15, 189–197. [Google Scholar]
- Shen, X.; Fan, S.; Cai, Y.; Sun, Q.; Yang, C. Experimental investigation on cavitation performance of podded propulsor under small helm-angle condition. Shipbuild. China 2012, 53, 1–8. [Google Scholar]
- Shen, X.; Sun, Q.; Wei, Y.; Wu, Y.; Wang, H. Experimental investigation on hydrodynamic performance of podded propulsor under static azimuthing conditions. Shipbuild. China 2016, 57, 9–18. [Google Scholar]
- He, W.; Chen, K.; Li, Z. Experimental research on hydrodynamics of tandem podded propulsor in azimuthing conditions. J. Huazhong Univ. Sci. Technol. (Nat. Sci. Ed.) 2015, 1, 107–111. [Google Scholar]
- Felice, F.D.; Florio, D.D.; Felli, M.; Romano, G.P. Experimental investigation of the propeller wake at different loading conditions by particle image velocimetry. J. Ship Res. 2004, 48, 168–190. [Google Scholar]
- Stettler, J.W.; Hover, F.S.; Triantafylyidejilou, M.S. Preliminary results of testing on the dynamics of an azimuthing podded propulsor relating to vehicle maneuvering. In Proceedings of the 1st International Conference on Technological Advances in Podded Propulsion; Atlar, M., Clarke, D., Glover, E.J., Eds.; University of Newcastle: Newcastle, UK, 2004; pp. 321–337. [Google Scholar]
- Paik, B.G.; Kim, J.; Park, Y.H.; Kim, K.S.; Yu, K.K. Analysis of wake behind a rotating propeller using PIV technique in a cavitation tunnel. Ocean Eng. 2007, 34, 594–604. [Google Scholar] [CrossRef]
- Guo, C.Y.; Wu, T.C.; Luo, W.Z.; Chang, X.; Gong, J.; She, W.X. Experimental study on the wake fields of a Panamax Bulker based on stereo particle image velocimetry. Ocean Eng. 2018, 165, 91–106. [Google Scholar] [CrossRef]
- Gong, J.; Guo, C.Y.; Song, K.W.; Wu, T.C. SPIV measurements and URANS simulations on the inlet velocity distribution for a waterjet-propelled ship with stabiliser fins. Ocean Eng. 2019, 171, 120–130. [Google Scholar] [CrossRef]
- Falchi, M.; Felli, M.; Grizzi, S.; Aloisio, G.; Broglia, R.; Stern, F. SPIV measurements around the DELFT 372 catamaran in steady drift. Exp. Fluids 2014, 55, 1844. [Google Scholar] [CrossRef]
- Felli, M.; Falchi, M. Propeller wake evolution mechanisms in oblique flow conditions. J. Fluid Mech. 2018, 845, 520–559. [Google Scholar] [CrossRef]
Figure 1.
Experimental system for the L-type podded propulsor. 1—dial; 2—steering motor; 3—force sensor; 4—billboard; 5—deflector; 6—water seal plate.
Figure 1.
Experimental system for the L-type podded propulsor. 1—dial; 2—steering motor; 3—force sensor; 4—billboard; 5—deflector; 6—water seal plate.

Figure 2.
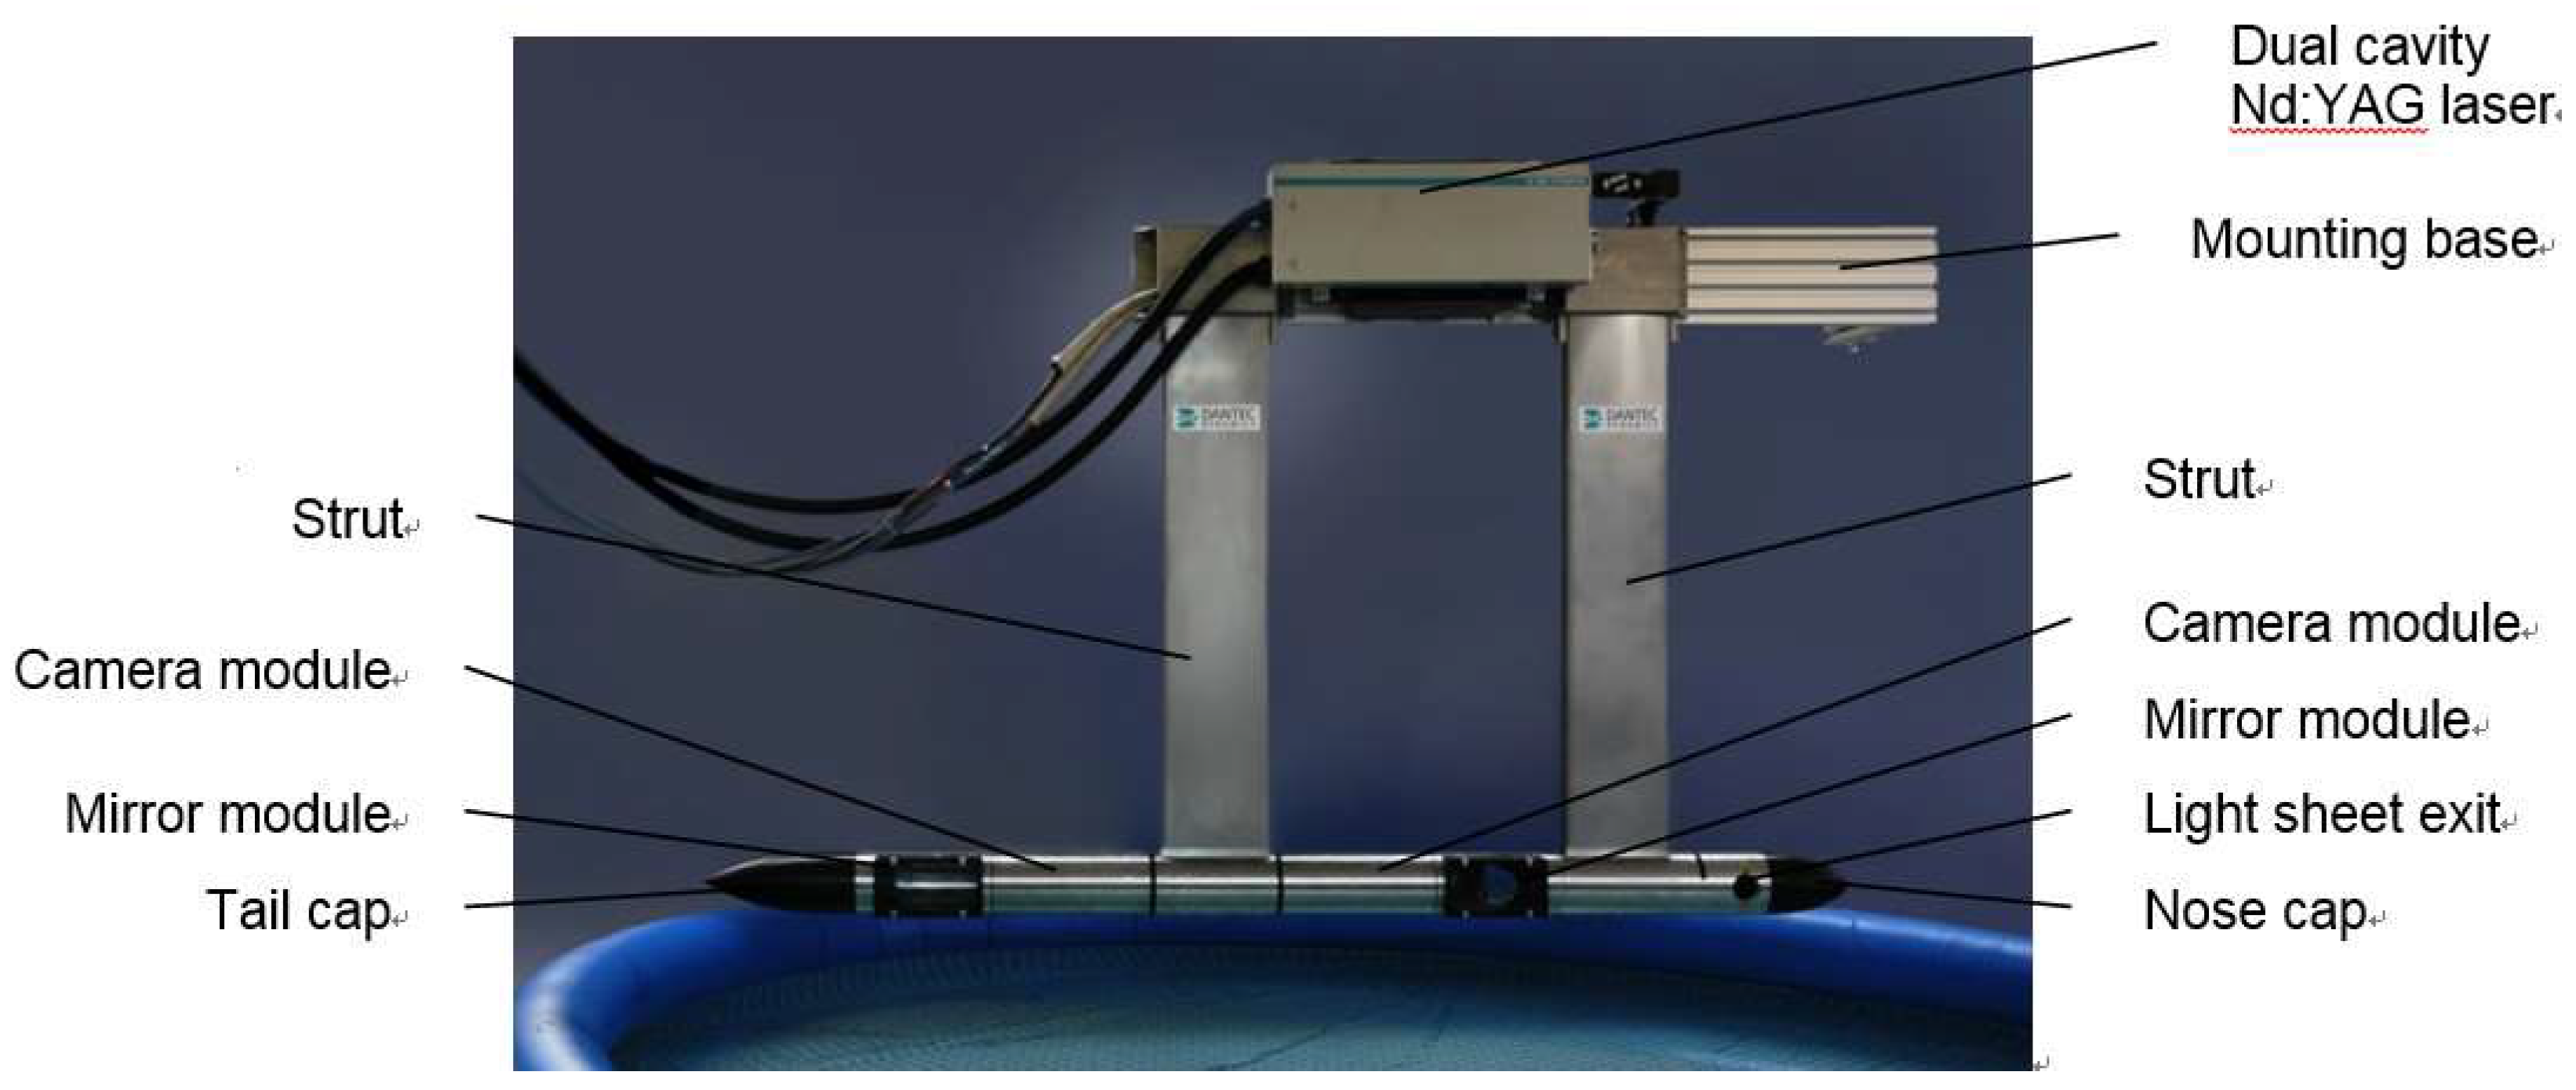
Stereoscopic towing tank particle image velocimetry (PIV) probe and laser.

Figure 3.
Flow-field cross-sections for the L-type podded propulsor (a) Drawings of three measured cross-sections (b) Positions of three measured cross-sections.
Figure 3.
Flow-field cross-sections for the L-type podded propulsor (a) Drawings of three measured cross-sections (b) Positions of three measured cross-sections.

Figure 4.
Schematic of the flow-field measurement for the L-type podded propulsor.

Figure 5.
Photograph showing the flow-field measurement of the L-type podded propulsor by PIV.

Figure 6.
PIV measurements of the L-type podded propulsor in straight drive ( = 0.1, 0.5, and 0.9).

Figure 7.
PIV measurements of the L-type podded propulsor in −30° oblique drive ( = 0.1, 0.5, and 0.9).
Figure 7.
PIV measurements of the L-type podded propulsor in −30° oblique drive ( = 0.1, 0.5, and 0.9).

Figure 8.
PIV measurements of the L-type podded propulsor in ±30° oblique drive conditions ( = 0.5).
Figure 8.
PIV measurements of the L-type podded propulsor in ±30° oblique drive conditions ( = 0.5).

Figure 9.
Dimensionless axial velocity distribution curves at different longitudinal tangents ( = 0.5). (a) −30° oblique drive conditions (b) +30° oblique drive conditions.
Figure 9.
Dimensionless axial velocity distribution curves at different longitudinal tangents ( = 0.5). (a) −30° oblique drive conditions (b) +30° oblique drive conditions.

Figure 10.
PIV measurements of the L-type podded propulsor at small rudder angles ( = 0.5).

Figure 11.
PIV measurements of the L-type podded propulsor at large rudder angles.


Table 1.
Basic parameters of the podded propulsor.
| Parameter | Value |
|---|---|
| Inclined angle of the bracket (°) | 60 |
| Total length of the pod (m) | 0.473 |
| Hub length (m) | 0.075 |
| Maximum radius of the pod (m) | 0.049 |
| Number of propeller blades | 4 |
| Propeller diameter (m) | 0.24 |
| Propeller pitch ratio (0.7R) | 1.284 |
Table 2.
Basic parameters of PIV.
| Parameter | Value |
|---|---|
| Resolution of CCD Camera | 2048 × 2048 pixels |
| Maximum Pulse Frequency of Laser | 15 Hz |
| Maximum Pulse Laser Energy | 1200 mJ |
| Conventional working energy of laser | 200 mJ |
| Laser beam duration | 4 ns |
| Laser wavelength | 532 nm |
| Thickness of Pulsed Laser Sheet | 0.6 mm |
| Maximum measurement range | 400 × 400 mm |
| Tracer particle | polyamide (PSP-50μm) |
© 2019 by the authors. Licensee MDPI, Basel, Switzerland. This article is an open access article distributed under the terms and conditions of the Creative Commons Attribution (CC BY) license (http://creativecommons.org/licenses/by/4.0/).
Share and Cite
MDPI and ACS Style
Zhao, D.; Guo, C.; Wu, T.; Wang, W.; Yin, X. Hydrodynamic Interactions between Bracket and Propeller of Podded Propulsor Based on Particle Image Velocimetry Test. Water 2019, 11, 1142. https://doi.org/10.3390/w11061142
AMA Style
Zhao D, Guo C, Wu T, Wang W, Yin X. Hydrodynamic Interactions between Bracket and Propeller of Podded Propulsor Based on Particle Image Velocimetry Test. Water. 2019; 11(6):1142. https://doi.org/10.3390/w11061142
Chicago/Turabian StyleZhao, Dagang, Chunyu Guo, Tiecheng Wu, Wei Wang, and Xunbin Yin. 2019. "Hydrodynamic Interactions between Bracket and Propeller of Podded Propulsor Based on Particle Image Velocimetry Test" Water 11, no. 6: 1142. https://doi.org/10.3390/w11061142
Note that from the first issue of 2016, this journal uses article numbers instead of page numbers. See further details here.