Micromixing Efficiency of Particles in Heavy Metal Removal Processes under Various Inlet Conditions
by
 , and
, and
Evangelos Karvelas
1, 
Christos Liosis
1,
Lefteris Benos
2, 
Theodoros Karakasidis
1,* and
Ioannis Sarris
3
1
Laboratory of Hydromechanics and Environmental Engineering, Department of Civil Engineering, University of Thessaly, 38334 Volos, Greece
2
Institute of Bio-Economy and Agri-Technology (IBO), Centre for Research & Technology Hellas (CERTH), 38333 Volos, Greece
3
Department of Mechanical Engineering, University of West Attica, 12244 Athens, Greece
*
Author to whom correspondence should be addressed.
Water 2019, 11(6), 1135; https://doi.org/10.3390/w11061135
Submission received: 27 April 2019
/
Revised: 24 May 2019
/
Accepted: 28 May 2019
/
Published: 30 May 2019
(This article belongs to the Section Wastewater Treatment and Reuse)
Abstract
:Water quality problems are a persistent global issue since population growth has continually stressed hydrological resources. Heavy metals released into the environment from plating plants, mining, and alloy manufacturing pose a significant threat to the public health. A possible solution for water purification from heavy metals is to capture them by using nanoparticles in micromixers. In this method, conventionally heavy metal capture is achieved by effectively mixing two streams, a particle solution and the contaminated water, under the action of external magnetic fields. In the present study, we investigated the effective mixing of iron oxide nanoparticles and water without the use of external magnetic fields. For this reason, the mixing of particles and the contaminated water was studied for various inlet velocity ratios and inflow angles of the two streams using computational fluid dynamics techniques. The Navier-Stokes equations were solved for the water flow, the discrete motion of particles was evaluated by a Lagrangian method, while the flow of substances of the contaminated water was studied by a scalar transport equation. Results showed that as the velocity ratio between the inlet streams increased, the mixing of particles with the contaminated water was increased. Therefore, nanoparticles were more uniformly distributed in the duct and efficiently absorbed the substances of the contaminated water. On the other hand, the angle between two streams was found to play an insignificant role in the mixing process. Consequently, the results from this study could be used in the design of more compact and cost efficient micromixer devices.
1. Introduction
Industrial, municipal, and agricultural growth has tremendous effects on ground and surface water resources due to the resulting pollution [1,2,3,4,5,6]. Although the nature of pollution problems may vary, they are typically due to inadequate sanitation, detergents, fertilizers, pesticides, chemicals, potentially toxic metals, salinity caused by widespread and inefficient irrigation, and high sediment loads resulting from upstream soil erosion [2,7,8].
Although there are sustainable solutions for the treatment of wastewater [9,10] nanotechnology has been identified as one of the most promising technologies that could play an important role in resolving many of the problems involving water purification and quality since nanoparticles covered with appropriate chemical substances for heavy ion removal possess an increased surface to volume ratio and thus constitute an efficient removal method [11,12,13,14,15].
Among the nanosized materials, iron oxides such as magnetite (Fe3O4) and maghemite (γ-Fe3O4) have been investigated intensively for environmental applications [16,17,18,19]. The facilitated separation from water by magnetic force is the most attractive property of these magnetic nanoparticles. In addition to convenient magnetic properties, iron oxide (e.g., Fe3O4) nanoparticles possess many advantages—for instance, low toxicity, low price, and high surface to volume ratio (depending on the particle size), which are associated with their ability regarding surface chemical modification and can show enhanced capacity for metals uptake in water treatment procedures. Surface modification achieved by the attachment of inorganic shells or/and organic molecules not only stabilizes the nanoparticles, eventually preventing their oxidation, but also provides specific functionalities that can be selective for ion uptake. For example, high selective hollow mesoporous aluminosilicate spheres with nanosized Fe3O4 cores are suitable for adsorption of Hg2+ [20]. Iron oxide nanoparticles dispersed in chelating resins or coated with adequate chelating agents have been used for the removal of a wide range of metal ions from wastewater [21,22,23], overall displaying higher adsorption capacity than traditional materials such as activated carbon [24,25,26]. Silica-coated Fe3O4 functionalized with c-mercaptopropyltrimethoxysilane have been successfully applied for extraction of Cd2+, Cu2+, Hg2+, and Pb2+ in a wide pH range and even in the presence of foreign ions acting as interferents such as Al3+, Fe3+, and Cl− [27]. Fe3O4 particles encapsulated in thiol-containing polymers have also been reported, and their efficiency to remove Ag+, Hg2+, and Pb2+ ions has been evaluated [28]. The combination of nanotechnology and microfluidics may offer an effective water and wastewater treatment [29,30,31]. Furthermore, this combination can provide new treatment capabilities that could allow economic utilization of unconventional water sources to expand the water supply.
As it can be understood, efficient mixing of the magnetic nanoparticles with the polluted water is a crucial issue. The vast majority of researchers conventionally employ an external magnetic field to achieve efficient mixing inside micromixer devices [32,33,34,35], necessitating the usage of electromagnets in the mixer device too (electromagnets are, of course, necessary at the exit part of the cleaning device for separation of the nanoparticles from the clean water). Consequently, in the conventional approach, a part of the micromixer device should be the electromagnet as well as the supporting systems of it. This approach results in both an increase of the manufacturing cost as well as an increased device size.
It is known that changing the parameters of the hydrodynamic flow has a tremendous effect on the mixing procedure, even in large areas [36]. In this study, we investigated an efficient alternative to obtaining efficient mixing of the magnetic nanoparticles with the polluted water in a Y-shaped micromixer; from each branch arrives a water stream contaminated by heavy metals and a particle solution stream, which are inserted in a microfluidic duct. More specifically, we investigated the effect of the angle of the Y-micromixer and the effect of different inlet velocity ratios. This approach had the advantage of avoiding the use of electromagnets in the micromixer. A series of numerical simulations was performed for the study of this inlet effect on the particle distribution in the duct and the mixing between the two streams using computational fluid dynamics—an approach widely used for such simulations [29,32,33,34].
The results from the present study were very promising. They showed that efficient mixing could be produced without the use of electromagnets in the micromixer and thus could be of interest in the design of more compact and effective micromixers, as there is no need for using external forces in the mixing process. These devices could be used in areas with a lack of electricity as well as in ships for cleaning the ballast water due to the small weight and the maintenance of such devices.
In Section 2, the numerical methodology for the water flow, the particles’ motions, the diffusion of the substances of the contaminated water, and the simulation details are described. Results and discussions for the most effective absorption areas of particles in the micromixer are presented in Section 3 and Section 4, respectively, with emphasis on the influence of different inlet angles and velocity ratios. Finally, conclusions of the current study and suggestions for overcoming the difficulties in the mixing process are summarized in Section 5.
2. Materials and Methods
2.1. Geometry and Simulation Parameters
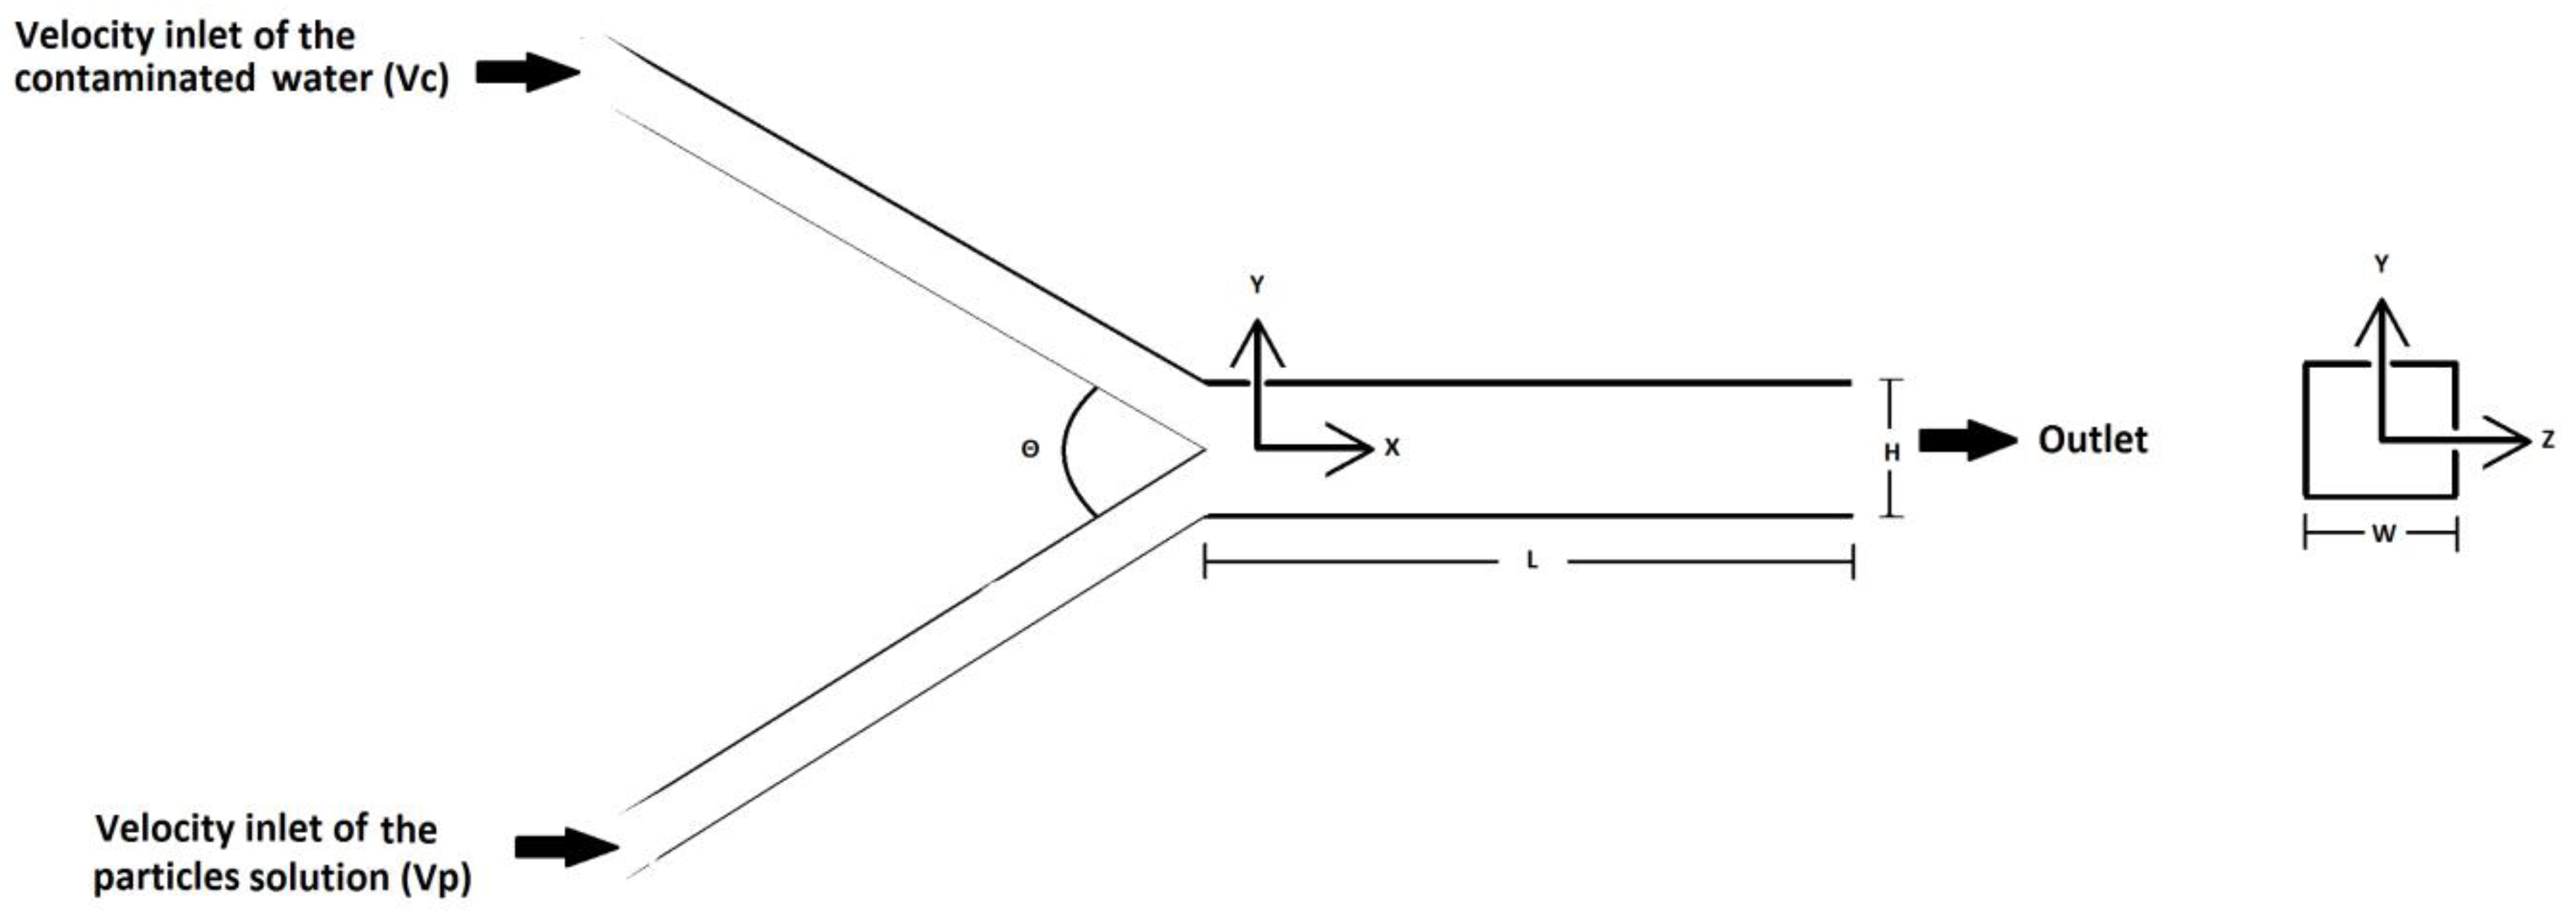
The slow water flow in the three-dimensional (3D) duct of the microfluid device shown in Figure 1 with a square cross-section was expected to be laminar and steady-state. The dimensions of the micromixer geometry are presented in Table 1. The two streams—the contaminated water and the particulate one—entered the micromixer from two different inlet ducts, mixed in the main duct, and left the domain from the unique outlet. Three possible inlet angles θ (i.e., 30°, 45°, and 60°) between the inflow streams were studied. The sizes of the computational grids for each of the micromixer ducts studied here are presented in Table 1 and were adequate for the low Reynolds number of the current flow for which the maximum value was based on the equivalent diameter de and the mean velocity . Details of numerical models, forces, and moment terms used in the equations are given in [37,38].
2.2. Numerical Model
The incompressible Navier–Stokes equations were solved in the Eulerian frame for the pressure and the velocity u of the continuous water phase together with a model for the discrete motion of nanoparticles in a Lagrangian frame and a model for the convection–diffusion of the substances of the contaminated water. The laminar governing equations of the fluid phase are given by [39]:
where is the time and is the kinematic viscosity of the water. The equations of each single particle motion in the discrete frame are based on the Newton law and may read as follows:
where the index i stands for the ith-particle with diameter , and are transversal and rotational velocities, respectively, and is its mass. The mass moment of inertia matrix is , and the terms and correspond to the linear and the angular accelerations, respectively. and are the normal and the tangential contact forces, respectively. stands for the hydrodynamic drag force, is the total force due to buoyancy, and and are the drag and the contact moments, respectively.
In order to estimate the motion of the substances from the contaminated water inside the micromixer, a trace species was added, exhibiting a uniform concentration equal to unity at the inlet of the contaminated water, zero at the particles inlet, and with zero gradient at the outlet of the main duct and walls. The concentration value inside the micromixer device was monitored during the flow calculations. For the calculation of the concentration of the substances from the contaminated water, the following unsteady convection–diffusion equation was solved for the incompressible single phase flow:
where is the transported scalar (species concentration), is the local fluid velocity, and is the diffusion coefficient that was kept equal to one for the present simulations.
The OpenFoam platform was used for the calculation of the flow field, the discrete equations of particles motion, and the concentration of the substances inside the micromixer device. The simulation process read as follows: initially, the fluid flow was found using the incompressible Navier-Stokes equations and the pressure correction method. Upon finding the flow field (pressure and velocity), the motion of particles was evaluated by the Lagrangian method. Finally, the steady- state velocity flow field predicted by the corresponding flow simulation at the same Reynolds number was used as the initial convecting field to solve the convection–diffusion equation. The discrete equations were evolved in time by an Euler time marching method.
3. Results
For the evaluation of the contaminated water particle mixing inside the micromixer device, a series of simulations was performed with different velocity ratios of the contaminated water (Vc) and the particle solution (Vp) under three different inlet angles between the two streams. The summary of the boundary conditions for the simulated cases is shown in Table 2.
The densities of the particles and the fluidic environments were and , respectively, while the diameters of the particles were considered to be . The number of particles per second that were inserted in the computational domain was 3000. The Young’s modulus of the material was , and the tangential stiffness was . The values of the Poisson ratio and the coefficient of friction were the same and were equal to. The diffusion coefficient of the substances of the contaminated water was equal to 2.02∙ 10−9 . The number of particles inserted in the particles solution stream was 3000 per second.
Results and statistics from the contaminated water particle solution mixing process were measured at the whole length of the micromixer device. At the first section of the micromixer device, for length , the particles tended to fill the space in the main duct, while for lengths , the particles were moving only streamwise. The movement of particles was attributed only to the flow field, and no external force was used.
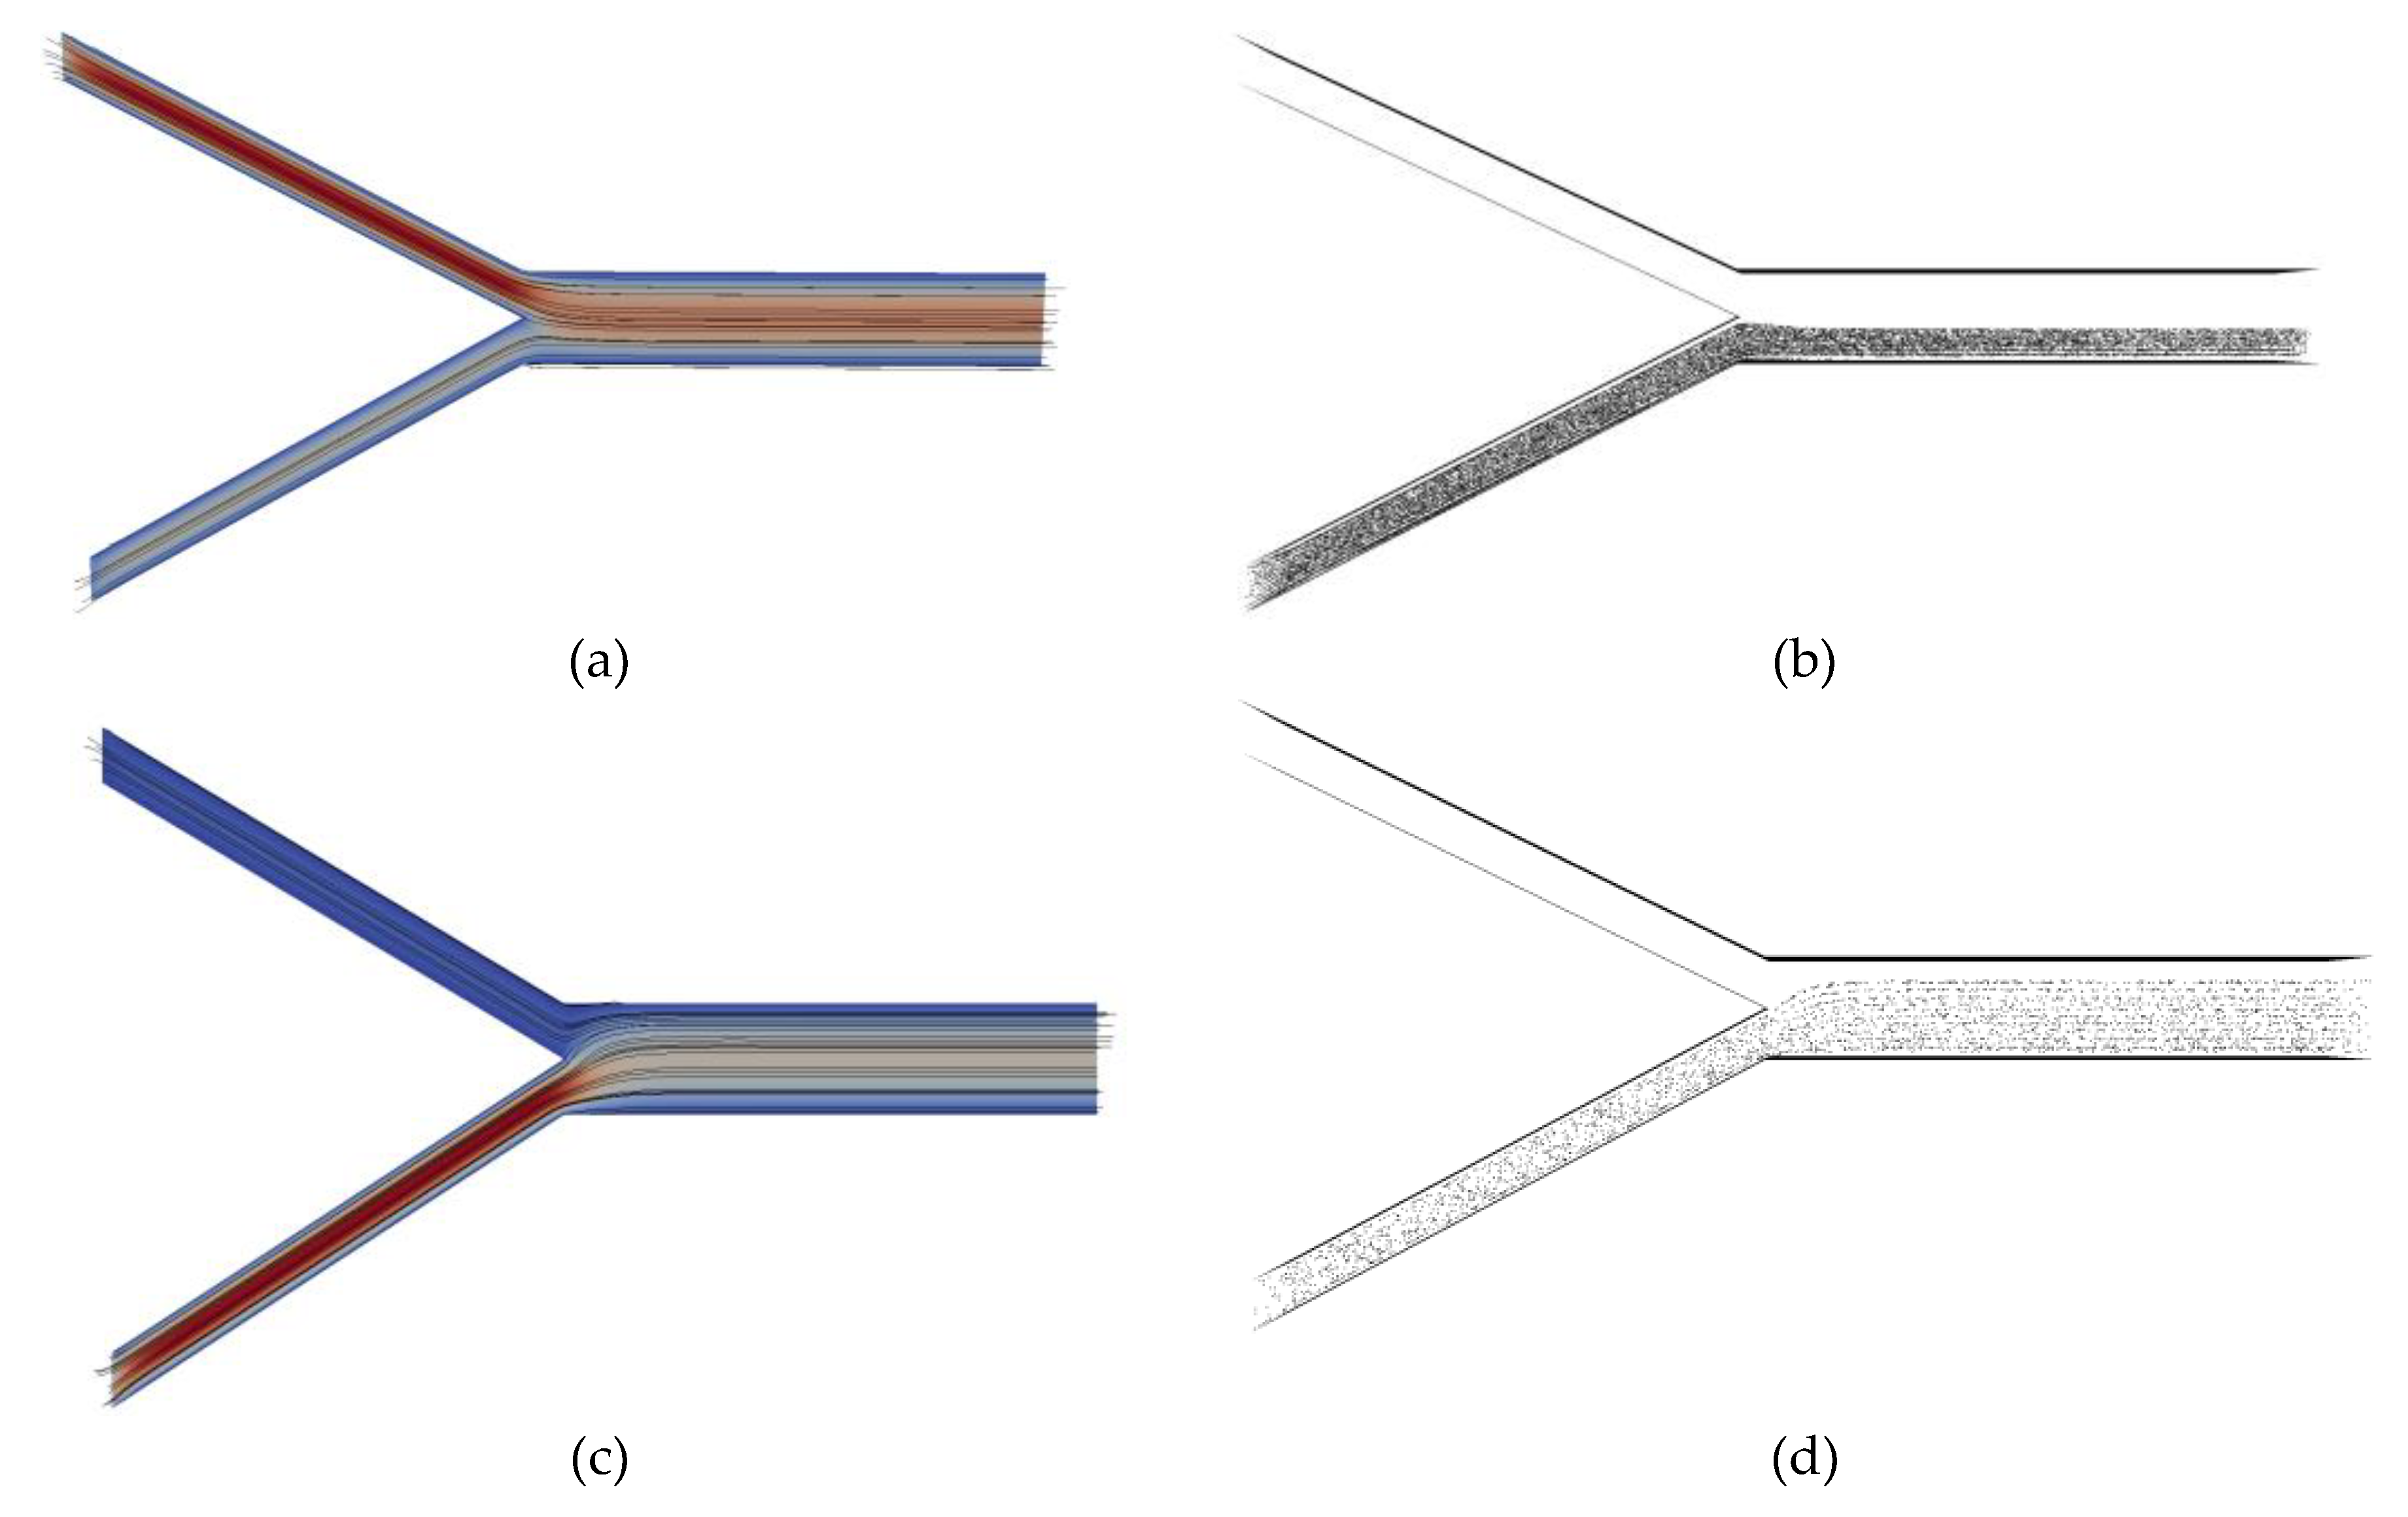
The streamlines and the snapshots of the particles positions inside the micromixer device for different velocity ratios between the particles solution and the contaminated water for the representative case of between the two inlets are depicted in Figure 2. When the ratio was equal to = 0.5, the particles were distributed only in the lower part of the device and for heights up to 40% of the main duct, as is depicted in Figure 2b. Therefore, the largest part of the device without particles was approximately 60%, resulting in inefficient mixing. As the ratio of was increased, the particles were widely and uniformly distributed inside the micromixer device. As increased and reached the value = 10, the area not covered by nanoparticles decreased by 20%, as the particles filled 80% of the height of the duct (see Figure 2d). When = 20, the particles were uniformly distributed in the micromixer (Figure 2f). However, there was a small area (lower than 10%) in the higher part of the device without particles, while the particles covered 90% of the height of the main duct.
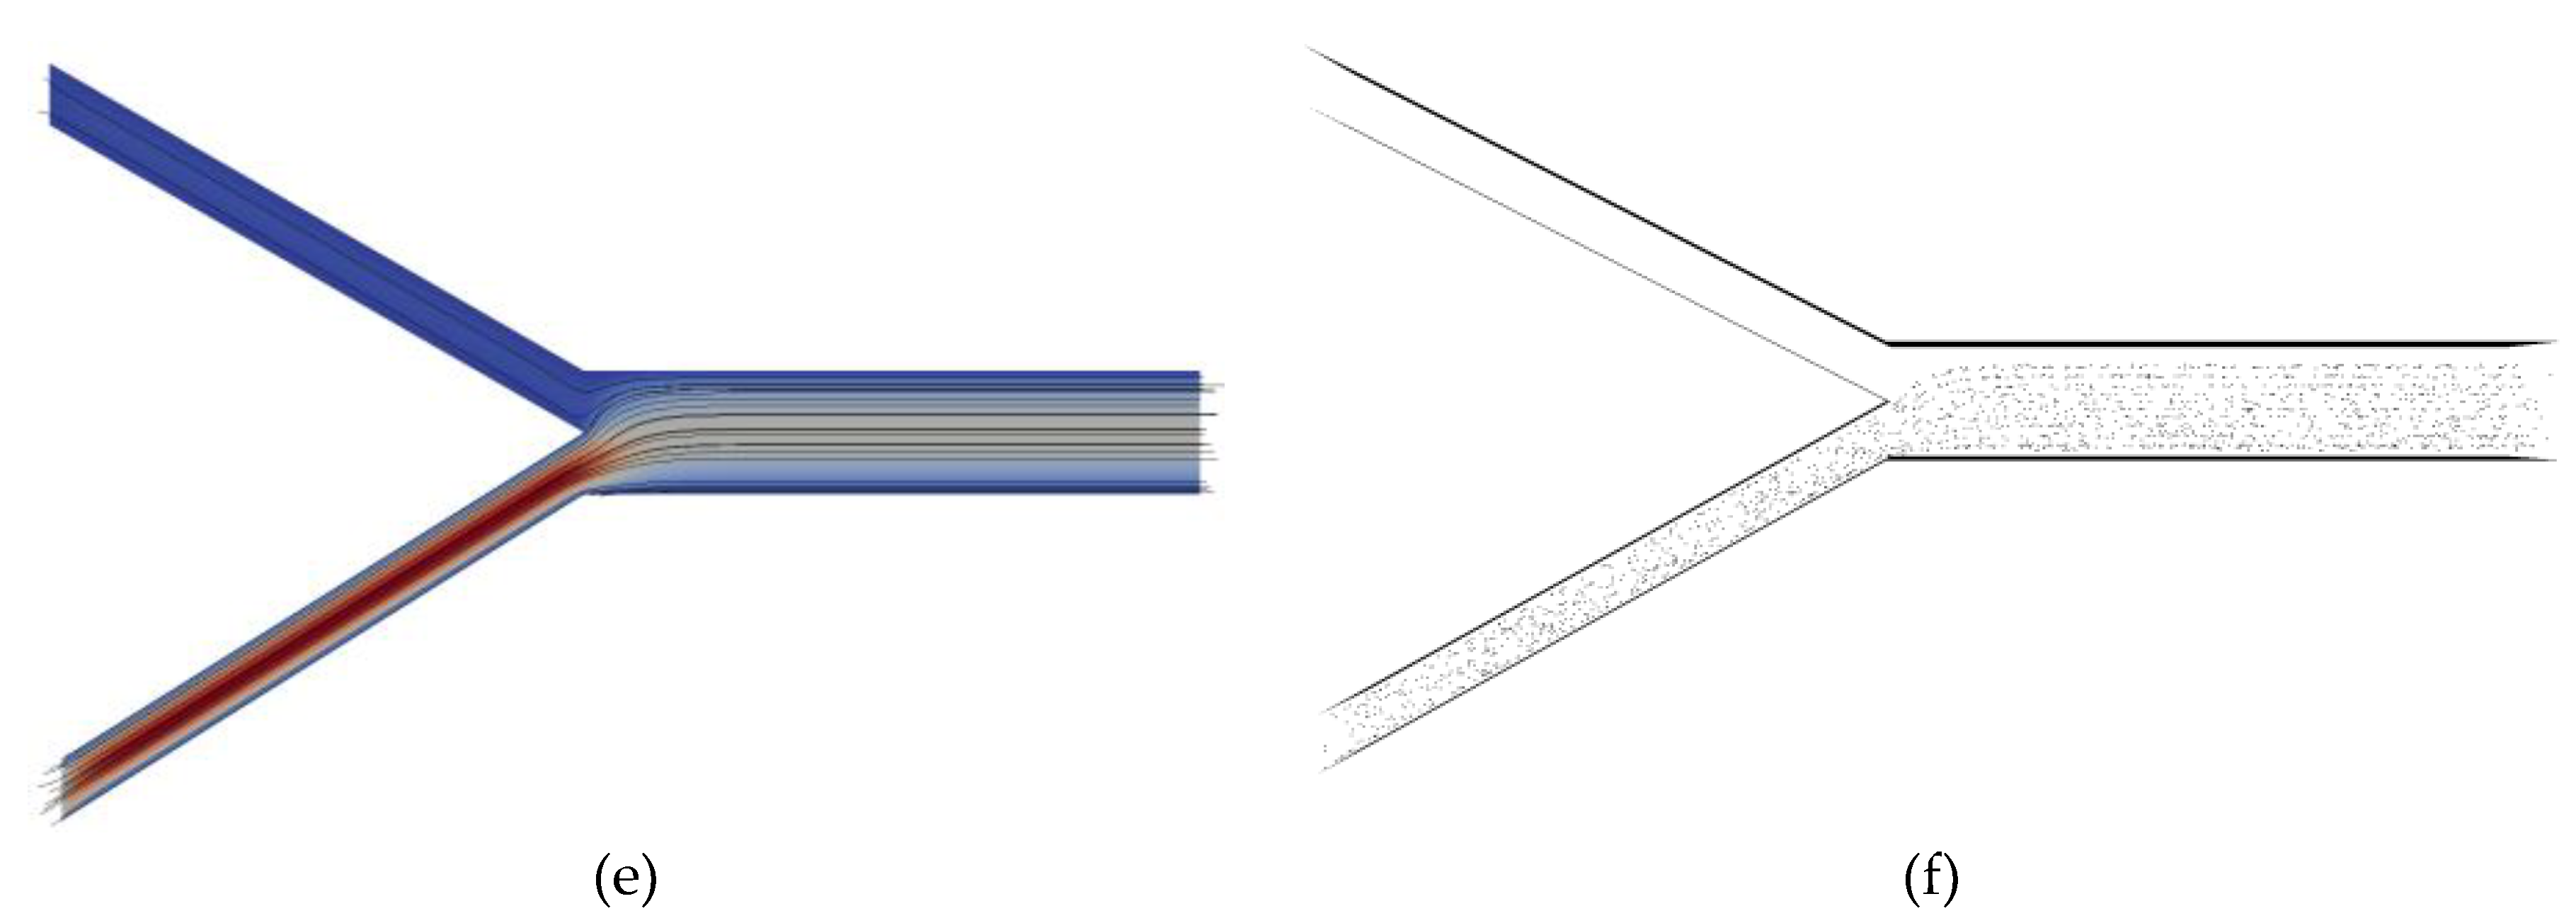
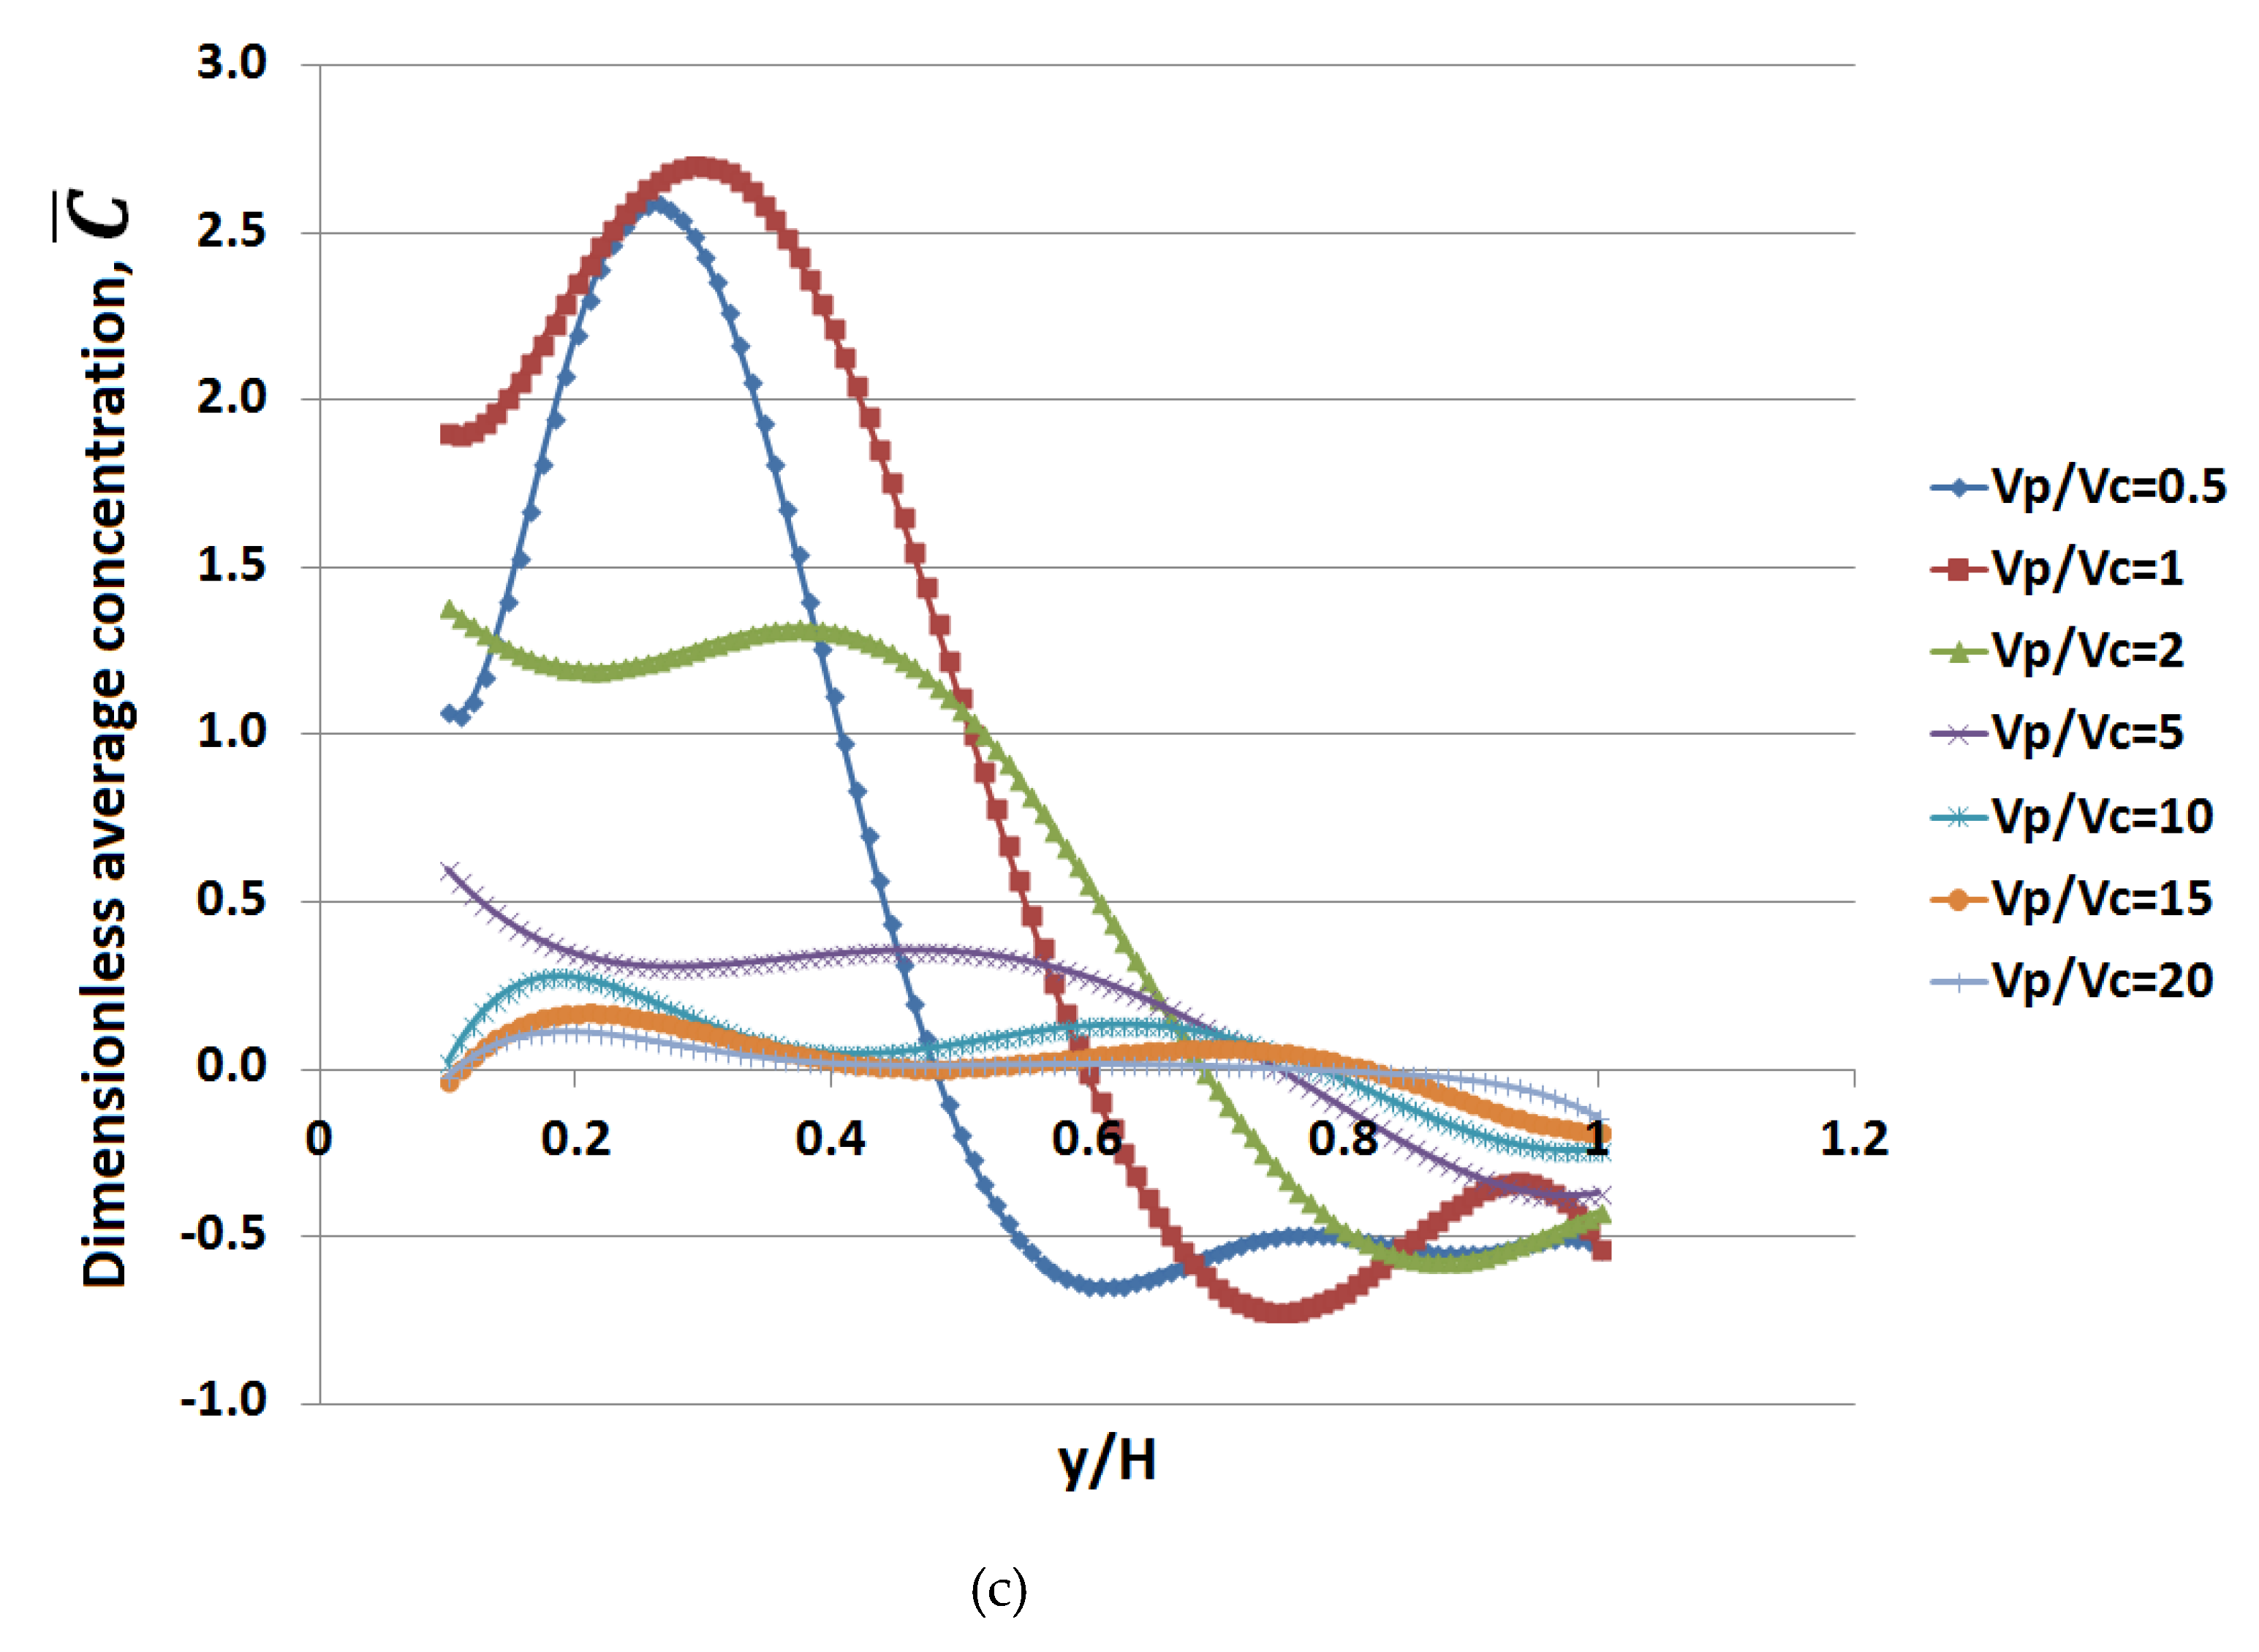
The concentration of the substances of the contaminated water resulted from the calculation of the diffusion of the substances due to the mixing process with the particles solution. The variation in the concentration of the contaminated water across the length and the height of the micromixer device for different velocity ratios between the two streams for the representative case of θ = 45° is presented in Figure 3. As is shown, the increase of the velocity ratio between the contaminated water and the particle solution did not affect the length inside the micromixer. The concentration profile had a uniform value across the micromixer device. In all cases, a steady concentration profile across the height of the device was evaluated for , as is depicted in Figure 3.
The velocity ratio between the two streams had a significant effect on the concentration value of the substances of the contaminated water. The higher the velocity ratio between the two streams was, the lower the concentration of the substances inside the micromixer device was, since more clean water enters the domain, as is depicted in Figure 3. The uniform value in the concentration of the substances of the contaminated water when the was , as is depicted in Figure 3a. On the other hand, when , the mean value was , as is depicted in Figure 3d. As the value of increased, the flow rate of the stream that carried the particles was getting higher. Thus, the particles solution was diluted. In addition, the increase in the velocity ratio, , between the two streams led to a diluted mixture between the contaminated water and the particles solution. Thus, the content of contaminated water in the micromixer was minimized. Consequently, a lower amount of particles was needed to absorb the substances from the contaminated water.
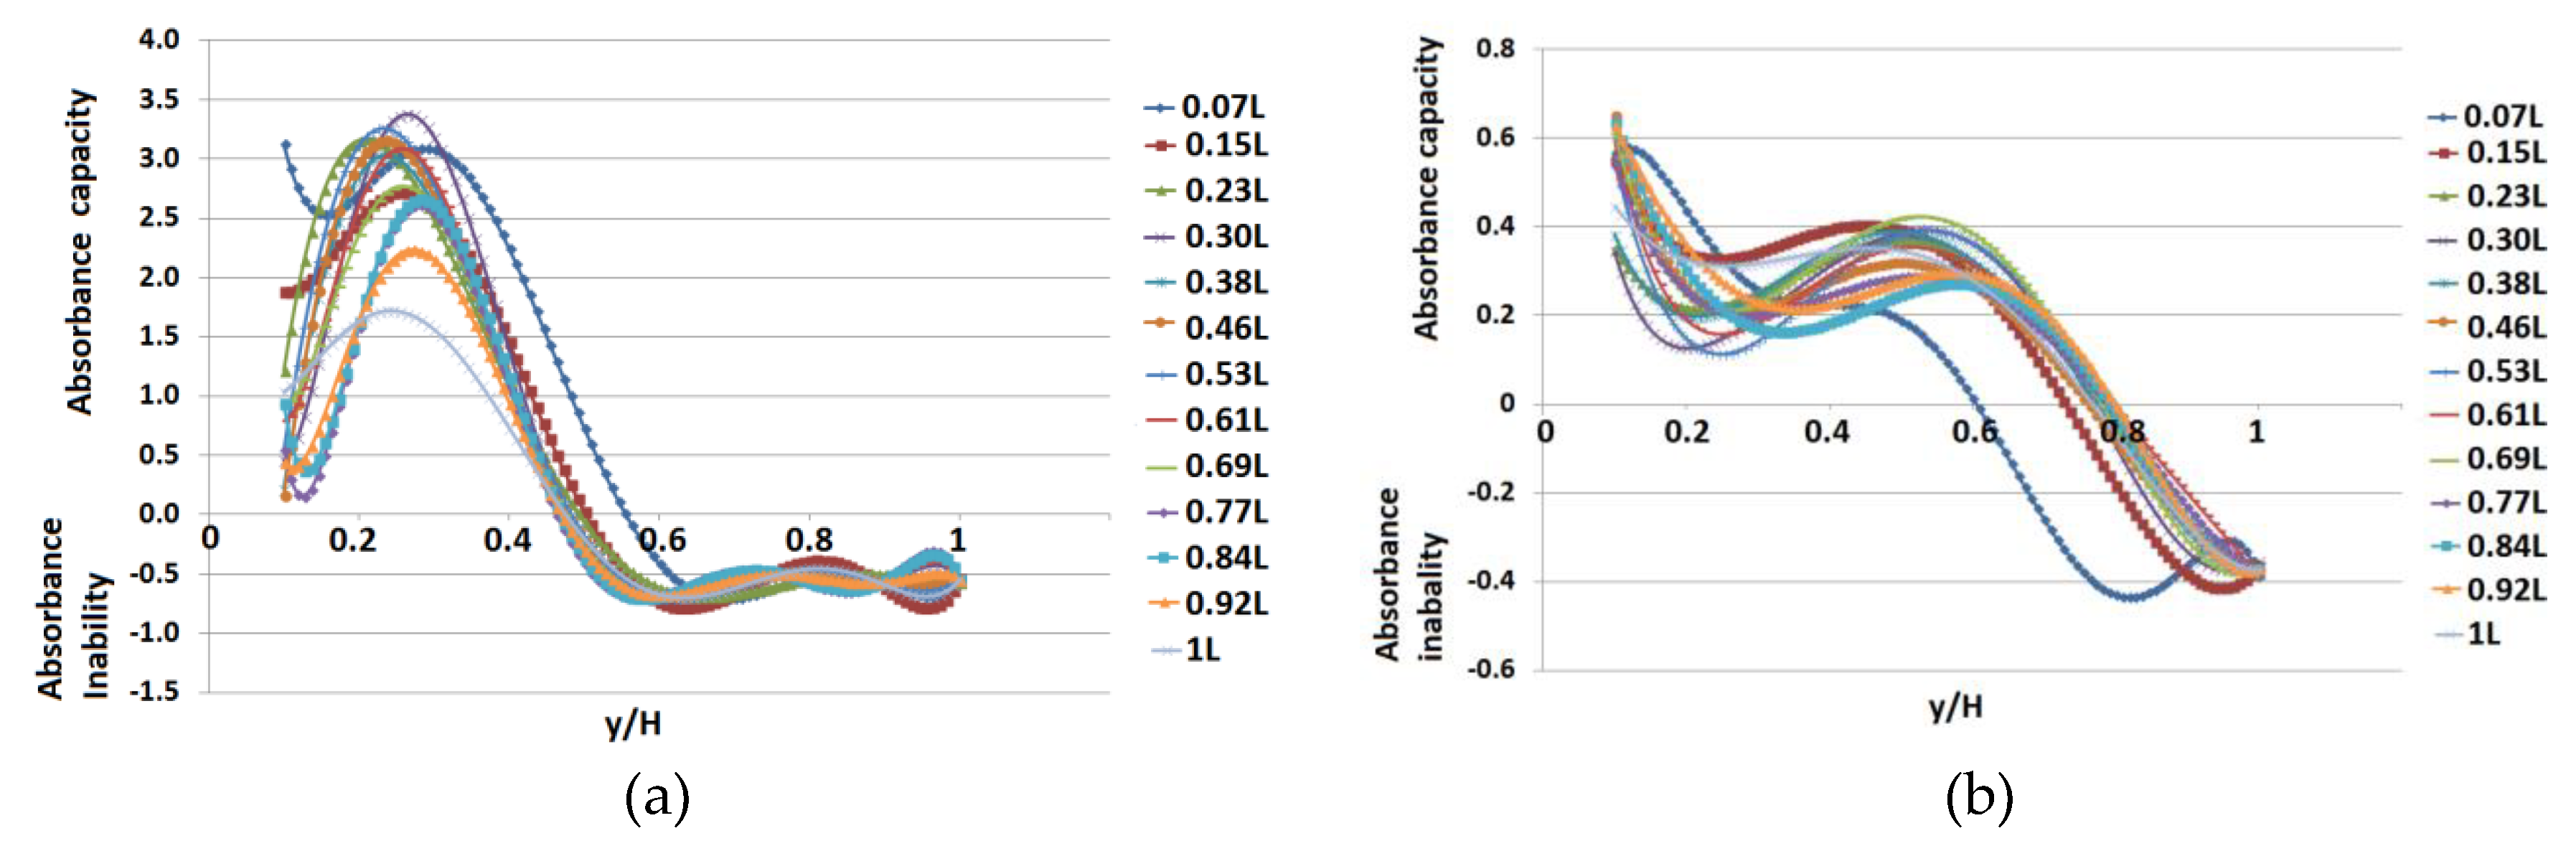
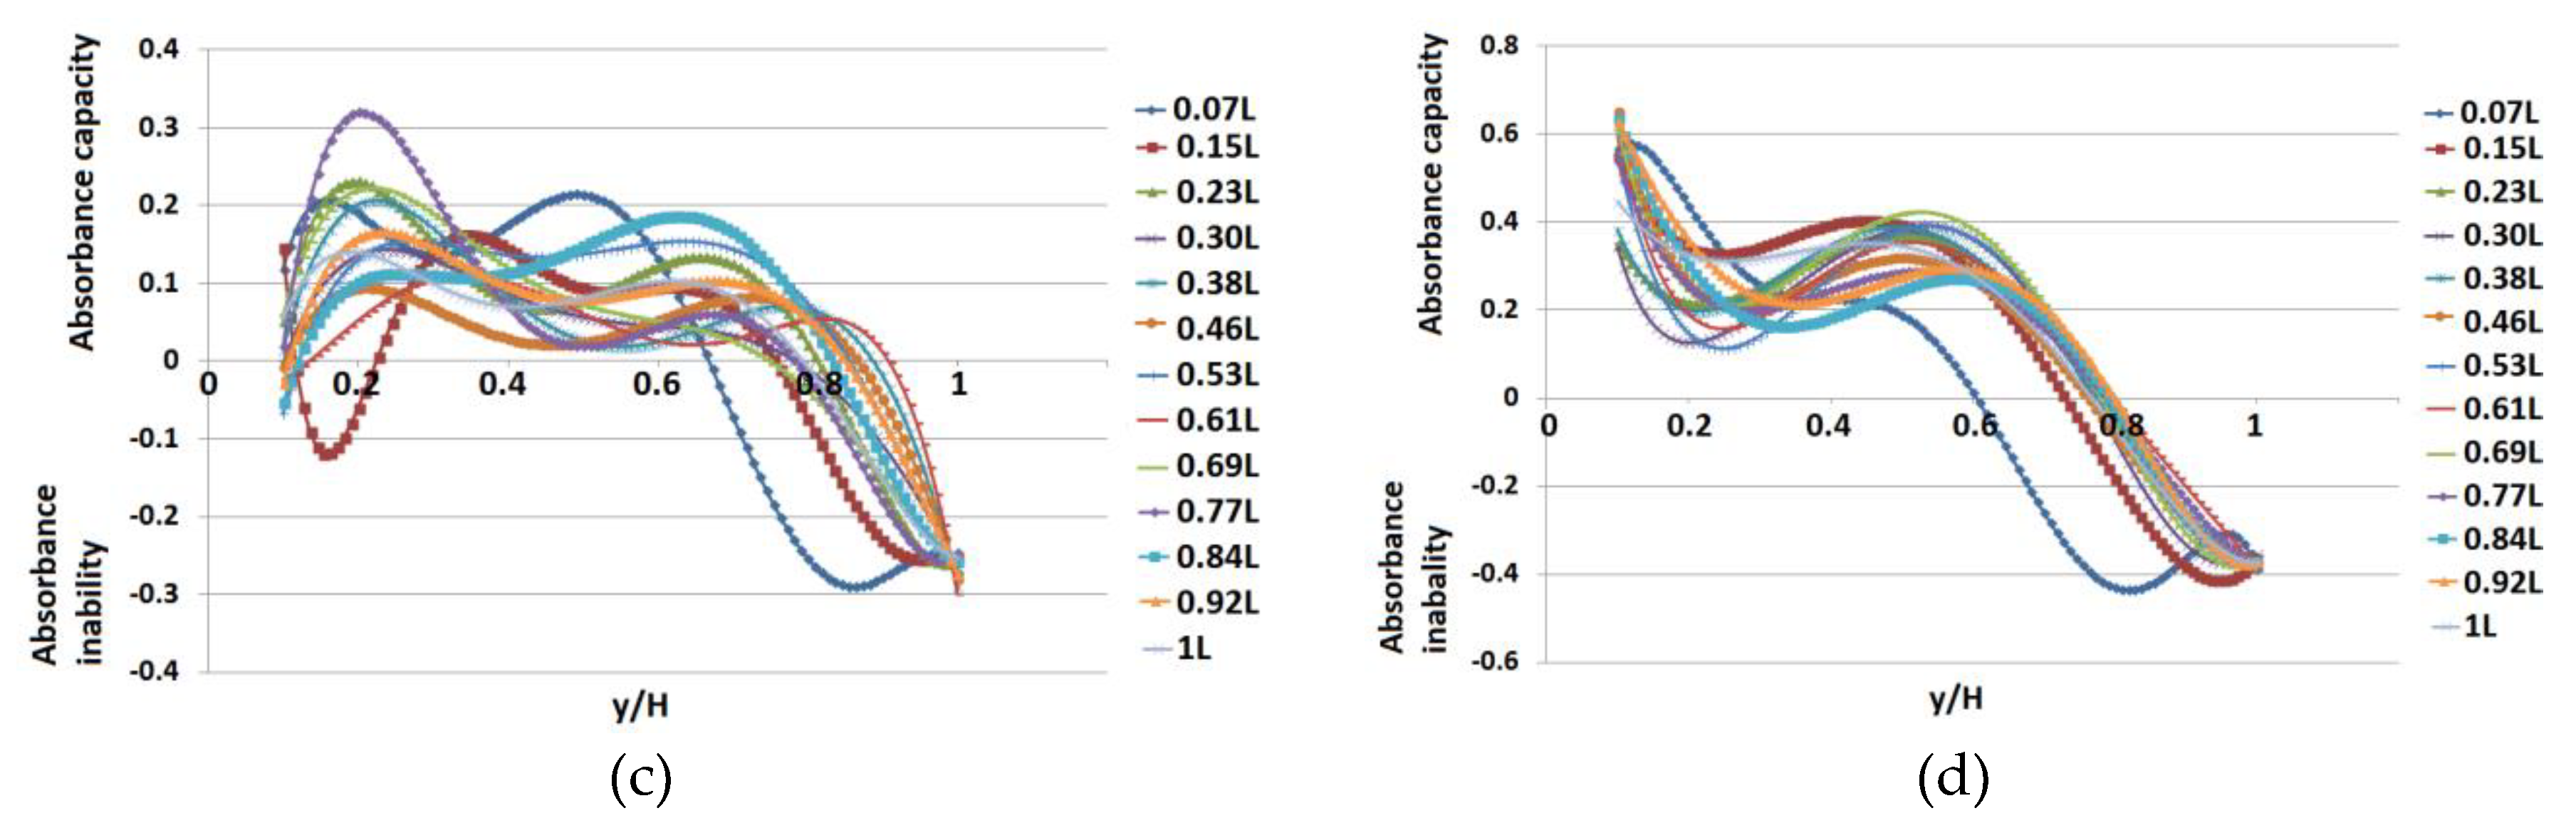
For the evaluation of the potential of the mixing process under different Vp/Vc ratios and inflow angles between the two streams, the concentration of the substances of the contaminated water was subtracted from the concentration of particles of the solution stream in each subdomain of the micromixer. In this way, the mixing process concentration flux inside the micromixer was evaluated. Concentration flux values above zero resulted in absorbance capacity due to increased particles concentration. On the other hand, concentration flux values below zero resulted in a disability in the absorbance of the substances of the contaminated water. The higher the value of the concentration above 0, the higher the amount of substances that can be absorbed in this region resulting in increased absorbance capacity. On the other hand the lower the values below 0 the larger the oversupply of substances of the contaminated water resulting in absorbance inability and thus more particles are needed for the absorbance of the substances.
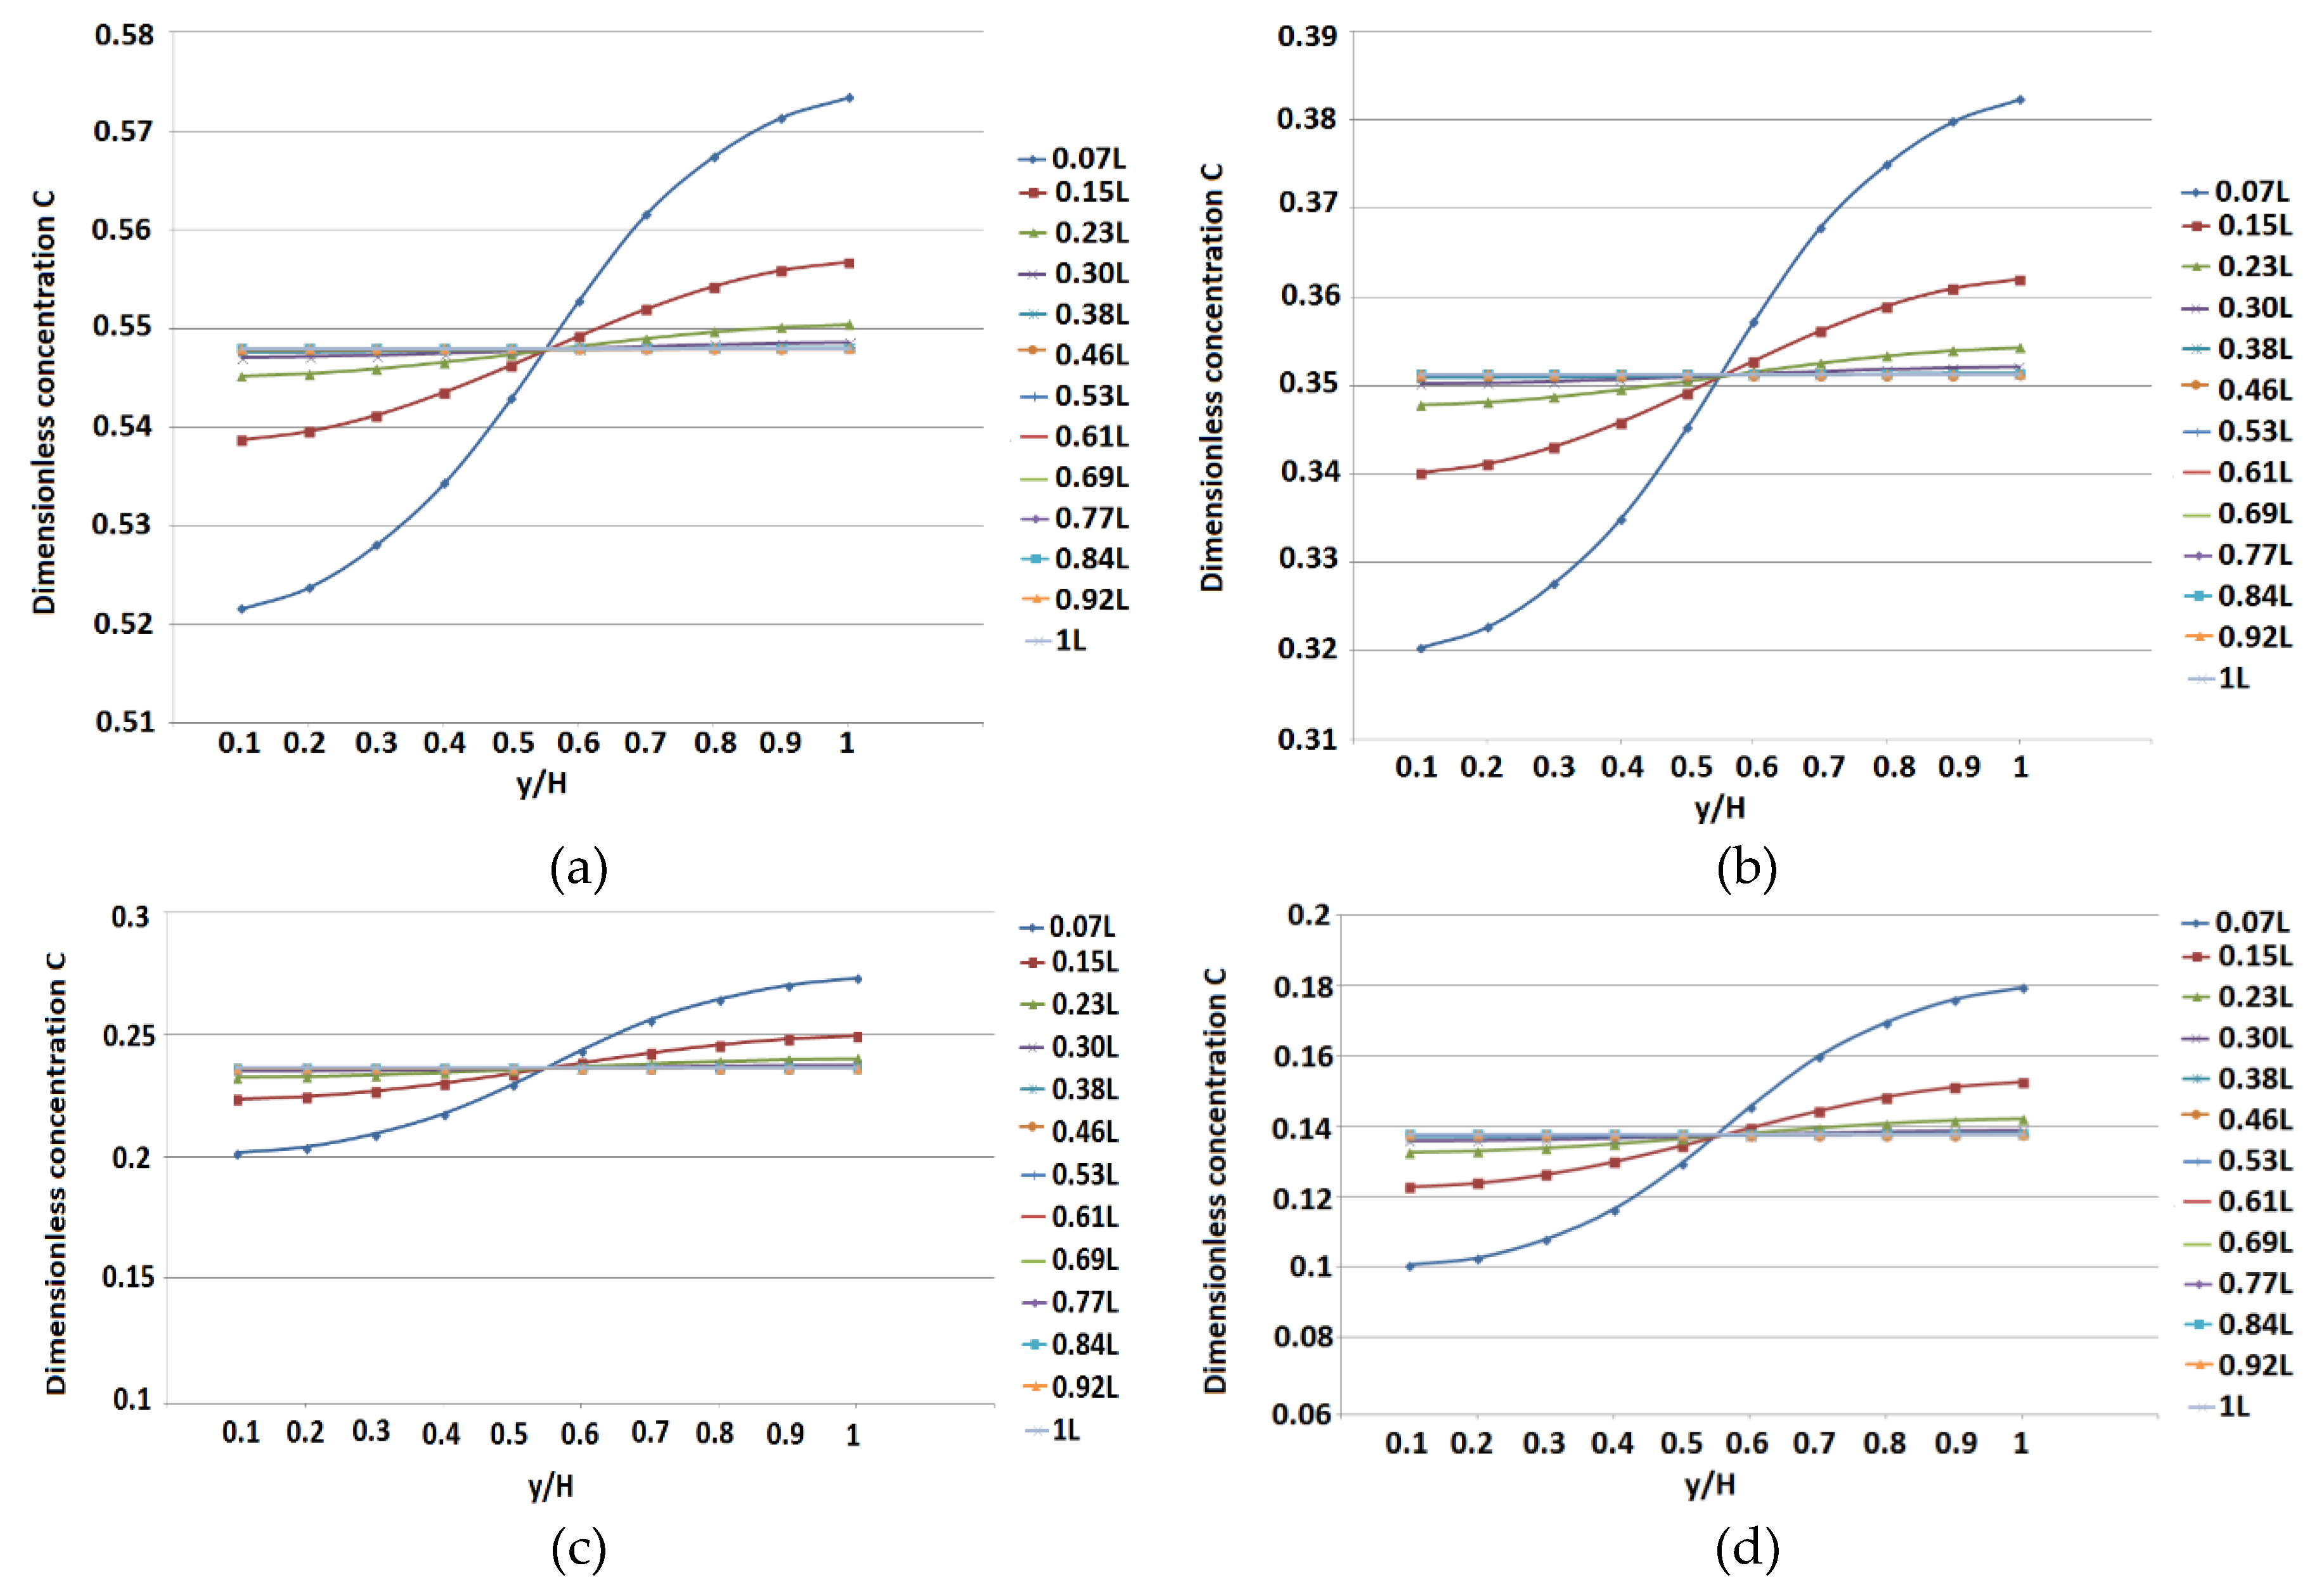
The effectiveness of the mixing process in the absorbance of the substances from the contaminated water in the micromixer device for different velocity ratios and for the representative case of is presented in Figure 4. The absorbance ability for various lengths and heights of the micromixer device is depicted in Figure 4.
Small velocity ratios led to high absorbance of particles only in the lower part of the micromixer device, as is shown in Figure 4a, since the majority of particles were accumulated in the regions for which . In this region, there was an oversupply of particles, and thus high absorbance capacity was observed, as is depicted in Figure 4a. On the other hand, for , no particles could be found, and this led to absorbance inability. The same profile of the absorbance was addressed across the length of the micromixer device.
As the velocity ratio increased, the profile of the absorbance of substances was modified (Figure 4b). In this case, for , significant absorbance of substances was addressed across the length of the device and for heights . In 20% of the micromixer device, absorbance inability was observed due to the lack of particles. This area was located in the upper part of the device and for heights (Figure 4b).
When , a completely new profile for the absorbance of substances was observed, and the corresponding absorbance capacity across the length of the device is presented in Figure 4c. In addition, in some areas of the device, for example, and , absorbance capacity was observed for (Figure 4c). For x = 0.07L, the absorbance inability in the upper 40% of the height of the micromixer device is presented in Figure 4c.
A similar absorbance profile was illustrated for the . For example, absorbance inability was observed for and of the micromixer device. In addition, for x=0.84L, absorbance capacity was observed for . The absorbance capacity varied across the micromixer device due to high velocity ratio. The velocity of the mixture was responsible for these differences.
The increase of the led to absorbance capacity across the length and the height of the micromixer device compared to low values of . However, the absorbance capacity particles were spread on the micromixer device. For this reason, the concentration value was getting closer to zero as the increased (Figure 4).
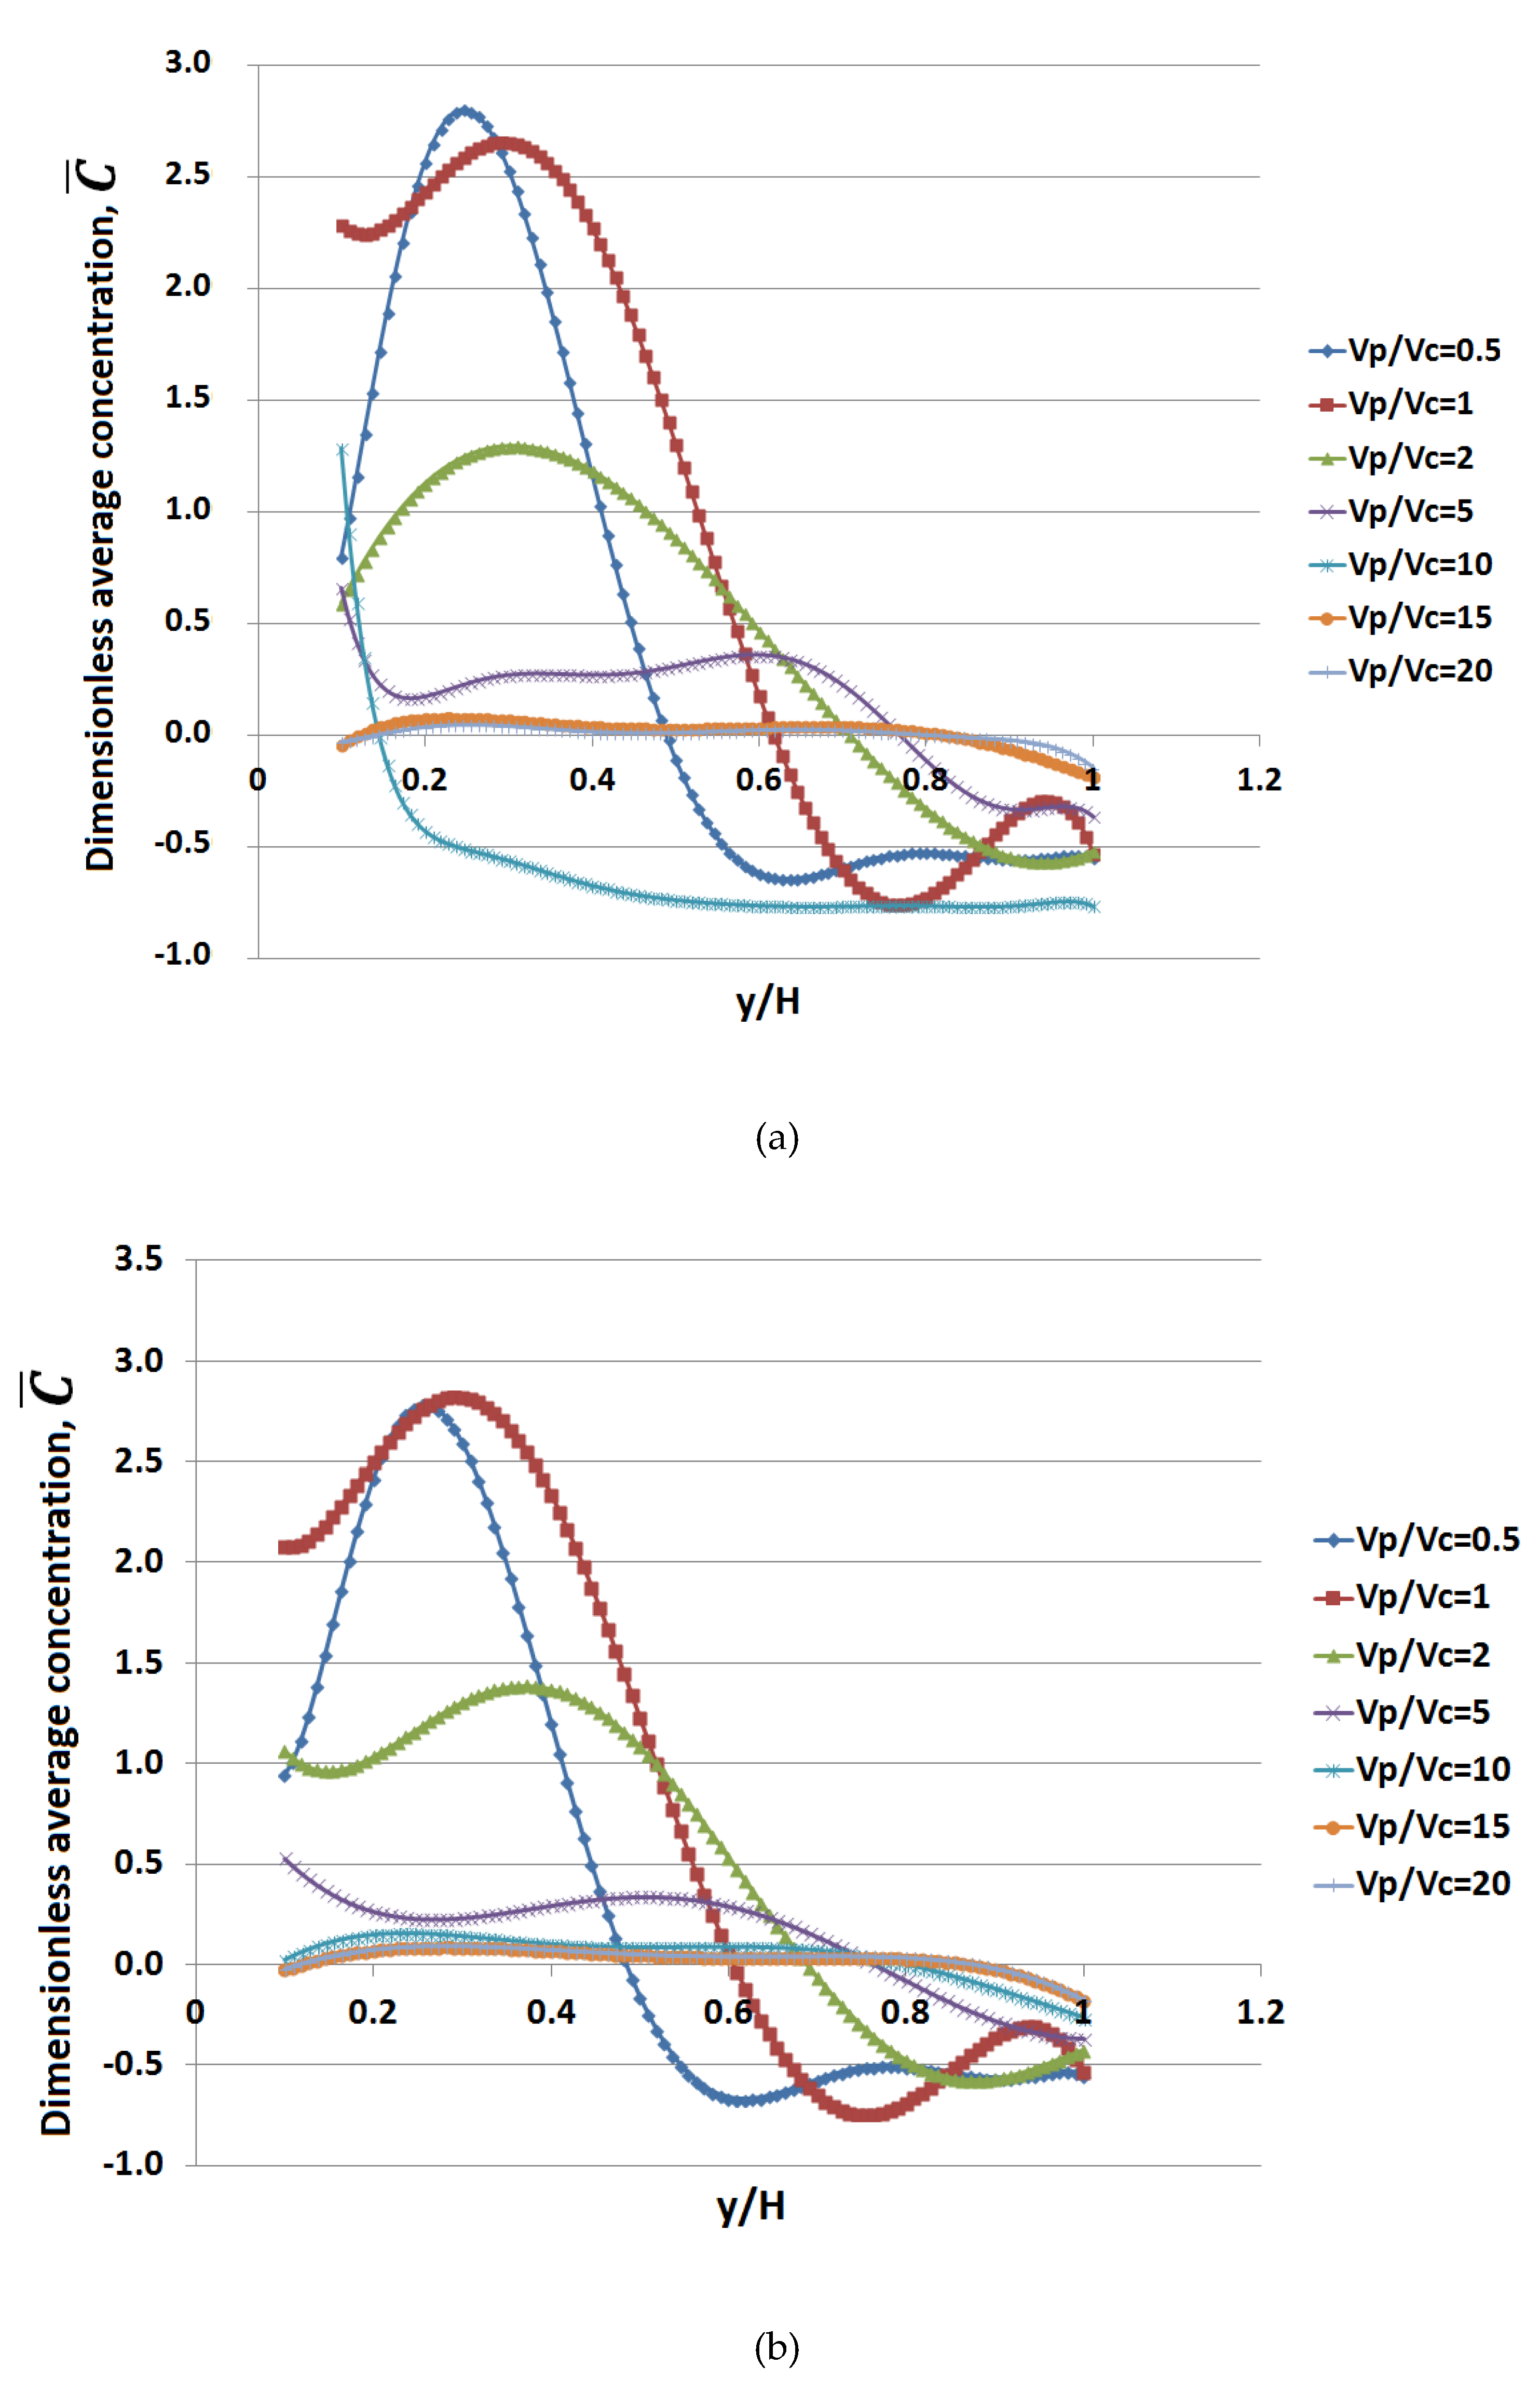
For the calculation of the mean absorbance capacity and the inability of the substances, the height of the duct H was divided into 10 equal layers. The average dimensionless concentration, that resulted from the subtraction of the concentration of particles and the concentration of the substances of the contaminated water across the length of the micromixer device is presented in Figure 5 for all the angles between the streams of the contaminated water and the particles solution, as well as all the velocity ratios between the two streams that were simulated in this study.
The velocity ratio between the two streams seemed to have a significant effect in the mixing process of the particles with the substances of the contaminated water (Figure 5). In all simulated cases, low velocity ratios led to the accumulation of particles in the lower part of the micromixer device, where high absorbance capacity was presented since the concentration of particles was increased. When , the absorbance capacity was very high from the lower part to the middle of the micromixer device, , as is depicted in Figure 5a–c. The absorbance capacity then began falling, and absorbance inability was observed for since no particles were located in the higher parts of the device, i.e.,.
As the velocity ratio increased, absorbance capacity was observed in higher parts of the device, for example, when Vp/Vc = 2 and Vp/Vc = 5, absorbance capacity was observed for , respectively. As the velocity ratio increased further, Vp/Vc10, absorbance capacity was observed for of the micromixer device, as is depicted in Figure 5a–c. Absorbance inability in the higher part of the micromixer device was observed due to the lack of particles.
Higher velocity ratios led to absorbance ability for of the micromixer device. This caused the absorbance ability to uniformly minimize inside the device. The minimization of the absorbance rate was due to the spread of the particles in the whole device, since the flow rate of particles was kept constant in the particles’ solution ducts.
No significant differences were observed as the angle between the two streams increased, as is shown in Figure 5a–c.
4. Discussion
In the present study, the mixing of iron nanoparticles coated with absorbance substances with the contaminated water under different inlet velocity ratios and angles between the streams of the contaminated water and the particle solution was investigated. No external magnetic fields were used in this study.
It was found that the most significant parameter for efficiently mixing the particle solution and the contaminated water was the velocity ratio between the two streams. Under small velocity ratios, , the particles accumulated in the lower part of the micromixer device, and the efficiency of the mixing process was reduced significantly. The increase of the velocity ratio between the two streams improved the mixing efficiency, since the particles were distributed in larger parts inside the micromixer device. When the velocity ratio was above , the particles were uniformly distributed in the micromixer device and could absorb the substances of the contaminated water for . As the velocity ratio, , between the two streams increased, the concentration of the substances of the contaminated water decreased due to the increasing flow rate of the particle solution. Therefore, a lower quantity of particles was needed to absorb the substances. The increasing velocity ratio, , led to uniform absorbance capacity in the micromixer device. Only the higher part of the device presented absorbance inability, since no particles were located in this area of the micromixer. The lack of particles in this domain of the device was due to the streamlines of the flow. The increasing velocity ratio, , led to uniform absorbance capacity in the micromixer device. Only the higher part of the device presented absorbance inability, since no particles were located in this area of the micromixer. The lack of particles in this domain of the device was due to the streamlines of the flow.
The results of the present study are very promising compared to other studies using external magnetic fields for the mixing procedure [34,35]. In the case that no magnetic field was applied, results were completely different, since no mixing between the two streams was observed [34,35]. The differences were caused by the shape of the simulated geometries (i.e., T shaped in [34], straight duct in [35], and Y shaped in the present study). Additionally, in our study, the angle between the two streams did not affect the mixing process—at least for the simulated angles that were used here. It is of interest to note that the results from our study for Vp/Vc > 10 were similar to that of [34], where an external magnetic field was applied—except for a small area that was located in the upper part of the micromixer device. It seems that the ratio Vp/Vc in the inlet played an important role in the mixing efficiency and could replace, at this stage, the presence of external magnetic fields. The fact that a comparable efficiency in the mixing process could be obtained without the use of external forces is important, since the size, the design, and the cost of the micromixer devices could be minimized due to the lack of magnetic coils.
5. Conclusions
In the present study, we investigated parameters affecting the efficiency of mixing the stream of water contaminated with impurities with the stream of water containing nanoparticles for the removal of impurities in a Y-shaped micromixer. Under different angles between the two streams, the contaminated water and the particles solution could be effectively mixed without the use of external forces. The velocity ratios between the two streams had a significant role in the mixing process. Under a small velocity ratio between the two streams, no significant mixing was observed. As the velocity ratio increased, the mixing efficiency was comparable to studies that used a magnetic field for the mixing of particles with the contaminated water. The angle between the streams did not seem to affect the mixing procedure, at least for the values studied here.
Higher velocities in the micromixer device lead to bigger devices because absorbance of the substances of the contaminated water is a time consuming process. Therefore, the velocity of the two streams must be very low. Although the flow rate inside the micromixer device must be very small, these devices are very small as well. As there is no need for external forces for the mixing of particles with the contaminated water, this micromixer can be used as a stand-alone device. In addition, the size and the weight of the micromixer can be minimized due to the absence of the magnetic coils. A combination of many such devices used simultaneously could result in significant flow rates necessary to cover large needs for water consumption.
Author Contributions
Conceptualization, I.S. and T.K.; methodology, I.S.; software, E.K.; validation, C.L., L.B.; formal analysis, E.K.; investigation, C.L.; resources, I.S.; data curation, L.B. writing—original draft preparation, E.K.; writing—review and editing, I.S. and T.K.; visualization, E.K.; supervision, I.S.; project administration, I.S.; funding acquisition, T.K.
Funding
This research received no external funding.
Conflicts of Interest
The authors declare no conflict of interest.
References
- Mohmood, I.; Lopes, C.B.; Lopes, I.; Ahmad, I.; Duarte, A.C.; Pereira, E. Nanoscale materials and their use in water contaminants removal—A review. Environ. Sci. Pollut. Res. 2013, 20, 1239–1260. [Google Scholar] [CrossRef] [PubMed]
- Foley, A.J.; DeFries, R.; Asner, G.P.; Barford, C.; Bonan, G.; Carpenter, S.R.; Chapin, F.S.; Coe, M.T.; Daily, G.C.; Gibbs, H.K.; et al. Global consequences of land use. Science 2005, 309, 570–574. [Google Scholar] [CrossRef] [PubMed]
- Coetser, S.E.; Heath, R.G.M.; Ndombe, N. Diffuse pollution associated with the mining sectors in South Africa: A first-order assessment. Water Sci. Technol. 2007, 55, 9–16. [Google Scholar] [CrossRef]
- Sprenger, C.; Lorenzen, G.; Hülshoff, I.; Grützmacher, G.; Ronghang, M.; Pekdeger, A. Vulnerability of bank filtration systems to climate change. Sci. Total Environ. 2011, 409, 655–663. [Google Scholar] [CrossRef]
- Delpla, I.; Baurès, E.; Jung, A.V.; Clement, M.; Thomas, O. Issues of drinking water quality of small scale water services towards climate change. Water Sci. Technol. 2011, 63, 227–232. [Google Scholar] [CrossRef] [Green Version]
- Iaccarino, M. Water, population growth and contagious diseases. Water 2019, 11, 386. [Google Scholar] [CrossRef]
- Falcone, I.R.; Humpage, A.R. Health risk assessment of cyanobacterial (blue-green algal) toxins in drinking water. Int. J. Environ. Res. Public Health 2005, 2, 43–50. [Google Scholar] [CrossRef]
- Rozell, D.J.; Reaven, S.J. Water pollution risk associated with natural gas extraction from the marcellus shale. Risk Anal. 2011, 32, 1382–1393. [Google Scholar] [CrossRef]
- Wu, H.; Zhang, J.; Ngo, H.H.; Guo, W.; Hu, W.; Liang, S.; Fan, J.; Liu, H. A review on the sustainability of constructed wetlands for wastewater treatment: Design and operation. Bioresour. Technol. 2015, 175, 594–601. [Google Scholar] [CrossRef] [PubMed]
- Gorgoglione, A.; Torretta, V. Sustainable management and successful application of constructed wetlands: A critical review. Sustainability 2018, 10, 3910. [Google Scholar] [CrossRef]
- Zhai, R.; Wan, Y.; Liu, L.; Zhang, X.; Wang, W.; Liu, J.; Zhang, B. Hierarchical MnO2 nanostructures: Synthesis and their application in water treatment. Water Sci. Technol. 2012, 65, 1054–1059. [Google Scholar] [CrossRef] [PubMed]
- Bottero, J.Y.; Rose, J.; Wiesner, M.R. Nanotechnologies: Tools for sustainability in a new wave of water treatment processes. Integr. Environ. Assess. Manag. 2009, 2, 391–395. [Google Scholar] [CrossRef]
- Warner, C.L.; Addleman, R.S.; Cinson, A.D.; Droubay, T.C.; Engelhard, M.H.; Nash, M.A.; Yantasee, W.; Warner, M.G. High-performance, superparamagnetic, nanoparticle-based heavy metal sorbents for removal of contaminants from natural waters. ChemSusChem 2010, 3, 749–757. [Google Scholar] [CrossRef]
- Chen, L.; Wang, T.; Tong, J. Application of derivatized magnetic materials to the separation and the preconcentration of pollutants in water samples. TrAC Trends Anal. Chem. 2011, 30, 1095–1108. [Google Scholar] [CrossRef]
- Sanchez, A.; Recillas, S.; Font, X.; Casals, E.; González, E.; Puntes, V. Ecotoxicity of, and remediation with, engineered inorganic nanoparticles in the environment. TrAC Trends Anal. Chem. 2011, 30, 507–516. [Google Scholar] [CrossRef] [Green Version]
- Li, F.B.; Li, X.Z.; Liu, C.S.; Liu, T.X. Effect of alumina on photocatalytic activity of iron oxides for bisphenol A degradation. J. Hazard. Mater. 2007, 149, 199–207. [Google Scholar] [CrossRef] [PubMed] [Green Version]
- Daniel-da-Silva, A.L.; Lóio, R.; Lopes-da-Silva, J.A.; Trindade, T.; Goodfellow, B.J.; Gil, A.M. Effects of magnetite nanoparticles on the thermorheological properties of carrageenan hydrogels. J. Colloid Interface Sci. 2008, 324, 205–211. [Google Scholar] [CrossRef] [PubMed]
- Shen, Y.F. Preparation and application of magnetic Fe3O4 nanoparticles for wastewater purification. Sep. Purif. Technol. 2009, 68, 312–319. [Google Scholar] [CrossRef]
- Indira, T.K.; Lakshmi, P.K. Magnetic Nanoparticles—A Review. Int. J. Pharm. Sci. Nanotechnol. 2010, 3, 1035–1042. [Google Scholar]
- Guo, L.; Li, J.; Zhang, L.; Li, J.; Li, Y.; Yu, C.; Shi, J.; Ruan, M.; Feng, J. A facile route to synthesize magnetic particles within hollow mesoporous spheres and their performance as separable Hg2+ adsorbents. J. Mater. Chem. 2008, 18, 2733–2738. [Google Scholar] [CrossRef]
- Atia, A.A.; Donia, A.M.; El-Enein, S.A.; Yousif, A.M. Effect of Chain Length of Aliphatic Amines Immobilized on a Magnetic Glycidyl Methacrylate Resin towards the Uptake Behavior of Hg(II) from Aqueous Solutions. Sep. Sci. Technol. 2007, 42, 403–420. [Google Scholar] [CrossRef]
- Li, H.; Li, Z.; Liu, T.; Xiao, X.; Peng, Z.; Deng, L. A novel technology for biosorption and recovery hexavalent chromium in wastewater by bio-functional magnetic beads. Bioresour. Technol. 2008, 99, 6271–6279. [Google Scholar] [CrossRef] [PubMed]
- Sheha, R.R.; El-Zahhar, A.A. Synthesis of some ferromagnetic composite resins and their metal removal characteristics in aqueous solutions. J. Hazard. Mater. 2008, 150, 795–803. [Google Scholar] [CrossRef] [PubMed]
- Hu, J.; Chen, G.; Lo, I.M.C. Removal and recovery of Cr(VI) from wastewater by maghemite nanoparticles. Water Res. 2005, 39, 4528–4536. [Google Scholar] [CrossRef] [PubMed]
- Hu, J.-S.; Ren, L.L.; Guo, Y.G.; Liang, H.P.; Cao, A.M.; Wan, L.J.; Bai, C.L. Mass Production and High Photocatalytic Activity of ZnS Nanoporous Nanoparticles. Angew. Chem. Int. Ed. 2005, 44, 1269–1273. [Google Scholar] [CrossRef]
- Borai, E.H.; El-Sofany, E.A.; Morcos, T.N. Development and optimization of magnetic technologies based processes for removal of some toxic heavy metals. Adsorption 2007, 13, 95–104. [Google Scholar] [CrossRef]
- Huang, C.; Hu, B. Silica-coated magnetic nanoparticles modified with γ-mercaptopropyltrimethoxysilane for fast and selective solid phase extraction of trace amounts of Cd, Cu, Hg, and Pb in environmental and biological samples prior to their determination by inductively coupled plasma mass spectrometry. Spect. Acta Part. B Atomic Spectrosc. 2008, 63, 437–444. [Google Scholar]
- Shin, S.; Jang, J. Thiol containing polymer encapsulated magnetic nanoparticles as reusable and efficiently separable adsorbent for heavy metal ions. Chem. Commun. 2007, 41, 4230–4232. [Google Scholar] [CrossRef]
- Karvelas, E.G.; Lampropoulos, N.K.; Karakasidis, T.E.; Sarris, I.E. A computational tool for the estimation of the optimum gradient magnetic field for the magnetic driving of the spherical particles in the process of cleaning water. Desalin. Water Treat. 2017, 99, 27–33. [Google Scholar] [CrossRef]
- Persson, J.; Wittgren, H.B. How hydrological and hydraulic conditions affect performance of ponds. Ecol. Eng. 2003, 21, 259–269. [Google Scholar] [CrossRef] [Green Version]
- Ranieri, E.; Gorgoglione, A.; Montanaro, C.; Iacovelli, A.; Gikas, P. Removal capacity of BTEX and metals of constructed wetlands under the influence of hydraulic conductivity. Desalin. Water Treat. 2015, 56, 1256–1263. [Google Scholar] [CrossRef]
- Hajiani, P.; Larachi, F. Magnetic-field assisted mixing of liquids using magnetic nanoparticles. Chem. Eng. Process. 2014, 84, 31–37. [Google Scholar] [CrossRef]
- Le, T.N.; Suh, Y.K.; Kang, S. Efficient Mixing in Microchannel by using Magnetic Nanoparticles. Int. J. Math. Models Methods Appl. Sci. 2009, 3, 58–67. [Google Scholar]
- Cao, Q.; Han, X.; Li, L. An active microfluidic mixer utilizing a hybrid gradient magnetic field. Int. J. Appl. Electomagn. Mech. 2015, 47, 583–592. [Google Scholar] [CrossRef]
- Wang, Y.; Zhe, J.; Chung, T.F.B.; Dutta, P. A rapid particle driven micromixer. Microfluid Nanofluid 2008, 4, 375–389. [Google Scholar] [CrossRef]
- Founiotis, N.T.; Horsch, G.M.; Lefteriotis, G.A. On the hydrodynamic geometry of the flow-through versus restricted lagoons. Water 2018, 10, 237. [Google Scholar] [CrossRef]
- Karvelas, E.G.; Liosis, C.; Karakasidis, T.; Sarris, I. Mixing of particles in Micromixers under different angles and Velocities of the incoming water. Proceedings 2018, 2, 577. [Google Scholar] [CrossRef]
- Karvelas, E.G.; Lampropoulos, N.K.; Sarris, I.E. A numerical model for aggregations formation and magnetic driving of spherical particles based on OpenFOAM®. Comput. Methods Progr. Biomed. 2017, 142, 21–30. [Google Scholar] [CrossRef]
- Tijskens, E.; Ramon, H.; Baerdemaeker, J. Discrete element modelling for process simulation in agriculture. J. Sound Vib. 2003, 266, 493–514. [Google Scholar] [CrossRef]
Figure 1.
Micromixer geometry of the Y-shaped square duct and water-particles inlet and outlet flow directions. θ is the angle between the two inlet ducts [37].
Figure 1.
Micromixer geometry of the Y-shaped square duct and water-particles inlet and outlet flow directions. θ is the angle between the two inlet ducts [37].

Figure 2.
Streamlines (left) and snapshots of the particles positions (right) for θ = 60° and (a,b) Vp/Vc = 0.5, (c,d) Vp/Vc = 10, and (e,f) Vp/Vc = 20.
Figure 2.
Streamlines (left) and snapshots of the particles positions (right) for θ = 60° and (a,b) Vp/Vc = 0.5, (c,d) Vp/Vc = 10, and (e,f) Vp/Vc = 20.


Figure 3.
Concentration of substances of the contaminated water for the representative case of θ = 45° for (a) Vp/Vc = 0.5, (b) Vp/Vc = 5, (c) Vp/Vc = 10, (d) Vp/Vc = 20.
Figure 3.
Concentration of substances of the contaminated water for the representative case of θ = 45° for (a) Vp/Vc = 0.5, (b) Vp/Vc = 5, (c) Vp/Vc = 10, (d) Vp/Vc = 20.

Figure 4.
Absorbance ability for the case of θ = 45° for different lengths and heights inside the micromixer device for (a) Vp/Vc = 0.5, (b) Vp/Vc = 5, (c) Vp/Vc = 10, (d) Vp/Vc = 20.
Figure 4.
Absorbance ability for the case of θ = 45° for different lengths and heights inside the micromixer device for (a) Vp/Vc = 0.5, (b) Vp/Vc = 5, (c) Vp/Vc = 10, (d) Vp/Vc = 20.


Figure 5.
Average concentration for different velocity ratios and for different cases, (a) θ = 30°, (b) θ = 45°, (c) θ = 60°.
Figure 5.
Average concentration for different velocity ratios and for different cases, (a) θ = 30°, (b) θ = 45°, (c) θ = 60°.


Table 1.
Computational grid for the investigated geometries.
| Dimensions of the Micromixer Geometry | Angle between Streams (θ) | Computational Grid for Each Angle |
|---|---|---|
| Length (L): 5×10⁻⁴ m | 30° | 76,720 |
| Height (H): 1×10⁻⁴ m | 45° | 74,600 |
| Width (W): 1×10⁻⁴ m | 60° | 76,140 |
Table 2.
Boundary conditions.
| Boundary | Velocity(U) (m/s) | Pressure(p) (pa) | Transport Scalar (φ) |
|---|---|---|---|
| Inlet of the contaminated water (Vc) | 0.001, 0.002 | zero gradient | 1 |
| Inlet of the particles solution (Vp) | 0.0001, 0.0002, 0.0005, 0.001, 0.0015, 0.002 | zero gradient | 0 |
| Outlet | zero gradient | 0 | zero gradient |
| Walls | 0 | zero gradient | zero gradient |
© 2019 by the authors. Licensee MDPI, Basel, Switzerland. This article is an open access article distributed under the terms and conditions of the Creative Commons Attribution (CC BY) license (http://creativecommons.org/licenses/by/4.0/).
Share and Cite
MDPI and ACS Style
Karvelas, E.; Liosis, C.; Benos, L.; Karakasidis, T.; Sarris, I. Micromixing Efficiency of Particles in Heavy Metal Removal Processes under Various Inlet Conditions. Water 2019, 11, 1135. https://doi.org/10.3390/w11061135
AMA Style
Karvelas E, Liosis C, Benos L, Karakasidis T, Sarris I. Micromixing Efficiency of Particles in Heavy Metal Removal Processes under Various Inlet Conditions. Water. 2019; 11(6):1135. https://doi.org/10.3390/w11061135
Chicago/Turabian StyleKarvelas, Evangelos, Christos Liosis, Lefteris Benos, Theodoros Karakasidis, and Ioannis Sarris. 2019. "Micromixing Efficiency of Particles in Heavy Metal Removal Processes under Various Inlet Conditions" Water 11, no. 6: 1135. https://doi.org/10.3390/w11061135
Note that from the first issue of 2016, this journal uses article numbers instead of page numbers. See further details here.