Review

Nitrogen in Water-Portugal and Denmark: Two Contrasting Realities

1
School of Agriculture, University of Lisbon, LEAF—Linking Landscape, Environment, Agriculture and Food, Tapada da Ajuda, 1349-017 Lisbon, Portugal
2
Department of Biosciences, University of Aarhus, Vejlsovej 25, 8600 Silkeborg, Denmark
3
Centre for Ecology & Hydrology, Edinburgh, Bush Estate, Penicuik, Midlothian EH26 0QB, UK
*
Author to whom correspondence should be addressed.
Water 2019, 11(6), 1114; https://doi.org/10.3390/w11061114
Submission received: 11 March 2019 / Revised: 30 April 2019 / Accepted: 4 May 2019 / Published: 28 May 2019
(This article belongs to the Special Issue Innovation Issues in Water, Agriculture and Food)

Abstract

:
Agricultural activities are responsible for most of the nitrogen (N) inputs that degrade water quality. To elucidate the drivers leading to N pressures on water, we examined the resulting state of surface waters in terms of N concentrations, the impact of this on water quality status and policy responses to these constraints across different climatic and management conditions. Portugal and Denmark were chosen as contrasting case studies for the Driver-Pressure-State-Impact-Response (DPSIR) analysis. Our results showed reductions of 39% and 25% in the use of mineral fertilizer in Portugal and Denmark, respectively, between 2000 and 2010. The N surplus in Portugal varied between 15 and 30 kg N ha−1 between 1995 and 2015. In Denmark, in 2015, this amount was 70 kg N ha−1, representing a 53% decrease from the 1990 value. The average amount of total N discharged to surface waters was 7 kg ha−1 for mainland Portugal in 2015 and 14.6 kg ha−1 for Denmark in 2014. These reductions in the N surplus were attributed to historical policies aimed at N pressure abatement. In Denmark, N losses are expected to decline further through the continuation or improvement of existing national action plans. In Portugal, they are expected to decline further due to the expansion of Nitrate Vulnerable Zones and the introduction of targeted policies aimed at improving N use efficiency and reducing losses to water.

1. Introduction

On many occasions, agriculture has been highlighted as a major contributor to nitrogen (N) pollution to water, although the livestock and urban sectors are important contributors as well. The low use efficiency of N applied as chemical fertilizers and manures leads to a N surplus that can be lost to ground and surface waters, reducing their quality and putting pressure onto receiving waterbodies [1]. Indeed, the European Environmental Agency [2] reported that pollution pressures from diffuse sources (especially agriculture) were affecting 30% to 50% of surface waters in the European Union (EU). However, the negative impacts of N inputs to water from agricultural sources vary across the EU due to significant spatial differences in climate, soil types, geology, topography, and agricultural management activities. In many cases, natural conditions determine land use, N attenuation and, hence, potential N losses [3]. European crop and livestock farms have increased their productivity in recent decades, contributing to the level water contamination by nitrates [4,5]. This is the case in the two countries under study, which have contrasting agricultural systems [6,7]. Agriculture accounts for approximately 47% of the land use in mainland Portugal [8] and about 60% in Denmark.
Denmark, one of the most intensively farmed countries in Europe [9], became aware at an early stage that nutrient emissions from diffuse sources, especially in agricultural areas, were causing algal blooms and promoting hypoxia in coastal waters [10,11]. Since 1985, the negative impacts of nutrient loads to water in Denmark have triggered a series of “nutrient action plans” such as the designation of the whole country as a Nitrate Vulnerable Zone (NVZ). These have significantly improved agricultural N use efficiency and reduced N leaching, even though animal production has increased [12].
In contrast, Portugal has extensive areas of its land (~86%) under agricultural use. However, the implementation of the Nitrates Directive (ND) was not translated into NVZ designation until 1998, with only 4% of the territory included by 2012. Local factors controlling nitrate leaching are the high temperatures during half of the year that promote the volatilization of N and reduce losses to water [13]. On the other hand, alternating dry and wet soil conditions stimulate soil organic matter mineralization and promote nitrate leaching from mineralized nitrogen compounds [14].
The main objective of this paper is to compare how the current N pressures may affect the environmental state and water quality in two contrasting countries, Portugal and Denmark. This paper also hypothesizes that different policies, and their implementation, have influenced agricultural N pressures and, consequently, the environmental condition of water and the effectiveness of various mitigation measures that have been implemented to reduce N losses from agriculture in both countries. Although knowledge exists already about water related environmental issues in Portugal and Denmark, there has been no focused comparison between these contrasting countries in terms of impacts on water quality and policy responses.

2. Materials and Methods

A brief description of the main differences between Denmark and Portugal, in terms of agriculture and livestock production, urban pressures, water monitoring systems, climate, policy responses, etc., is essential to understand better the causes of water quality degradation in each country. Figure 1 shows where the case studies, Portugal and Denmark, are in Europe, and the main differences between these countries are presented below. The data used for the analysis in each country was obtained from the respective National Statistics Institutions.

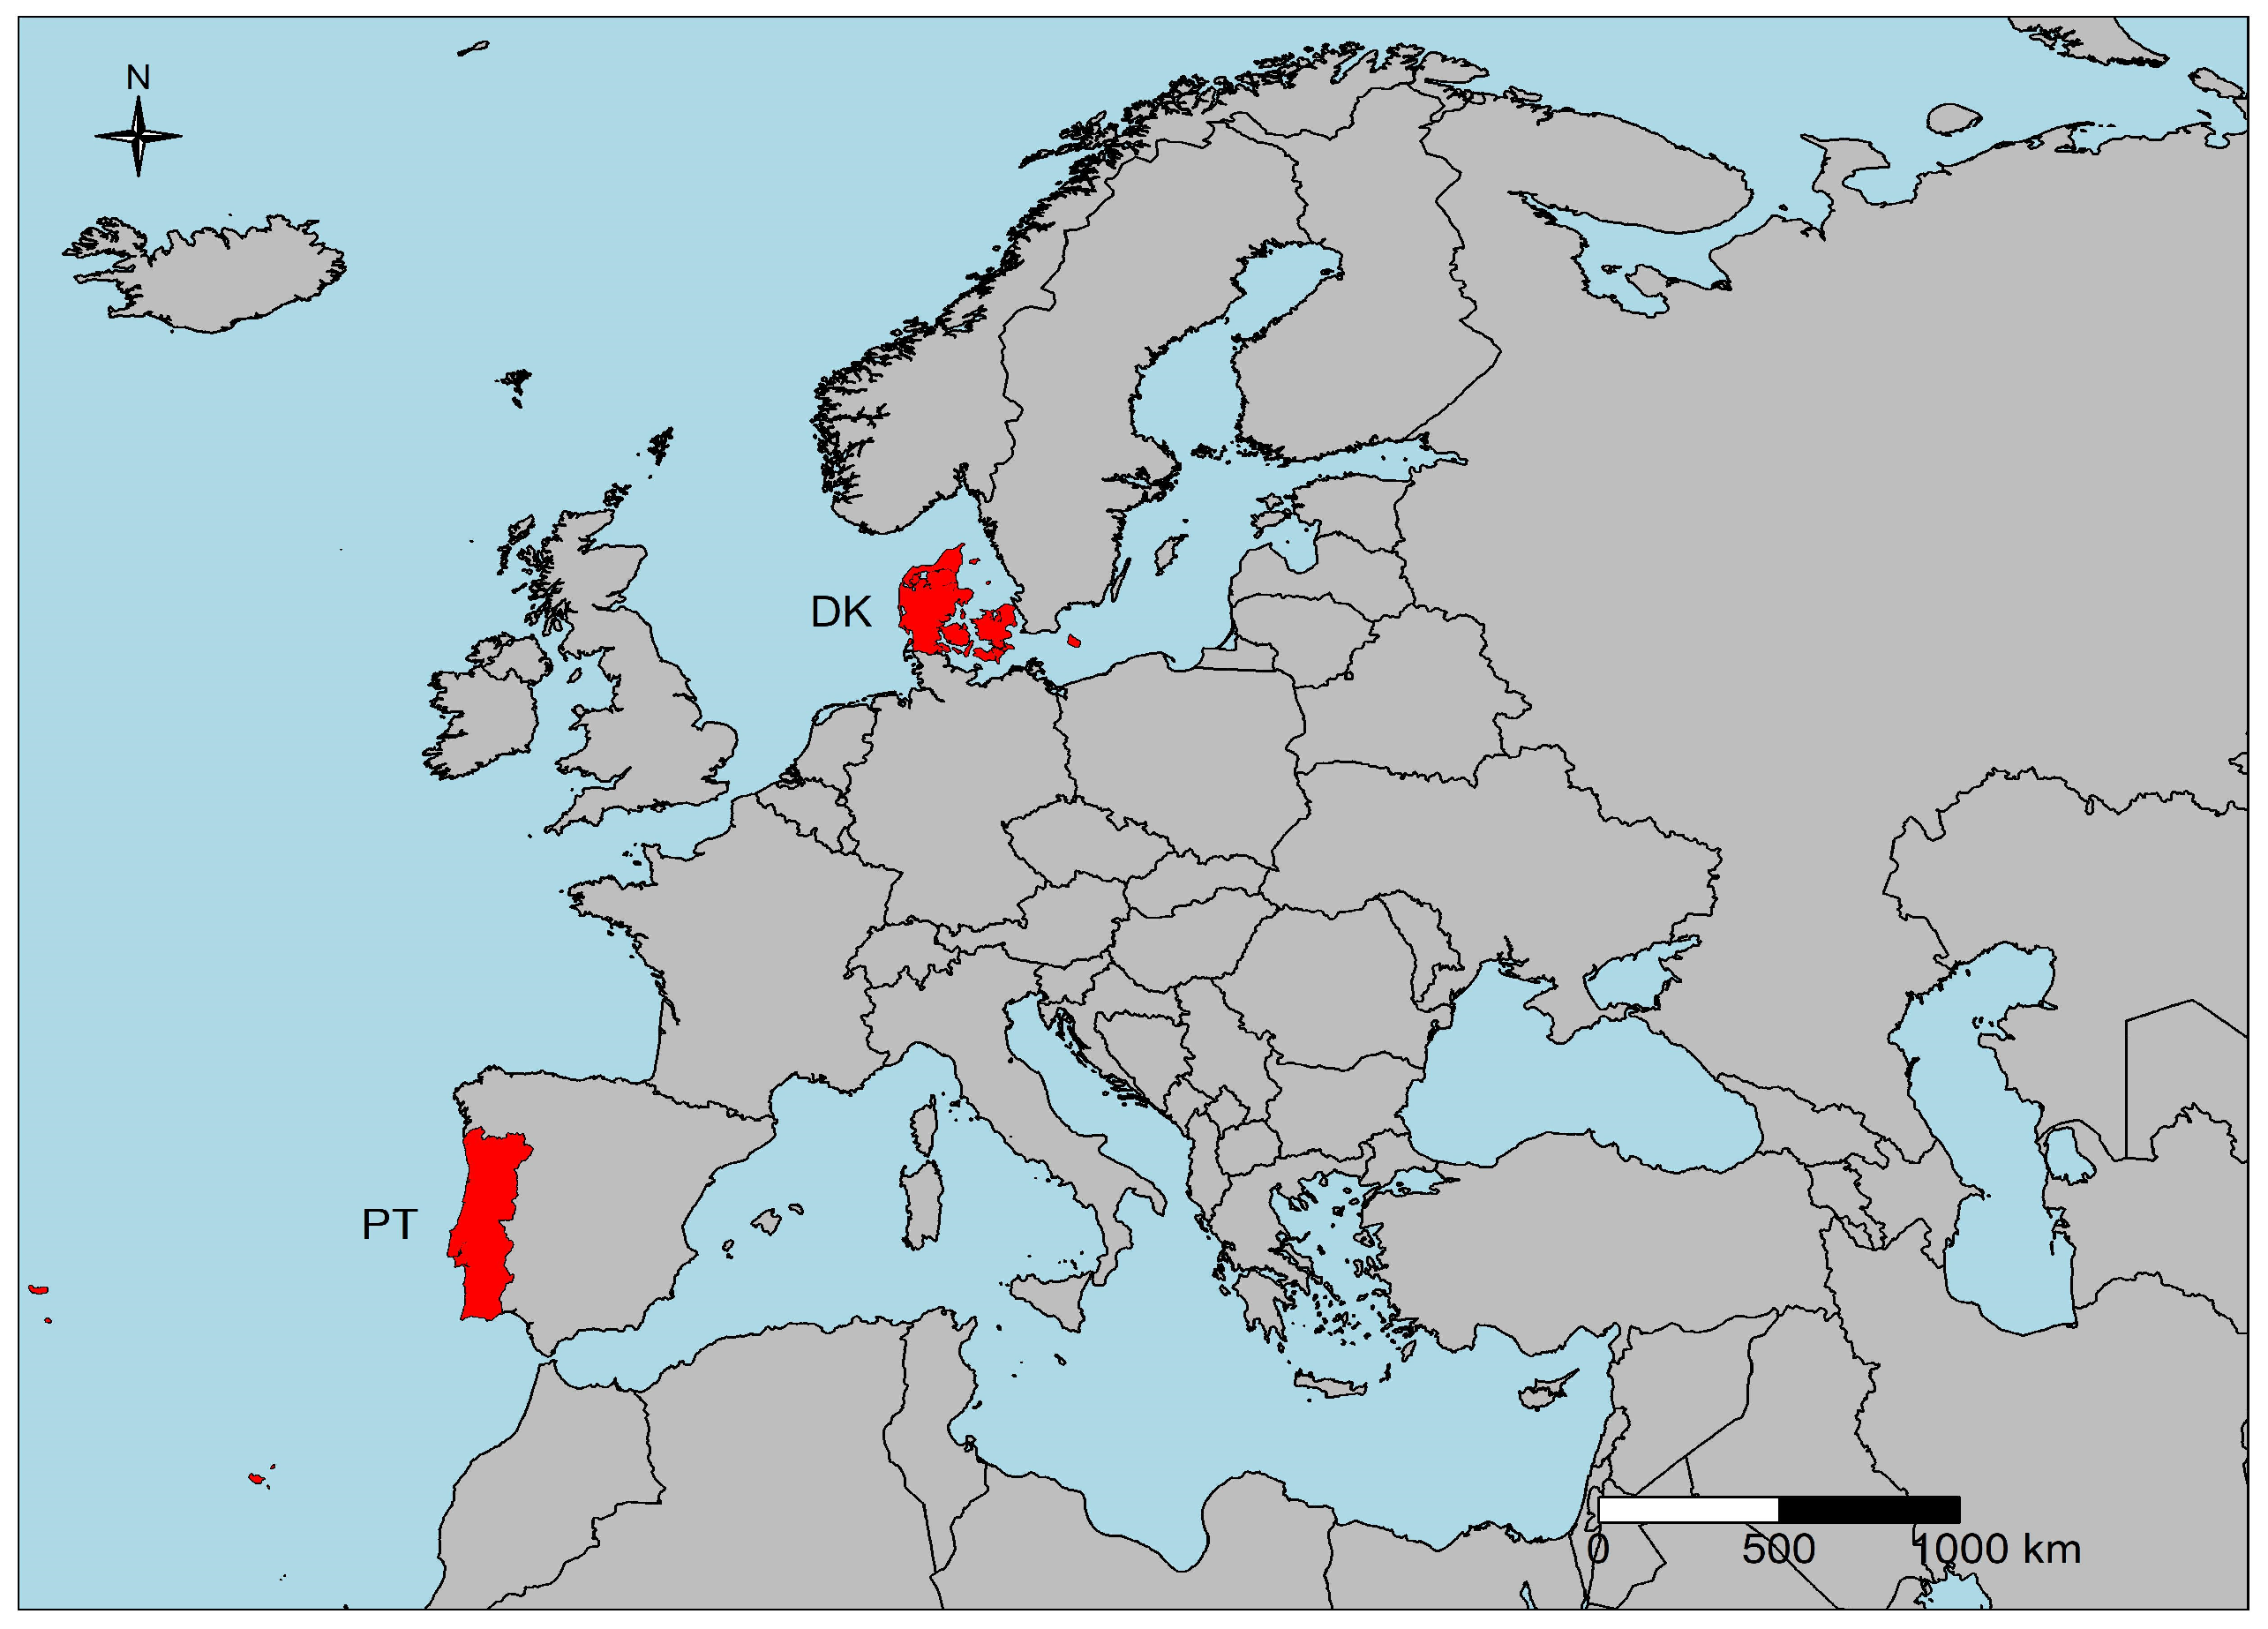
2.1. Site Study—Brief Characterization of the Countries

The mainland of Portugal (89,060 km2) is in the south-west of the Iberian Peninsula (Figure 1); it also has two major archipelagos, the Azores (2333 km2) and Madeira (801 km2). Only the mainland, which borders Spain (north and east) and the Atlantic Ocean (south and west), was considered in this study. A Mediterranean climate, characterized by hot, dry summers and cool, wet winters, is the dominant climatic type in this area. Land use is dominated by agriculture and agroforestry (44%), with the remaining area being covered by forests (34%), urban areas (4.7%), surface waters and wetlands (1.4%), pastures and other land uses (15.9%) [15]. The north and south of Portugal differ in terms of the complexity of their river networks, which are denser in the northern region due to the wetter climate and geology.
Denmark is in a coastal, temperate and humid part of northern Europe and covers an area of 43,100 km2 (Figure 1). Denmark consists, almost entirely, of sedimentary deposits, although the island of Bornholm, in the Baltic Sea, consists mainly of bedrock. It comprises 58 major catchments, each draining to a specific marine area. Runoff varies between 600 mm y−1 in the wet and sandy south-western part of the country and 150 mm y−1 in the drier and more clayey south-east [16]. According to the Danish Area Information System, land use is predominantly agricultural (67%, including pastures), while the remaining area includes a mixture of forests (12%), urban areas (7%), surface waters and wetlands (4%), and other land uses (10%) [17].
In both countries studied, agricultural activities include intensive and extensive systems, livestock production, and forestry. However, the importance of these activities varies between the countries. Although the two countries possess different geology, topography, and hydrology, they face similar problems in relation to declining water quality caused by N inputs from similar sources.

2.2. Nitrogen in Waterbodies

The pressures associated with excess N from different sources on the waterbodies within each country (PT and DK) were analyzed to understand surface water status. The impact of each N pressure on the waterbodies in each country was highlighted to identify the main drivers of the environmental state of water quality. For that, a review of the water monitoring network of each country was performed and an environmental assessment framework was adapted to analyze all the data collected from each country. Furthermore, the policy response to N water pollution was examined to understand better the success or failure of the mitigation measures implemented by each country. Both European and national scale measures were considered in this analysis.

2.2.1. Water Monitoring Network

Water quality was evaluated across a network of monitoring stations covering the entire EU28 territory, including Portugal and Denmark, in accordance with the related EU Directives. These data are used by the National Environmental Agencies of both countries to classify and document changes in the status of waterbodies under the rules of the Water Framework Directive (WFD). Monitoring of surface waters comprises common European rules of ecological, chemical, physical and hydro morphological variables to determine whether the quality objectives for the River Basin Management Plans (RBMPs) are being fulfilled and to document the effects of pressures, including those caused by N losses to water. Nitrogen contamination enters waterbodies from both diffuse and point sources.
The WFD mandates a “one out all out” approach; this means that if a waterbody fails on one parameter, it fails the overall water quality assessment. In addition to the mandatory monitoring, some countries, such as Denmark, have also implemented several country-specific assessment measures.
To understand better the condition of water bodies in relation to N pressures, it is crucial to know the size of the total N (TN) load that flows from the different parts of the catchment (urban, livestock and agriculture) to those water bodies. With this purpose, the water monitoring network related to N of each country was characterized and analyzed (Table 1).
In contrast to Denmark, in Portugal, TNC monitoring stations are not co-located with the hydrometric stations that conduct daily streamflow measurements. No specific TN determination is available for any monitoring station in Portugal (Table 1). The sampling frequency for each River Basin District (RBD) follows the guidelines established under the WFD: each water quality variable can range from continuous sampling to once every 6 years. Therefore, as Portugal does not have specialized stations for TN calculations, the loads discharged into receiving waters need to be estimated annually by the Portuguese Environment Agency (APA), to evaluate the real TNL and source of the N pressure into the waterbodies.
Denmark has organized monitoring stations (Table 1) where the real annual TN transport to the waterbodies is calculated using daily rates of discharge [19]. The daily discharge values from the hydrometric monitoring stations cover the whole range of agricultural land uses, soil types (sandy to loamy) and levels of precipitation (dry to wet) [20]. Point source loads are reported annually from individual sources, which are grouped into urban wastewater treatment plants (WWTP), industrial sources, sewer storm overflows, freshwater fish farms, and marine fish farms. Stream water samples are gathered at biweekly to monthly intervals at each monitoring station. Each water sample is analyzed, among other parameters, for TNC, NO3, NO2-N and NH4-N concentrations, in accordance with Danish standards. The ecological condition of Danish waterbodies is evaluated annually by the competent Official Body of Denmark, using the monitoring data on stream biological status and the calculated indices for macroinvertebrates, fish and macrophytes [21,22].

2.2.2. Driver-Pressure-State-Impact-Response (DPSIR) Framework

An adapted Driver-Pressure-State-Impact-Response (DPSIR) environmental framework [23] was used to perform a general analysis of the data collected from the two countries, regarding the effect of N to water quality (Table 2). This novel comparison helps us to understand how different pressures, under different conditions, respond to similar policy application measures. In this analysis, the main driving forces and pressures responsible for the quality of waterbodies and its impacts (number of eutrophic areas/areas at risk of becoming eutrophic), and any current mitigation measures (e.g., NVZs and EU-27), were identified. A comprehensive set of indicators was defined to facilitate the discussion. For some of these indicators, the data collected were used to build maps and graphics so that the differences between Portugal and Denmark could be compared.
Data on Driver and Pressure indicators (Table 2) were extracted from Eurostat [24,25,26,27,28,29,30,31] for both countries and the EU. The gross N balance was usually estimated from N inputs (mineral and organic) and atmospheric deposition (in harvested crops and grazing). These values provided an indication of the potential N surplus on agricultural land and, consequently, the potential N losses responsible for the contamination and quality degradation of water.
In Portugal, data on TNL from agriculture, livestock production and urban sectors to waterbodies were collected from the RBMPs submitted to the EU Commission by APA in 2015 [6]. APA calculated these loads using N export coefficients and national scale statistics on crops, livestock, and urban population. The TNC (mg N L−1) in the Portuguese waterbodies were obtained from the National Water Resources Information System database [18]. Data from the five most downstream water quality monitoring stations in each RBD were selected to provide TNC for the period 2010–2015.
In Denmark, data on N leaching and N discharges from point sources, and loads to surface waters, were obtained from the national monitoring program of the aquatic environment [7,19]. Data on the TNL from Danish catchments to coastal waters were collected from Danish statistics, Denmark’s Miljøportal [32]. The Danish Environmental Agency determines the TNL by source, mobilization, attenuation, and transport pathways between the source and the receiving water. The impact on waterbodies translates into a status classification with which water quality was assessed with official data from the RBMPs in the case of Portugal [6] and from water monitoring for Denmark [7,19].
Response to the impacts is translated into policies and legislation. One of the most important policies relating to N is the ND [33], which gave birth to the creation of NVZ [34] in EU countries, using different national approaches. Information about NVZs was collected from Portuguese [6,35] and Danish legislation [12], and from Eurostat and the European Environment Agency (EEA) for EU data [34,36].
For wastewater treatment, data was collected from APA for Portugal [6], from Denmark’s Miljøportal [32], Wiberg-Larsen et al. [19] and Danish Nature Agency [37] for Denmark, and from EEA [2,38] for EU.
Management practices implemented by each country, regarding N water pollution, were compared and highlighted. To analyze the success or failure of the mitigation measures implemented by each country, historical N surplus levels and TNC were analyzed.
N surplus data were collected from APA [6] and Cameira et al. [39] for Portugal and from Blicher-Mathiesen et al. [40] for Denmark.

2.3. Uncertainties and Shortcoming of the Study

Although we believe this study to be useful in comparing how two different water management systems operate and produce results for use in both countries, there are some uncertainties. Data were not collected in similar ways in both countries, despite the mandatory regulations and procedures from the European Union with which Portugal and Denmark must comply. Besides the mandatory measures imposed at European level, each country has different local characteristics that benefit from different approaches to water quality monitoring. Denmark is particularly prolific in what concerns environmental legislation to protect water quality, contrary to Portugal that relies almost exclusively on adapted European legislation. There was no available data for the same years in both countries so, the data considered for analysis belongs to the closest dates possible. Nevertheless, the procedures in each country regarding the adoption of the mandatory EU regulations, accompanied by national measures will allow evaluating the efficacy of such policies.

3. Results and Discussion

Table 2 shows the outputs of the DPSIR framework analysis [23], with a set of indicators focused on agricultural and N management in Portugal and Denmark. This information provides the basis for the discussion in the subsections below regarding the steps in the DPSIR chain (Driving Forces, Pressures, States, Impacts, and Responses).

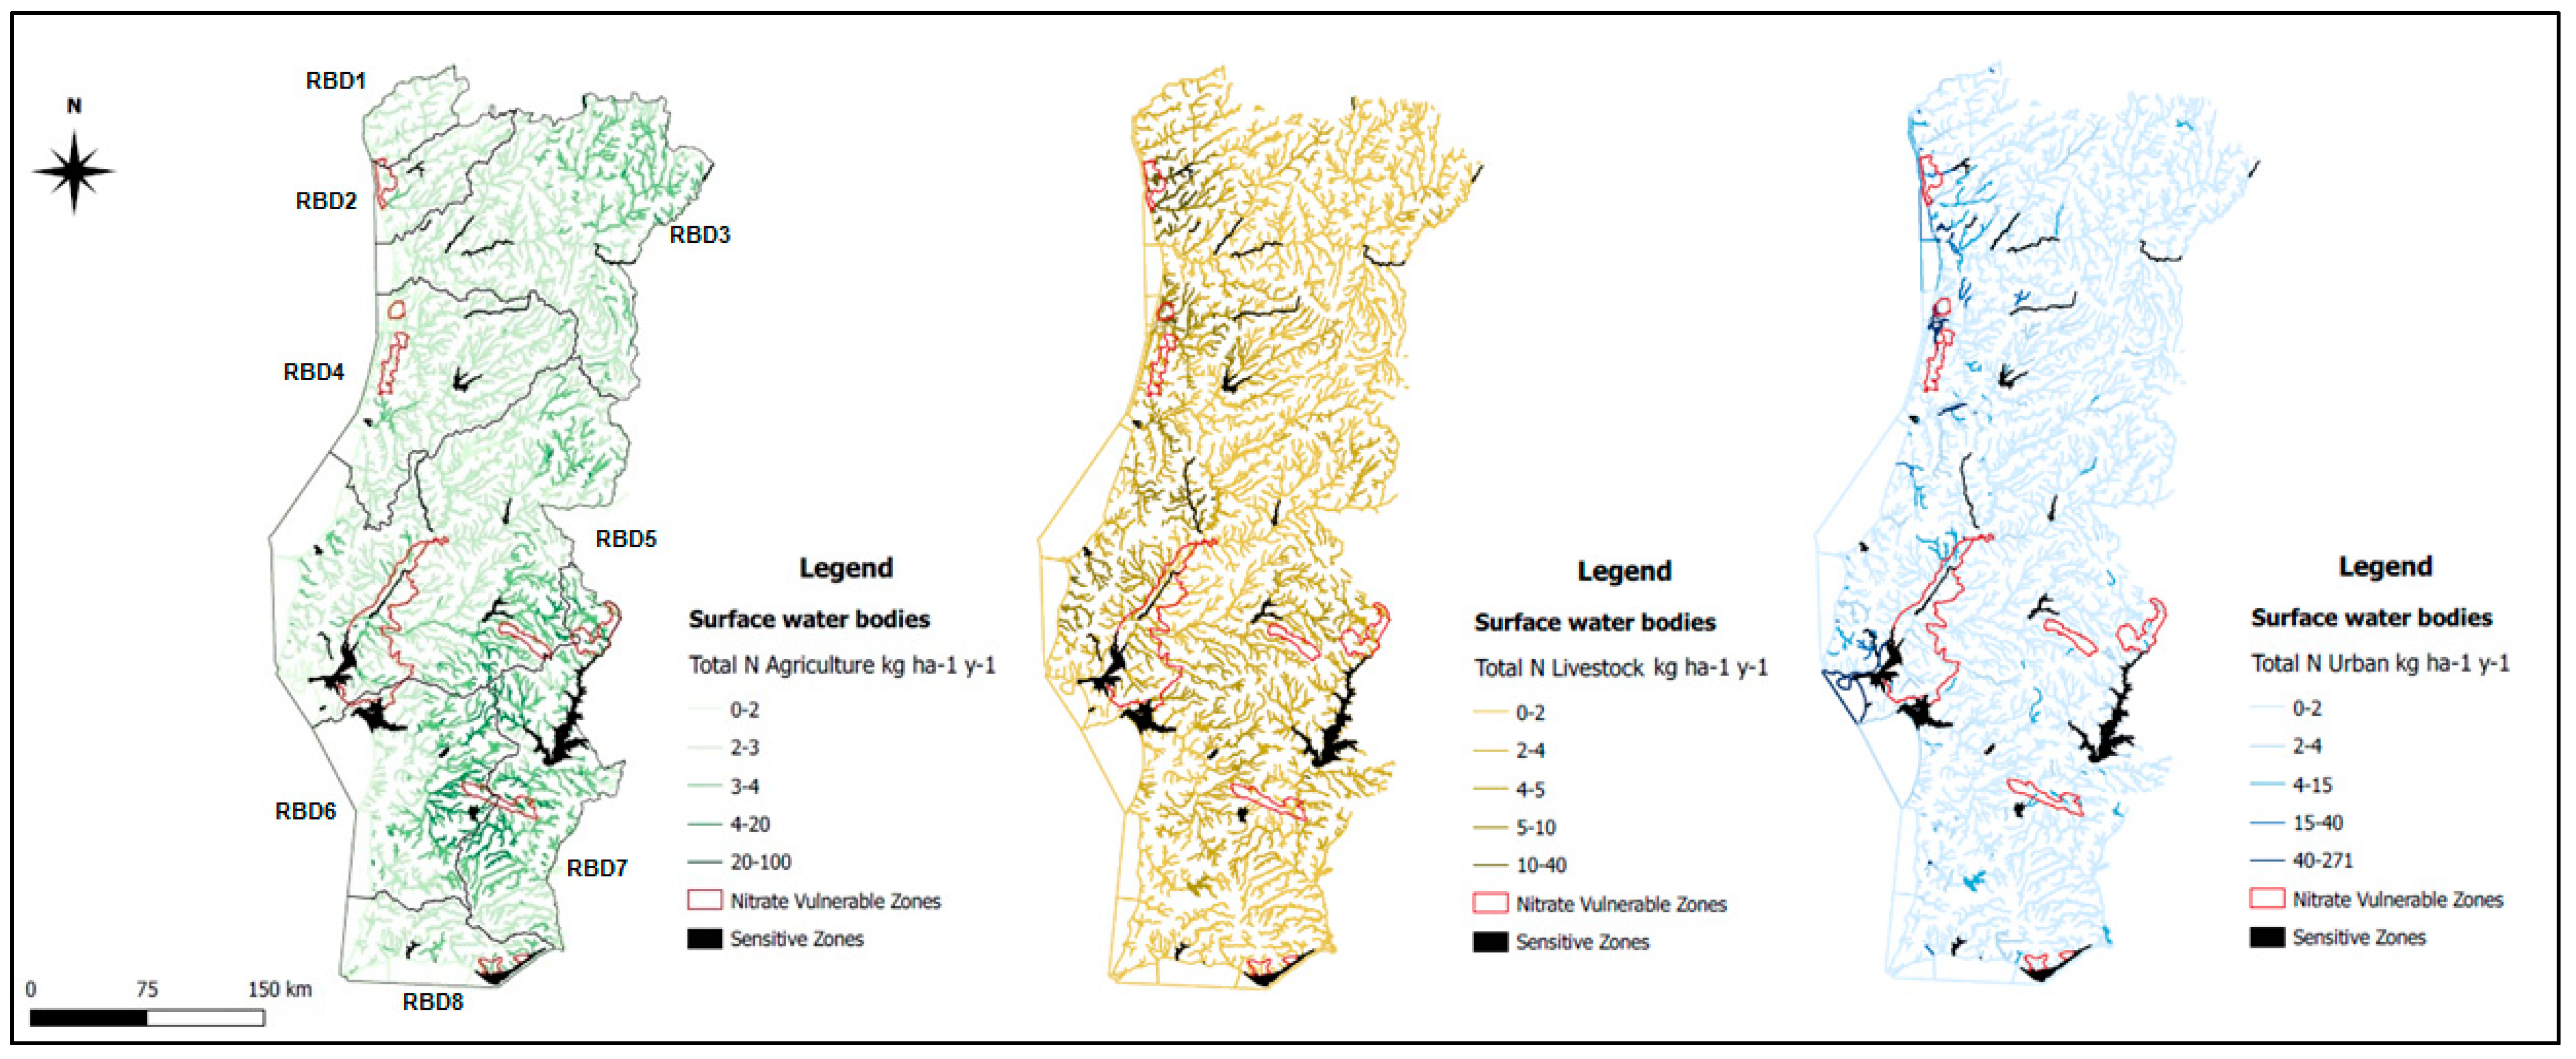
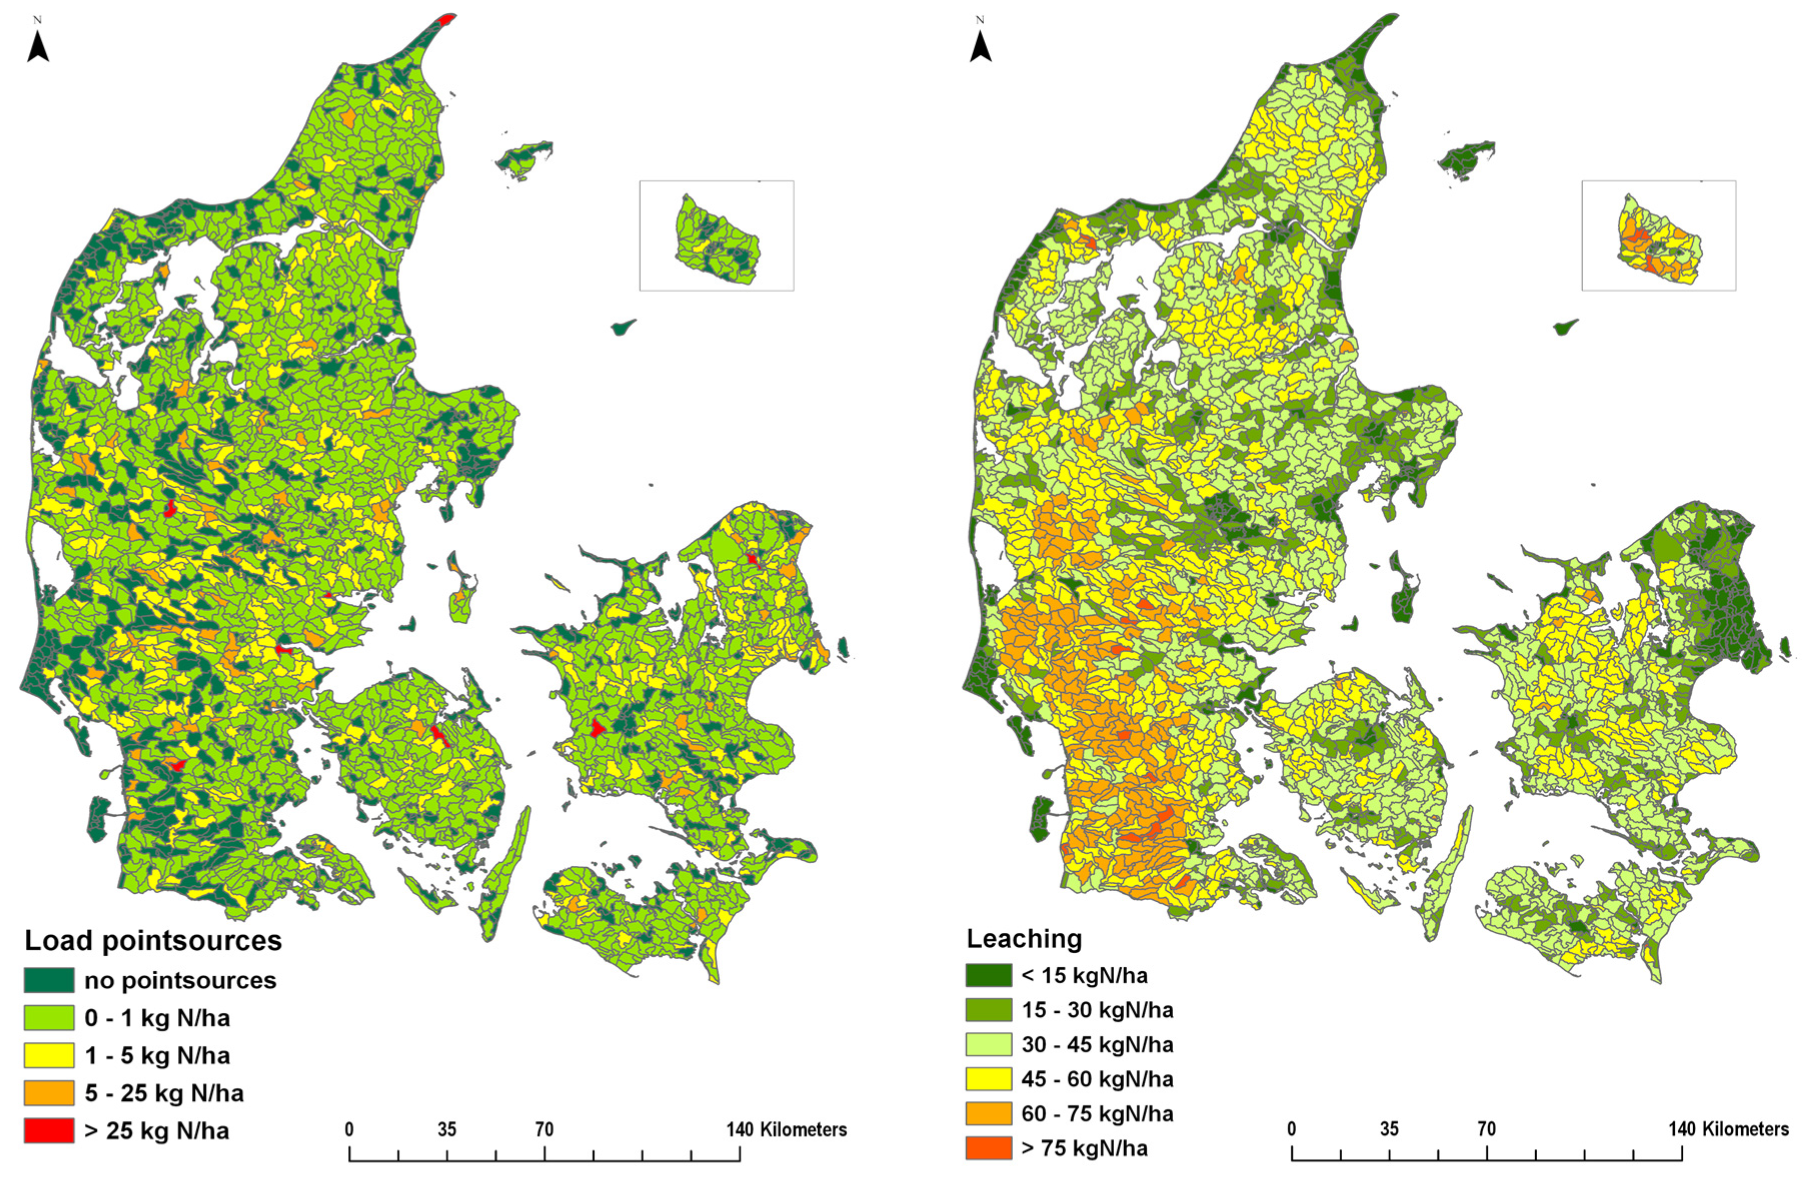
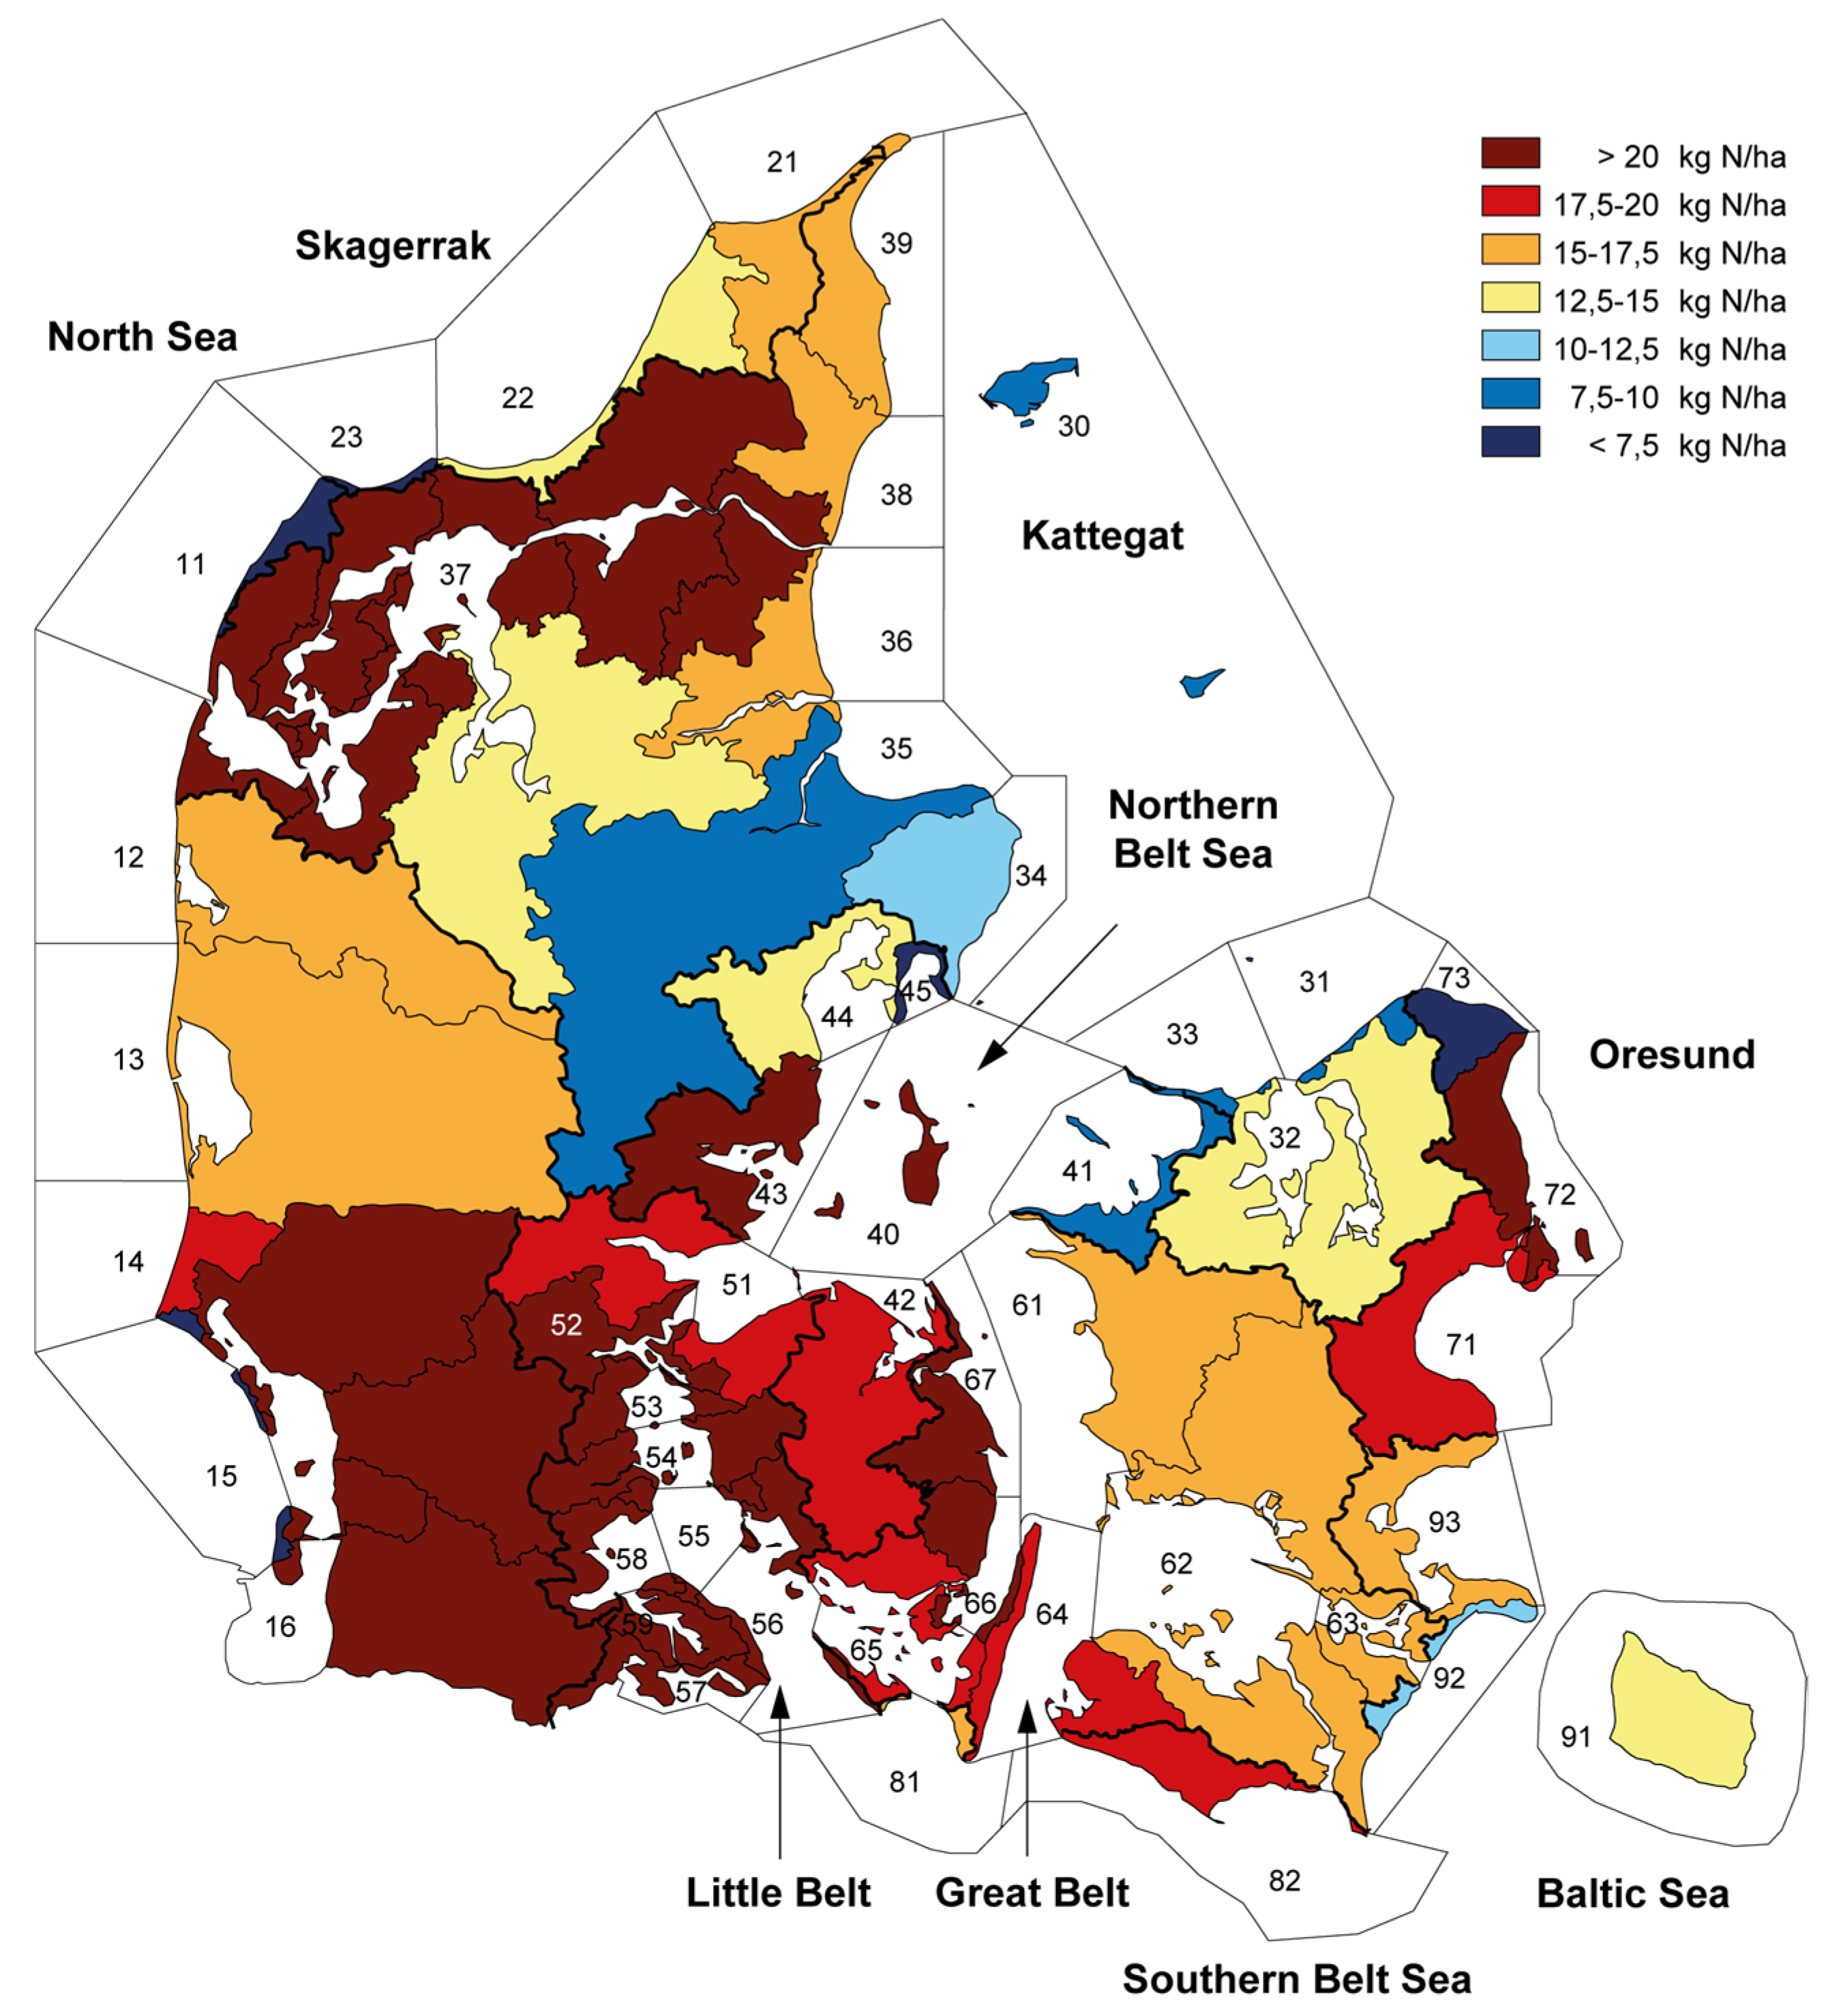
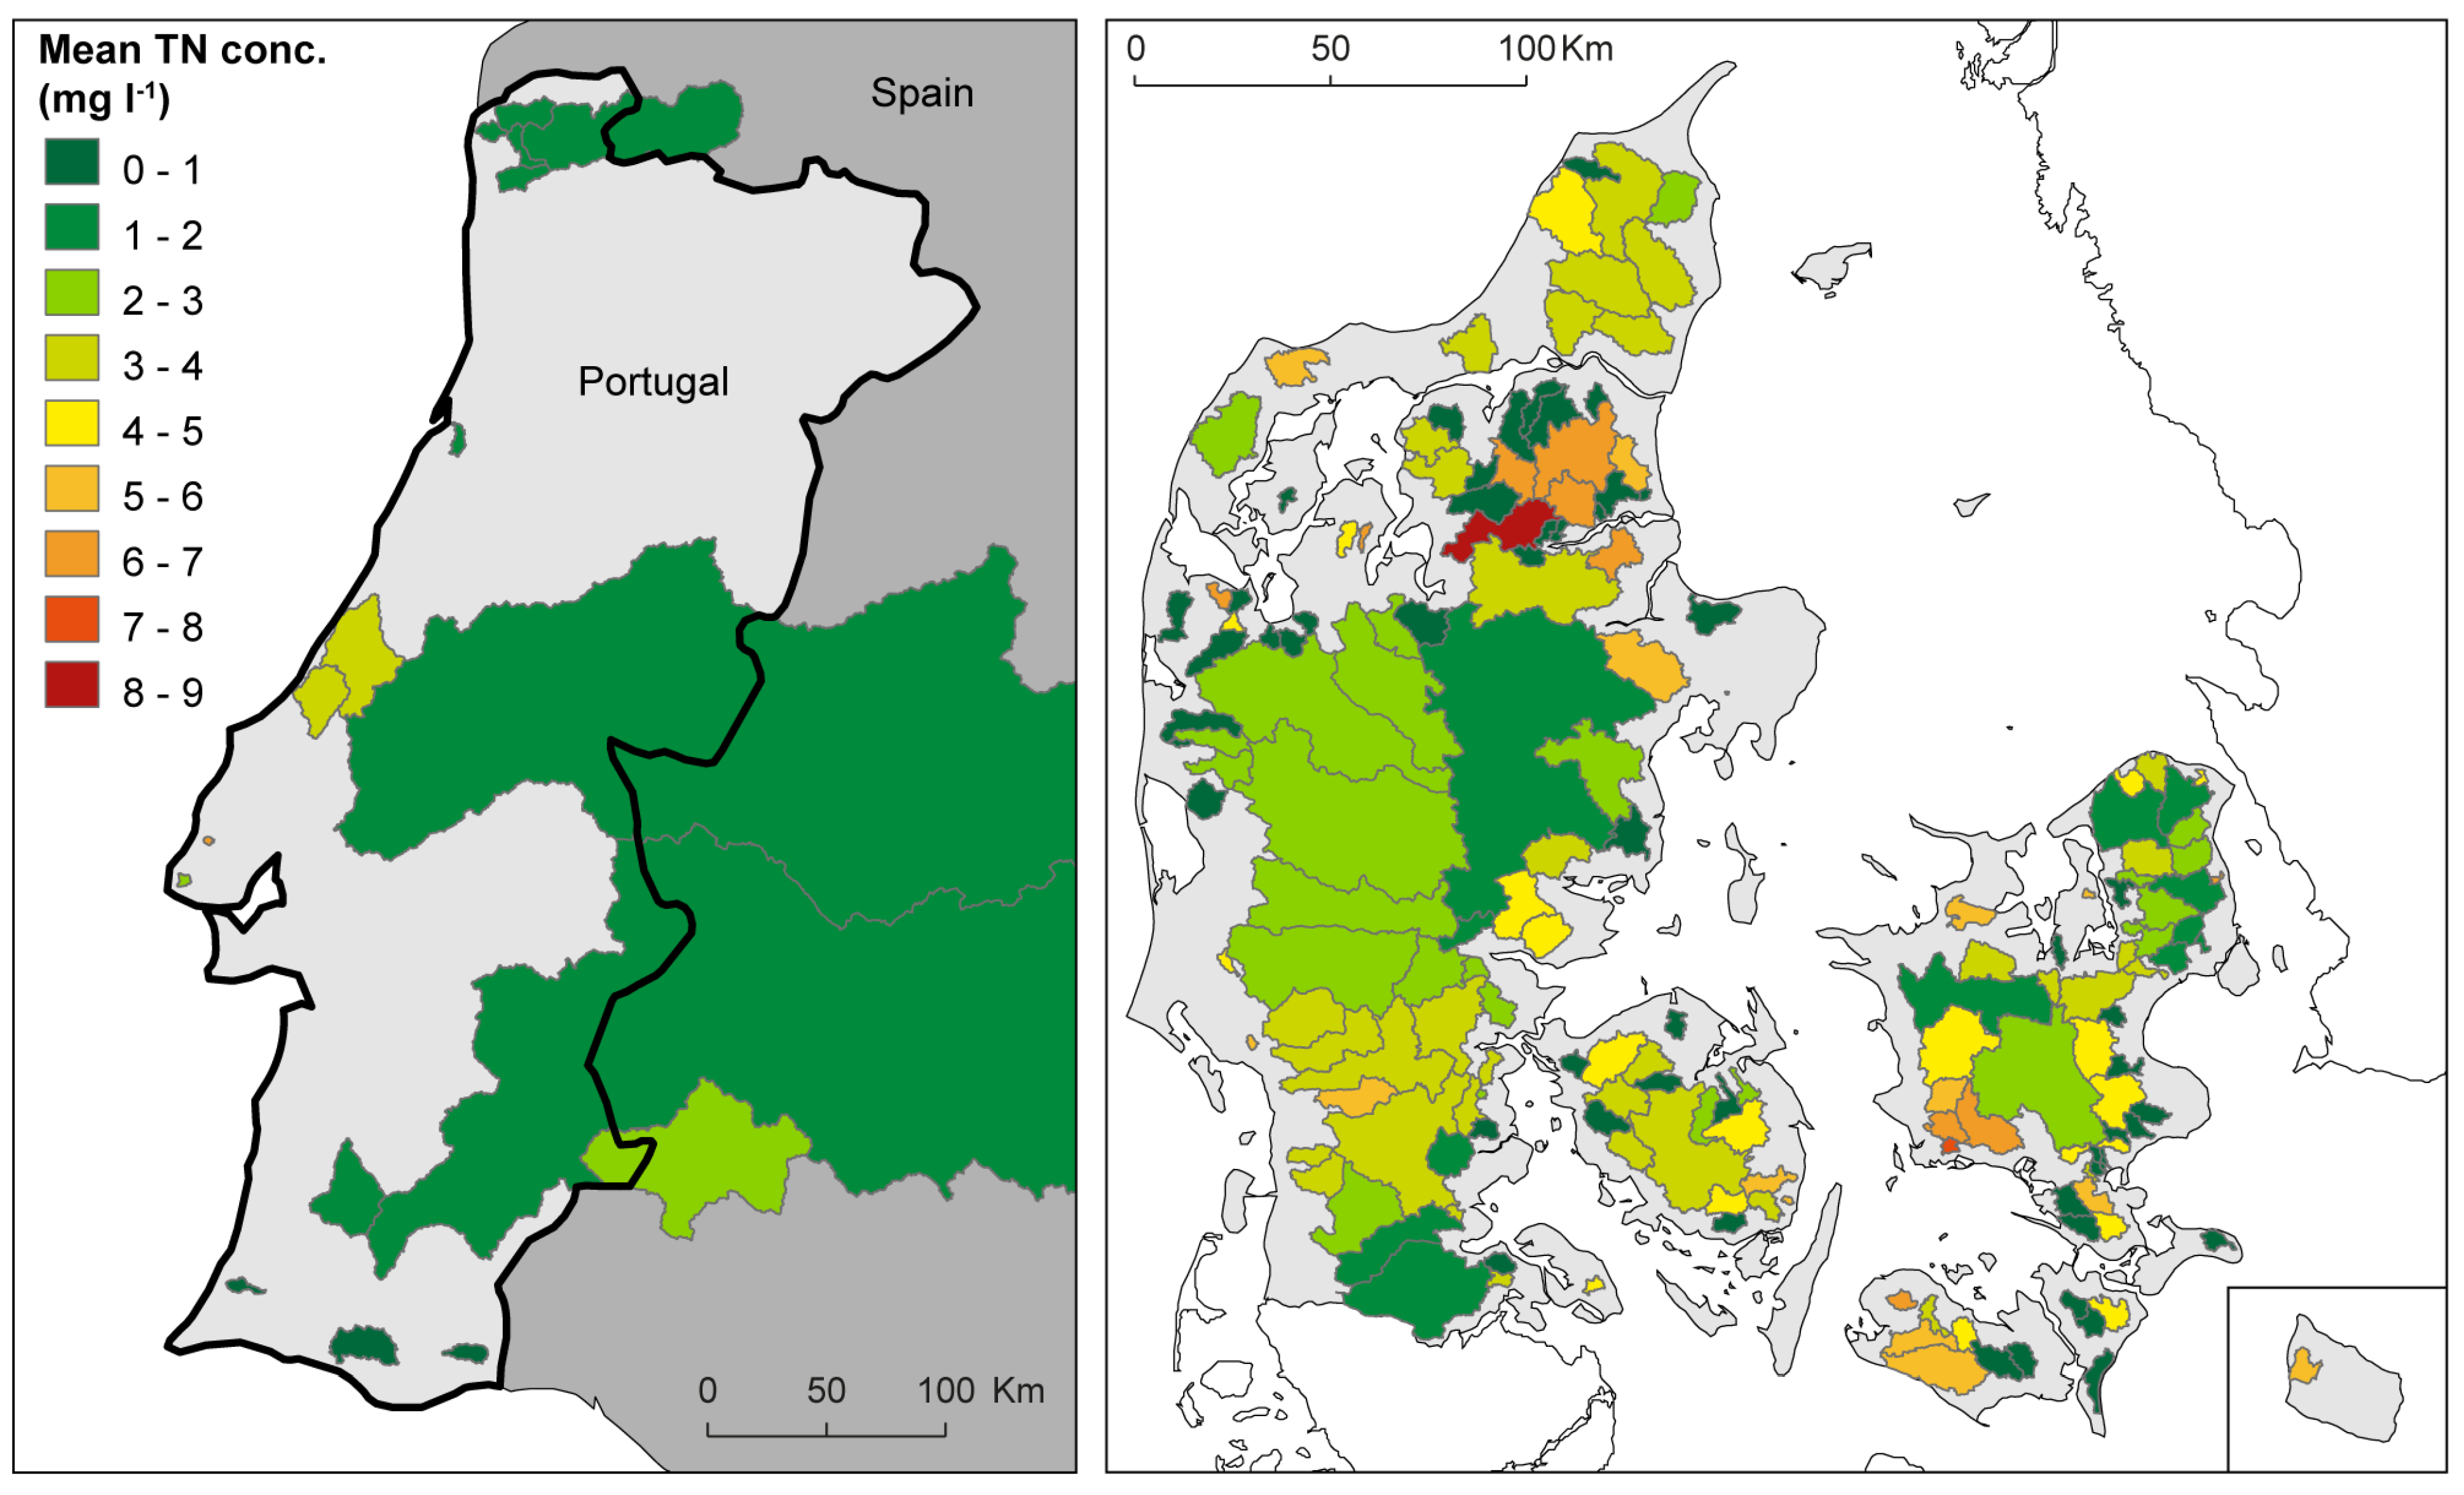
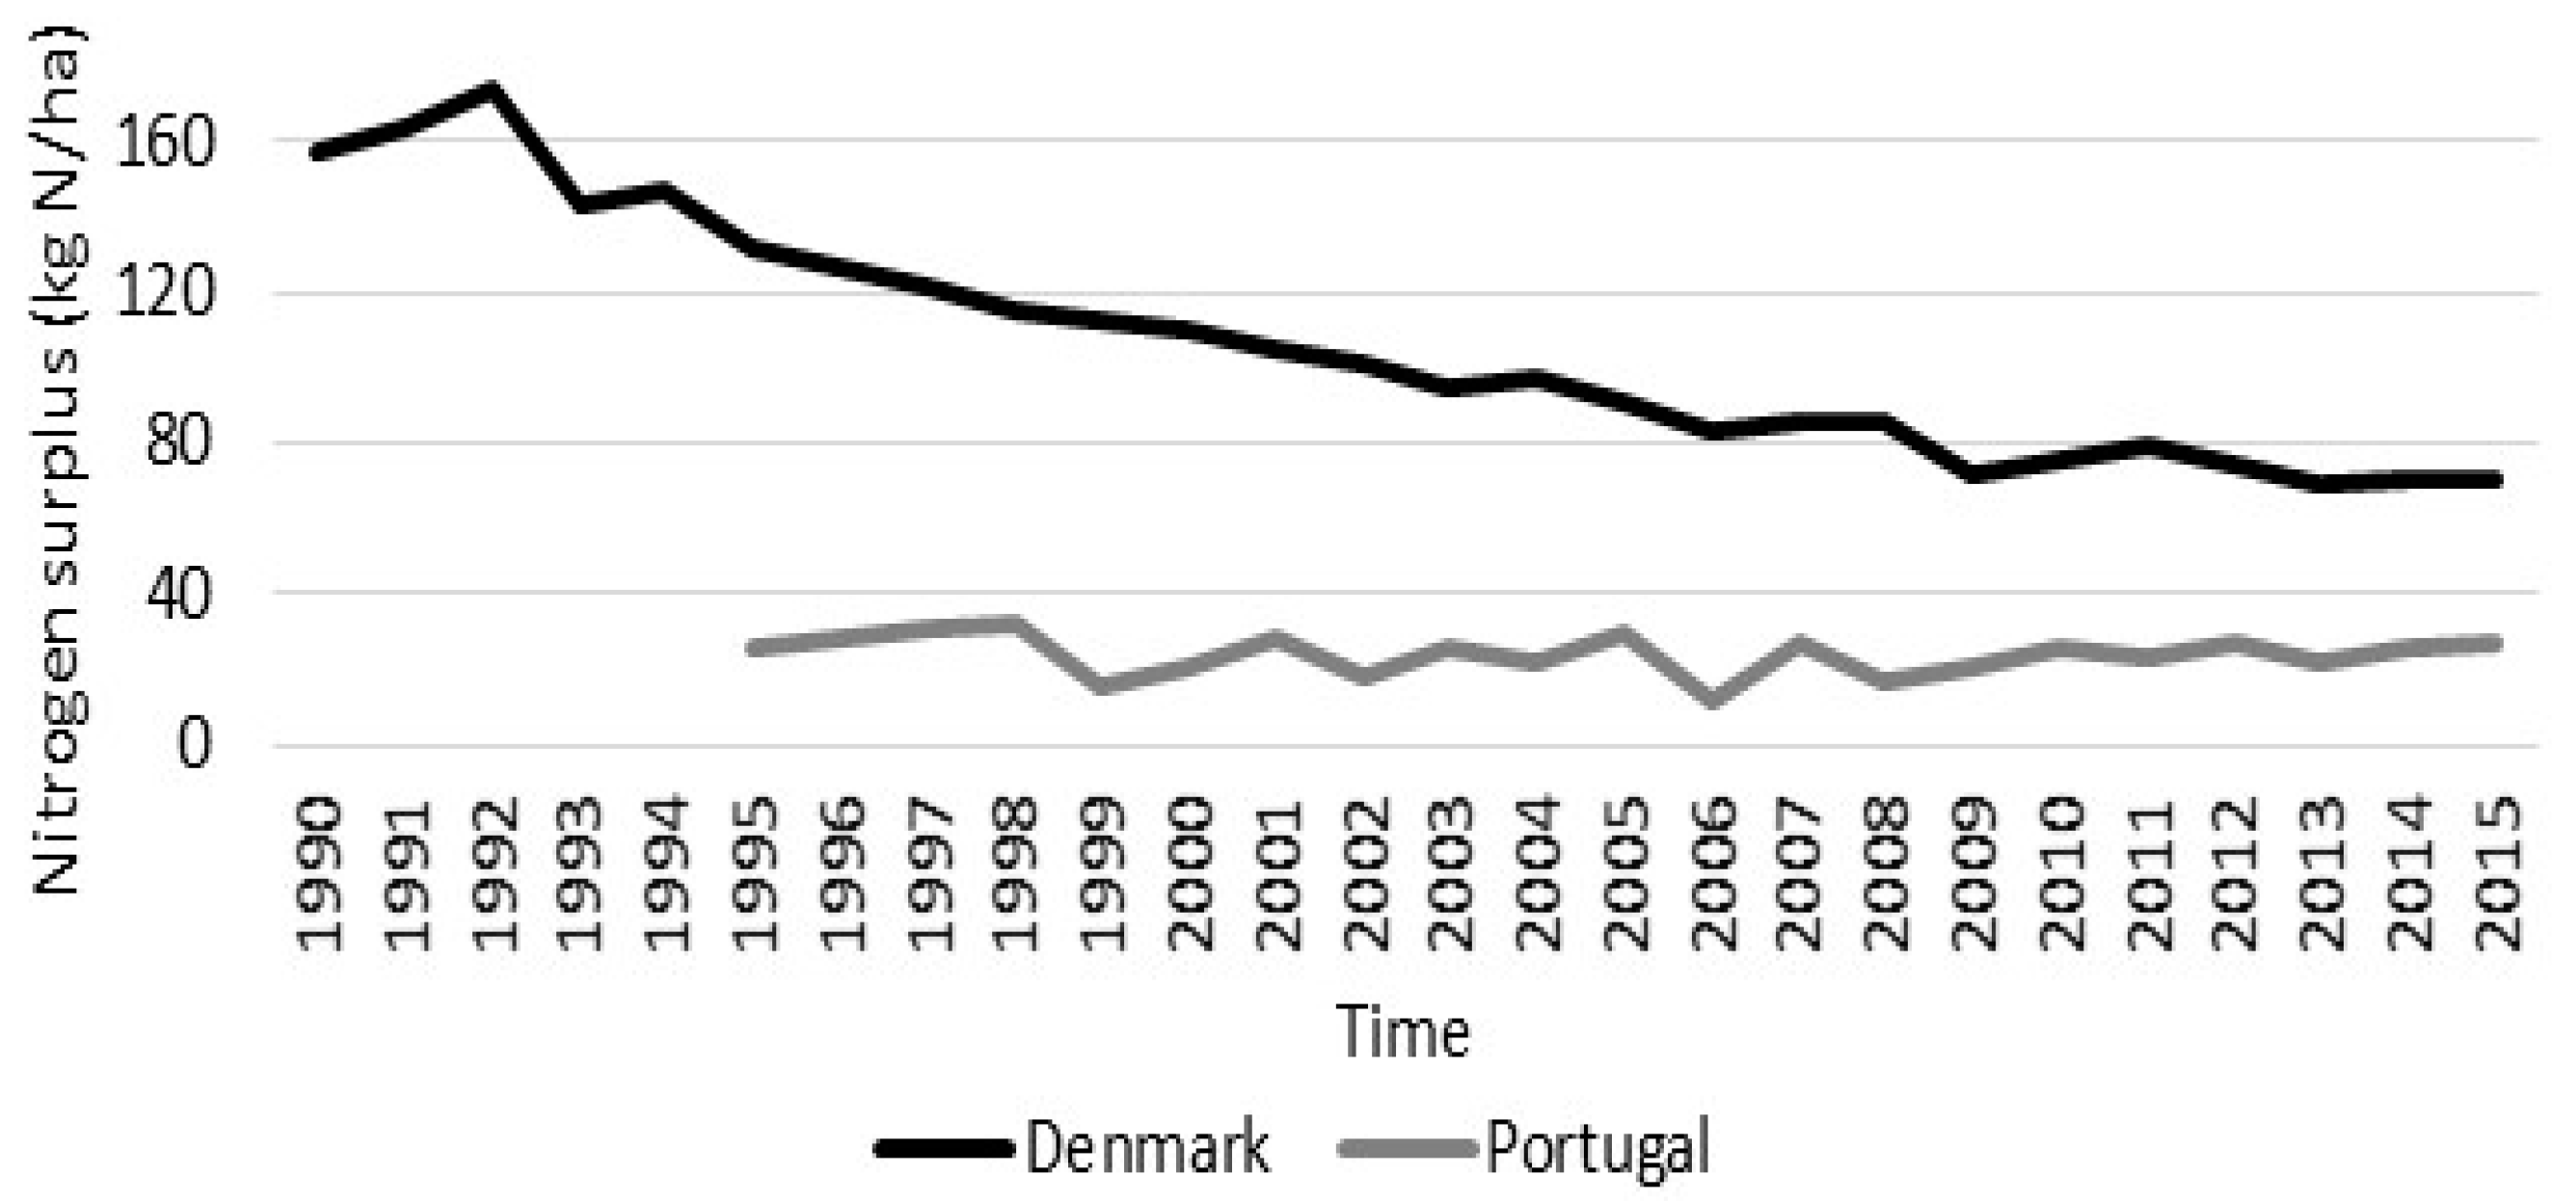
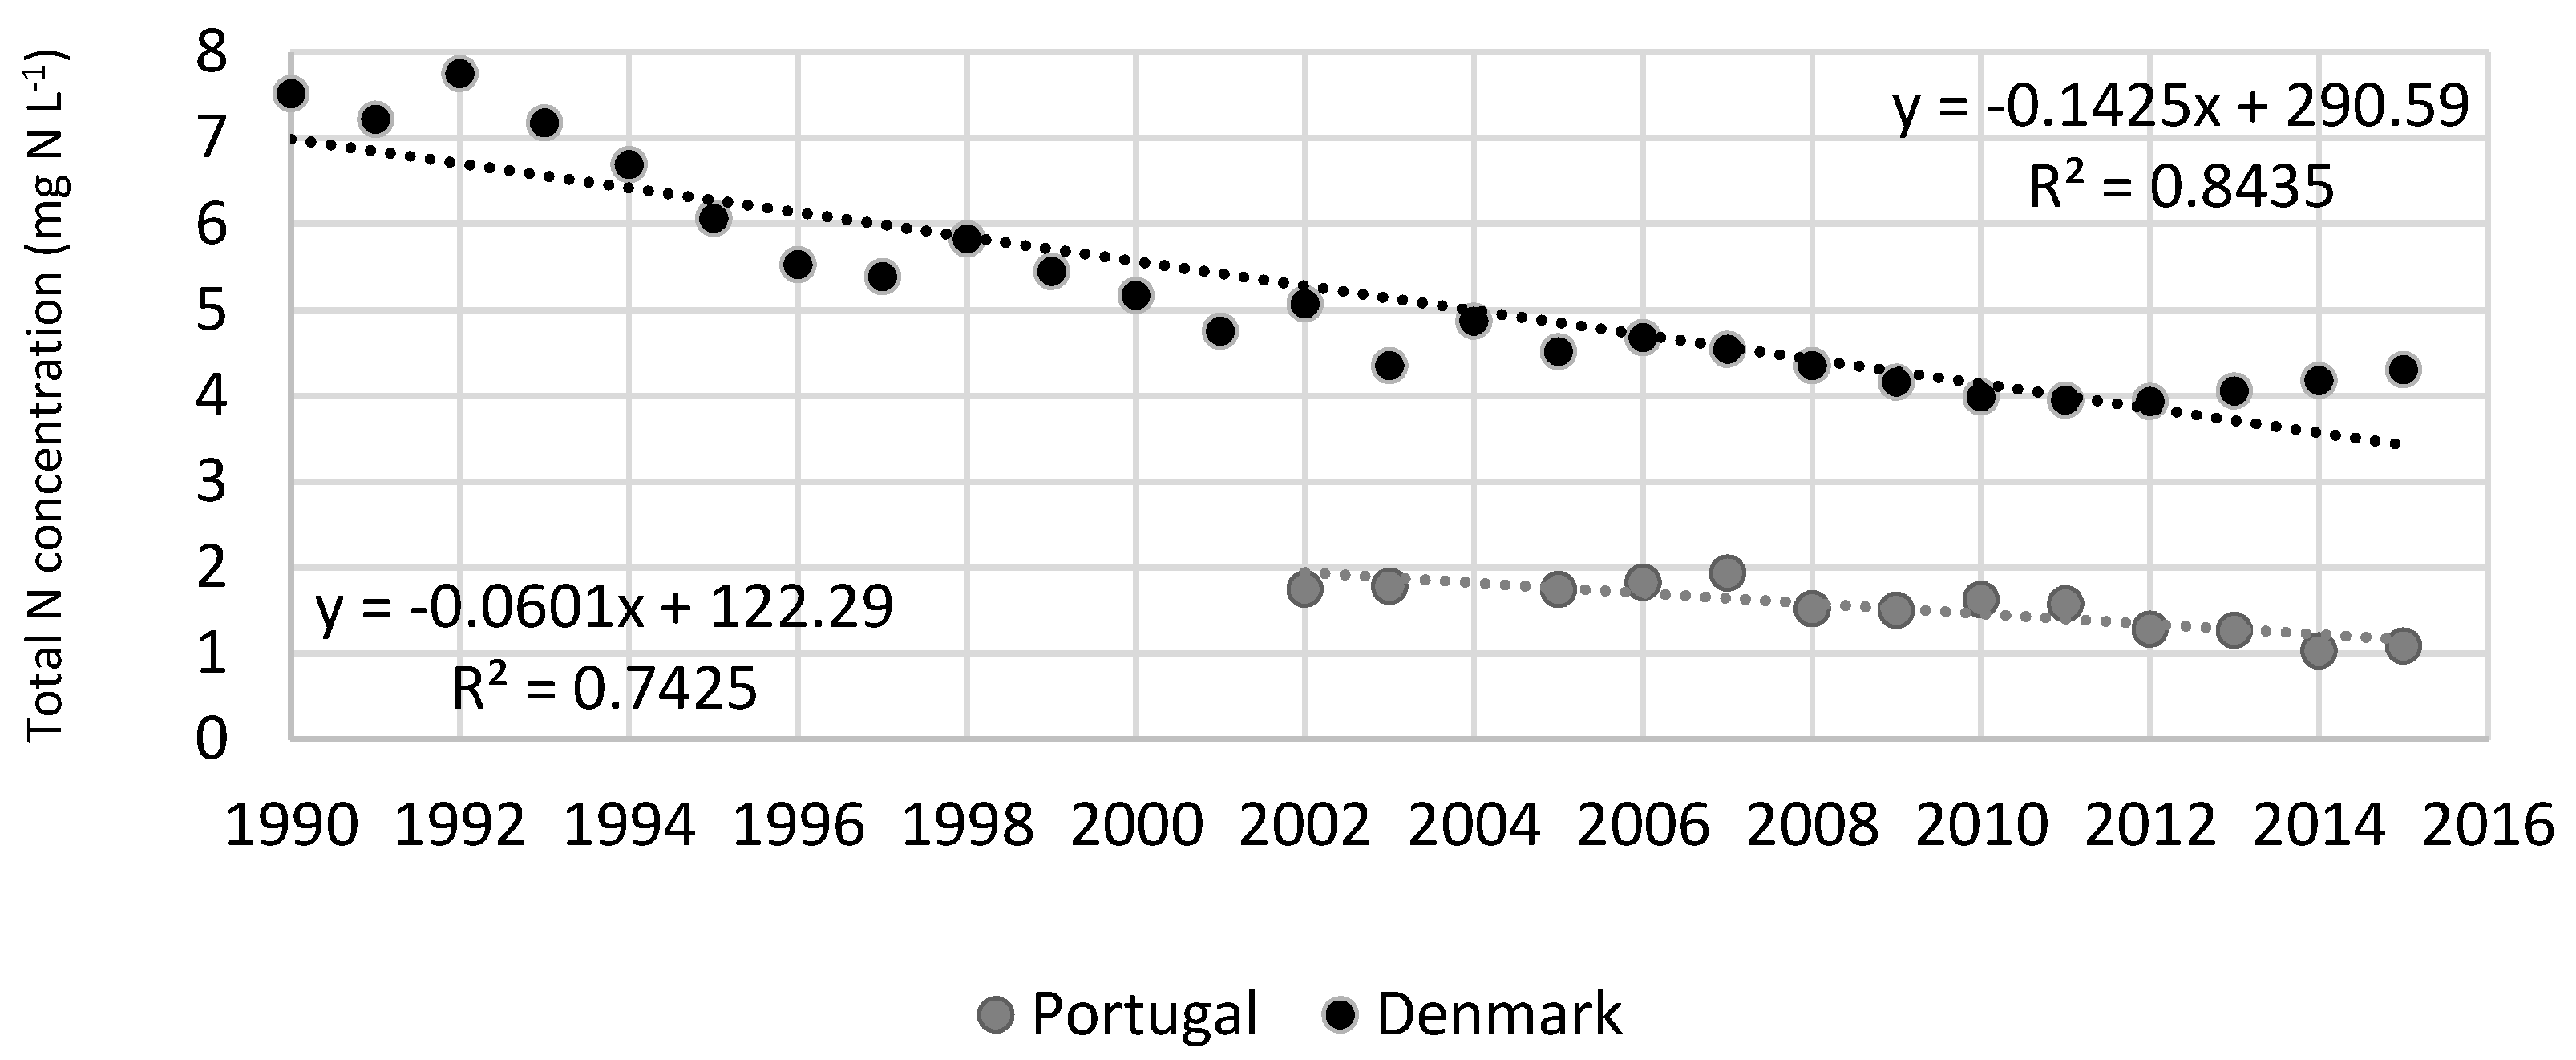
3.1. Nitrogen Drivers, Pressures, and State of Receiving Waters

The N pressures on waterbodies in Portugal and Denmark result from three main sources: (i) agriculture, (ii) livestock and (iii) urban drivers. These pressures result in different water states depending on their intensity and on the nature of the associated river basins. The latter, presenting characteristics that favor TN drainage from leaching and runoff into the waterbodies were analyzed and the results are presented in Figure 2 for Portugal and Figure 3 and Figure 4 for Denmark.
In Portugal, the designation of an NVZ is restricted to river basins with geographical and soil characteristics that increase drainage potential and favor an increased load of nitrate to water; so, NVZ action plans [35] apply to these areas, only. In contrast, in Denmark, 100% of the land was considered to be vulnerable and there is a national scale action plan for the whole country [12]. As shown in Table 1, the hydrological coverage in Denmark is far more extensive than in Portugal, which favors situations of potential nitrate losses into water basins, and increased denitrification potential. In Portugal, the alternation of dry and wet periods promotes the mineralization of soil organic matter leading to nitrate formation and, potentially, greater losses to water.
Figure 2 shows the loads of TN discharged to surface waters from agriculture, livestock, and urban sources in mainland Portugal. The currently designated NVZs and Sensitive Zones (SZs) are also shown. Despite the enhanced emissions of TNL from urban sources, particularly in RBD5 (271 kg ha−1 y−1), agriculture is still the major contributor of TNL to surface waters on a national scale (~40% from agriculture and ~35% from livestock compared to ~22% from the urban sector). The primary sector is quite important in Portugal as it contributes to a great percentage of the Gross Domestic Product (GDP), but it also poses a source for potential pollution. A more detailed allocation source of TNL to water from all the different sectors is of great importance at the regional and local scales, especially when focusing on better control of N emissions in NVZs. NVZs are always associated with agricultural regions, but include some urban areas too.
Surface waters in RBD1, located in the north of Portugal, are mostly affected by TNL from livestock (2.5 kg N ha−1 y−1) and agriculture (2.0 kg N ha−1 y−1). In the case of surface waters in RBD2 (associated with NVZ1) livestock (6.6 kg N ha−1 y−1) and urban (6.1 kg N ha−1 y−1) drivers produce the predominant pressures, whereas in RBD4 which is located in the Aveiro estuary (associated with NVZ2) all drivers exert similar, but low, pressures (0.25–0.31 kg N ha−1 y−1). In this region in particular, the hydrology and topography determine the possibility of denitrification occurring. The surface water catchments in RBD3, RBD5, RBD6 and RBD7 are associated with the highest agricultural areas (16%, 31%, 18% and 22%, respectively) and relatively high total losses of N from agriculture (2.6, 2.3, 1.9 and 3.1 kg N ha−1 y−1, respectively) (Table 2). Despite the vast agricultural area, RBD3 has the heaviest urban pressures due to increasing urbanization and tourist activities in the Douro Valley. Including the NVZ3 and NVZ8, RBD8 receives mostly urban discharges, with a N load of 2.3 kg N ha−1 y−1. The agricultural sector contributes an N load of 1.8 kg N ha−1 y−1.
In Portugal, agricultural areas are occupied by non-irrigated cereal crops (e.g., wheat, barley, oats, rye), irrigated crops (vegetables, maize, paddy rice), olive groves, vineyards, and orchards. Livestock production is also common throughout the country. More specifically, dairy cow production dominates in the north of Portugal (in small and large intensive production units), and sheep and goats dominate in the southern provinces (on extensive grassland farms with less nitrate leaching potential). In RBDs 5, 6 and 7 especially in “Ribatejo” (Tagus vulnerable zone 5; TVZ) and “Alentejo” (NVZ7) provinces, intensive agricultural activities pose an important nitrate pollution risk because maize, which requires large quantities of mineral fertilizer and frequent irrigation, is the most common crop in the area [41]. In “Ribatejo”, processing of tomato and other vegetable crops is also responsible for a large share of N losses to water, thus contributing to the degradation of surface water state [42].
Fertilization practices vary significantly from one region to another due to different cropping systems. However, as shown by Cameira et al. 2018 [39] for the TVZ, the ND (91/676/EEC) [33] related measures that have been put in place are relatively effective in areas with intensively irrigated crops, while they are less efficient in areas where livestock predominates due to intensive nature of the production units. Besides the identification of a N surplus in parts of the TVZ related to agricultural activity and land-use change in recent years, additional concern was raised about the recent increase in intensively managed olive grove areas in Alentejo (associated with the NVZ6), which may constitute an additional driver of TN discharge and losses to the water bodies [43].
Figure 3 shows point source discharges of TN (kg ha−1) from 2010 to 2015 (left) and N leaching from land to water in Denmark in 2010. In general, the N leaching pattern was higher in Jutland, in the south-western part of the peninsula (60–75 kg N ha−1 and >75 kg N ha−1). This was due to a combination of high livestock densities (dairy and pig production), high mean annual rainfall (900–1100 mm y−1) leading to high percolation of water and runoff into streams (600 mm y−1) and a dominance of sandy soils. These conditions associated with intensive agricultural practices led to higher N leaching in this province than in the drier and loamy eastern islands of Funen and Zealand (Figure 3; right). Point source discharges of N to surface waters are very low because tertiary treatment of sewage effluent is implemented in 97.9% of all the WWTP in Denmark [37]. Therefore, high levels of point source discharges are found only near major cities, such as Copenhagen, Aarhus, Odense and Aalborg (Figure 3). This does not correspond to the situation in Portugal, where only secondary treatment is implemented in nearly all the WWTP [6], transforming urban pressures into a high concern in relation to N and other losses.
Danish territory is highly dependent on, and linked to, the sea and corresponding coastal interaction. This contrasts with Portugal, where only the west and south coast connect to the sea, with some small saltwater intrusions. Three of the NVZs, however, are in these areas (Figure 2).
The amount of TN lost from land to water is an indicator of the likely level of N contamination by receiving waters. In Portugal, the value of N losses is estimated to be an average of 7 kg N ha−1 to surface waters, whereas the corresponding value for discharges to coastal waters around Denmark is estimated to be about 14.6 kg N ha−1 (Figure 4) [32]. Although the discharge to coastal waters in Portugal is not presented due to lack of statistical information, there is a clear difference in N discharge in both countries. While in Denmark the hydrological conditions and flat topography favor denitrification and could reduce N losses, in reality leaching losses were found to be higher than in Portugal. Water quality policies appear not to be reducing the loss of nitrate to water significantly, despite the heavier legislation requirements in Denmark.
The TNL from Danish catchments to coastal waters in 2015 is shown in Figure 4. Nitrogen loads to surface waters are particularly high (>15 kg N ha−1) in livestock production areas with high levels of precipitation (i.e., southern and northern Jutland and Funen), whereas the N load is lower in the predominantly plant producing areas of eastern Funen and western Zealand. High N loadings (>12.5 kg N ha−1) from point sources occur within the Copenhagen region (eastern Zealand) (Figure 4).

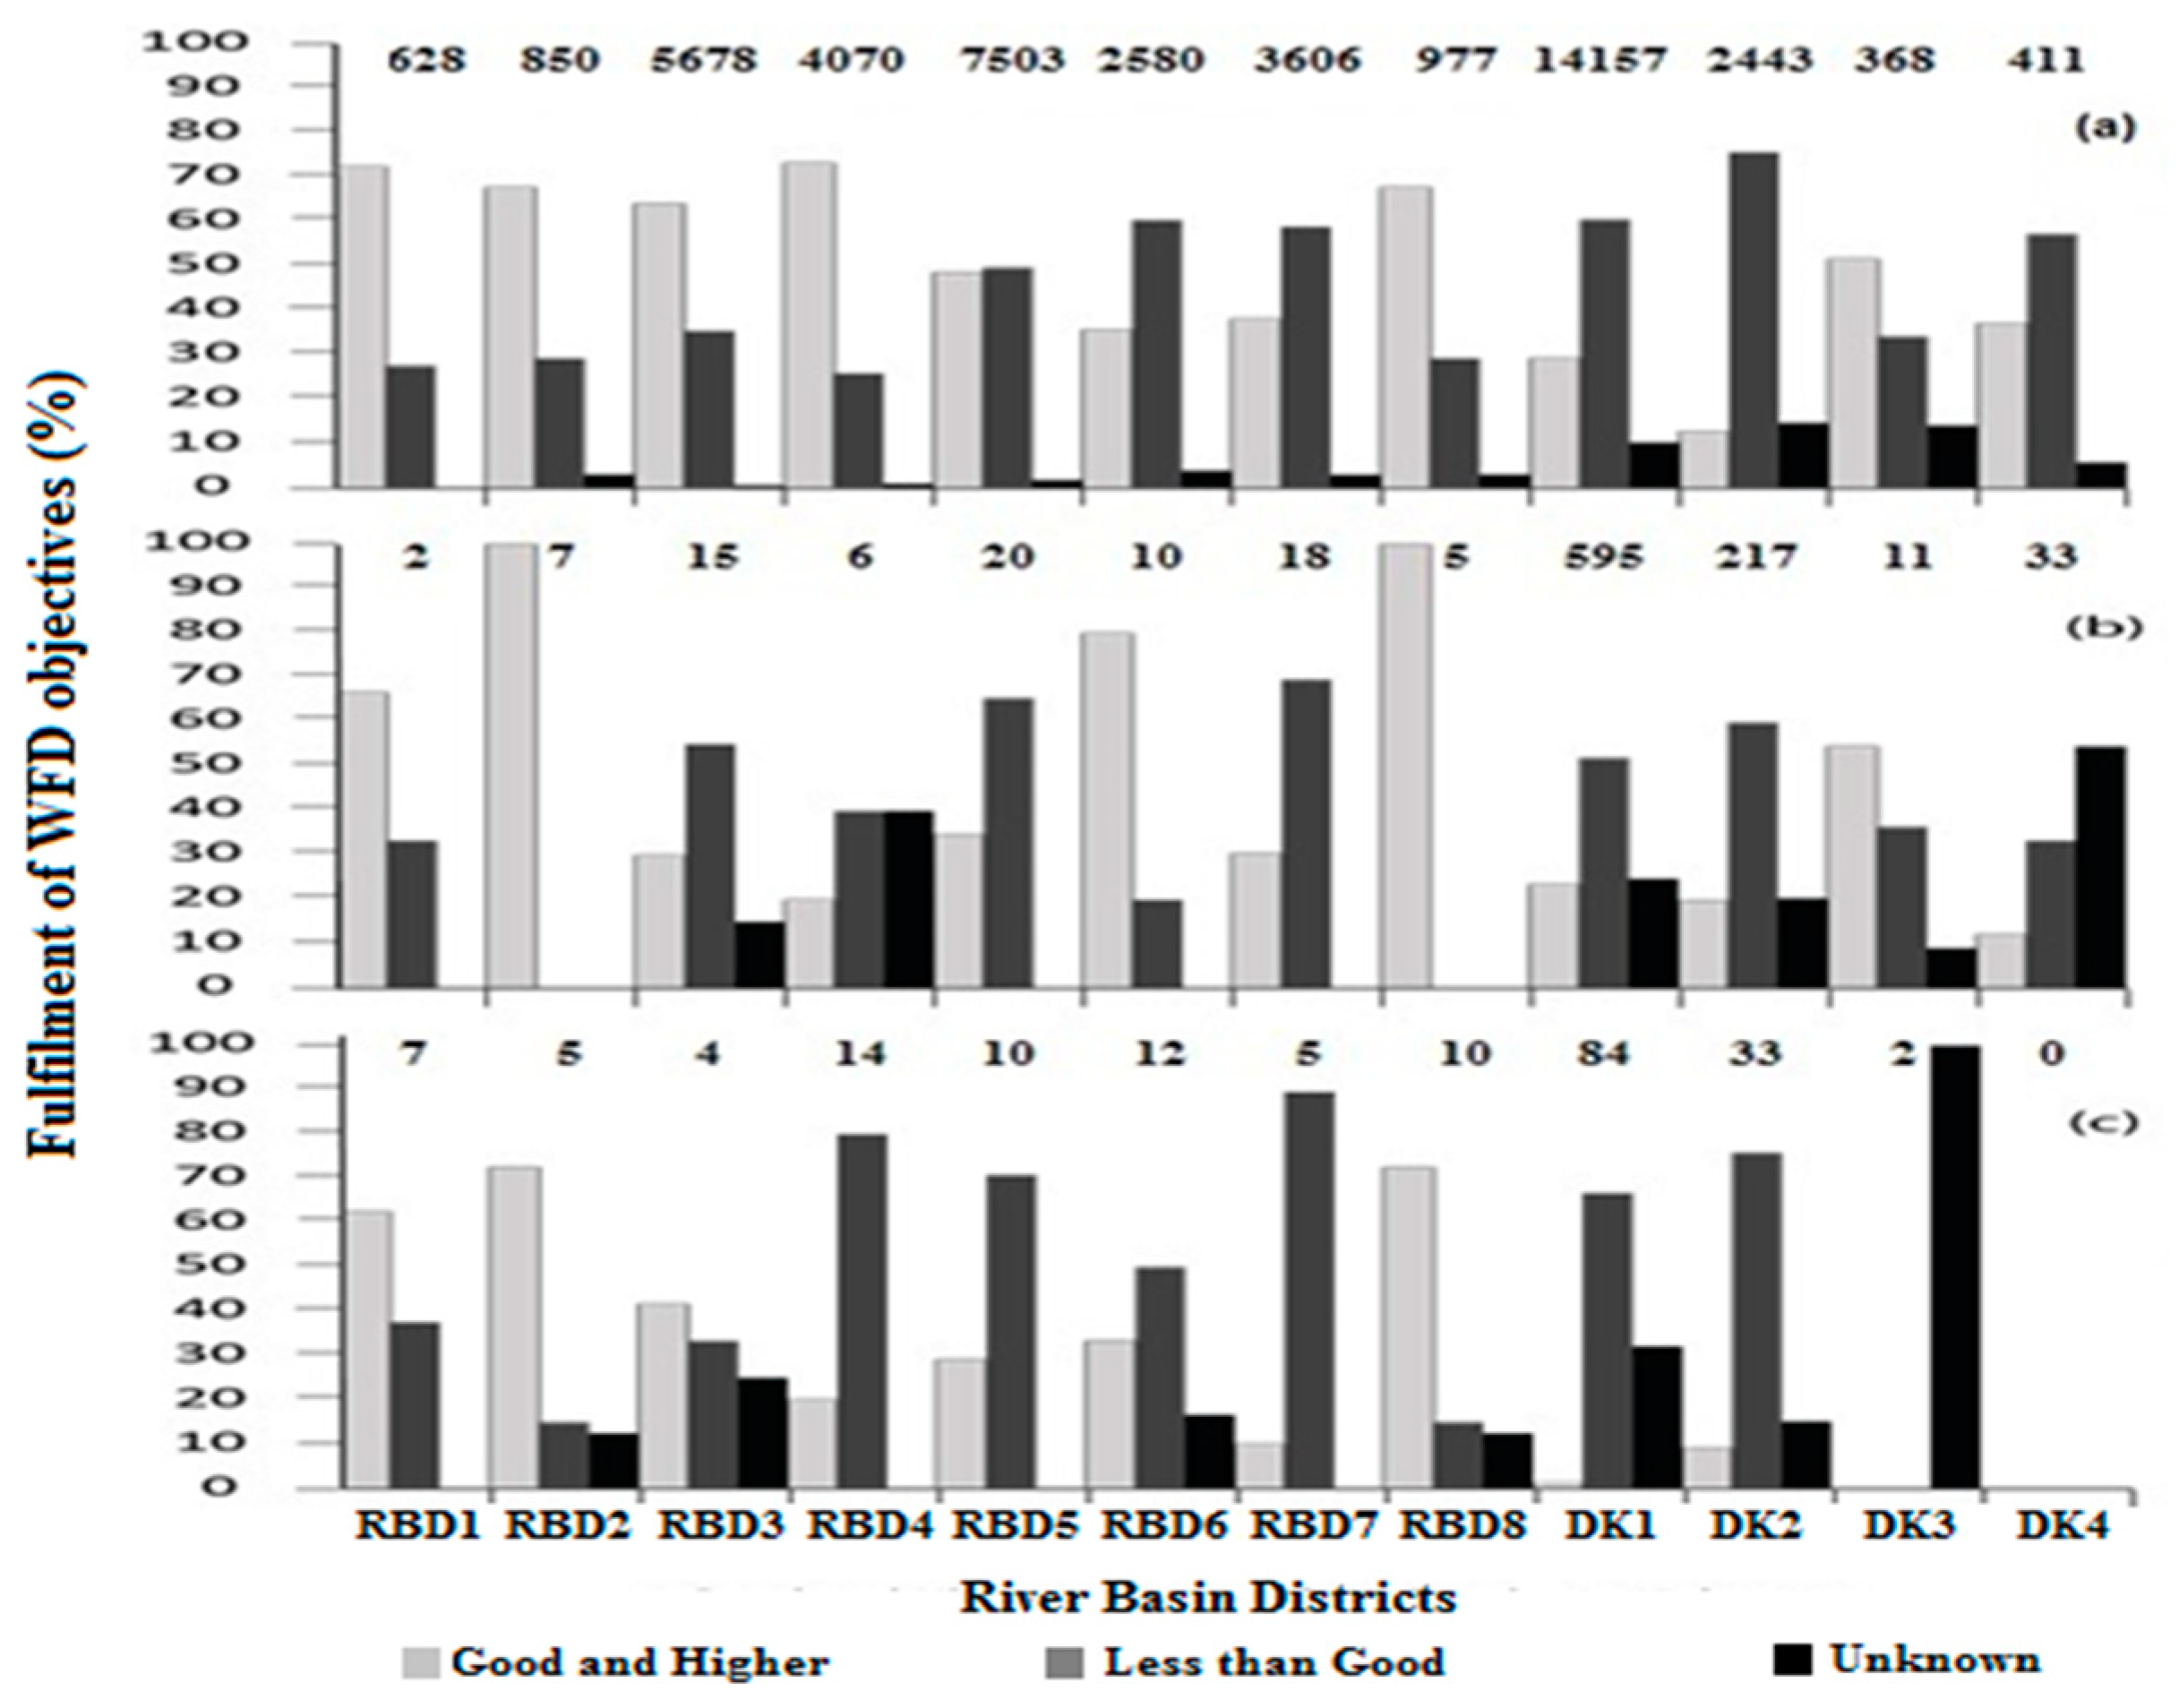
3.2. Impacts on Water Quality and Ecology

The pressure of N discharges from the different drivers, as shown in Figure 2 and Figure 3 respectively for Portugal and Denmark, results in impacts on water quality that can be seen in Figure 5. To understand better the impact of N on waterbodies, TNC (mg N L−1) in the surface waters of Portugal and Denmark were analyzed between the years of 2010 and 2015 (Figure 5). Then, the ecological status of rivers, lakes/reservoirs and coastal/transitional waters were analyzed and compared for both countries (Figure 6).
Total (N) and (NO3-N) concentrations in ground and surface waters are important because they determine the impact on chemical water quality of these waterbodies as defined by the ND and WFD. Monitoring of TNC and daily flows at surveillance stations is important for providing reliable data on TN loadings in surface waterbodies.
In Portugal, TNC are only available for 30% of the mainland due to the limited sampling and inconsistency of sampling dates compared to monitoring sites. This does not provide reliable information on water (N) concentrations (Table 1 and Figure 5). Nitrogen transport from Spain to Portugal plays an important role in detremining the level of total N loading and (N) concentrations in some Portuguese rivers, such as the Tagus [44]. Total nitrogen concentrations in Portuguese rivers exhibit a pattern of generally low (N) concentrations (Figure 5), which does not necessarily reflect reality, up to where the extent of samplings permitted estimation (i.e., ≥8 months). Hotspots for nitrate pollution will only be identified through modelling at higher resolution, while at the broader scale policy implementation seems to be effective in controlling nitrate [39], despite the loads in the discharges coming from Spain.
In Denmark measured TNC in surface waters were generally higher in the loamy and drier eastern part of the country (Funen and Zealand) than in the northern part of Jutland which, with its chalk groundwater aquifers, is characterized by low N attenuation (Figure 5) [45].
In Portugal similar assessments to those performed in Denmark cannot be made due to the almost complete absence of specific monitoring stations to assess N loading (Table 1).
The patterns observed in the two countries seem to vary markedly from each other—with the Danish surface waters displaying higher flow-weighted total N concentrations (~4 mg N L−1) than the Portuguese rivers (~2.5 mg N L−1) (Figure 5). A possible explanation for the much higher TNC in Danish surface waters compared to the Portuguese rivers may be the 2.6 times higher N surplus in Danish agriculture compared to Portuguese agriculture (Table 2). Due to the lack of a comprehensive monitoring network in Portugal, the identification of N surplus is only possible through the downscaled analysis of specific river basins [39]. However, while WWTP with tertiary treatment in Portugal are non-existant [6], almost 100% of the WWTP in Denmark have high nutrient recovery (Table 2). This leads to the assumption that the N loads to Danish waters should be lower, which is not the case. In fact, in Denmark, the N load from the WWTP is measured as a pressure on water quality whereas, in Portugal, it is simply unknown.
For rivers, three out of the four Danish RBDs have an overall WFD status of less than good, while the same status only occurs in three of the eight RBDs in Portugal (Figure 6a). The differences between the two countries is probably influenced by the fact that all Danish rivers are considered irrespective of their size, so a significant number of small streams (<2 m width) are included in the determination of status. These small streams are more vulnerable to pollution than larger streams that have a higher dilution rate and greater potential for recolonisation by biota. In contrast, in Portugal, only streams that are monitored and have WFD targets for ecological and physical conditions are considered. The three Portuguese RBDs that do not meet good ecological status—RBDs 5, 6 and 7 (Figure 6a)—are located in areas dominated by irrigated and intensive cropping systems (e.g., rice and tomato) with high fertilizer application rates (RBD 5) or non-irrigated production intensive cropping systems (e.g., maize) and vegetable production (e.g., horticultural crops) (RBDs 6 and 7). In Portugal, agricultural intensification is often associated with livestock production, which also contributes to water quality degradation [6].
In relation to lakes and reservoirs, three out of the eight Portuguese RBDs have a less than good status; the comparable figure for Denmark is two out of four (Figure 6b). However, phopshorus (P) loading rather than N loading is the dominant nutrient pressure on lakes and reservoirs, and in most inland waterbodies P loading from the lake sediments is also significant due to chemical and biological factors [46]. In Portugal, few studies have classified the trophic state of lakes and reservoirs. However, Diogo (2008) [47] found that 64% of the eutrophicated reservoirs in Portugal are also affected by excessive inputs of P. In Denmark, considerable efforts have been made to reduce the P load to lakes and reservoirs [48,49,50]. However, in Portugal, P is just starting to be a concern in terms of water quality, since the attention of policy has focused so far on N as a major driver for water contamination.
In terms coastal/transitional waters in Denmark, in two of the four DKs, 70–80% of the waters have less than good status according to their WFD classification (Figure 6c). In Portugal, in four out of the eight RBDs, 50–90% of coastal/transitional waters have less than good status (Figure 6c). In Denmark, excessive N loading is the main reason for the poor state of its coastal and transitional waters, with the severe eutrophication of these systems acting as one of the main drivers for the implementation of seven action plans that have been implemented over the last 30 years to improve the aquatic environment [12,45]. In Portugal, although several local studies have investigated the impact of nutrient input on water quality status in transitional and coastal waters [51,52,53], uncertainty still exists about which nutrient is causing excessive algal growth and, thereby, influencing trophic state and ecological quality status in these areas.
Although knowledge of the quality status of Portuguese waterbodies is increasing, several gaps in knowledge remain. These are mainly due to the low number of water quality monitoring stations within each RBD and the non-existent sites that are suitable for TNC calculation (Table 1). Moreover, the importance of coastal waters within the Danish territory is far more significant than in Portugal, due to the inherent characteristics of the territories themselves.

3.3. Responses to Nitrogen Impacts

The ND [33] was the first European response to water pollution associated with nitrate from agricultural and livestock rearing activities. To mitigate and abate N losses from agricultural sources, all of the Danish territory has been designated as a NVZ [12] while in Portugal, the NVZ areas occupy only 4% of the land (Figure 2) [35]. This means that in Denmark, the implemented action plan on waterbodies covers the entire country, and strict regulations have been imposed on all farmers since the mid-1980s. This has resulted in large reductions in N leaching [12]. In Portugal, the first three NVZs were mapped in 1997 and these increased in number and areal coverage until 2012. New areas are now likely to become NVZs and, therefore, require further regulation. For instance, some may be designated as SZs with strict regulation associated with discharges.
Despite the heavier regulation, nitrate losses in Denmark are higher per unit area of land due to the more intensive type of agriculture compared to the more extensive agriculture found in Portugal. As well as the land characteristics being important, the type of farming affects the water quality, too. Also, Denmark has a much higher number of lakes and transitional coastal waters that are likely to be impacted by N losses from land compared to Portugal, which is mainly formed of continuous areas of land with a defined and substantially less extensive river basin network. This results in a less vulnerable water network with correspondingly lower N loads to surface waters. Agricultural intensity is also a main driver of the higher N excess in Danish waters, due to higher agricultural and husbandry pressures (Table 2). In theory, Danish conditions could lead to additional denitrification, which would reduce the level of nitrate leaching into water. However, since this is not the case, agricultural systems are probably the main factors that are determining N losses.
Where the soil-water system is defined by fast-flow processes in an oxic groundwater zone, there is a risk that a large part of the N surplus may be discharged to surface waters [45]. Nitrogen loads in streams are also influenced by manure and fertilizer use, runoff and soil type [3,54,55]. These may be enhanced by the discharge of poorly treated wastewaters and/or effluents from different sources, and the level of sophistication of the process in the WWTP may affect water quality, too.

3.4. Nitrogen Management and Policies Implemented

To analyze and compare the success or failure of the mitigation and abatement measures implemented by each country, the historical levels of N surplus (Figure 7) and TNC (Figure 8) were analyzed. Policy responses for each country were identified (Table 3).
The N surplus in Portugal and Denmark between 1995 and 2015 (where available) are shown in Figure 7. According to the Portuguese Administration [6], the N surplus varied between 15 and 30 kg N ha−1 over this period, but showed no obvious trend. The more or less constant, but low, N surplus in Portugal was apparently unaffected by the incorporation of European Directives into Portuguese law—i.e., the Nitrates Directive [56], the Water Framework Directive [57] and the Wastewater Treatment Directive [58] in 1997; the designation of NVZs in 1998, 2005 and 2010; and, the introduction of a common agricultural policy in 2003. It is likely that this occurred because the effect of these new regulations was masked by a higher level of incorporation of manure into the soil and an increase in the area of land used for vegetable cultivation and pasture over this period [59]. Despite the mandatory policy regulations in Portugal, best practices remain at the discretion of the farmers and are so dependent on the farmer’s ability to protect any streams that have an impact on the RBDs.
A decreasing trend is evident in Denmark, where a reduction from 157 kg N ha−1 in 1990 to 70 kg N ha−1 in 2015 has been achieved. This significant downward trend can be ascribed to the seven aquatic action plans that have been implemented in Denmark since 1985 (Table 3) [45].
Data from the Valada Tejo (19E/02) monitoring station [18], located on the downstream part of the Tagus River in Portugal, was selected to analyze the trend in TNC over the period 2002–2015. Total N concentrations decreased from 1.75 mg N L−1 to 1.1 mg N L−1, which is equivalent to a reduction of about 38% (Figure 8). A much steeper downward trend in average TNC over time was detected for monitored streams in Denmark (Figure 8) [19], with flow-weighted TNC decreasing from 7.5 mg N L−1 in 1990 to 4.3 mg N L−1 in 2015, i.e., a reduction of about 43% (Figure 8). It should be noted, however, that the starting point for TNC was higher in Danish waters than in Portuguese waters.
In Portugal and Denmark, TNC in water were affected differently by the implementation of N abatement policies that are shown in chronological order in Table 3. Higher precipitation occurring in Denmark, compared to Portugal, could have also contributed to a dilution effect, thus enhancing the reduction of TNC in Danish waters. However, it should be noted that the two time series are not exactly comparable because the Danish time series represents the whole country (120 monitoring stations), whereas the Valada Tejo station shows the trend at a single station, only. Also, 80% of the catchment that drains into this monitoring site is in Spain [44]. Nitrogen monitoring is clearly insufficient in Portugal, although the reason for this is unknown. As mentioned before, officially recorded N concentrations in streams do not necessarily show the presence or absence of a N surplus. Further downscaling of the data is needed to identify N hotspots [39].

3.5. Evaluation and Recommendations for Policy Making

Due to the maintenance and improvement of the Danish action plans, N losses are expected to decline even further. In Portugal, the introduction of several additional measures has been suggested to control N losses to water. These include expansion of the NVZs, a more extensive surveillance monitoring network that includes high-frequency measurements of water flow and chemical parameters at co-located gauging stations, and policies targeted at improving N use efficiency. Due to the very diverse nature of the agricultural systems throughout Portugal, a revision of ND measures is suggested for the existing NVZs, with the aim of producing targeted measures. The results from this study also highlight a need to ensure that farmers are complying with the ND related programs of measures.
Water quality matters for agricultural use, to some extent, but is more important where water is used for drinking purposes as it affects human health. Research on this topic has not had a sufficiently high influenced enough on policy making or implementation, due to the differences in countries or regions characteristic in terms of natural aspects but also regarding the sectors that drive N losses into water. Barriers that prevent science-based information to further influence EU policy making are mostly national and regional and relate to the lack of political will, of incentives to adoption and of implementation of command and control legislation [60]. Moreover, the lack of current understanding of the effects of the measures on the real water quality improvement, further complicates science contribution to policy making [61].

4. Conclusions and Future Perspectives

The carrying capacity of watercourses is often determined by site specific factors that cause variations in water quality responses to N inputs. Therefore, to protect water resources effectively, environmental policies need to be introduced that take into account many complex issues and address several economic and societal challenges. Moreover, the preventive approach is more cost-effective than remediation. For example, nitrate removal from contaminated drinking water is very costly, which is of great concern to water utility companies.
The DPSIR framework provides a strong framework for presenting water quality indicators to policy makers and raising awareness of the importance of considering environmental quality in the political choices made, now and in the future. A comparison of drivers, pressures, state, impacts, and responses in relation to N contamination of waterbodies showed that the implementation of policy measures promoted a significant reduction of N losses from land to water in Denmark, which resulted in a decrease of 25% in fertilizer use and a reduction of 53% in N surplus. In Portugal, the corresponding reductions were 39% for fertilizer use and 15 to 30 kg N ha−1 for the N surplus, with no significant trend. Average total N discharge to surface waters was calculated to be 7 kg ha−1 for mainland Portugal in 2015 and 14.6 kg ha−1 for Denmark in 2014. In both countries, the agricultural sector was found to be the main source of the N pressure on waterbodies.
Following the implementation of the Water Framework Directive in 2010, “less than good” water quality status was recorded in three out of eight RBDs in Portugal and in two out of four RBDs in Denmark. However, data suggest that the main differences in water quality status between the two countries is probably due to lower frequency of sampling for the determination of TNC, the less extensive monitoring network and the higher agriculture production intensity that is found in Denmark compared to Portugal.
Reduction in the levels of N in waterbodies was attributed to the historical implementation of policies aimed at reducing the N losses from land to water in both countries, but climatic factors such as precipitation can also have a role in reducing the N concentration in waters through a dilution effect. In Portugal, policies were the transposition of the ND and Waste Water Treatment Directives into law in 1997, the Water Framework Directive into the Water Law in 2005 (with successive modifications until 2012), and an action plan for NVZ designation, which now covers 4% of the Portuguese mainland. In Denmark, the observed reduction can be ascribed to the various “National Action Plans for the Aquatic Environment” that have been introduced since 1985. These have led to improved N use efficiency and reduced N pollution, culminating in the designation of the entire country as an NVZ.

Author Contributions

Conceptualization—C.M.d.S.C., A.G.B.; investigation—S.C.; writing—original draft preparation—S.C., R.P., J.R.P., H.T., C.M.d.S.C., A.G.B., M.R.C.; data collection and figures—G.G.; data correction and figures—S.C.; writing—review and editing—C.M.d.S.C., A.G.B., B.K., L.M.

Funding

This research was funded by NitroPortugal, H2020-TWINN-2015, EU coordination and support action n. 692331 and the FCT, UID/AGR/04129/2013.

Acknowledgments

The authors acknowledge the NitroPortugal, H2020-TWINN-2015, EU coordination and support action n. 692331 and the FCT, UID/AGR/04129/2013 for funding and the Portuguese Environmental Agency (APA) for data supply.

Conflicts of Interest

The authors declare no conflict of interest.

References

  1. Sutton, M.A.; Oenema, O.; Erisman, J.W.; Leip, A.; van Grinsven, H.; Winiwarter, W. Too much of a good thing. Nature 2011, 472, 159–161. [Google Scholar] [CrossRef] [Green Version]
  2. European Environment Agency (EEA). European Waters—Assessment of Status and Pressures; Report Nº8/2012; European Environment Agency: Copenhagen, Denmark, 2012; ISSN 1725-9177. [Google Scholar]
  3. Vagstad, N.; Stǻlnacke, P.; Andersen, H.E.; Deelstra, J.; Jansons, V.; Kyllmar, K.; Loigu, E.; Rekolainen, S.; Tumas, R. Regional variations in diffuse nitrogen losses from agriculture in the Nordic and Baltic regions. Hydrol. Earth Syst. Sci. 2004, 8, 651–662. [Google Scholar] [CrossRef]
  4. Di, H.J.; Cameron, K.C. Nitrate leaching in temperate agrosystems: Sources, factors and mitigation strategies. Nutr. Cycl. Agroecosyst. 2002, 46, 237–256. [Google Scholar] [CrossRef]
  5. Oenema, O.; Oudendag, D.; Velthof, G.L. Nutrient losses from manure management in the European Union. Livest. Sci. 2007, 112, 261–272. [Google Scholar] [CrossRef]
  6. Agência Portuguesa do Ambiente (APA). Planos de Gestão das Bacias Hidrográficas Portuguesas (RH 1-8); Agência Portuguesa do Ambiente: Lisbon, Portugal, 2015. (In Portuguese) [Google Scholar]
  7. Jensen, P.N.; Boutrup, S.; Fredshavn, J.R.; Svendsen, L.M.; Blicher-Mathiesen, G.; Wiberg-Larsen, P.; Johansson, L.S.; Hansen, J.W.; Nygaard, B.; Søgaard, B. NOVANA. Tilstand og Udvikling—Faglig Sammenfatning; Videnskabelig Rapport fra DCE—Nationalt Center for Miljø og Energi nr. 170. Scientific report no. 170; Aarhus University, DCE—National Center for Environment and Energy: Aarhus, Denmark, 2015; p. 96. (In Danish) [Google Scholar]
  8. Corine Land Cover (CLC). Version 18.5.1. 2006. Available online: http://land.copernicus.eu/pan-european/corine-land-cover/clc-2006/view (accessed on 15 July 2016).
  9. Bos, J.; Smit, A.; Schröder, J. Is agricultural intensification in The Netherlands running up to its limits? NJAS Wagening. J. Life Sci. 2013, 66, 65–73. [Google Scholar] [CrossRef] [Green Version]
  10. Kronvang, B.; Ærtebjerg, G.; Grant, R.; Kristensen, P.; Hovmand, M.; Kirkegaard, J. Nationwide monitoring of nutrients and their ecological effects. State of the Danish Aquatic Environment. Ambio 1993, 22, 176–187. [Google Scholar]
  11. Martins, G.; Ribeiro, D.; Pacheco, D.; Cruz, J.V.; Cunha, R.; Gonçalves, V.; Nogueira, R.; Brito, A.G. Prospective scenarios for water quality and ecological status in Lake Sete Cidades (Portugal): The integration of mathematical modelling in decision processes. Appl. Geochem. 2008, 23, 2171–2181. [Google Scholar] [CrossRef] [Green Version]
  12. Dalgaard, T.; Hansen, B.; Hasler, B.; Hertel, O.; Hutchings, N.L.; Jacobsen, B.H.; Jensen, L.S.; Kronvang, B.; Olesen, J.E.; Schjorring, J.K.; et al. Policies for agricultural nitrogen management—Trends, challenges and prospects for improved efficiency in Denmark. Environ. Res. Lett. 2014, 9, 115002. [Google Scholar] [CrossRef]
  13. Pagans, E.; Barrena, R.; Font, X.; Sánchez, A. Ammonia emissions from the composting of different organic wastes. Dependency on process temperature. Chemosphere 2006, 62, 1534–1542. [Google Scholar] [CrossRef] [PubMed] [Green Version]
  14. Burgos, P.; Madejón, E.; Cabrera, F. Nitrogen mineralization and nitrate leaching of a sandy soil amended with different organic wastes. Waste Manag. Res. 2006, 24, 175–182. [Google Scholar] [CrossRef]
  15. Direcção Geral do Territoório (DGT). Uso e Ocupação do Solo em Portugal Continental: Avaliação e Cenários Futuros; Projecto LANDYN; Direcção Geral do Território: Lisboa, Portugal, 2006; ISBN 978-989-98477-9-8EC.
  16. Kronvang, B.; Windolf, J.; Grant, R.; Andersen, H.E.; Thodsen, H.; Ovesen, N.B.; Larsen, S.E. Linking monitoring and modelling for river basin management: Danish experience with combating nutrient loadings to the aquatic environment from point and non-point sources. Sci. China Ser. E Technol. Sci. 2009, 52, 3335–3347. [Google Scholar] [CrossRef]
  17. Nielsen, K.; Stjernholm, M.; Olsen, B.Ø.; Muller-Wohlfeil, D.I.; Madsen, I.L.; Kjeldgaard, A.; Groom, G.; Hansen, H.S.; Rolev, A.M.; Hermansen, B.; et al. Areal Informations Systemet; Aarhus Universitet: Aarhus, Denmark, 2000; Volume 200. (In Danish) [Google Scholar]
  18. Sistema Nacional de Informação de Recursos Hídricos (SNIRH). 2016. Available online: http://snirh.apambiente.pt/index.php?idMain= (accessed on 22 December 2016).
  19. Wiberg-Larsen, P.; Windolf, J.; Bøgestrand, J.; Larsen, S.E.; Tornbjerg, H.; Ovesen, N.B.; Niel-sen, A.; Kronvang, B.; Kjeldgaard, A. Vandløb. NOVANA; Scientific report no. 165; Aarhus University, DCE—National Center for Environment and Energy: Aarhus, Denmark, 2015; p. 54. [Google Scholar]
  20. Windolf, J.; Thodsen, H.; Troldborg, L.; Larsen, S.E.; Bogestrand, J.; Ovesen, N.B.; Kronvang, B. A distributed modelling system for simulation of monthly runoff and nitrogen sources, loads and sinks for ungauged catchments in Denmark. J. Environ. Monit. 2011, 13, 2645–2658. [Google Scholar] [CrossRef]
  21. Kristensen, E.A.; Jepsen, N.; Nielsen, J.; Pedersen, S.; Koed, A. Dansk Fiskeindeks for Vandløb (DFFV); Scientific report no. 95; Aarhus University, DCE—National Center for Environment and Energy: Aarhus, Denmark, 2014; p. 58. (In Danish) [Google Scholar]
  22. Baattrup-Pedersen, A.; Larsen, S.E. Udvikling af Planteindeks til Brug i Danske Vandløb. Vurdering af Økologisk Tilstand (fase I); Scientific report no. 60; Aarhus University, DCE—National Center for Environment and Energy: Aarhus, Denmark, 2013; p. 32. (In Danish) [Google Scholar]
  23. European Environment Agency (EEA). DPSIR Framework (Driving Forces, Pressure, State, Impact, Response). 2018. Available online: https://www.eea.europa.eu/publications/TEC25 (accessed on 6 April 2016).
  24. Eurostat Statistics Explained. Agri-Environmental Indicator—Mineral Fertilizer Consumption. 2012. Available online: http://ec.europa.eu/eurostat/statistics-explained/index.php/Agri-environmental_indicator_-_mineral_fertiliser_consumption (accessed on 9 July 2016).
  25. Eurostat Statistics Explained. Agri-Environmental Indicator—Consumption of Pesticides. 2012. Available online: http://ec.europa.eu/eurostat/statistics-explained/index.php/Agri-environmental_indicator_-_consumption_of_pesticides (accessed on 9 July 2016).
  26. Eurostat Statistics Explained. Agri-Environmental Indicator—Cropping Patterns. 2012. Available online: http://ec.europa.eu/eurostat/statistics-explained/index.php/Agri-environmental_indicator_-_cropping_patterns (accessed on 9 July 2016).
  27. Eurostat Statistics Explained. Agri-Environmental Indicator—Livestock Patterns. 2012. Available online: http://ec.europa.eu/eurostat/statistics-explained/index.php/Agri-environmental_indicator_-_livestock_patterns (accessed on 9 July 2016).
  28. Eurostat Statistics Explained. Agri-Environmental Indicator—Gross Nitrogen Balance. 2012. Available online: http://appsso.eurostat.ec.europa.eu/nui/submitViewTableAction.do (accessed on 9 July 2016).
  29. Eurostat Statistics Explained. Agri-Environmental Indicator—Ammonia Emissions. 2012. Available online: http://ec.europa.eu/eurostat/statistics-explained/index.php/Agri-environmental_indicator_-_ammonia_emissions (accessed on 9 July 2016).
  30. Eurostat Statistics Explained. Agri-Environmental Indicator—Irrigation. 2016. Available online: http://ec.europa.eu/eurostat/statistics-explained/index.php/Agri-environmental_indicator_-_irrigation (accessed on 9 July 2016).
  31. Base de dados de Portugal Continental (PORDATA). População Residente Total. 2016. Available online: https://www.pordata.pt/DB/Europa/Ambiente+de+Consulta/Tabela (accessed on 9 July 2016). (In Portuguese).
  32. Danish Statistics. Danmarks Miljøportal. 2016. Available online: https://www.dst.dk/da/Statistik/emner/landbrug-gartneri-og-skovbrug/afgroeder; http://www.miljoeportal.dk/borger/Sider/Borger.aspx (accessed on 20 December 2016).
  33. European Environment Agency (EEA). Nitrates Directive. 2010. Available online: http://ec.europa.eu/environment/pubs/pdf/factsheets/nitrates.pdf (accessed on 9 July 2016).
  34. European Environment Agency (EEA). Nitrate Vulnerable Zones. 2009. Available online: http://eea.europa.eu/data-and-maps/figures/nitrate-vullnerable-zones-eu (accessed on 9 August 2016).
  35. Ordinance nº 259/2012. Portaria nº 259/218 de 28 de Agosto. Diário da República nº 166—I Série; Ministério da Agricultura, do Mar, do Ambiente e do Ordenamento do Território: Lisboa, Portugal, 2012. (In Portuguese)
  36. Eurostat Statistics Explained. Nitrate Vulnerable ZonesEu-27. 2010. Available online: http://ec.europa.eu/eurostat/statisticsexplained/index.php?title=File:Nitrate_Vulnerable_Zones_(NVZ),_EU-27,_2009.png&oldid=274885 (accessed on 2 December 2016).
  37. Nature Agency. Point Sources 2014; Danish Ministry of Environment and Food: Copenhagen, Denmark, 2015; Volume 135. (In Danish)
  38. European Environment Agency (EEA). Changes in Wastewater Treatment in Regions of Europe between 1990 and 2012. 2013. Available online: http://www.eea.europa.eu/data-and-maps/figures/changes-in-wastewater-treatment-in-regions-of-europe-between-1990-and-2 (accessed on 2 December 2016).
  39. Cameira, M.R.; Rolim, J.; Valente, F.; Faro, A.; Dragosits, U.; Cordovil, C.M.d.S. Spatial distribution and uncertainties of nitrogen budgets for agriculture in the Tagus river basin in Portugal—Implications for effectiveness of mitigation measures. Land Use Policy 2019, 84, 278–293. [Google Scholar] [CrossRef]
  40. Blicher-Mathiesen, G.; Rasmussen, A.; Rolighed, J.; Andersen, H.E.; Jensen, P.G.; Wienke, J.; Hansen, B.; Thorling, L. Landovervågningsoplande. NOVANA; Scientific report no. 164; Aarhus University, DCE—National Center for Environment and Energy: Aarhus, Denmark, 2015; p. 150. [Google Scholar]
  41. Associação Nacional dos Produtores de Milho e Sorgo (Anpromis). 2014. Available online: http://www.anpromis.pt/images/eventos/FeiraMilho/anpromis2014.pdf (accessed on 9 July 2016). (In Portuguese).
  42. INE (Instituto Nacional de Estatística). Estatísticas Agrícolas 2015; INE: Lisboa, Portugal, 2016; pp. 7–60. ISBN 978-989-25-0360-78. (In Portuguese)
  43. Cameira, M.R.; Pereira, A.; Ahuja, L.; Ma, L. Sustainability and environmental assessment of fertigation in an intensive olive grove under Maditerranean conditions. Agric. Water Manag. 2014, 146, 346–360. [Google Scholar] [CrossRef]
  44. Cordovil, C.M.d.S.; Cruz, S.; Brito, A.G.; Cameira, M.R.; Poulsen, J.R.; Thodsen, H.; Kronvang, B. A simplified nitrogen assessment in Tagus river basin: A management focused review. Water 2018, 10, 406. [Google Scholar] [CrossRef]
  45. Windolf, J.; Blicher-Mathiesen, G.; Carstensen, J.; Kronvang, B. Changes in nitrogen loads to estuaries following implementation of governmental action plans in Denmark: A paired catchment and estuary approach for analysing regional responses. Environ. Sci. Policy 2012, 24, 24–33. [Google Scholar] [CrossRef]
  46. Ribeiro, D.; Martins, G.; Nogueira, R.; Brito, A.G. Mineral cycling and pH gradient related with biological activity under transient anoxic-oxic conditions: Effect on P mobility in volcanic lake sediments. Environ. Sci. Tech. 2014, 48, 9205–9210. [Google Scholar] [CrossRef]
  47. Diogo, P. Fontes de Fósforo Total e o Estado Trófico de Albufeiras em Portugal Continental; Dissertação apresentada para a obtenção do grau de Mestre em Engenharia do Ambiente, perfil de Gestão de Sistemas Ambientais; Faculdade Ciências e Tecnologia da Universidade Nova de Lisboa: Almada, Portugal, 2008. (In Portuguese) [Google Scholar]
  48. Jeppesen, E.; Søndergaard, M.; Jensen, J.P.; Havens, K.E.; Anneville, O.; Carvalho, L.; Coveney, M.F.; Deneke, R.; Dokulil, M.T.; Foy, B.; et al. Lake responses to reduced nutrient loading—An analysis of contemporary long-term data from 35 case studies. Freshw. Biol. 2005, 50, 1747–1771. [Google Scholar] [CrossRef]
  49. Kronvang, B.; Jeppesen, E.; Conley, D.; Søndergaard, M.; Larsen, S.E.; Ovesen, N.B.; Carstensen, J. An analysis of pressure, state and ecological impacts of nutrients in Danish streams, lakes and coastal waters and ecosystem responses to nutrient pollution reductions. J. Hydrol. 2005, 304, 274–288. [Google Scholar] [CrossRef]
  50. Kronvang, B.; Audet, J.; Baattrup-Pedersen, A.; Jensen, H.S.; Larsen, S.E. Phosphorus Load to Surface Water from Bank Erosion in a Danish Lowland River Basin. J. Environ. Qual. 2012, 41, 304–313. [Google Scholar] [CrossRef] [Green Version]
  51. European Environment Agency (EEA). Water quality and pollution by nutrients; European Environment Agency: Copenhagen, Denmark, 2018. [Google Scholar]
  52. Caetano, M.; Raimundo, J.; Nogueira, M.; Santos, M.; Mil-Homens, M.; Prego, R.; Vale, C. Defining benchmark values for nutrients under the Water Framework Directive: Appli-cation in twelve Portuguese estuaries. Mar. Chem. 2016, 185, 27–37. [Google Scholar] [CrossRef]
  53. Vasconcelos, R.P.; Reis-Santos, P.; Fonseca, V.; Maia, A.; Ruano, M.; França, S.; Vinagre, C.; Costa, M.J.; Cabral, H. Assessing anthropogenic pressures on estuarine fish nurseries along the Portuguese coast: A multi-metric index and conceptual approach. Sci. Total Environ. 2007, 374, 199–215. [Google Scholar] [CrossRef]
  54. Whitall, D.; Bricker, S.; Ferreira, J.; Nobre, A.M.; Simas, T.; Silva, M. Assessment of eutrophication in estuaries: Pressure-State-Response and nitrogen source apportionment. Environ. Manag. 2007, 40, 678–690. [Google Scholar] [CrossRef] [PubMed]
  55. Andersen, H.E.; Kronvang, B.; Larsen, S.E.; Hoffman, C.C.; Jensen, T.S.; Rasmussen, E.K. Climate-change impacts on hydrology and nutrients in a Danish lowland river basin. Sci. Total Environ. 2006, 365, 223–237. [Google Scholar] [CrossRef] [PubMed]
  56. Decree-Law 235/97. Decreto-Lei nº 235/97 de 3 de Setembro; Diário da República, I Série-A—Nº203—3 de Setembro; Ministério do Ambiente: Lisbon, Portugal, 1997. (In Portuguese)
  57. European Commission (EC). Report from the Commission to the European Parliament and the Council on the Implementation of the Water Framework Directive (WFD); (2000/60/EC)—River Basin Management Plans. 2012. Available online: http://eur-lex.europa.eu/LexUriServ/LexUriServ.do?uri=COM:2012:0670:FIN:EN:PDF (accessed on 19 June 2016).
  58. Decree-Law 152/97. Decreto-Lei nº 152/97 de 19 de Junho; Diário da República, I Série A—Nº139—19 de Junho; Ministério do Ambiente: Lisbon, Portugal, 1997. (In Portuguese)
  59. Sistema Nacional de Informação de Ambiente (SNIAmb). Relatório de Estado do Ambiente. 2016. Available online: http://sniamb.apambiente.pt/infos/geoportaldocs/REA/REA2016/REA2016.pdf (accessed on 19 June 2016). (In Portuguese).
  60. Glavan, M.; Zeleznikar, S.; Velthof, G.; Boekhold, S.; Langaas, S.; Pintar, M. How to Enhance the Role of Science in European Union Policy Making and Implementation: The Case of Agricultural Impacts on Drinking Water Quality. Water 2019, 11, 492. [Google Scholar] [CrossRef]
  61. Wuijts, S.; Driessen, P.P.J.; Van Rijswick, H.F.M.W. Towards More Effective Water Quality Governance: A review of Social-Economic, Legal and Ecological Perspectives and Their Interactions. Sustainability 2018, 10, 914. [Google Scholar] [CrossRef]
Figure 1. Location of Portugal (PT) and Denmark (DK) in Europe.
Water 11 01114 g001
Figure 2. Total N loads from agriculture (left), livestock (center) and urban (right) sources to surface waters in 2015 (kg ha−1 y−1) in mainland Portugal in Datum 73/UTM 29N. Designated Nitrate Vulnerable Zones (NVZ) (red closed lines) and Sensitive Zones (SZ) (shaded in black) are also shown. River Basin Districts (RBD) (1 to 8) are display on the agricultural pressures map (left) limited by grey lines: RBD1—Minho e Lima rivers (NVZ1); RBD2—Cávado, Ave e Leça rivers; RBD3—Douro river; RBD4—Vouga, Mondego and Lis rivers (NVZ2); RBD5—Tagus river (NVZ5 and NVZ7); RBD6—Sado e Mira (NVZ4); RBD7—Guadiana (NVZ6); RBD8—Algarve rivers (NVZ3 and NVZ8) [6,18,35].
Water 11 01114 g002
Figure 3. Average annual point source discharges of TN (kg ha−1) in 2010 to 2015 (left) and level of N leaching from land to water in 2010 (right), for Denmark [7,19,32,37].
Water 11 01114 g003
Figure 4. Total Nitrogen loads (kg ha−1) from Danish catchments to coastal waters in 2015. [7,19,32].
Water 11 01114 g004
Figure 5. Average concentration of TNC (mg N L−1) in surface water in Portugal (left) and Denmark (right), 2010–2015 [18,32].
Water 11 01114 g005
Figure 6. Overall status of (a) rivers, (b) lakes/reservoirs and (c) coastal/transitional waters in the 8 Portuguese and 4 Danish River Basin Districts (RBD/DK). Values above columns refer to the length of rivers (km), number of lakes/reservoirs and coastal/transitional waters for (a), (b) and (c), respectively [6,32].
Water 11 01114 g006
Figure 7. Comparison of historical levels of nitrogen (N) surplus in Denmark (1990–2015) and Portugal (1990–2015) [6,39,40].
Water 11 01114 g007
Figure 8. Historical concentrations of TNC based on data from the Valada Tejo (19E/02) monitoring station in Portugal (2002–2015) and on Danish flow-weighted total N concentrations between (1990–2015) [18,19].
Water 11 01114 g008
Table 1. Summary of features and water sampling criteria for Portuguese (RBD1–RBD8) and Danish (DK1–DK4) River Basin Districts (RBD) for the 2010–2015 WFD planning cycle [6,18,19].
RBD and DKRBD Area (km2)Quantity and Length of Waterbodies MonitoredNº of TNC** Samples Station−1 y−1 (Average 2010–2015)Nº of Stations for TNL* Calculations
Number of Transitional/Coastal ZonesNº of Lakes/ReservoirsLength of Streams/Rivers (km)
RBD12465726281.80
RBD23584578501.70
RBD319,21841556781.70
RBD412,14414640701.90
RBD530,502102075031.70
RBD612,149121025800.80
RBD711,611518360610
RBD855111059772.10
DK132,0008459514,15715186
DK293103321724432071
DK3588211368201
DK41100033411404
*TNL—total nitrogen load/discharged from the different N pressures on land to the waterbodies; **TNC—total nitrogen concentration in waterbodies.
Table 2. Trends of driving forces, pressures, state, impacts, and responses of Portuguese and Danish nitrogen (N) losses from land to water [23].
IndicatorPortugal (PT)Denmark (DK)EU
Driving Forces *Fertilizer consumptionMineral fertilizer used by agriculture (2000–2010)170 × 106 kg (2000)
103 × 106 kg (2010) [24]
39% ↓252 × 106 kg (2000)
190 × 106 (2010) [24]
25% ↓10.03 × 10⁹ kg (2000)
7.85 × 10⁹ kg (2010) [24]
22% ↓
Land useAgricultural area (2005–2010)3.68 × 10⁶ ha (2005)
3.67 × 10⁶ ha (2010) [25]
0.3% ↓2.7 × 10⁶ ha (2005)
2.6 × 10⁶ ha (2010) [25]
2.3% ↓1.76 × 10⁸ ha (2005)
1.74 × 10⁸ ha (2010) [25]
1% ↓
Arable landArable area (2005–2010)1.24 × 10⁶ ha (2005)
1.17 × 10⁶ ha (2010) [26,30]
6% ↓2.50 × 10⁶ ha (2005)
2.42 × 10⁶ ha (2010) [26,30]
3% ↓1.04 × 10⁸ ha (2005)
1.03 × 10⁸ ha (2010) [26,30]
1.4% ↓
Livestock patternsLivestock Unit (LSU) (2005–2010)2.07 × 10⁶ LSU (2005)
2.21 × 10⁶ LSU (2010) [27]
7% ↑4.57 × 10⁶ LSU (2005)
4.92 × 10⁶ LSU (2010) [27]
8% ↑1.37 × 10⁸ LSU (2005)
1.34 × 10⁸ LSU (2010) [27]
1.9% ↓
PopulationTotal population (2005–2017)10,562 × 103 persons (2005)
10,320 × 103 persons (2017) [31]
2.3% ↓5419 × 103 persons (2005)
5 764 × 103 persons (2017) [31]
6.4% ↑495,517 × 103 persons (2005)
511,876 × 103 persons (2017) [31]
3.3% ↑
Pressures *Nitrogen lossGross N balance (2005–2014)45 kg N ha−1 (2005)
43 kg N ha−1 (2014) [28]
4.4% ↓87 kg N ha−1 (2005)
79 kg N ha−1 (2014) [28]
9% ↓54 kg N ha−1 (2005)
51 kg N ha−1 (2013) [28]
5.6% ↓
Ammonia (NH3) emissionsNH3 emissions from agriculture (1990–2010)51 × 106 kg NH3 (1990)
43 × 106 kg NH3 (2010) [29]
16.7% ↓113 × 106 kg NH3 (1990)
72 × 106 kg NH3 (2010) [29]
36.7 ↓4.79 × 10⁹ kg NH3 (1990)
3.36 × 10⁹ kg NH3 (2010) [29]
29.8 ↓
StateWater qualityAverage TNL from land to water
(PT: 2015; DK: 2014)
7 kg N ha−1 to surface waters [6]-14.6 kg N ha−1 to marine waters [7,19]---
Total TNL WWTP to water (2015)21.5 (t N y−1) [6]-3.48 (t N y−1) [7,19]---
ImpactsEutrophicationN in eutrophic waterbodies and areas at risk of becoming eutrophic10 reservoirs
2 transitional waters [6]
-459 lakes, 82 transitional and coastal waters [7,19]---
ResponsesNitrates Directive
Nitrate Vulnerable Zones (NVZ)
Total NVZ area4011 km2 [6,35]-26,086 km2 [12]-1.7 × 10⁶ km2 [34,36]-
Percentage NVZs of total country/continent area4% [6,35]-100% [12]-40.9% [34,36]-
Wastewater treatment (WWTP)% without treatment1% [6]-0% [19,32,37]-N-0.9%, C-0.2%
S-2%, E-13.1% (recovered) [2,39]
-
% with secondary treatment74% [6]-2.1% [19,32,37]-N-2.3%, C-19.54%
S-32.8%, E-10.6% (recovered) [2,39]
-
% with tertiary treatment11% [6]-97.9% [19,32,37]-N-76.6%, C-77.36%
S-60.3%, E-51.5% (recovered) [2,39]
-
*Arrows in Driving forces and Pressures indicate the tendency for a specific indicator to increase ↑ or decrease ↓ between the years into brackets.
Table 3. Historical nitrogen abatement policies in Portugal and Denmark.
CountryYearPoliciesMain Recommendations
DK1986NPO ProgramBan on point source pollution from slurry tanks; Control at farm level; Limit application to 265/230 kg organic N for cattle and pig farms.
1987Action Plan for the Aquatic Environment49% reduction in NO3 leaching from agriculture by 1993; Code of good agriculture practice.
1989National Monitoring Program for the Aquatic EnvironmentAdvisory services to the EPA; Environmental research; Monitoring.
1991Action Plan for Sustainable AgricultureMandatory N standards for crops; Controlled use of N in organic manure; Ban on slurry application from harvest until 1st February.
1998Action Plan for the Aquatic Environment IICatch crops on 6% of land area; N standards set at least 10% below economic optimum; 170 kg N ha−1 for cattle and pig farms.
2004Action Plan for the Aquatic Environment III10 m buffer strips along rivers and lakes; 13% reduction of N leaching from agriculture by 2015.
2008Green Growth19 k tons reduction in emission of N to marine waters; 10 m buffer strips along watercourses; 140 k ha target for catch crops.
PT1997Transposition of Nitrates Directive into Portuguese law (Decree-Law 235/97)Designation of 3 NVZs; Code of good agricultural practice; Control of NO3 concentrations in surface and ground waters; Evaluation of eutrophication status of waters.
1997Transposition of Waste Water Treatment Directive into Portuguese law (Decree-Law 152/97)Designation of SZ and less sensitive zones; Regulation of N and P levels in waste waters discharge.
2002National Water Plan (Decree-Law 112/2002)Strategy for national water policy; Creation of river basin management plans.
2003Common Agriculture Policy
2005Water Law 58/2005Institutional framework for sustainable water management.
2007Decree 214/2007 and Order 8277/2007National strategy for livestock and agri-industrial effluents.
2009Ordinance 631/2009Rules for the management of livestock effluents.
2010Ordinance 164/2010Designation of 8 NVZs.
2012Ordinance 259/2012Action plan for the 8 NVZs in mainland.
2013Decree 81/2013New strategy for livestock activities; Management.

